Embed Size (px)
Citation preview
5. Precipitation Frequency Data Server 1
5. Precipitation Frequency Data Server 5.1. Introduction
NOAA Atlas 14 precipitation frequency estimates are delivered entirely in digital form. The
Precipitation Frequency Data Server (PFDS) provides a point-and-click web portal for precipitation frequency estimates and supplementary products.
In early 2011 a major redesign of the PFDS web pages was done to create an interactive interface. Since then, PFDS pages have been further adjusted to improve their usability and readability, to increase data download speeds and to provide additional information. In order to keep Section 5 of the documentation up-to-date for all volumes, it is offered as a separate document.
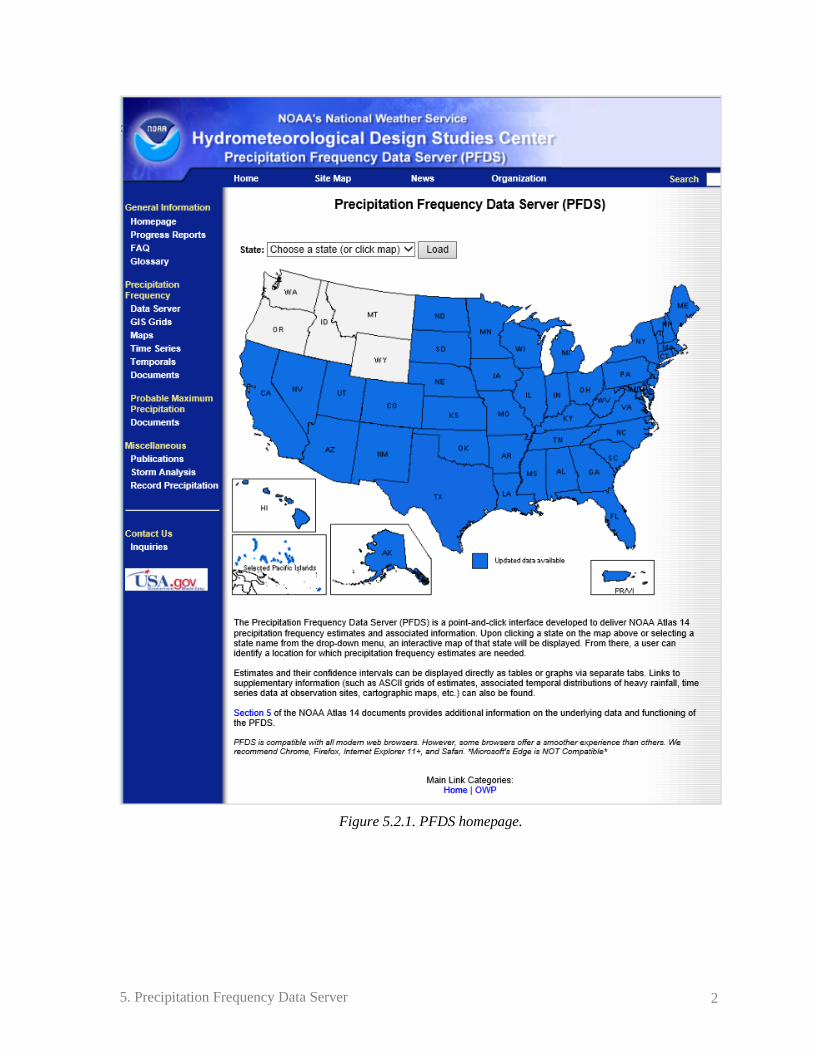
Various artifacts from Volume 10 will be used throughout this section to describe how to navigate through the PFDS pages for all NOAA Atlas 14 volumes. When applicable, differences among various volumes will be emphasized. 5.2. Products available on the Precipitation Frequency Data Server All NOAA Atlas 14 products and documents are available for download from the PFDS web pages. The PFDS homepage, shown in Figure 5.2.1, has a clickable map of the United States (with affiliated states and territories) and a side menu on the left with various links. When NOAA Atlas 14 products are only needed for a specific location, clicking on an appropriate state on the map or selecting the state name from the drop-down menu will cause an interactive map of that state and its surrounding area to be displayed (Figure 5.2.2), from which relevant information for a selected location can be obtained (see Section 5.2.1). The side menu under the “Precipitation Frequency” tag is used to download various NOAA Atlas 14 products applicable across the entire project area of each volume (Section 5.2.2). The underlying data for PFDS products are high-resolution grids of NOAA Atlas 14 precipitation frequency estimates and accompanying confidence limits (Section 5.3). Other links on the side menu under the “General Information”, “Probable Maximum Precipitation”, “Miscellaneous” and “Contact Us” tags provide access to additional products and information relevant to precipitation frequency estimates (Section 5.4). 5.2.1. Products applicable for a selected location
Clicking on an appropriate state on the map shown in Figure 5.2.1 or selecting the state name from the drop-down menu will cause an interactive map of that state and its surrounding area to be displayed (Figure 5.2.2). From there, a location for which estimates are needed can be selected by:
• manually entering latitude and longitude coordinates in decimal degrees (negative numbers should be entered for southern hemisphere latitudes and for western hemisphere longitudes);
• searching for a city name, street name, landmark, zip code, physical address, etc. through the street address search bar;
• dragging the red cursor to the selected location on the map; • double-clicking anywhere on the map.
For gaged locations, a selection can also be made by: • choosing a station name from a pull-down list; • clicking on an observing station on the map (after selecting “Show stations on map” and
zooming in).
5. Precipitation Frequency Data Server 2
Figure 5.2.1. PFDS homepage.
5. Precipitation Frequency Data Server 3
…
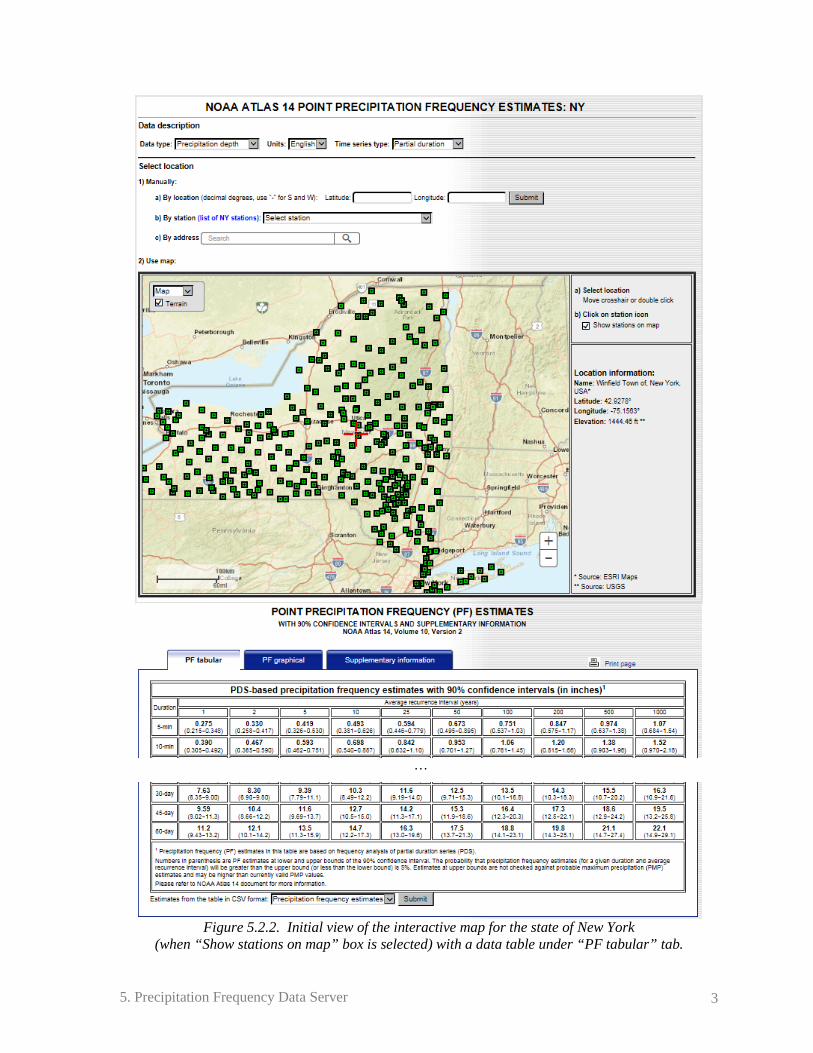
Figure 5.2.2. Initial view of the interactive map for the state of New York
(when “Show stations on map” box is selected) with a data table under “PF tabular” tab.
5. Precipitation Frequency Data Server 4
From the menu at the top of the page, a user can request PDS-based or AMS-based precipitation frequency estimates to be displayed as precipitation depths or intensities in English or SI (metric) units. By default, PDS-based precipitation frequency depths, in English units are shown. The PDS-based and AMS-based precipitation frequency estimates are almost identical for ARIs above 10 years (AEPs below 1/10), but notably different at smaller ARIs. Because the PDS can include more than one event in any particular year, the results from a PDS analysis are generally considered more reliable for designs based on frequent events.
After a location is selected, all precipitation frequency and confidence limits’ estimates are displayed directly below the map in three separate tabs: “PF tabular” (displayed by default), “PF graphical” and “Supplementary information”.
A printer-friendly version of the precipitation frequency estimates with some supplementary information can be obtained by selecting the “Print page” icon above the output display (as shown in Figure 5.2.2). The printed page will include metadata information about the selected point in the header, estimates in tabular and graphical forms, the date of download, and terrain, satellite and road maps for the location.
The “PF tabular” tab provides data tables of the precipitation frequency depths (or intensities) showing also the lower and upper bounds of the 90% confidence interval (in parenthesis; see Figure 5.2.2). Data tables can be downloaded as comma-separated values (csv format) from a link beneath the table. They can also be obtained through web scraping by generating the URL link with the following information: - latitude (in decimal degrees; negative number should be entered for southern hemisphere latitude), - longitude (in decimal degrees; negative number for western hemisphere longitude), - type of precipitation (“pf” for precipitation or “rf” for rainfall), - data type (“depth” or “intensity”), - time series type (“pds” or “ams”), - units of the estimates (“english” or “metric”). For example, if PDS-based estimates in inches are needed at 37.4000˚N, 119.2000˚W, the following links should be used to retrieve precipitation frequency estimates: http://hdsc.nws.noaa.gov/cgi-bin/hdsc/ new/fe_text_mean.csv? lat=37.4000&lon=-119.2000&data=depth&units=english&series=pds; upper 95% confidence limit estimates: http://hdsc.nws.noaa.gov/cgi-bin/hdsc/ new/fe_text_uppr.csv? lat=37.4000&lon=-119.2000&data=depth&units=english&series=pds; lower 95% confidence limit estimates: http://hdsc.nws.noaa.gov/cgi-bin/hdsc/ new/fe_text_lwr.csv? lat=37.4000&lon=-119.2000&data=depth&units=english&series=pds; all three variables: http://hdsc.nws.noaa.gov/cgi-bin/hdsc/ new/fe_text.csv? lat=37.4000&lon=-119.2000&data=depth&units=english&series=pds.
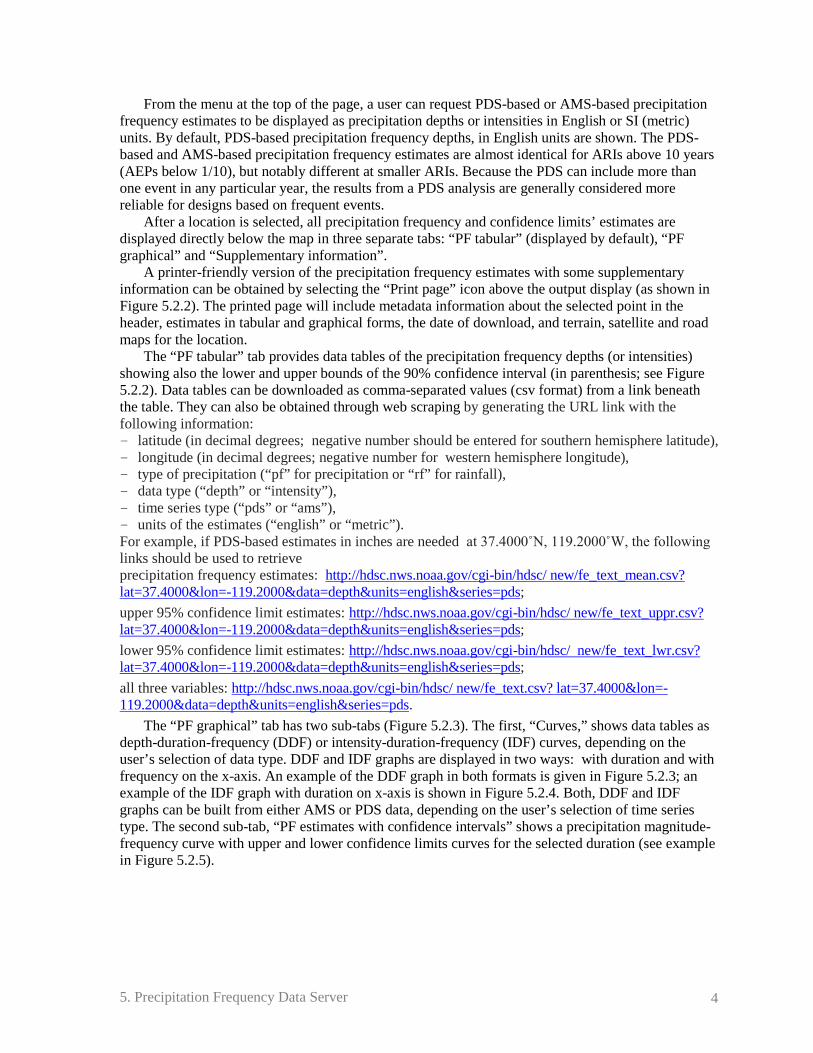
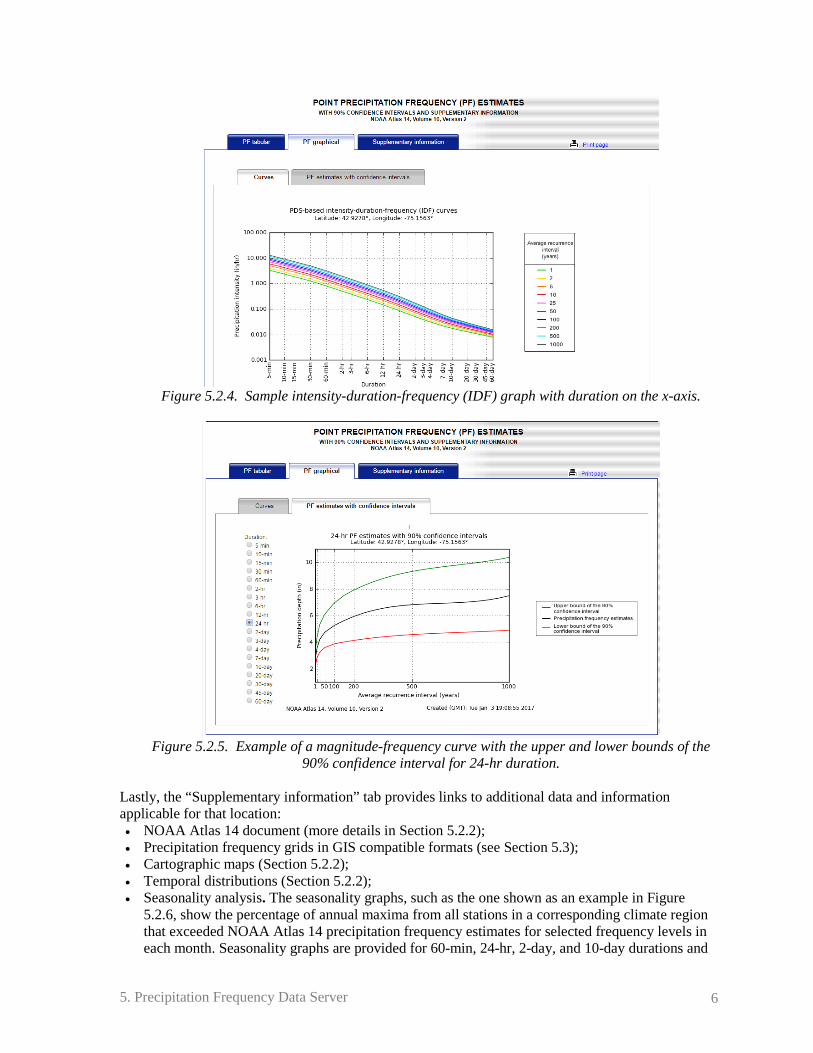
The “PF graphical” tab has two sub-tabs (Figure 5.2.3). The first, “Curves,” shows data tables as depth-duration-frequency (DDF) or intensity-duration-frequency (IDF) curves, depending on the user’s selection of data type. DDF and IDF graphs are displayed in two ways: with duration and with frequency on the x-axis. An example of the DDF graph in both formats is given in Figure 5.2.3; an example of the IDF graph with duration on x-axis is shown in Figure 5.2.4. Both, DDF and IDF graphs can be built from either AMS or PDS data, depending on the user’s selection of time series type. The second sub-tab, “PF estimates with confidence intervals” shows a precipitation magnitude-frequency curve with upper and lower confidence limits curves for the selected duration (see example in Figure 5.2.5).
5. Precipitation Frequency Data Server 5
Figure 5.2.3. Sample depth-duration-frequency curves built from the PDS data with
duration on the x-axis (top figure) and average recurrence interval on the x-axis (bottom figure).
5. Precipitation Frequency Data Server 6
Figure 5.2.4. Sample intensity-duration-frequency (IDF) graph with duration on the x-axis.
Figure 5.2.5. Example of a magnitude-frequency curve with the upper and lower bounds of the
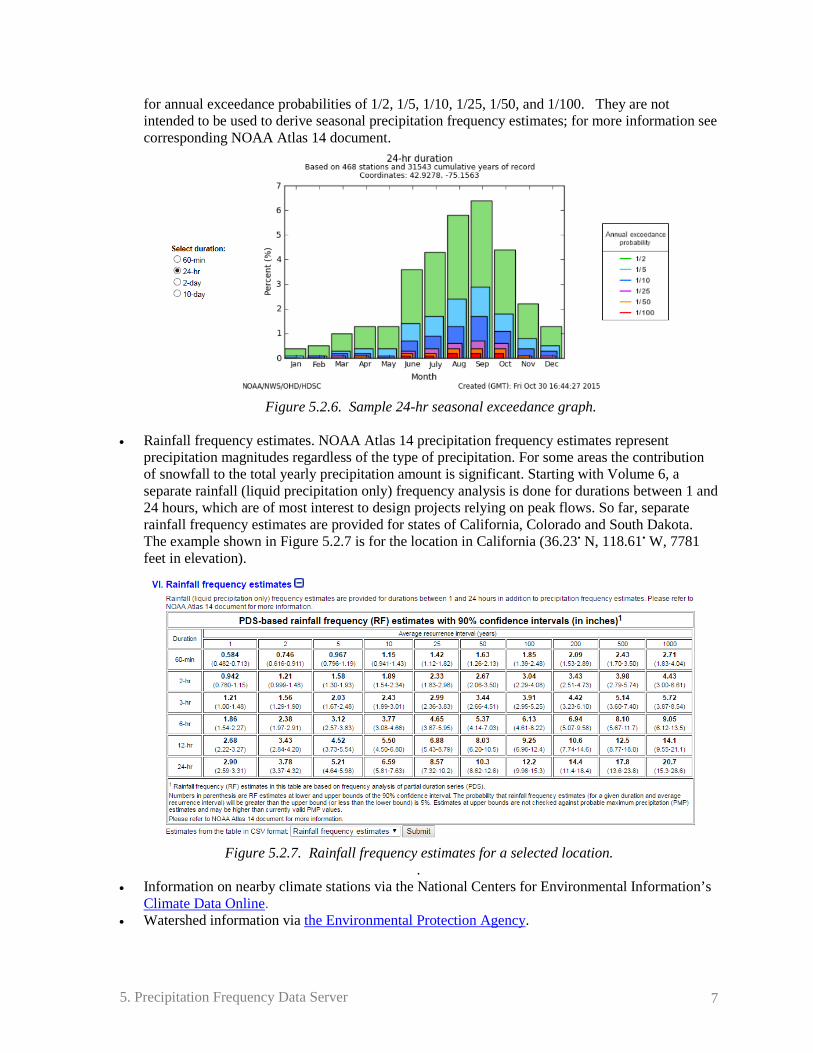
90% confidence interval for 24-hr duration. Lastly, the “Supplementary information” tab provides links to additional data and information applicable for that location: • NOAA Atlas 14 document (more details in Section 5.2.2); • Precipitation frequency grids in GIS compatible formats (see Section 5.3); • Cartographic maps (Section 5.2.2); • Temporal distributions (Section 5.2.2); • Seasonality analysis. The seasonality graphs, such as the one shown as an example in Figure
5.2.6, show the percentage of annual maxima from all stations in a corresponding climate region that exceeded NOAA Atlas 14 precipitation frequency estimates for selected frequency levels in each month. Seasonality graphs are provided for 60-min, 24-hr, 2-day, and 10-day durations and
5. Precipitation Frequency Data Server 7
for annual exceedance probabilities of 1/2, 1/5, 1/10, 1/25, 1/50, and 1/100. They are not intended to be used to derive seasonal precipitation frequency estimates; for more information see corresponding NOAA Atlas 14 document.
Figure 5.2.6. Sample 24-hr seasonal exceedance graph.
• Rainfall frequency estimates. NOAA Atlas 14 precipitation frequency estimates represent
precipitation magnitudes regardless of the type of precipitation. For some areas the contribution of snowfall to the total yearly precipitation amount is significant. Starting with Volume 6, a separate rainfall (liquid precipitation only) frequency analysis is done for durations between 1 and 24 hours, which are of most interest to design projects relying on peak flows. So far, separate rainfall frequency estimates are provided for states of California, Colorado and South Dakota. The example shown in Figure 5.2.7 is for the location in California (36.23• N, 118.61• W, 7781 feet in elevation).
Figure 5.2.7. Rainfall frequency estimates for a selected location.
. • Information on nearby climate stations via the National Centers for Environmental Information’s
Climate Data Online. • Watershed information via the Environmental Protection Agency.
5. Precipitation Frequency Data Server 8
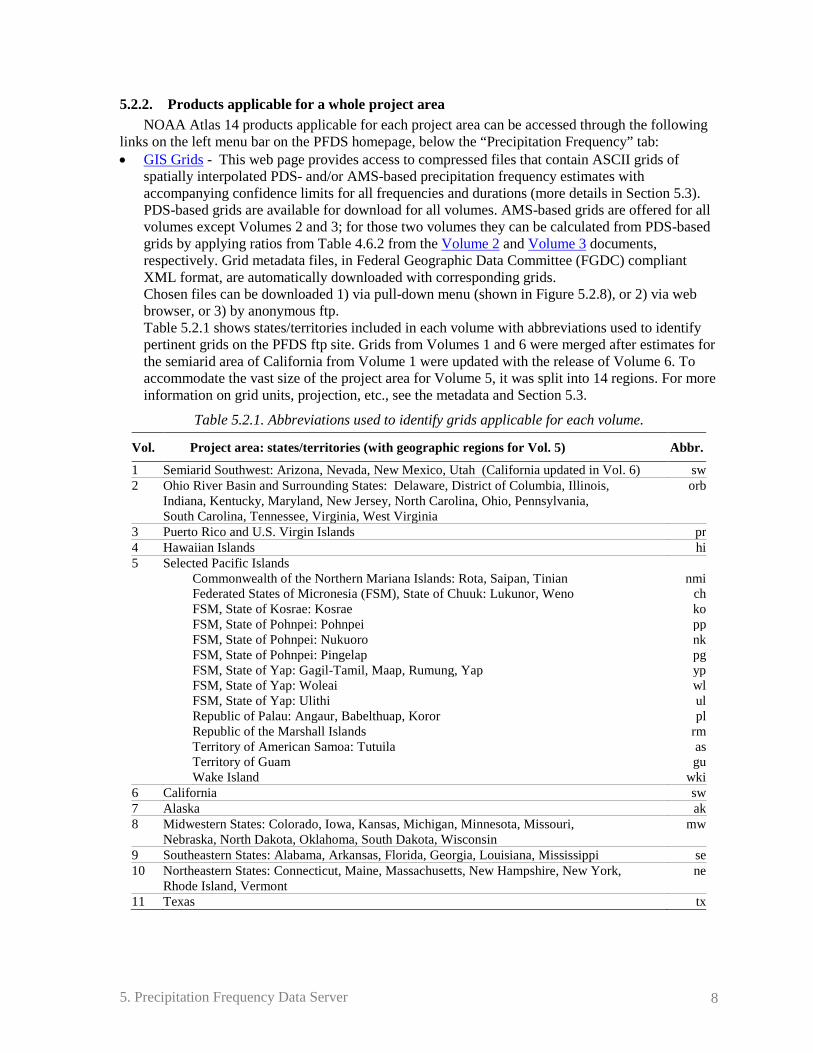
5.2.2. Products applicable for a whole project area NOAA Atlas 14 products applicable for each project area can be accessed through the following
links on the left menu bar on the PFDS homepage, below the “Precipitation Frequency” tab: • GIS Grids - This web page provides access to compressed files that contain ASCII grids of
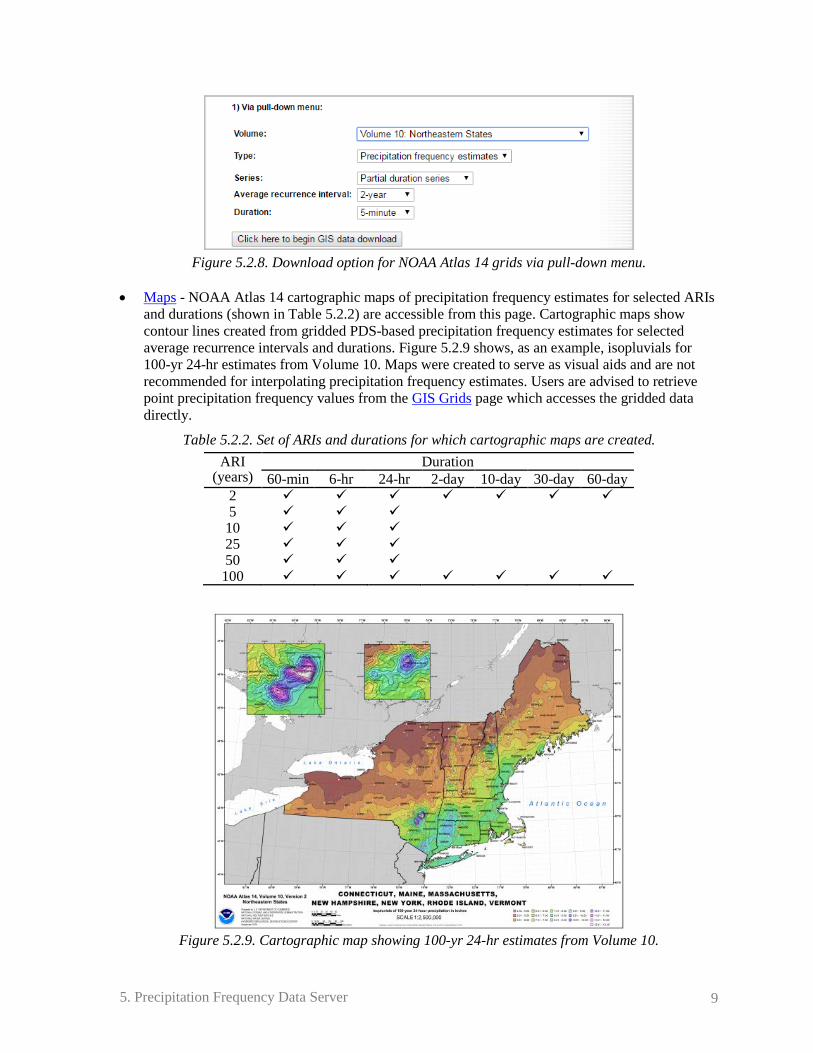
spatially interpolated PDS- and/or AMS-based precipitation frequency estimates with accompanying confidence limits for all frequencies and durations (more details in Section 5.3). PDS-based grids are available for download for all volumes. AMS-based grids are offered for all volumes except Volumes 2 and 3; for those two volumes they can be calculated from PDS-based grids by applying ratios from Table 4.6.2 from the Volume 2 and Volume 3 documents, respectively. Grid metadata files, in Federal Geographic Data Committee (FGDC) compliant XML format, are automatically downloaded with corresponding grids. Chosen files can be downloaded 1) via pull-down menu (shown in Figure 5.2.8), or 2) via web browser, or 3) by anonymous ftp. Table 5.2.1 shows states/territories included in each volume with abbreviations used to identify pertinent grids on the PFDS ftp site. Grids from Volumes 1 and 6 were merged after estimates for the semiarid area of California from Volume 1 were updated with the release of Volume 6. To accommodate the vast size of the project area for Volume 5, it was split into 14 regions. For more information on grid units, projection, etc., see the metadata and Section 5.3.
Table 5.2.1. Abbreviations used to identify grids applicable for each volume.
Vol. Project area: states/territories (with geographic regions for Vol. 5) Abbr.
1 Semiarid Southwest: Arizona, Nevada, New Mexico, Utah (California updated in Vol. 6) sw 2 Ohio River Basin and Surrounding States: Delaware, District of Columbia, Illinois,
Indiana, Kentucky, Maryland, New Jersey, North Carolina, Ohio, Pennsylvania, South Carolina, Tennessee, Virginia, West Virginia
orb
3 Puerto Rico and U.S. Virgin Islands pr 4 Hawaiian Islands hi 5 Selected Pacific Islands Commonwealth of the Northern Mariana Islands: Rota, Saipan, Tinian nmi
Federated States of Micronesia (FSM), State of Chuuk: Lukunor, Weno ch FSM, State of Kosrae: Kosrae ko FSM, State of Pohnpei: Pohnpei pp FSM, State of Pohnpei: Nukuoro nk FSM, State of Pohnpei: Pingelap pg FSM, State of Yap: Gagil-Tamil, Maap, Rumung, Yap yp FSM, State of Yap: Woleai wl FSM, State of Yap: Ulithi ul Republic of Palau: Angaur, Babelthuap, Koror pl Republic of the Marshall Islands rm Territory of American Samoa: Tutuila as Territory of Guam gu Wake Island wki
6 California sw 7 Alaska ak 8 Midwestern States: Colorado, Iowa, Kansas, Michigan, Minnesota, Missouri,
Nebraska, North Dakota, Oklahoma, South Dakota, Wisconsin mw
9 Southeastern States: Alabama, Arkansas, Florida, Georgia, Louisiana, Mississippi se 10 Northeastern States: Connecticut, Maine, Massachusetts, New Hampshire, New York,
Rhode Island, Vermont ne
11 Texas tx
5. Precipitation Frequency Data Server 9
Figure 5.2.8. Download option for NOAA Atlas 14 grids via pull-down menu.
• Maps - NOAA Atlas 14 cartographic maps of precipitation frequency estimates for selected ARIs
and durations (shown in Table 5.2.2) are accessible from this page. Cartographic maps show contour lines created from gridded PDS-based precipitation frequency estimates for selected average recurrence intervals and durations. Figure 5.2.9 shows, as an example, isopluvials for 100-yr 24-hr estimates from Volume 10. Maps were created to serve as visual aids and are not recommended for interpolating precipitation frequency estimates. Users are advised to retrieve point precipitation frequency values from the GIS Grids page which accesses the gridded data directly.
Table 5.2.2. Set of ARIs and durations for which cartographic maps are created. ARI
(years) Duration
60-min 6-hr 24-hr 2-day 10-day 30-day 60-day 2 5 10 25 50 100
Figure 5.2.9. Cartographic map showing 100-yr 24-hr estimates from Volume 10.
5. Precipitation Frequency Data Server 10
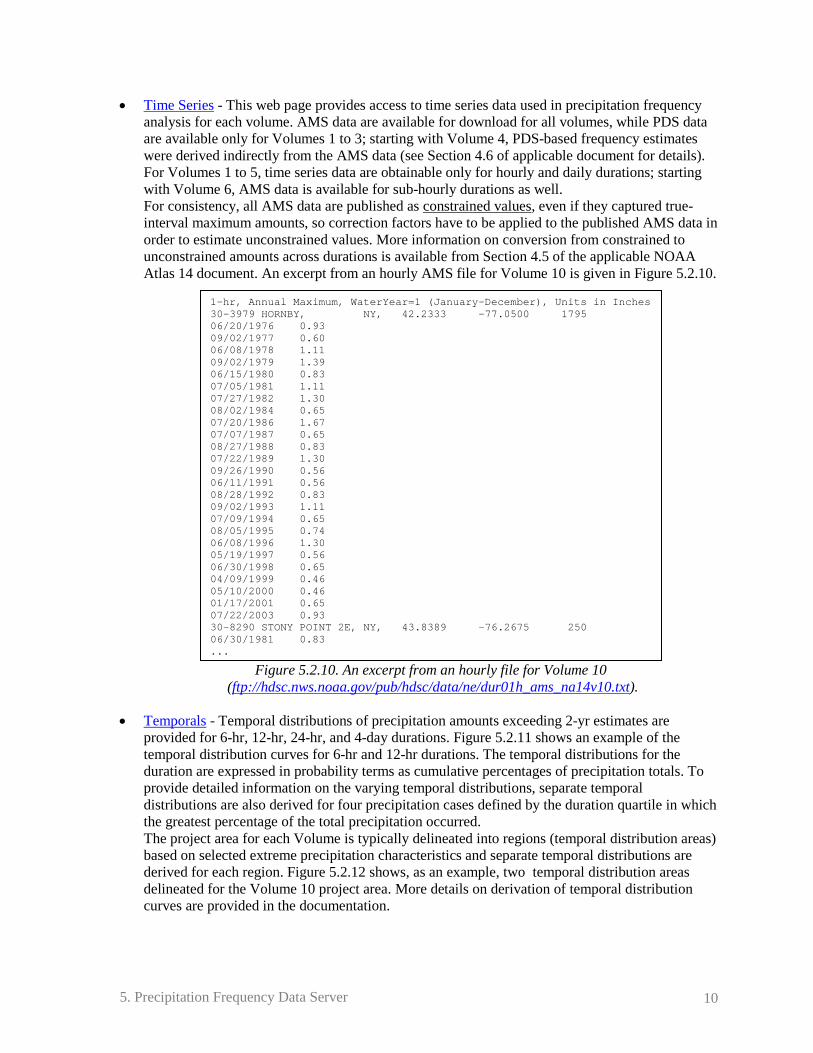
• Time Series - This web page provides access to time series data used in precipitation frequency analysis for each volume. AMS data are available for download for all volumes, while PDS data are available only for Volumes 1 to 3; starting with Volume 4, PDS-based frequency estimates were derived indirectly from the AMS data (see Section 4.6 of applicable document for details). For Volumes 1 to 5, time series data are obtainable only for hourly and daily durations; starting with Volume 6, AMS data is available for sub-hourly durations as well. For consistency, all AMS data are published as constrained values, even if they captured true-interval maximum amounts, so correction factors have to be applied to the published AMS data in order to estimate unconstrained values. More information on conversion from constrained to unconstrained amounts across durations is available from Section 4.5 of the applicable NOAA Atlas 14 document. An excerpt from an hourly AMS file for Volume 10 is given in Figure 5.2.10.
Figure 5.2.10. An excerpt from an hourly file for Volume 10
(ftp://hdsc.nws.noaa.gov/pub/hdsc/data/ne/dur01h_ams_na14v10.txt).
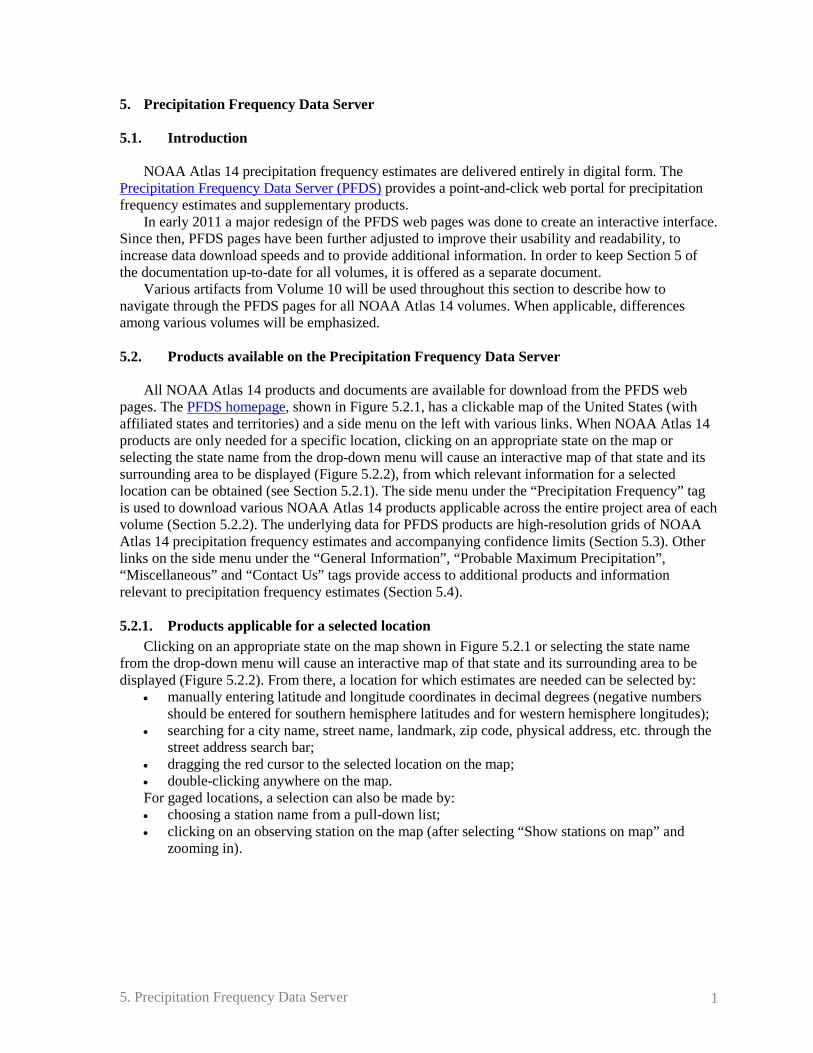
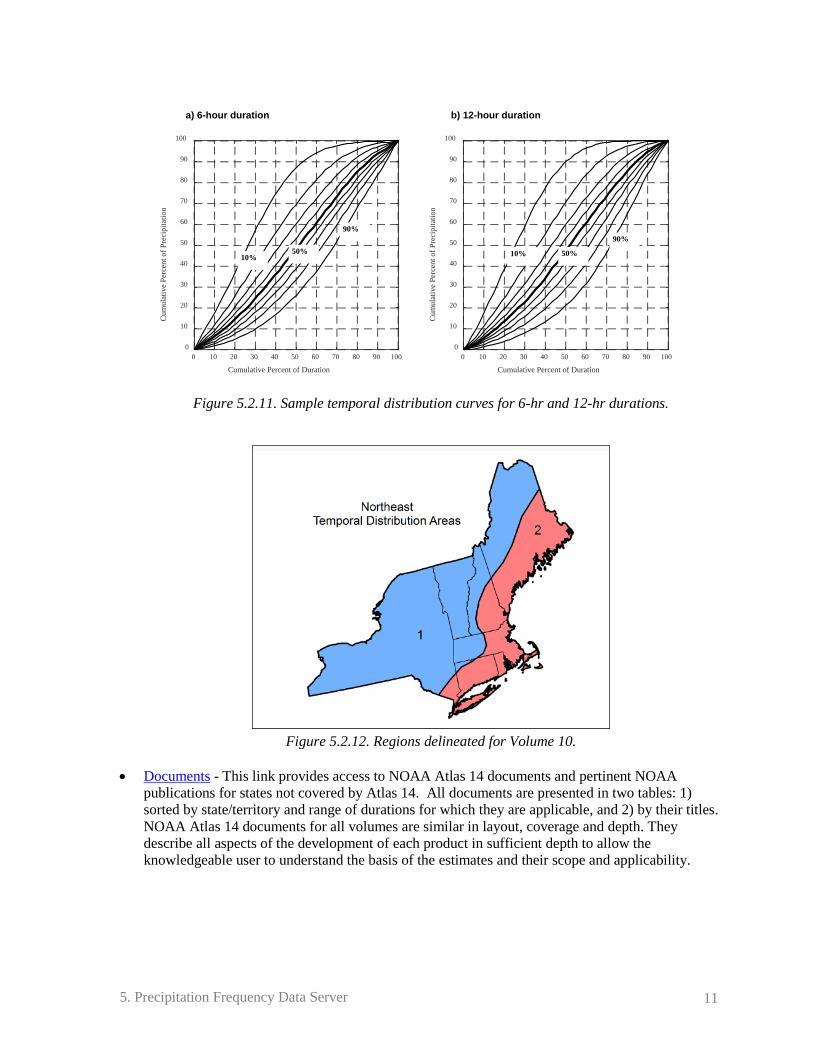
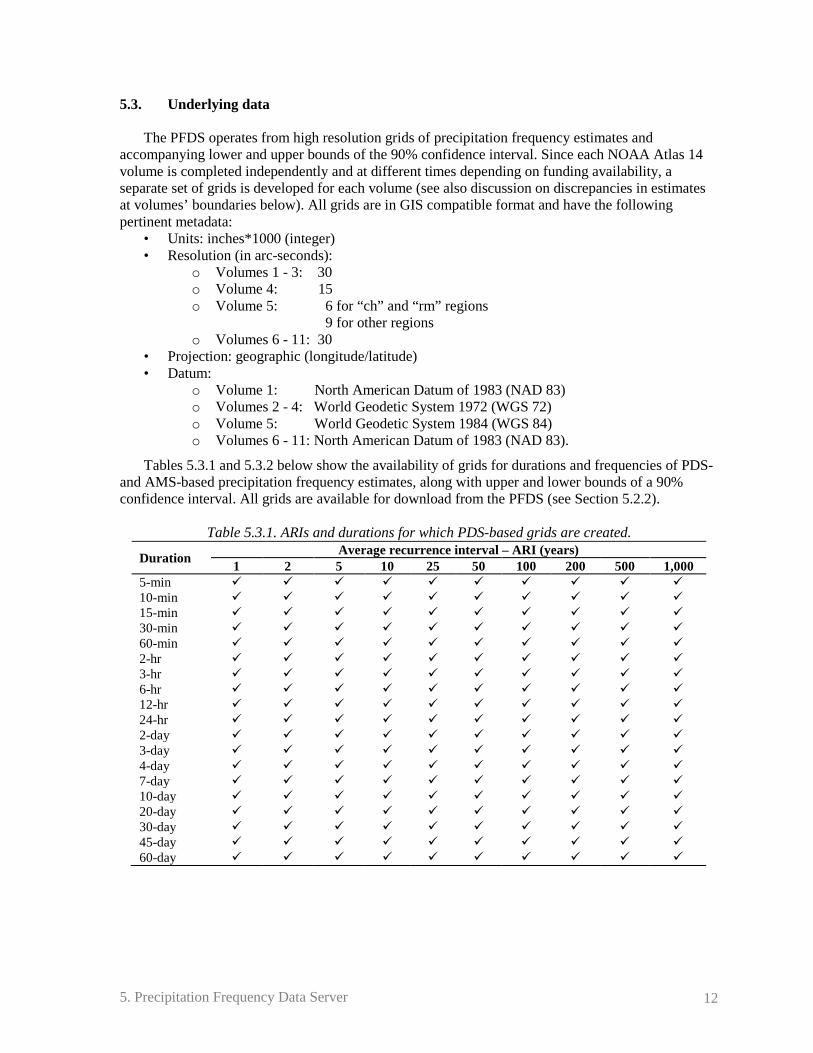
• Temporals - Temporal distributions of precipitation amounts exceeding 2-yr estimates are provided for 6-hr, 12-hr, 24-hr, and 4-day durations. Figure 5.2.11 shows an example of the temporal distribution curves for 6-hr and 12-hr durations. The temporal distributions for the duration are expressed in probability terms as cumulative percentages of precipitation totals. To provide detailed information on the varying temporal distributions, separate temporal distributions are also derived for four precipitation cases defined by the duration quartile in which the greatest percentage of the total precipitation occurred. The project area for each Volume is typically delineated into regions (temporal distribution areas) based on selected extreme precipitation characteristics and separate temporal distributions are derived for each region. Figure 5.2.12 shows, as an example, two temporal distribution areas delineated for the Volume 10 project area. More details on derivation of temporal distribution curves are provided in the documentation.
1-hr, Annual Maximum, WaterYear=1 (January-December), Units in Inches 30-3979 HORNBY, NY, 42.2333 -77.0500 1795 06/20/1976 0.93 09/02/1977 0.60 06/08/1978 1.11 09/02/1979 1.39 06/15/1980 0.83 07/05/1981 1.11 07/27/1982 1.30 08/02/1984 0.65 07/20/1986 1.67 07/07/1987 0.65 08/27/1988 0.83 07/22/1989 1.30 09/26/1990 0.56 06/11/1991 0.56 08/28/1992 0.83 09/02/1993 1.11 07/09/1994 0.65 08/05/1995 0.74 06/08/1996 1.30 05/19/1997 0.56 06/30/1998 0.65 04/09/1999 0.46 05/10/2000 0.46 01/17/2001 0.65 07/22/2003 0.93 30-8290 STONY POINT 2E, NY, 43.8389 -76.2675 250 06/30/1981 0.83 ...
5. Precipitation Frequency Data Server 11
Cumulative Percent of Duration
0 10 20 30 40 50 60 70 80 90 100
Cum
ulat
ive
Perc
ent o
f Pre
cipi
tatio
n
0
10
20
30
40
50
60
70
80
90
100
90%
50%10%
a) 6-hour duration
Cumulative Percent of Duration
0 10 20 30 40 50 60 70 80 90 100
Cum
ulat
ive
Perc
ent o
f Pre
cipi
tatio
n
0
10
20
30
40
50
60
70
80
90
100
90%
50%10%
b) 12-hour duration
Figure 5.2.11. Sample temporal distribution curves for 6-hr and 12-hr durations.
Figure 5.2.12. Regions delineated for Volume 10.
• Documents - This link provides access to NOAA Atlas 14 documents and pertinent NOAA
publications for states not covered by Atlas 14. All documents are presented in two tables: 1) sorted by state/territory and range of durations for which they are applicable, and 2) by their titles. NOAA Atlas 14 documents for all volumes are similar in layout, coverage and depth. They describe all aspects of the development of each product in sufficient depth to allow the knowledgeable user to understand the basis of the estimates and their scope and applicability.
5. Precipitation Frequency Data Server 12
5.3. Underlying data
The PFDS operates from high resolution grids of precipitation frequency estimates and accompanying lower and upper bounds of the 90% confidence interval. Since each NOAA Atlas 14 volume is completed independently and at different times depending on funding availability, a separate set of grids is developed for each volume (see also discussion on discrepancies in estimates at volumes’ boundaries below). All grids are in GIS compatible format and have the following pertinent metadata:
• Units: inches*1000 (integer) • Resolution (in arc-seconds):
o Volumes 1 - 3: 30 o Volume 4: 15 o Volume 5: 6 for “ch” and “rm” regions
9 for other regions o Volumes 6 - 11: 30
• Projection: geographic (longitude/latitude) • Datum:
o Volume 1: North American Datum of 1983 (NAD 83) o Volumes 2 - 4: World Geodetic System 1972 (WGS 72) o Volume 5: World Geodetic System 1984 (WGS 84) o Volumes 6 - 11: North American Datum of 1983 (NAD 83).
Tables 5.3.1 and 5.3.2 below show the availability of grids for durations and frequencies of PDS- and AMS-based precipitation frequency estimates, along with upper and lower bounds of a 90% confidence interval. All grids are available for download from the PFDS (see Section 5.2.2).
Table 5.3.1. ARIs and durations for which PDS-based grids are created.
Duration Average recurrence interval – ARI (years) 1 2 5 10 25 50 100 200 500 1,000
5-min 10-min 15-min 30-min 60-min 2-hr 3-hr 6-hr 12-hr 24-hr 2-day 3-day 4-day 7-day 10-day 20-day 30-day 45-day 60-day
5. Precipitation Frequency Data Server 13
Table 5.3.2. AEPs and durations for which AMS-based grids are created.
Duration Annual exceedance probability (AEP) 1/2 1/5 1/10 1/25 1/50 1/100 1/200 1/500 1/1,000
5-min 10-min 15-min 30-min 60-min 2-hr 3-hr 6-hr 12-hr 24-hr 2-day 3-day 4-day 7-day 10-day 20-day 30-day 45-day 60-day
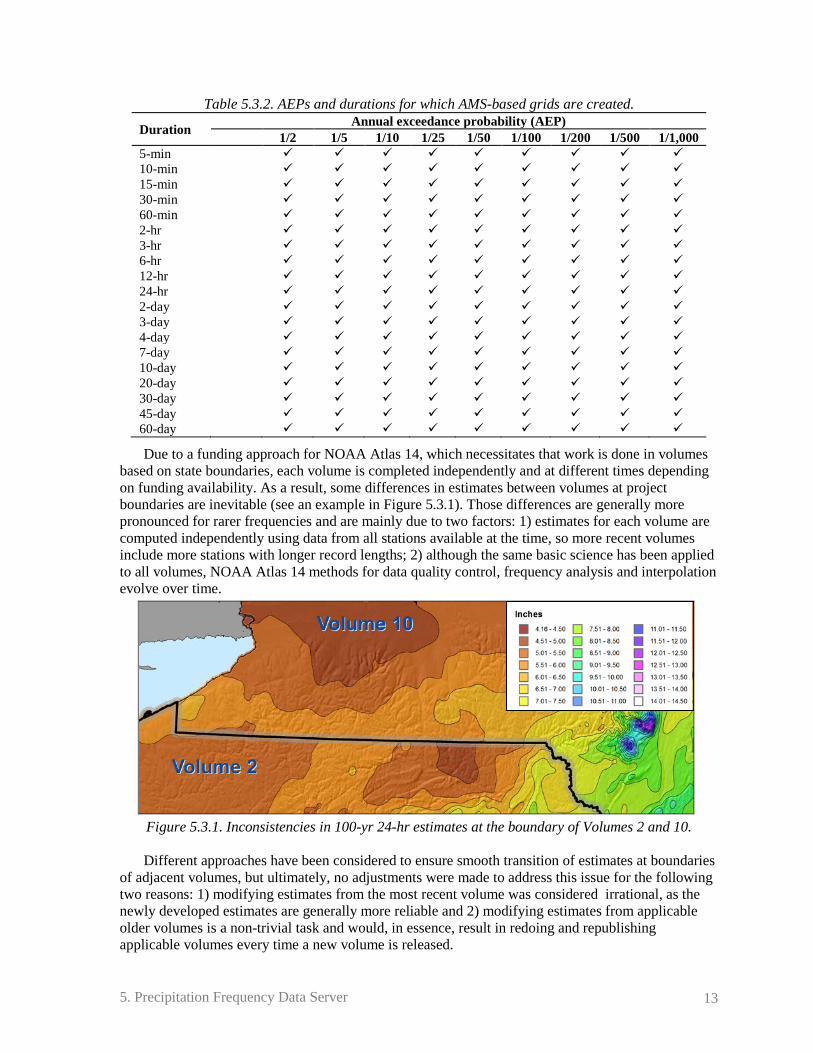
Due to a funding approach for NOAA Atlas 14, which necessitates that work is done in volumes based on state boundaries, each volume is completed independently and at different times depending on funding availability. As a result, some differences in estimates between volumes at project boundaries are inevitable (see an example in Figure 5.3.1). Those differences are generally more pronounced for rarer frequencies and are mainly due to two factors: 1) estimates for each volume are computed independently using data from all stations available at the time, so more recent volumes include more stations with longer record lengths; 2) although the same basic science has been applied to all volumes, NOAA Atlas 14 methods for data quality control, frequency analysis and interpolation evolve over time.
Figure 5.3.1. Inconsistencies in 100-yr 24-hr estimates at the boundary of Volumes 2 and 10.
Different approaches have been considered to ensure smooth transition of estimates at boundaries
of adjacent volumes, but ultimately, no adjustments were made to address this issue for the following two reasons: 1) modifying estimates from the most recent volume was considered irrational, as the newly developed estimates are generally more reliable and 2) modifying estimates from applicable older volumes is a non-trivial task and would, in essence, result in redoing and republishing applicable volumes every time a new volume is released.
5. Precipitation Frequency Data Server 14
5.4. Additional items
Other links on the side menu on the PFDS web page provide access to additional products and information relevant to precipitation frequency estimates under “General Information”, “Probable Maximum Precipitation”, “Miscellaneous” and “Contact Us” tags on the left menu bar. Under “General Information” tag: • Homepage - This is the main HDSC web page with a short description of the types of products
that are available. • Progress Reports - This page provides links to the most recent quarterly status reports, which are
prepared and made available via the web within 10 days of the conclusion of each quarter. Reports document various HDSC activities and report on progress made on active projects in the preceding quarter, activities expected in the upcoming quarter and expected completion schedules for various tasks.
• FAQ - Answers to frequently asked questions (FAQ) related to precipitation frequency analysis topics, PFDS and probable maximum precipitation are provided here.
• Glossary - This link lists pertinent terms with accompanying definitions; all definitions are given relative to precipitation frequency analyses in NOAA Atlas 14.
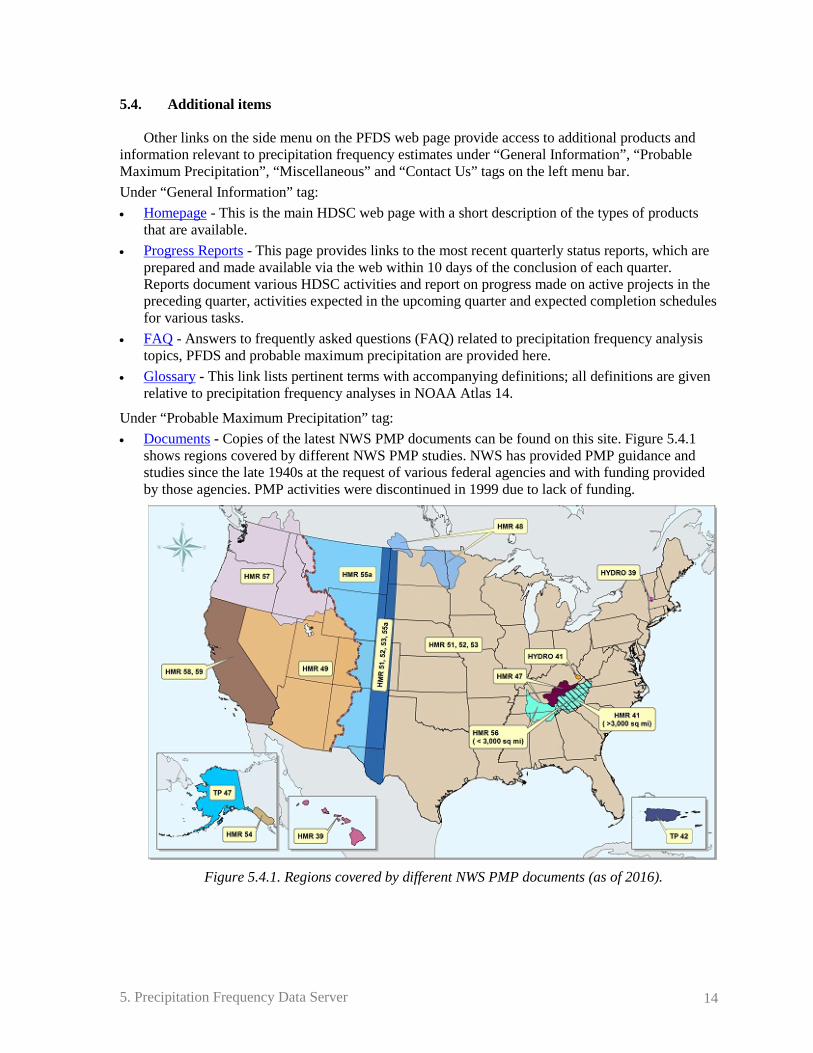
Under “Probable Maximum Precipitation” tag: • Documents - Copies of the latest NWS PMP documents can be found on this site. Figure 5.4.1
shows regions covered by different NWS PMP studies. NWS has provided PMP guidance and studies since the late 1940s at the request of various federal agencies and with funding provided by those agencies. PMP activities were discontinued in 1999 due to lack of funding.
Figure 5.4.1. Regions covered by different NWS PMP documents (as of 2016).
5. Precipitation Frequency Data Server 15
Under “Miscellaneous” tag: • Publications - Digital versions of various publications from the HDSC and its predecessors,
dating back to 1943, are available for download from this page. Publications are from the following series: - U.S. Weather Bureau Hydrometeorological Reports, Nos. 1 - 46 (1943 - 1970) - U.S. Weather Bureau Technical Papers, Nos. 1 - 57 (1943 - 1966) - U.S. Weather Bureau Technical Notes series, No. 1 (1966) - Environmental Science Services Administration (ESSA) Technical Reports, Weather Bureau series, Nos. 1 - 12 (1967 - 1970) - ESSA Technical Memoranda, Weather Bureau series, Nos. 2 - 11 (1967 - 1970) - NOAA Technical Reports NWS series, 13 - 41 (1971 - 1988) - Technical Memoranda, Nos. 1 - 46 (1966 - 1995) - NOAA Technical Memoranda, NWS HYDRO series, Nos. 12 - 46 (1971 - 1995) - NOAA Hydrometeorological Reports, Nos. 47 - 59 (1973 - 1999) - NOAA Atlas 2, Vols. I - XI (1973) - NOAA Atlas 14, Vols. 1 - 11 (2004 - 2018). Not all documents have been digitized yet, and the site is updated periodically as they become ready. All scanned documents have undergone optical character recognition (OCR), but because of the condition of the hard copies, some older documents may have issues with OCR.
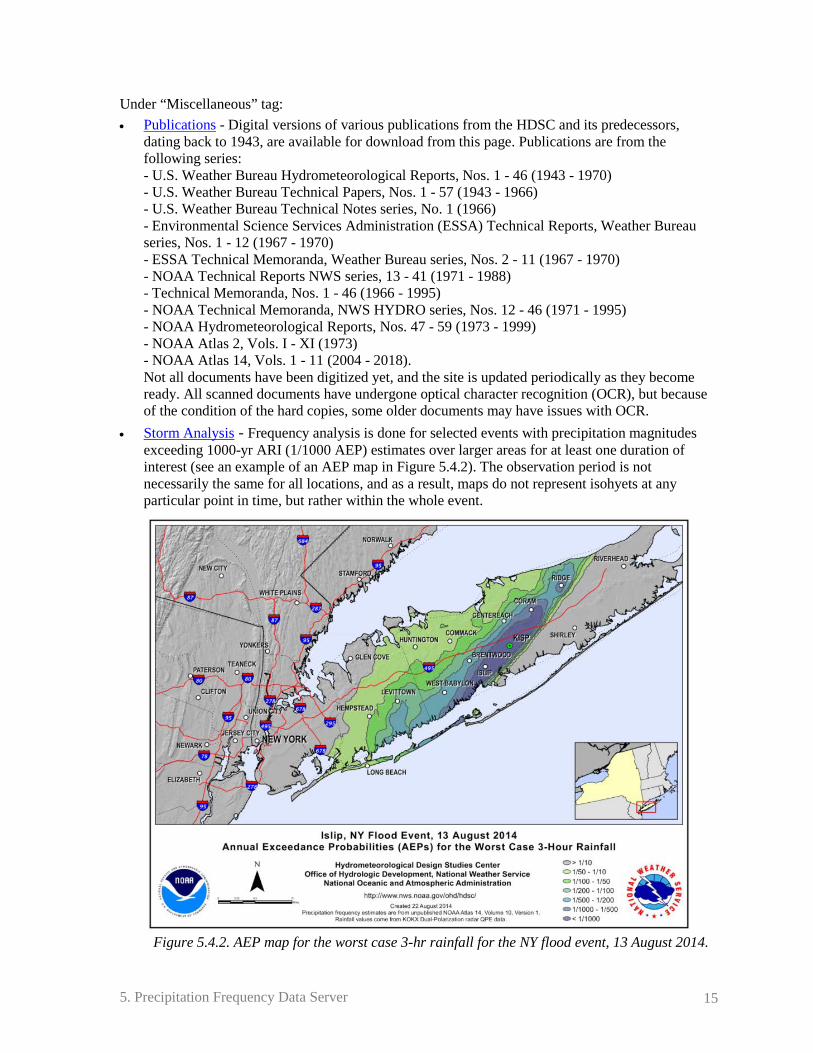
• Storm Analysis - Frequency analysis is done for selected events with precipitation magnitudes exceeding 1000-yr ARI (1/1000 AEP) estimates over larger areas for at least one duration of interest (see an example of an AEP map in Figure 5.4.2). The observation period is not necessarily the same for all locations, and as a result, maps do not represent isohyets at any particular point in time, but rather within the whole event.
Figure 5.4.2. AEP map for the worst case 3-hr rainfall for the NY flood event, 13 August 2014.
5. Precipitation Frequency Data Server 16
Precipitation frequency estimates come from the merged NOAA Atlas 14 product for the Contiguous United States. This product has been developed by integrating gridded precipitation frequency estimates from NOAA Atlas 14 Volumes 1, 2, 6, 7, 8, 9 and 10 and covers every contiguous U.S. state except the following six states: ID, MT, OR, TX, WA and WY. The merged product can be accessed through the Open-source Project for a Network Data Access Protocol (OPeNDAP) protocol which allows for remote data retrieval. Data can be retrieved for a selected location or for a user-specified area defined by latitude-longitude bounding box. For more information, see the web page.
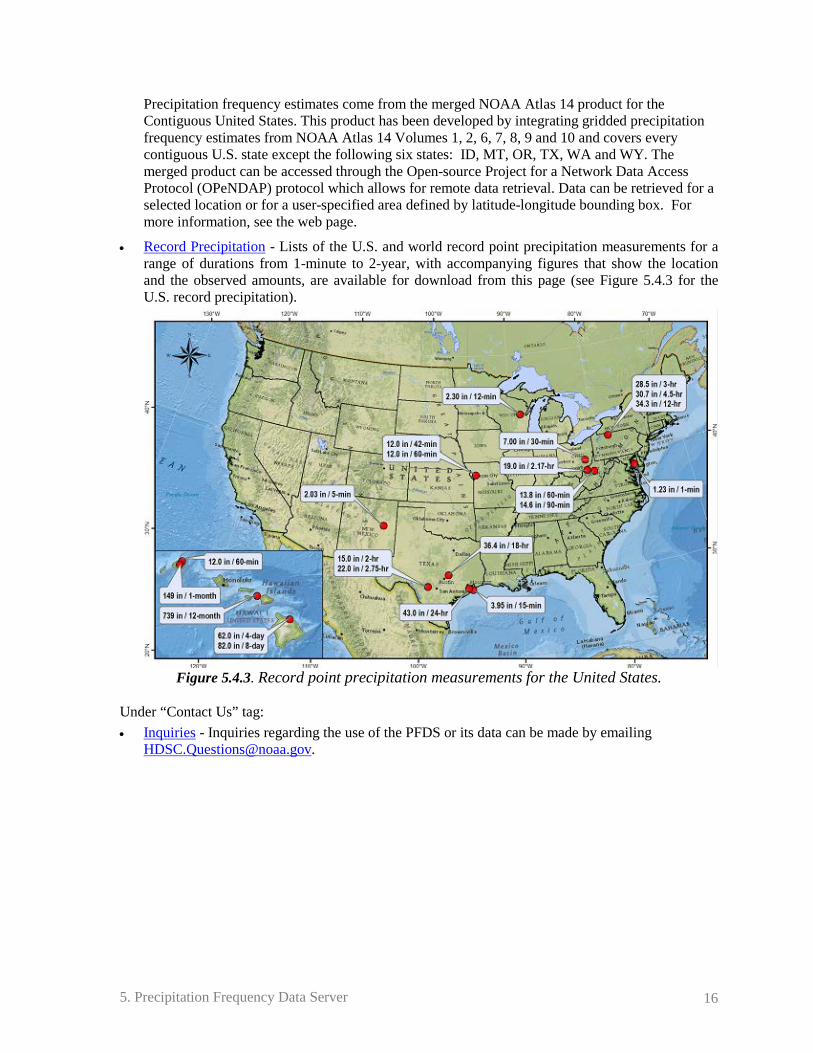
• Record Precipitation - Lists of the U.S. and world record point precipitation measurements for a range of durations from 1-minute to 2-year, with accompanying figures that show the location and the observed amounts, are available for download from this page (see Figure 5.4.3 for the U.S. record precipitation).
Figure 5.4.3. Record point precipitation measurements for the United States.
Under “Contact Us” tag: • Inquiries - Inquiries regarding the use of the PFDS or its data can be made by emailing