Embed Size (px)
Citation preview
Precision Agriculture for Food Security and Sustainable Development in China
Yuxin Miao China Agricultural University
The InfoAg Conference, August 2-4, 2016. St. Louis, USA
Chinese Agriculture: Success at High Costs
Pla
stic
Mu
lch
/Pes
tici
de(
10
00
0 t
)
Chemical Fertilizer
Grain Yield
Grain Demand
Planting area
Plastic Mulch
Irrigation Area
Pesticide
Gra
in Y
ield
(1
00
Mt)
\ P
lan
tin
g A
rea
(1
00 M
Ha)
Fert
ilize
r(1
0 M
t) Ir
riga
tio
n A
rea(
10
M h
a)
(Zhang, F., 2014)
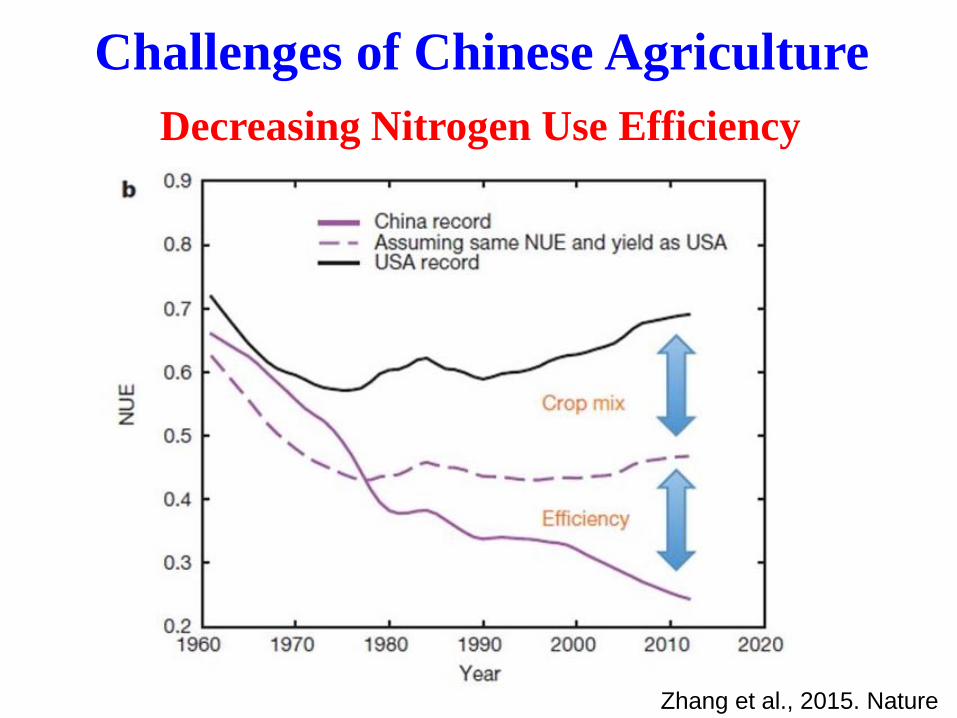
Zhang et al., 2015. Nature
Challenges of Chinese Agriculture
Decreasing Nitrogen Use Efficiency
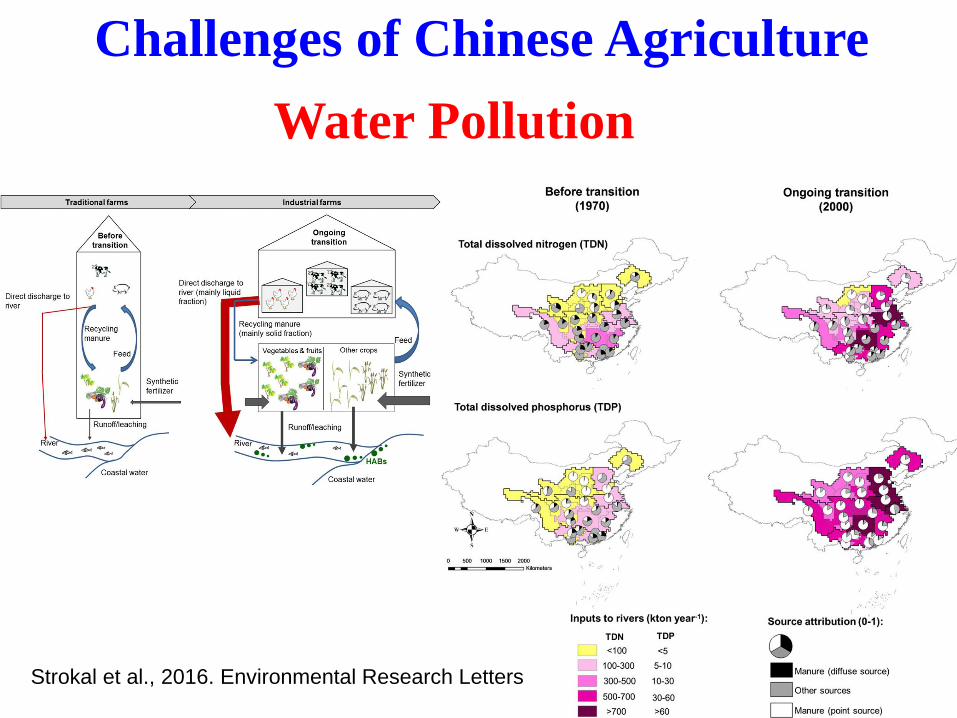
Challenges of Chinese Agriculture
Water Pollution
Strokal et al., 2016. Environmental Research Letters
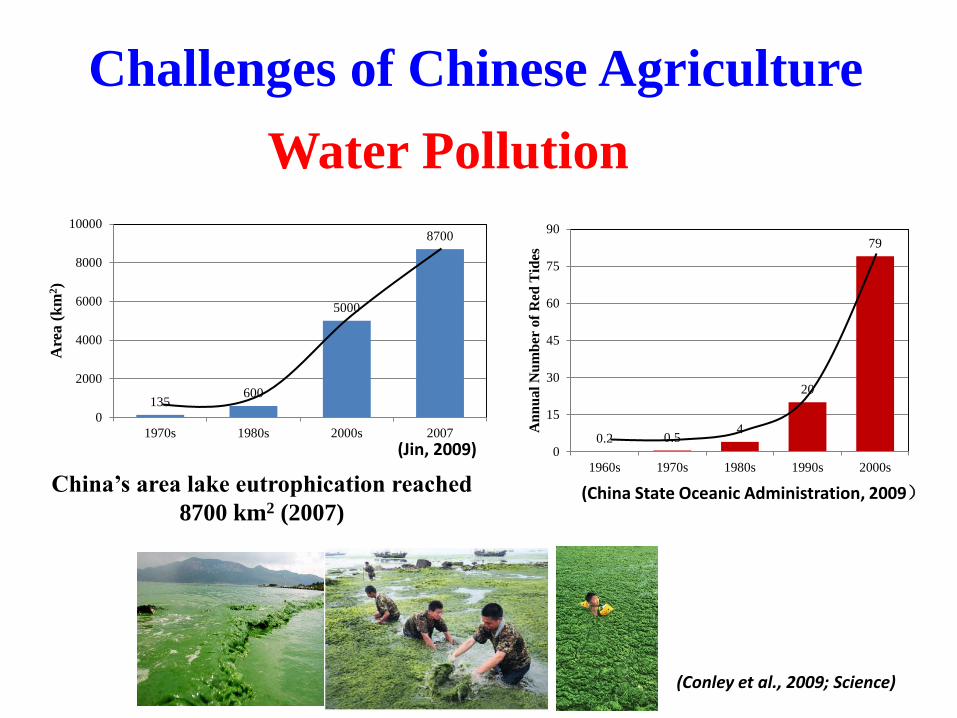
Challenges of Chinese Agriculture
Water Pollution
135 600
5000
8700
0
2000
4000
6000
8000
10000
1970s 1980s 2000s 2007
Are
a (
km
2)
(Jin, 2009)
China’s area lake eutrophication reached
8700 km2 (2007)
0.2 0.5 4
20
79
0
15
30
45
60
75
90
1960s 1970s 1980s 1990s 2000s
An
nu
al
Nu
mb
er o
f R
ed T
ides
(China State Oceanic Administration, 2009)
(Conley et al., 2009; Science)
N fe
rtiliz
er u
se (T
g N
yr1 )
0
10
20
30
40
50
Live
stoc
k un
it (1
06 hea
ds)
0
100
200
300
400
N Fertilizer
Livestock unit
NH
3 or N
Ox e
mis
sion
(Tg
N y
r-1)
0
2
4
6
8
10
12
14
16
NH
3-N/N
Ox-N
0
1
2
3
4
5NH3
NOx-N
NH3-N/NOx-N
Year
1980 1985 1990 1995 2000 2005 2010
No.
of v
ehic
les (
106 )
0
20
40
60
80
100
Coa
l con
sum
ptio
n (1
09 tons
)
0
1
2
3
4
Motor vehicles
Coal consumption
f
y=2.0010-44 e0.0516x
(n=13, P < 0.001)
y=1.0010-113 e0.1316x
(n=17, P < 0.001)
d
e
y=0.315x-619.21 (n=31, P < 0.001)
y=7.0010-49 e0.0561x
(n=31, P < 0.001)
y= -0.0709x+144.6 (n=31, P < 0.001)
y=0.842x-1, 657.4
(n=31, P < 0.001)
y=8.999x-17, 723
(n=31, P < 0.001)
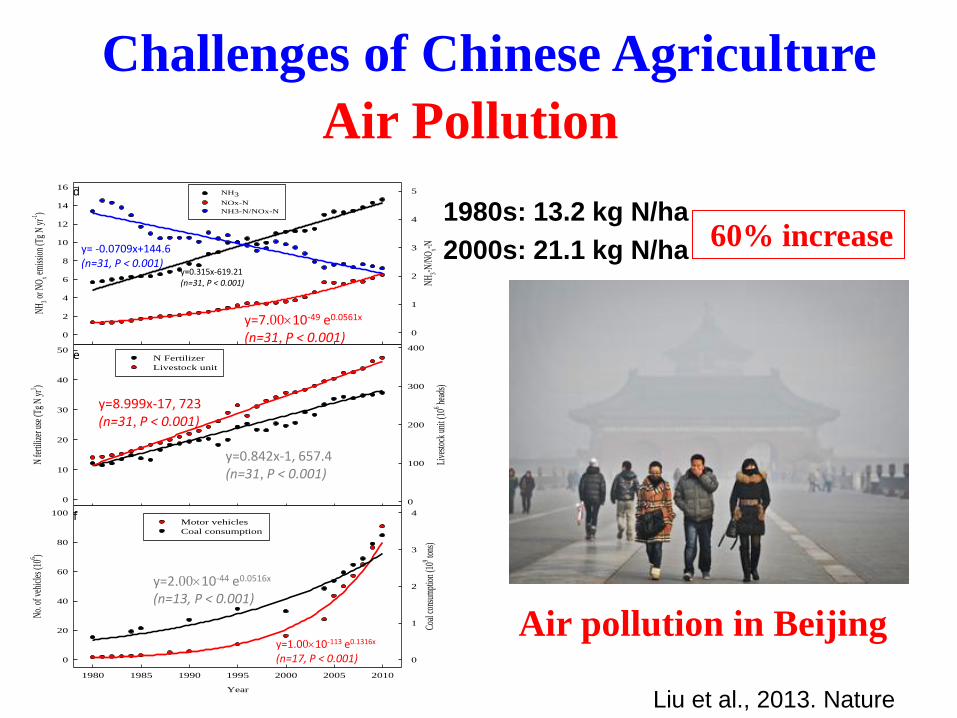
Air pollution in Beijing
1980s: 13.2 kg N/ha 2000s: 21.1 kg N/ha
60% increase
Challenges of Chinese Agriculture
Air Pollution
Liu et al., 2013. Nature
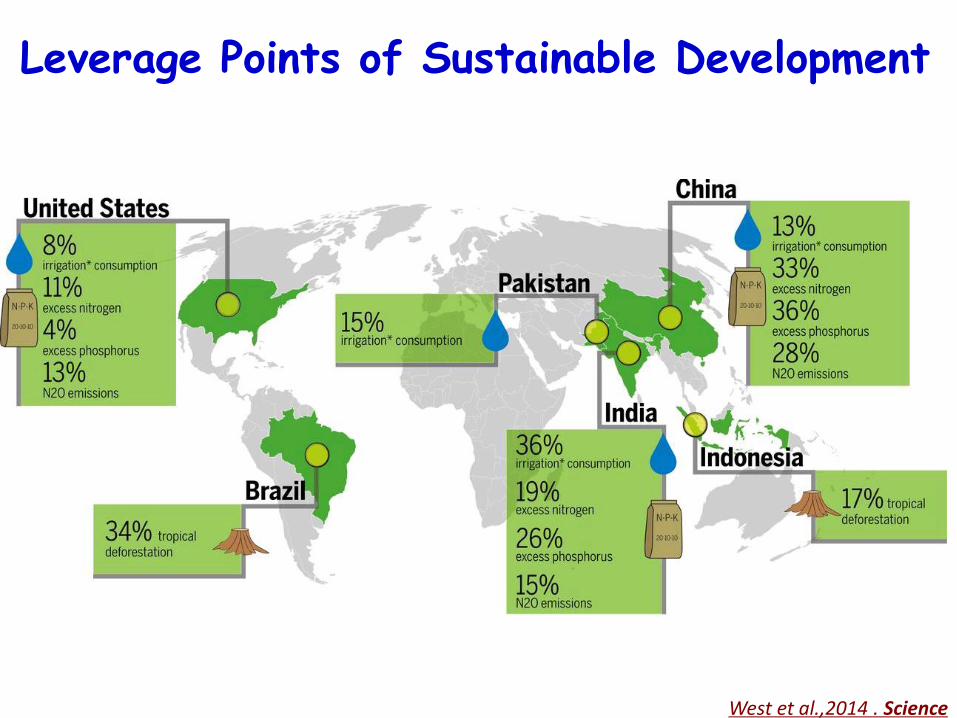
West et al.,2014 . Science
Leverage Points of Sustainable Development
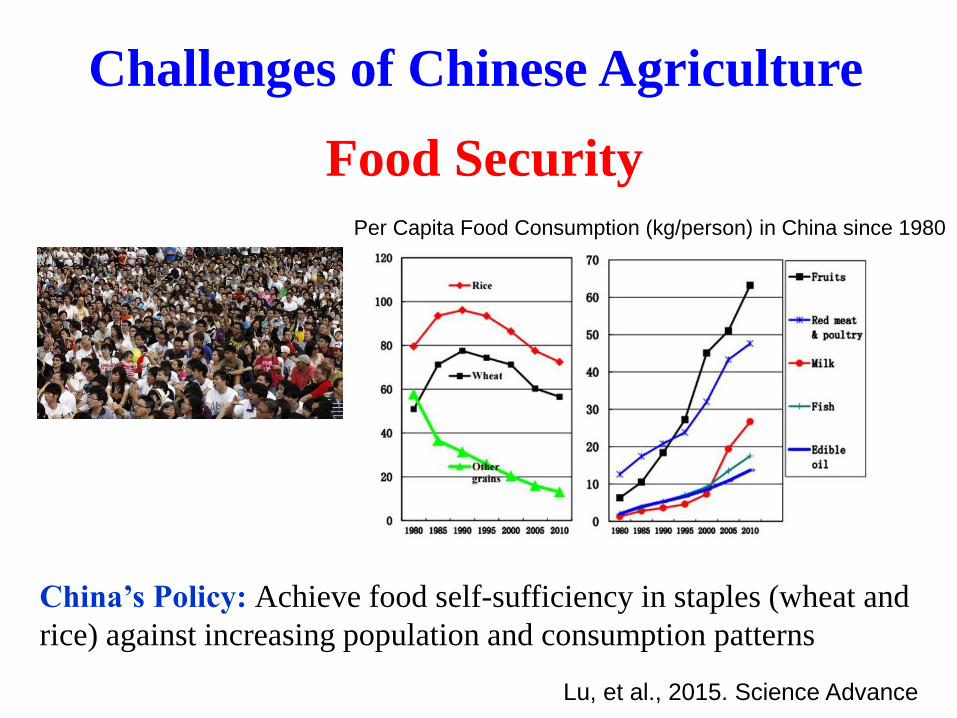
Challenges of Chinese Agriculture
China’s Policy: Achieve food self-sufficiency in staples (wheat and
rice) against increasing population and consumption patterns
Food Security Per Capita Food Consumption (kg/person) in China since 1980
Lu, et al., 2015. Science Advance
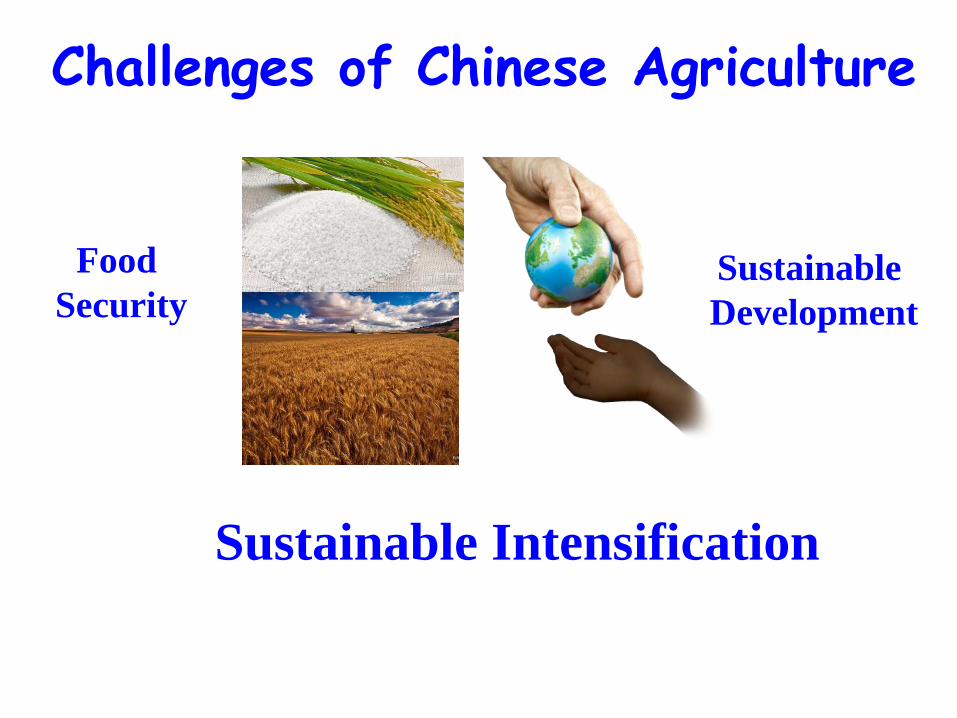
Challenges of Chinese Agriculture
Food
Security Sustainable
Development
Sustainable Intensification
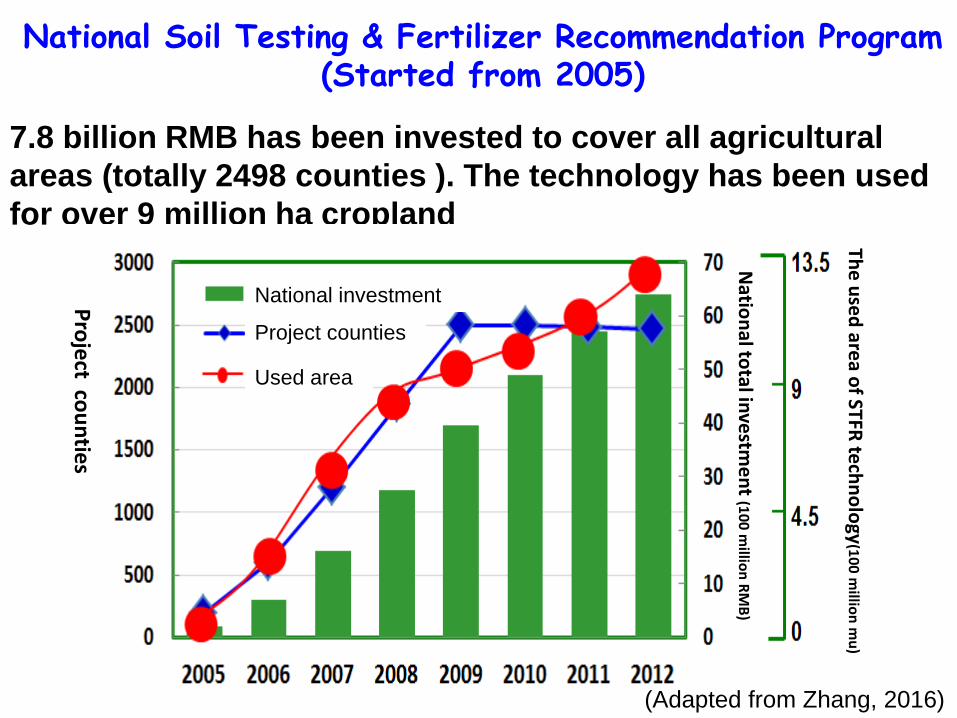
7.8 billion RMB has been invested to cover all agricultural
areas (totally 2498 counties ). The technology has been used
for over 9 million ha cropland
Used area
Project counties
National investment Pro
ject co
un
ties
Natio
nal to
tal inve
stme
nt (1
00
millio
n R
MB
)
The
use
d are
a of STFR
tech
no
logy
(10
0 m
illion
mu
)
National Soil Testing & Fertilizer Recommendation Program (Started from 2005)
(Adapted from Zhang, 2016)
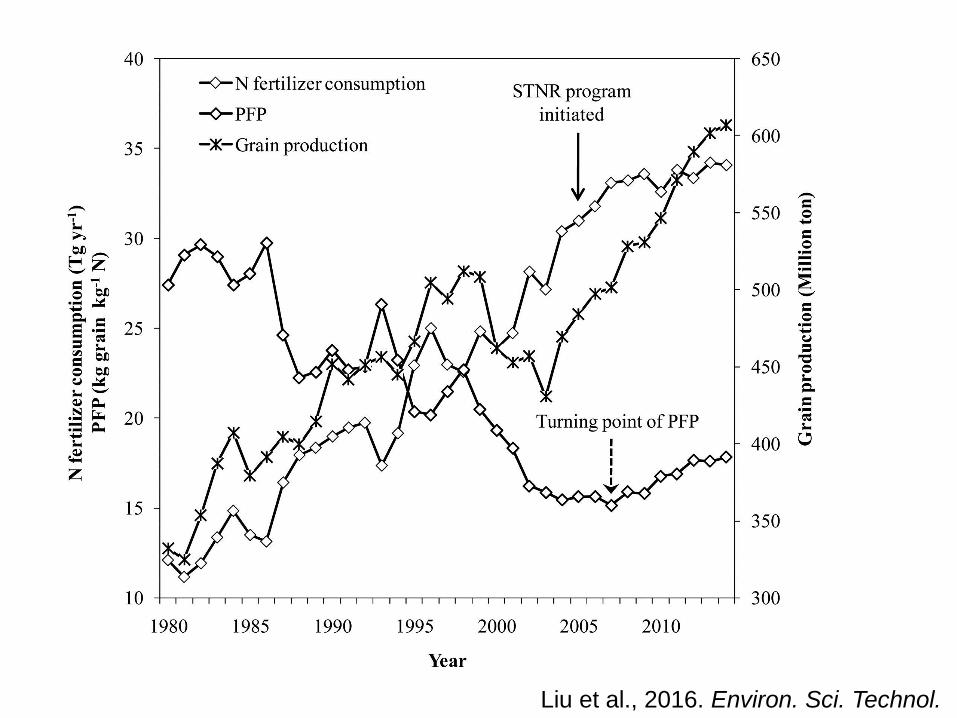
Liu et al., 2016. Environ. Sci. Technol.
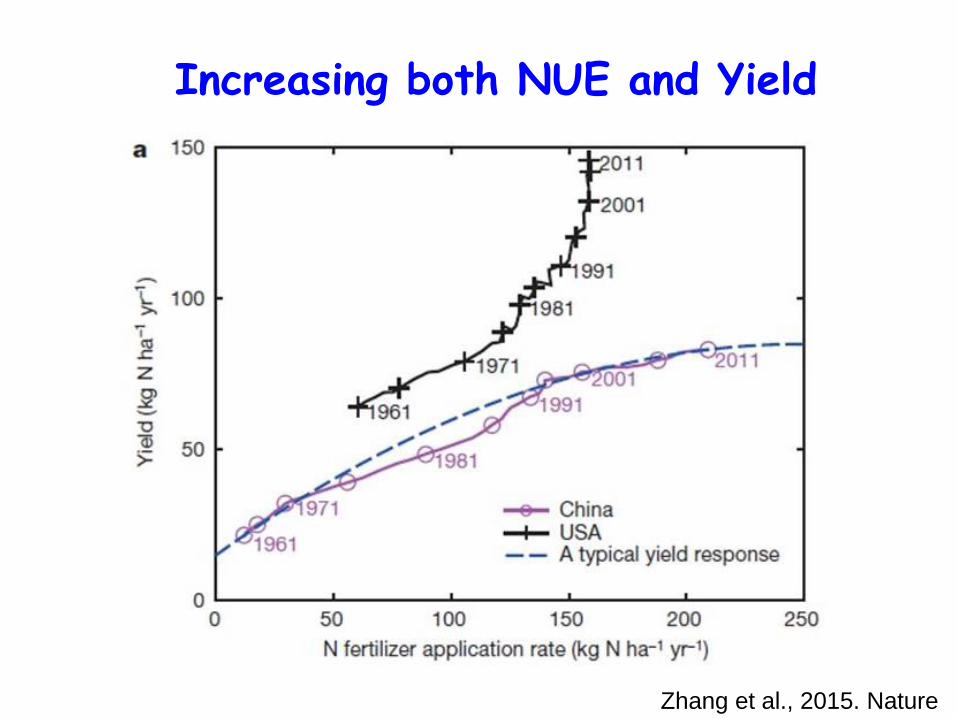
Zhang et al., 2015. Nature
Increasing both NUE and Yield
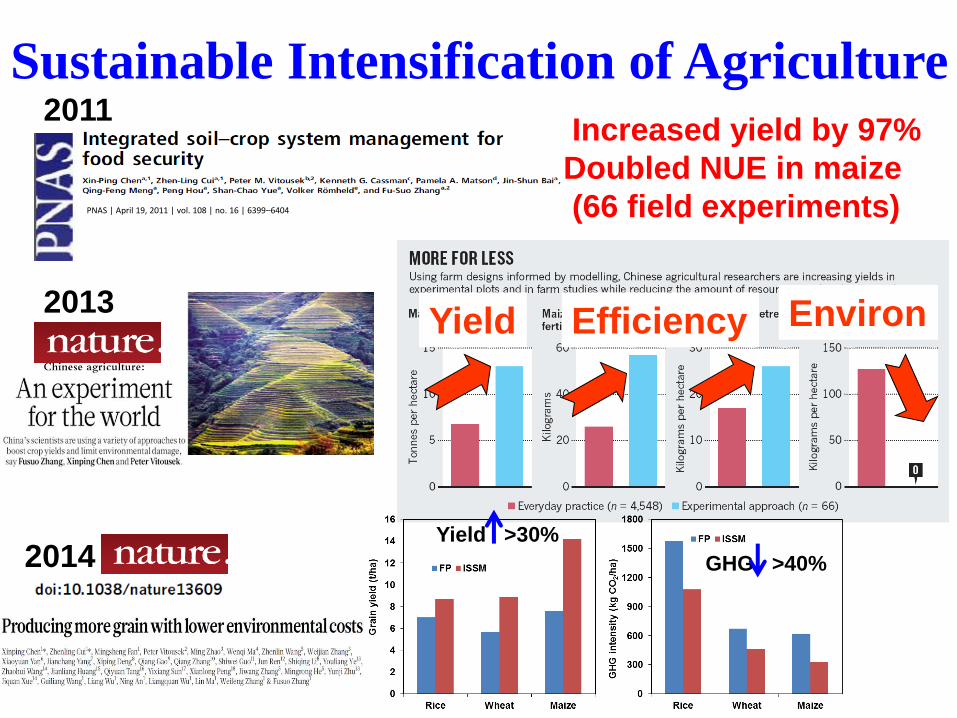
Sustainable Intensification of Agriculture
2013
2011
PNAS | April 19, 2011 | vol. 108 | no. 16 | 6399–6404
Increased yield by 97%
Doubled NUE in maize
(66 field experiments)
2014
Yield Efficiency Environ
Yield >30%
GHG >40%
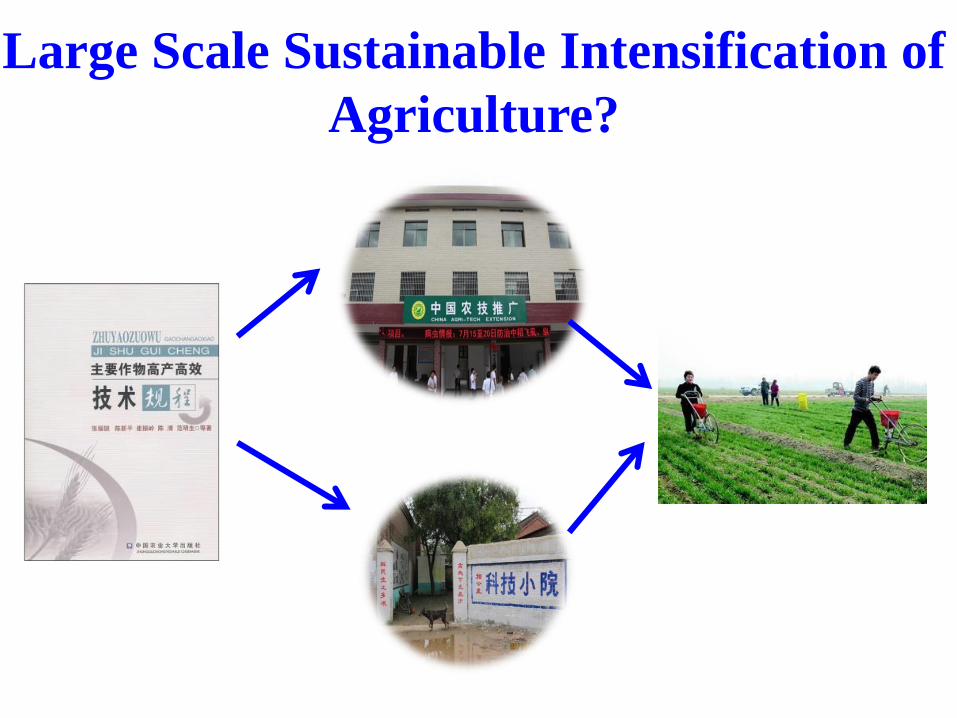
Large Scale Sustainable Intensification of
Agriculture?
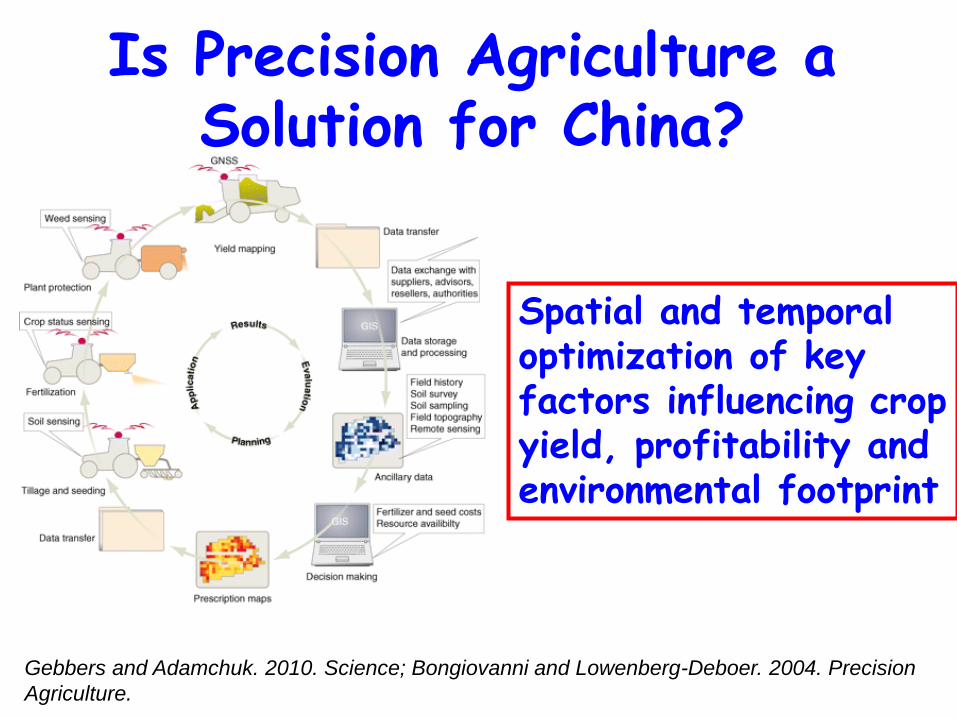
Spatial and temporal optimization of key factors influencing crop yield, profitability and environmental footprint
Is Precision Agriculture a Solution for China?
Gebbers and Adamchuk. 2010. Science; Bongiovanni and Lowenberg-Deboer. 2004. Precision
Agriculture.
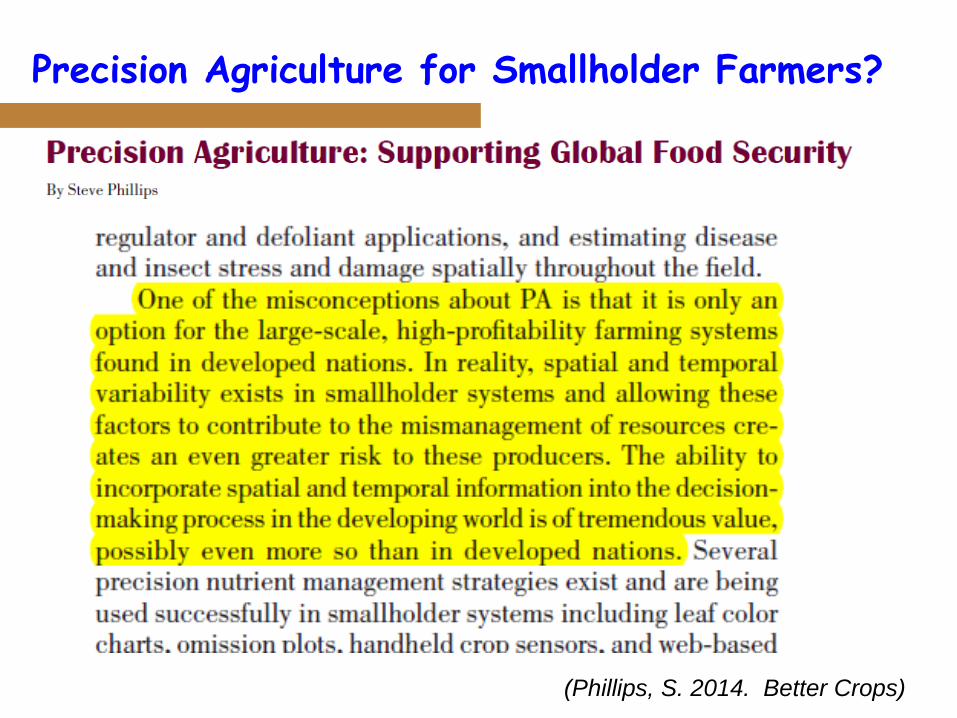
Precision Agriculture for Smallholder Farmers?
(Phillips, S. 2014. Better Crops)
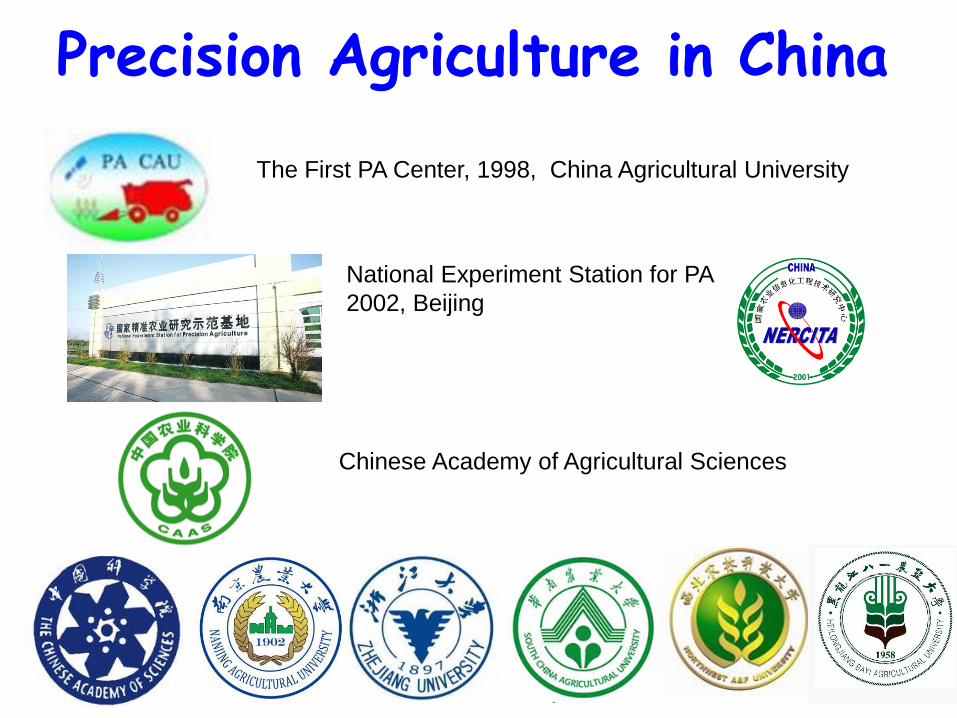
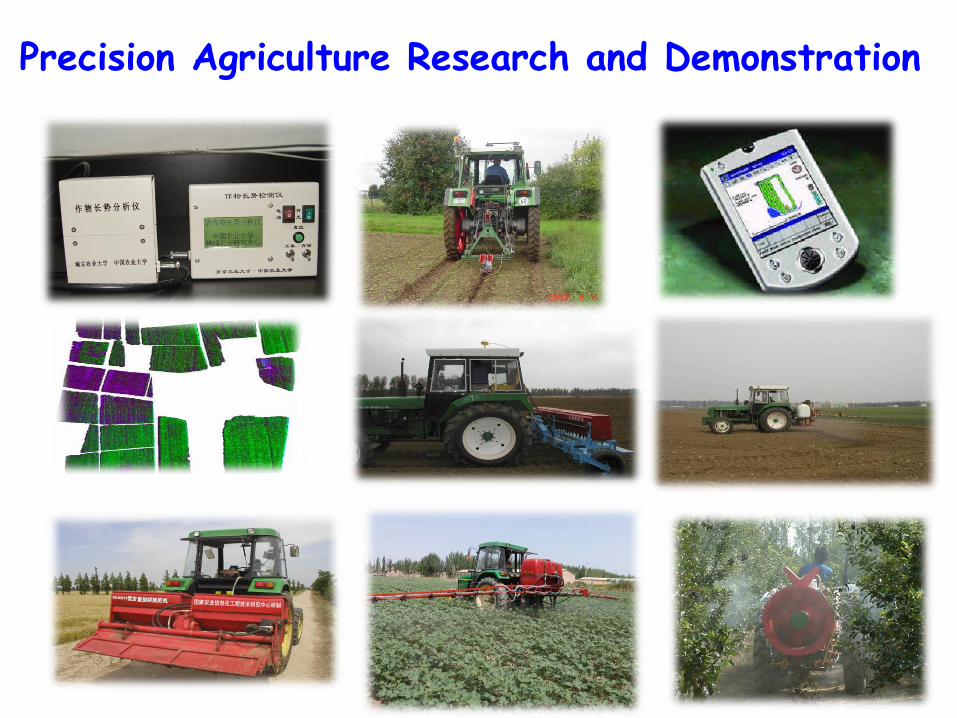
Precision Agriculture in China
The First PA Center, 1998, China Agricultural University
National Experiment Station for PA
2002, Beijing
Chinese Academy of Agricultural Sciences
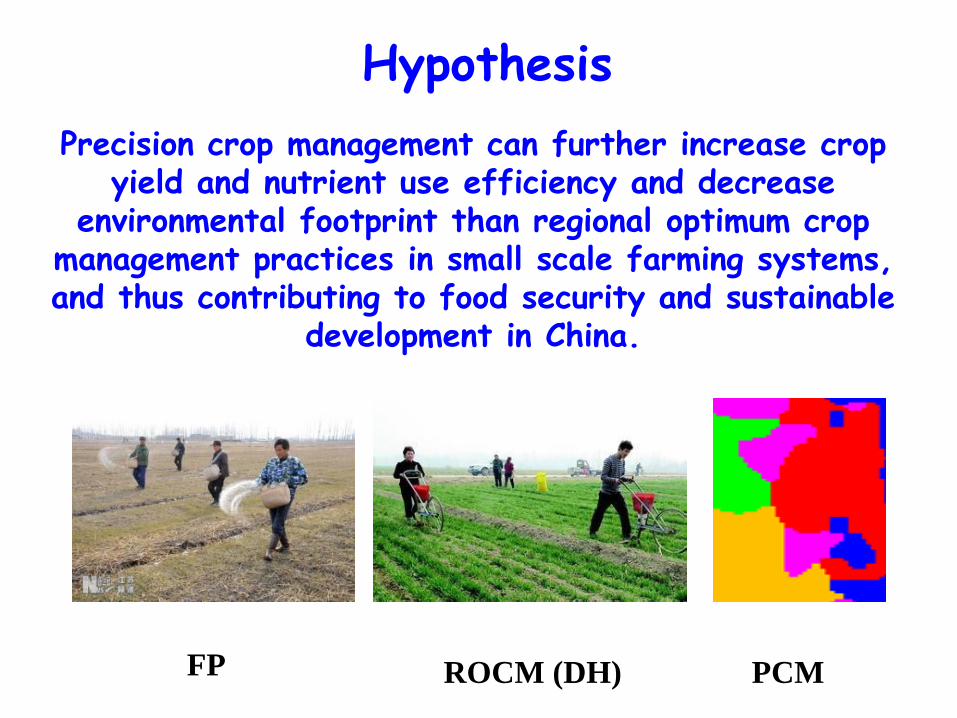
Precision crop management can further increase crop yield and nutrient use efficiency and decrease
environmental footprint than regional optimum crop management practices in small scale farming systems, and thus contributing to food security and sustainable
development in China.
FP ROCM (DH) PCM
Hypothesis
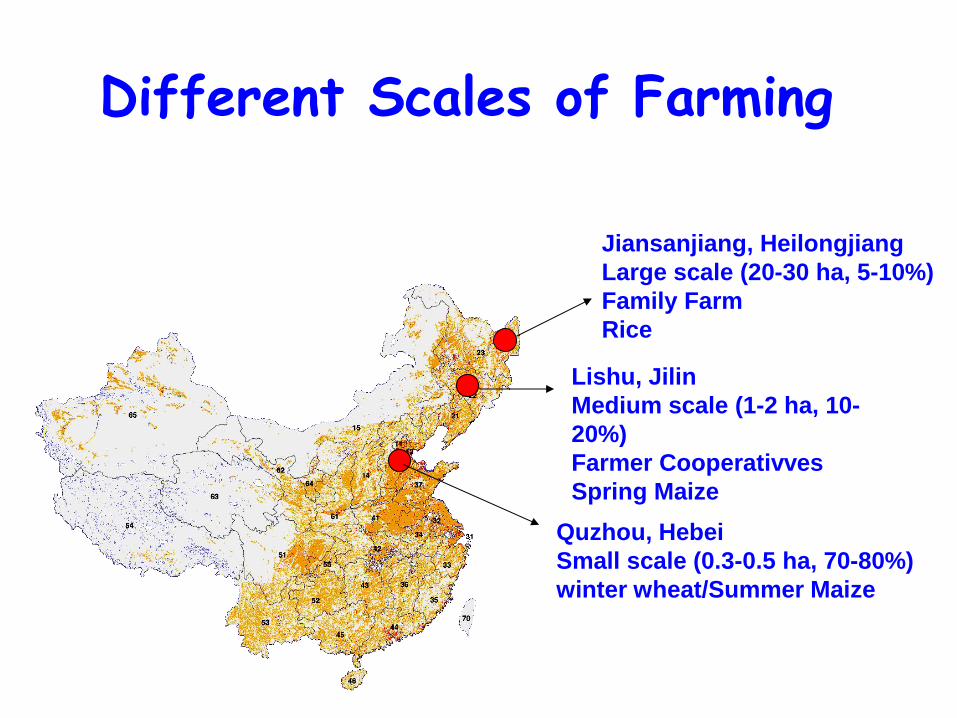
Quzhou, Hebei
Small scale (0.3-0.5 ha, 70-80%)
winter wheat/Summer Maize
Different Scales of Farming
Lishu, Jilin
Medium scale (1-2 ha, 10-
20%)
Farmer Cooperativves
Spring Maize
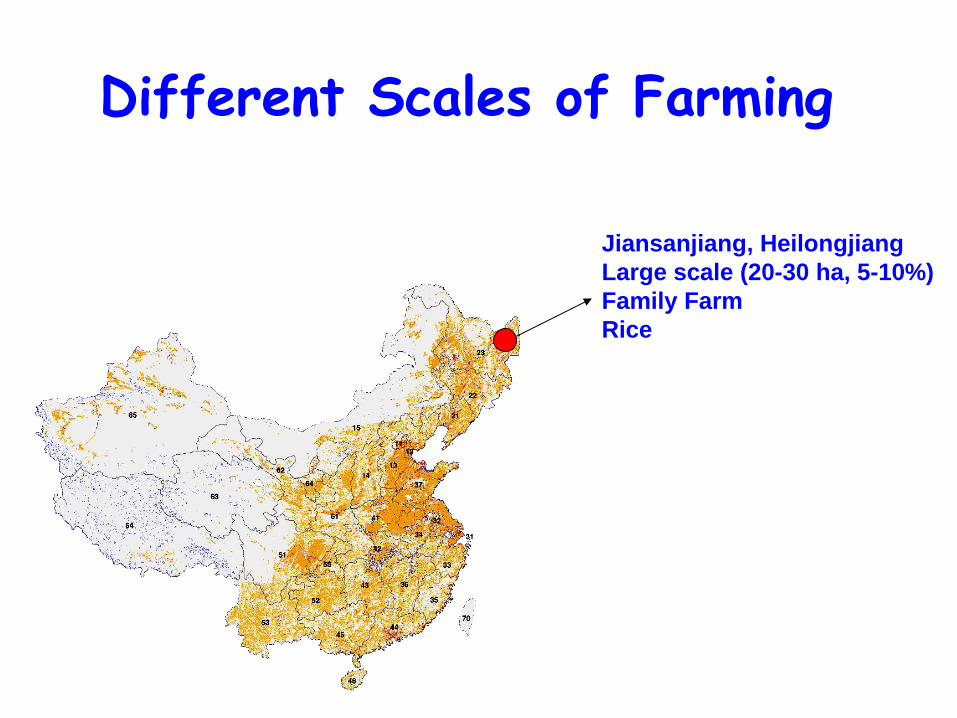
Jiansanjiang, Heilongjiang
Large scale (20-30 ha, 5-10%)
Family Farm
Rice
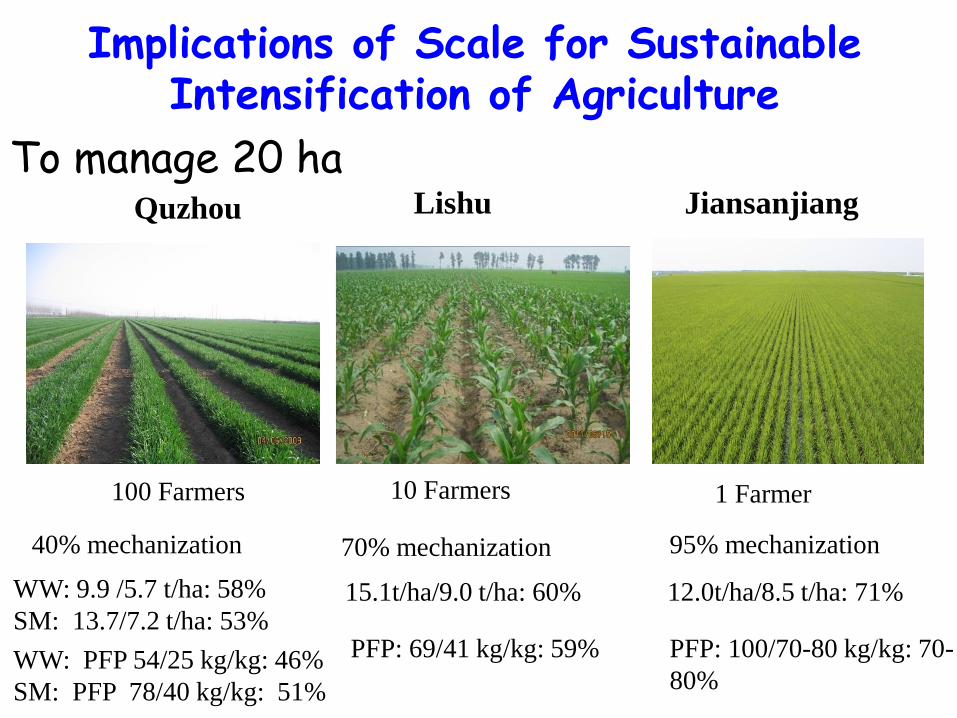
Implications of Scale for Sustainable Intensification of Agriculture
To manage 20 ha Jiansanjiang
1 Farmer
Lishu
10 Farmers
Quzhou
100 Farmers
95% mechanization 70% mechanization 40% mechanization
WW: 9.9 /5.7 t/ha: 58%
SM: 13.7/7.2 t/ha: 53% 12.0t/ha/8.5 t/ha: 71% 15.1t/ha/9.0 t/ha: 60%
WW: PFP 54/25 kg/kg: 46%
SM: PFP 78/40 kg/kg: 51%
PFP: 100/70-80 kg/kg: 70-
80%
PFP: 69/41 kg/kg: 59%
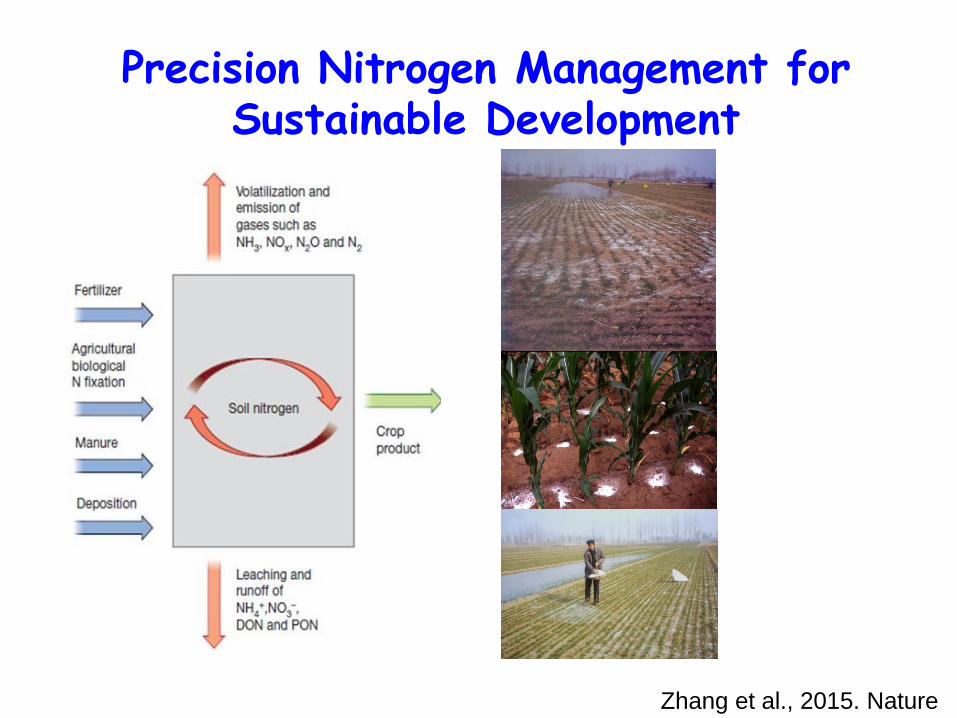
Precision Nitrogen Management for Sustainable Development
Zhang et al., 2015. Nature
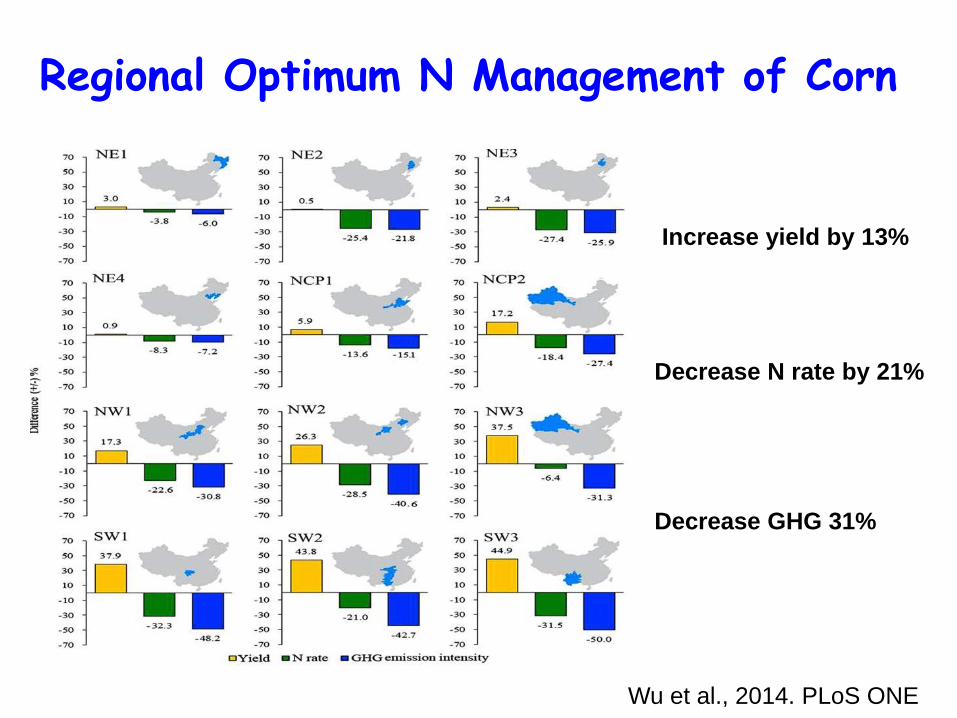
Regional Optimum N Management of Corn
Increase yield by 13%
Decrease GHG 31%
Decrease N rate by 21%
Wu et al., 2014. PLoS ONE
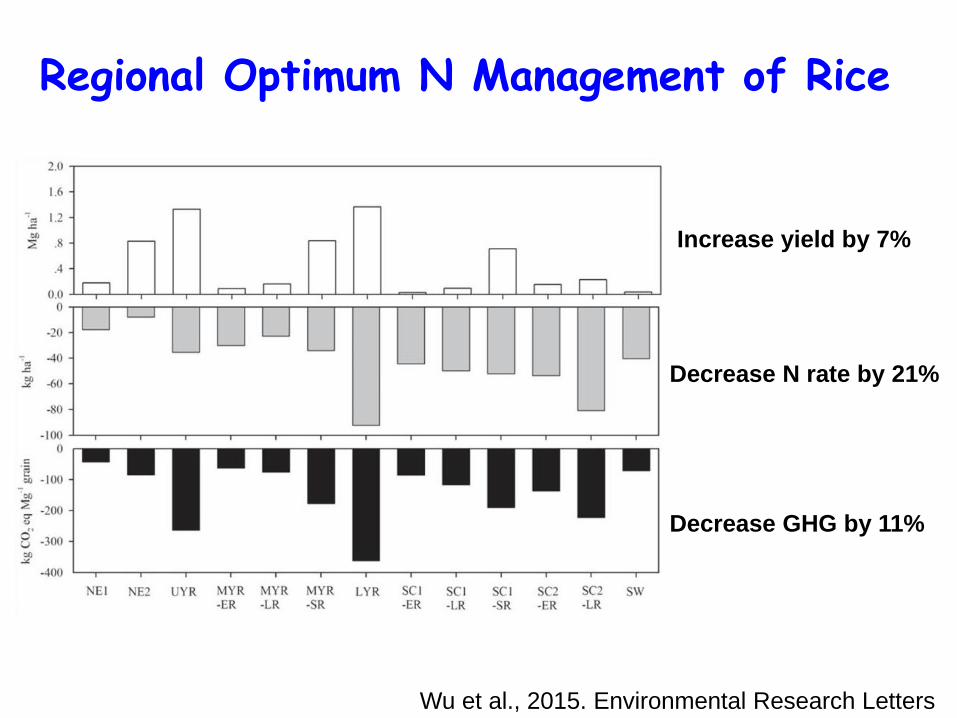
Regional Optimum N Management of Rice
Wu et al., 2015. Environmental Research Letters
Increase yield by 7%
Decrease GHG by 11%
Decrease N rate by 21%
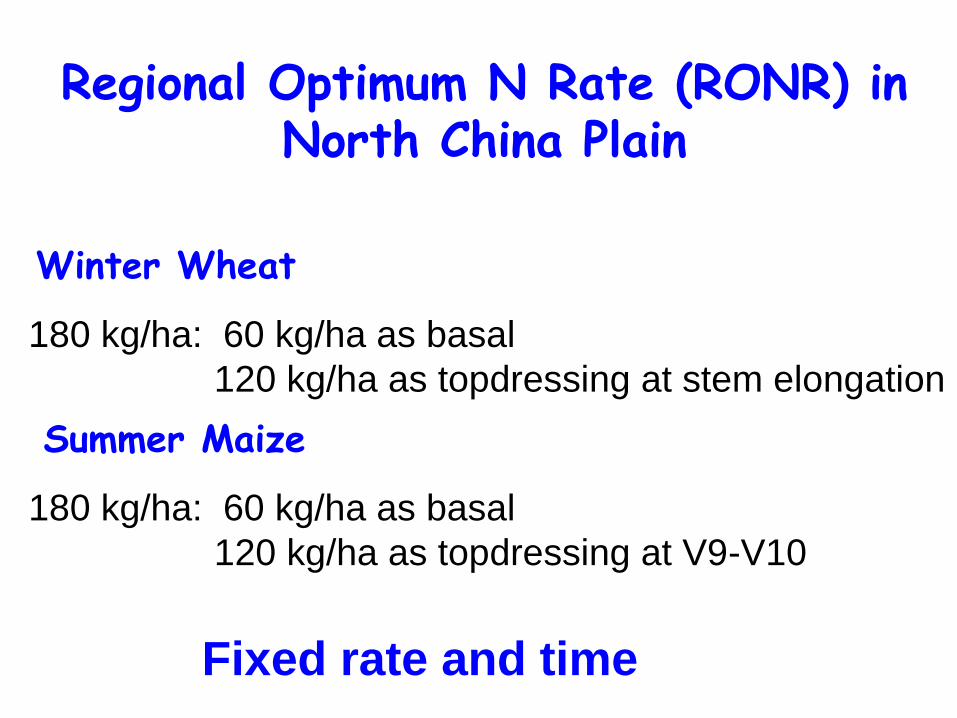
Regional Optimum N Rate (RONR) in North China Plain
180 kg/ha: 60 kg/ha as basal
120 kg/ha as topdressing at stem elongation
Fixed rate and time
Winter Wheat
180 kg/ha: 60 kg/ha as basal
120 kg/ha as topdressing at V9-V10
Summer Maize
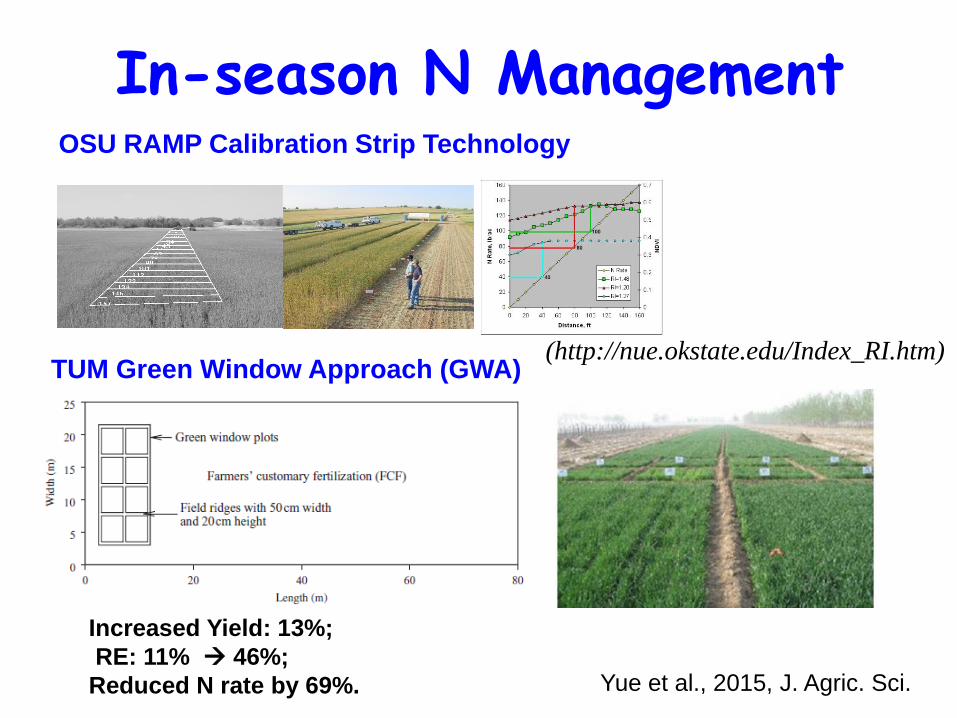
In-season N Management OSU RAMP Calibration Strip Technology
(http://nue.okstate.edu/Index_RI.htm) TUM Green Window Approach (GWA)
Increased Yield: 13%;
RE: 11% 46%;
Reduced N rate by 69%. Yue et al., 2015, J. Agric. Sci.
(Chen et al., 2006; Cui et al., 2008;Yue et al., 2013)
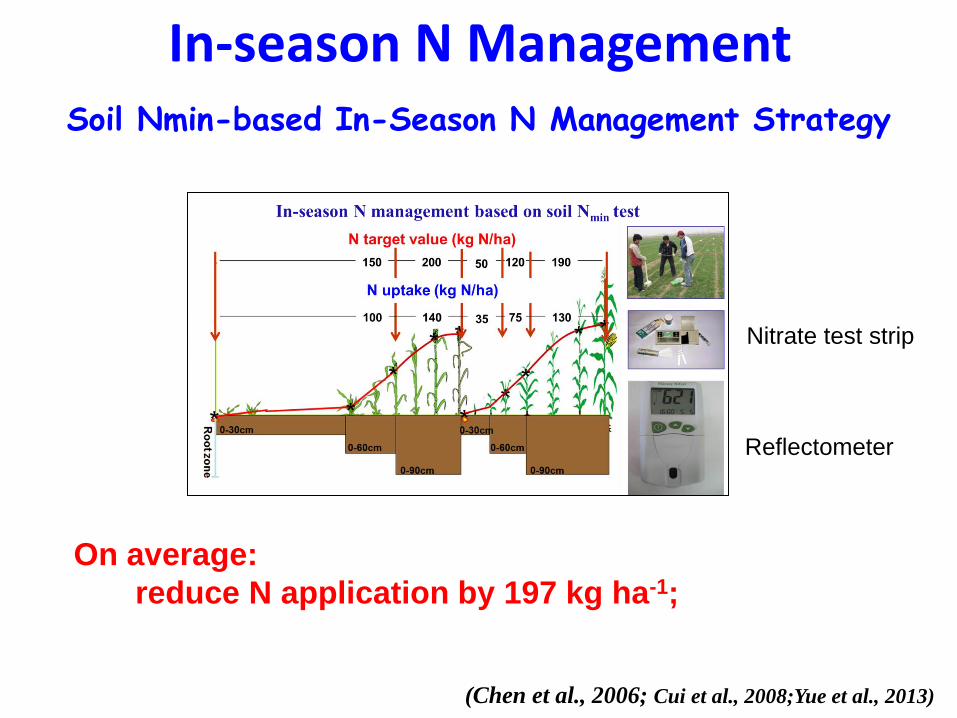
Soil Nmin-based In-Season N Management Strategy
On average:
reduce N application by 197 kg ha-1;
In-season N Management
Nitrate test strip
Reflectometer
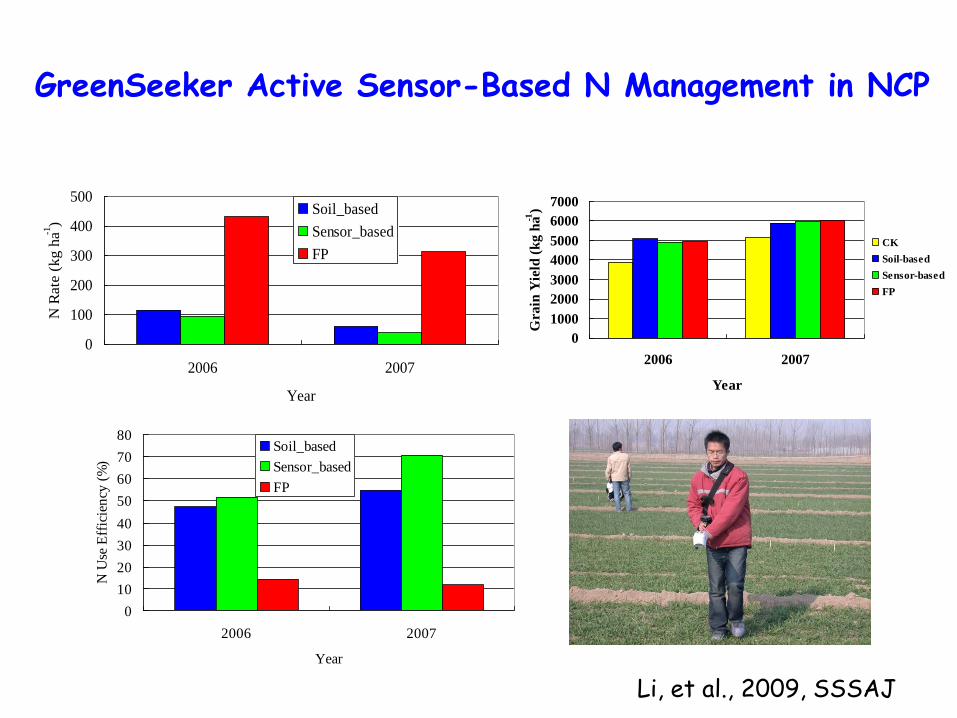
0
1000
2000
3000
4000
5000
6000
7000
2006 2007
Year
Grain
Yie
ld (
kg h
a-1)
CK
Soil-based
Sensor-based
FP
0
10
20
30
40
50
60
70
80
2006 2007
Year
N U
se E
ffic
ien
cy (
%)
Soil_based
Sensor_based
FP
Li, et al., 2009, SSSAJ
0
100
200
300
400
500
2006 2007
Year
N R
ate
(kg h
a-1)
Soil_based
Sensor_based
FP
GreenSeeker Active Sensor-Based N Management in NCP
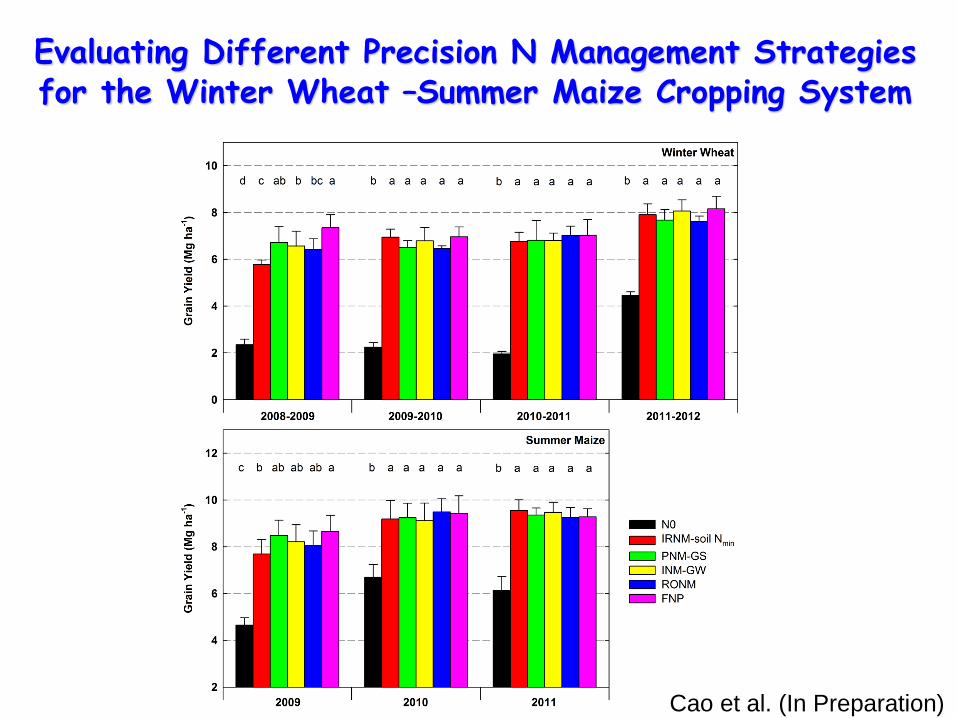
Evaluating Different Precision N Management Strategies for the Winter Wheat –Summer Maize Cropping System
Cao et al. (In Preparation)
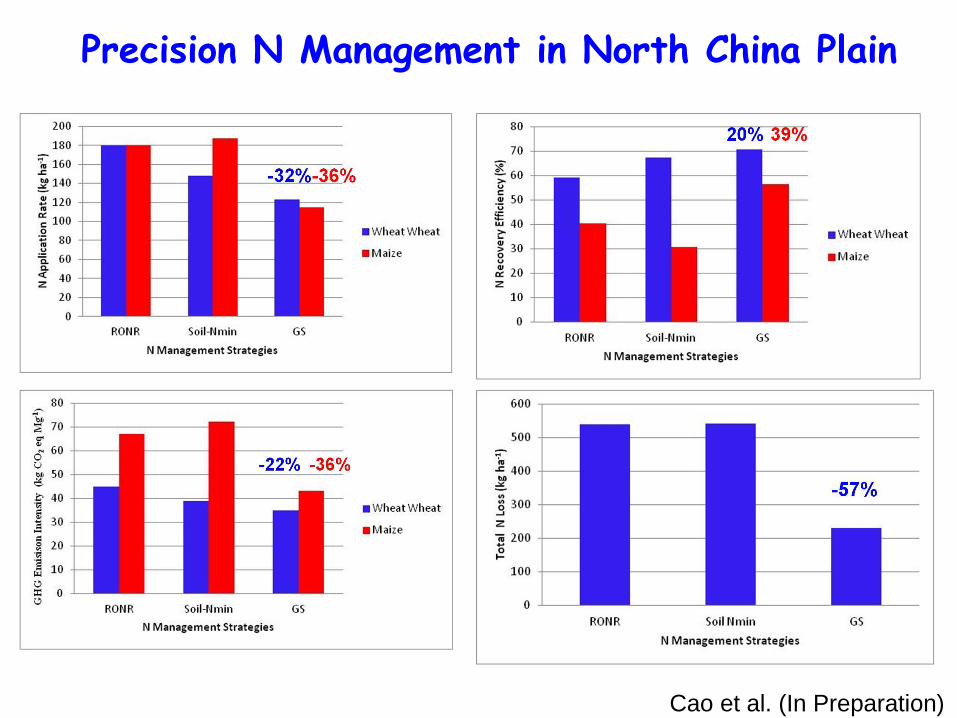
Precision N Management in North China Plain
Cao et al. (In Preparation)
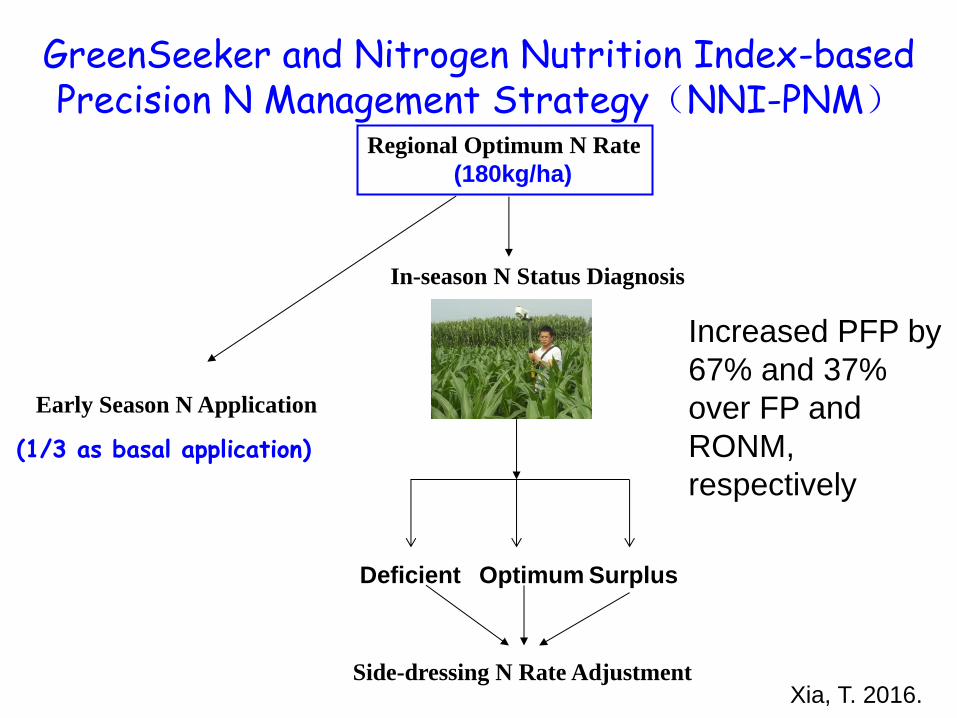
GreenSeeker and Nitrogen Nutrition Index-based Precision N Management Strategy(NNI-PNM)
Regional Optimum N Rate
(180kg/ha)
Early Season N Application
In-season N Status Diagnosis
(1/3 as basal application)
Deficient Optimum Surplus
Side-dressing N Rate Adjustment
Increased PFP by
67% and 37%
over FP and
RONM,
respectively
Xia, T. 2016.
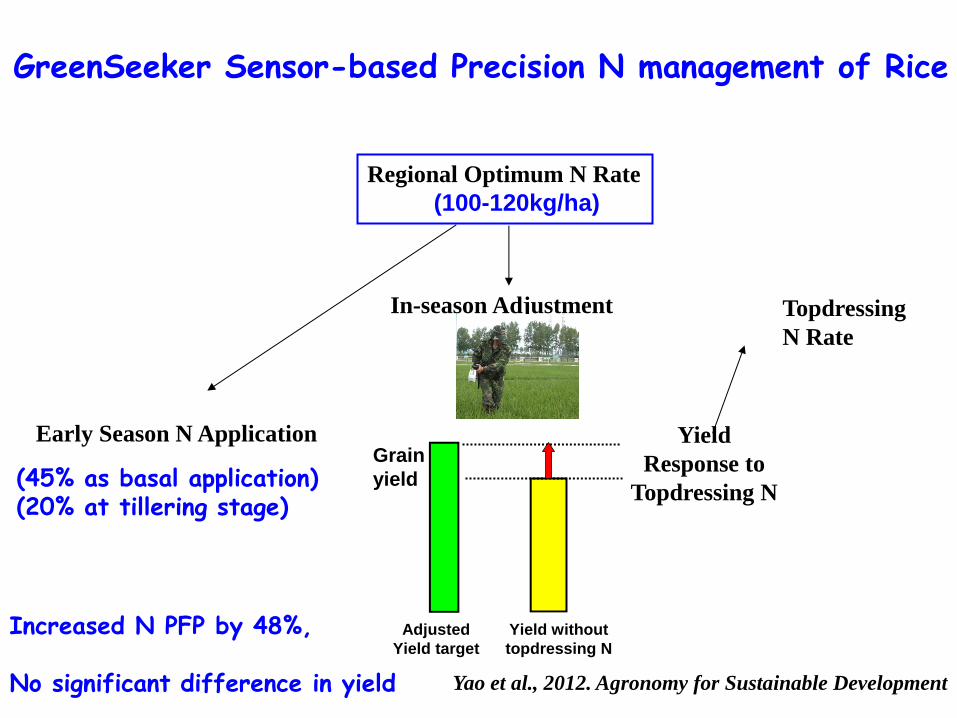
Increased N PFP by 48%, No significant difference in yield Yao et al., 2012. Agronomy for Sustainable Development
Grain
yield
Adjusted
Yield target
Yield without
topdressing N
追肥增产量
Yield
Response to
Topdressing N
Regional Optimum N Rate
(100-120kg/ha)
Early Season N Application
In-season Adjustment
(45% as basal application) (20% at tillering stage)
Topdressing
N Rate
GreenSeeker Sensor-based Precision N management of Rice
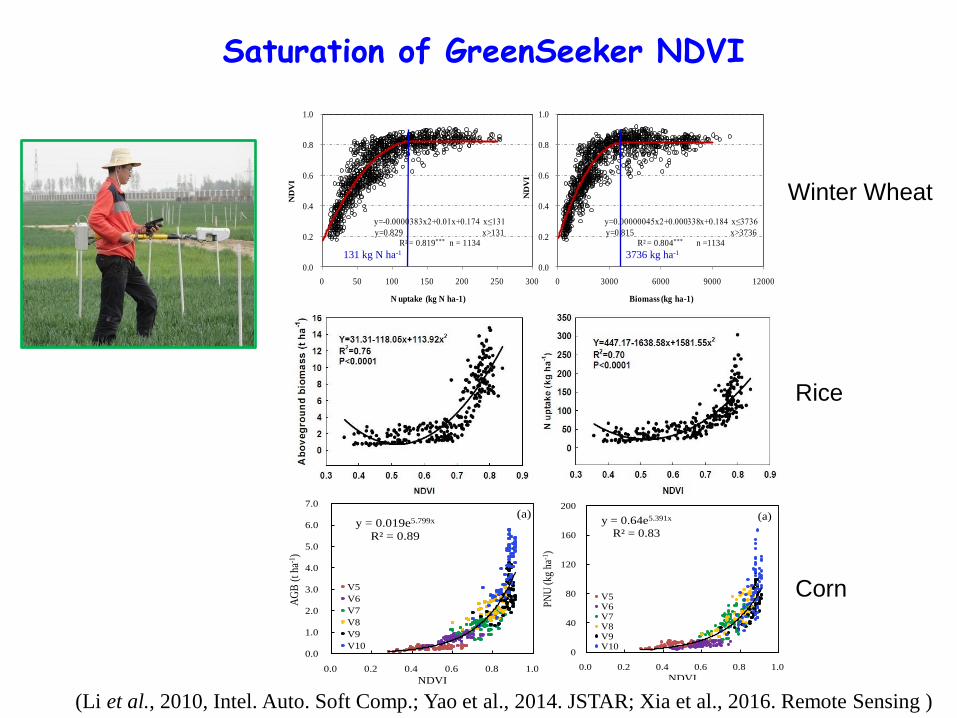
y=-0.0000383x2+0.01x+0.174 x≤131
y=0.829 x>131
R² = 0.819*** n = 1134
0.0
0.2
0.4
0.6
0.8
1.0
0 50 100 150 200 250 300 N
DV
IN uptake (kg N ha-1)
y=0.00000045x2+0.000338x+0.184 x≤3736
y=0.815 x>3736
R² = 0.804*** n =1134
0.0
0.2
0.4
0.6
0.8
1.0
0 3000 6000 9000 12000
ND
VI
Biomass (kg ha-1)
NDVI VS. Plant N Uptake and Biomass
131 kg N ha-1 3736 kg ha-1
y = 0.019e5.799x
R² = 0.89
0.0
1.0
2.0
3.0
4.0
5.0
6.0
7.0
0.0 0.2 0.4 0.6 0.8 1.0
AG
B (
t ha
-1)
NDVI
(a)
V5
V6
V7
V8
V9
V10
y = 0.093x1.338
R² = 0.87
0.0
1.0
2.0
3.0
4.0
5.0
6.0
7.0
0.0 5.0 10.0 15.0 20.0 25.0
AG
B (
t ha
-1)
RVI
(b)
V5
V6
V7
V8
V9
V10
y = 0.64e5.391x
R² = 0.83
0
40
80
120
160
200
0.0 0.2 0.4 0.6 0.8 1.0
PN
U (
kg h
a-1)
NDVI
(a)
V5V6V7V8V9V10
y = 2.629x1.269
R² = 0.84
0
40
80
120
160
200
0.0 5.0 10.0 15.0 20.0 25.0
PN
U (
kg h
a-1)
RVI
(b)
V5
V6
V7
V8
V9
V10
Saturation of GreenSeeker NDVI
(Li et al., 2010, Intel. Auto. Soft Comp.; Yao et al., 2014. JSTAR; Xia et al., 2016. Remote Sensing )
Winter Wheat
Rice
Corn
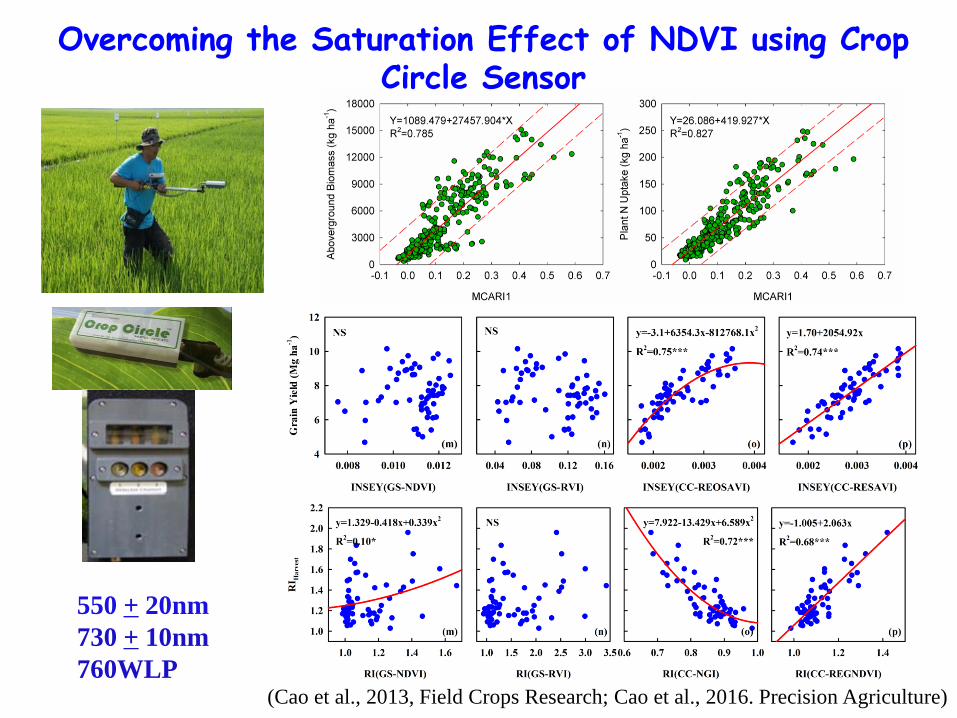
(Cao et al., 2013, Field Crops Research; Cao et al., 2016. Precision Agriculture)
Overcoming the Saturation Effect of NDVI using Crop Circle Sensor
550 + 20nm
730 + 10nm
760WLP
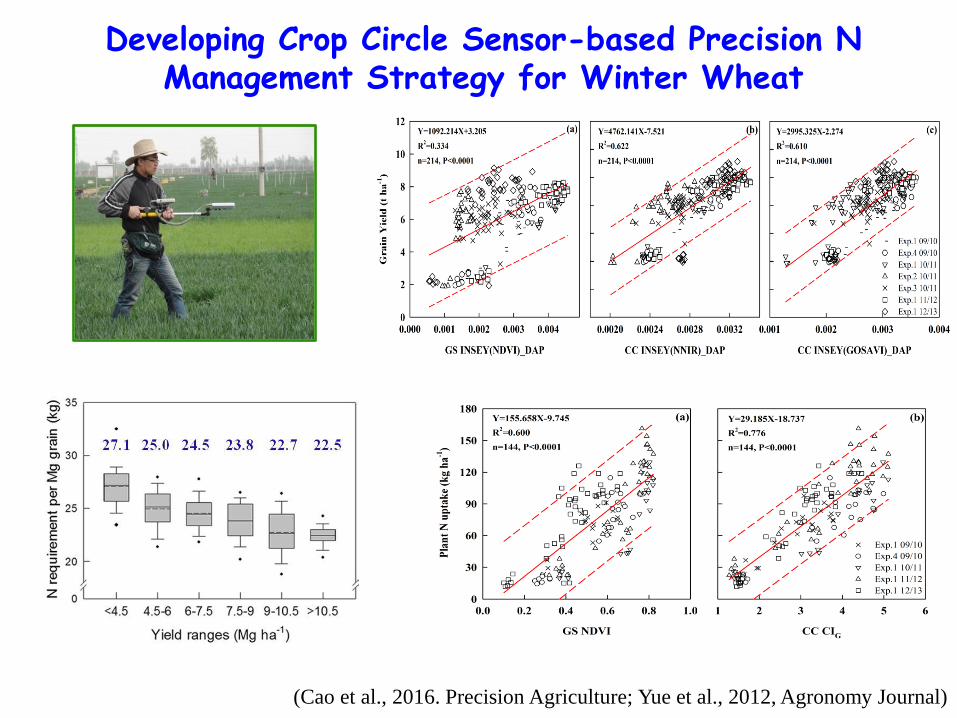
Developing Crop Circle Sensor-based Precision N Management Strategy for Winter Wheat
(Cao et al., 2016. Precision Agriculture; Yue et al., 2012, Agronomy Journal)
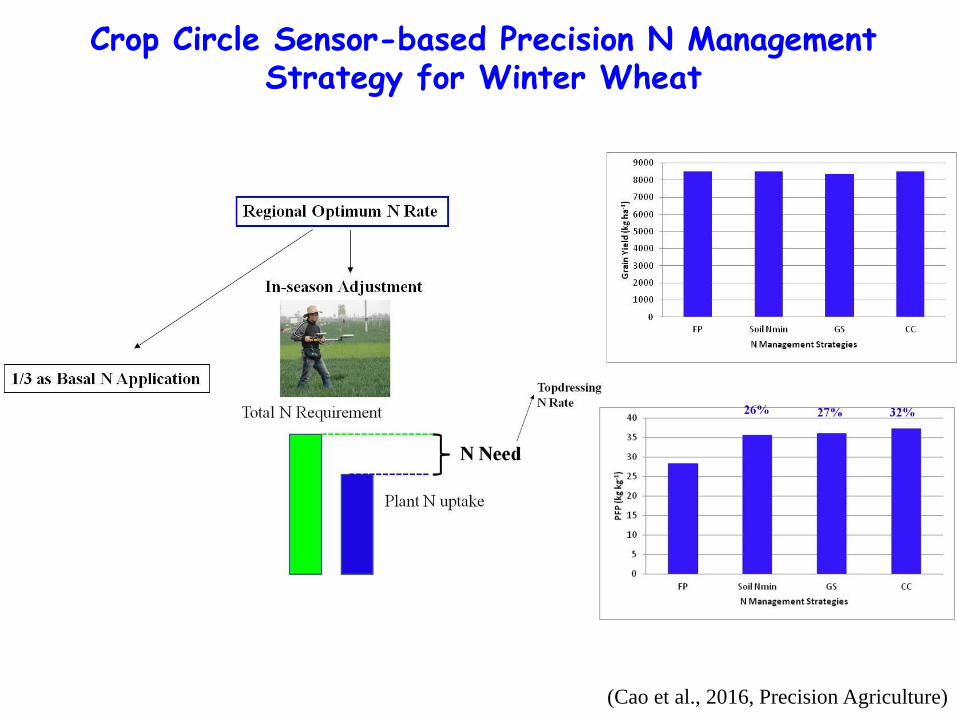
Crop Circle Sensor-based Precision N Management Strategy for Winter Wheat
(Cao et al., 2016, Precision Agriculture)
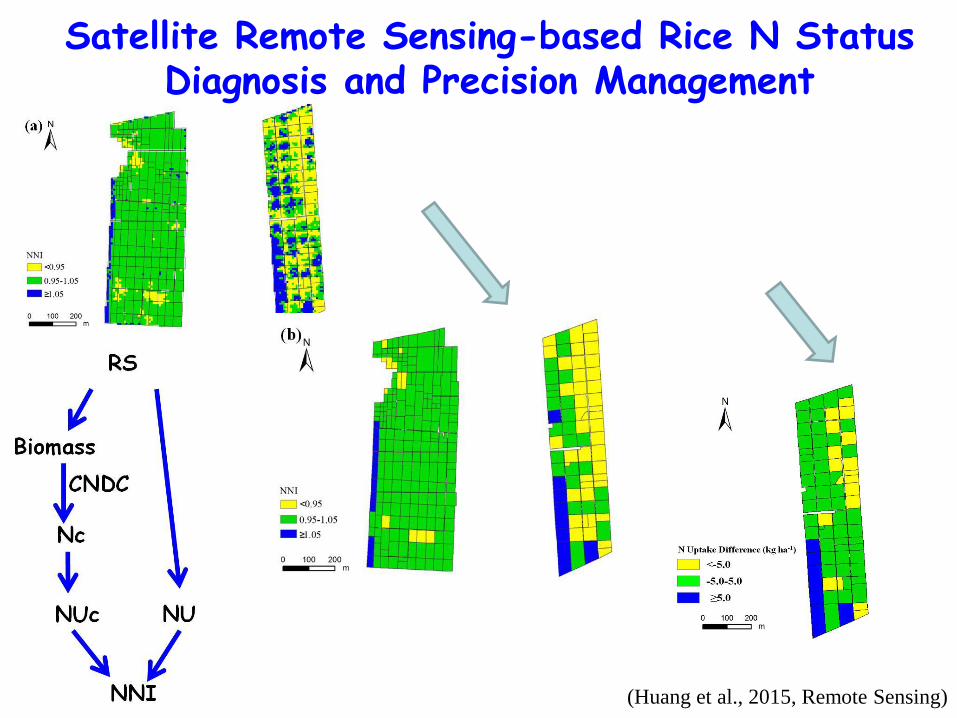
(Huang et al., 2015, Remote Sensing)
Satellite Remote Sensing-based Rice N Status Diagnosis and Precision Management
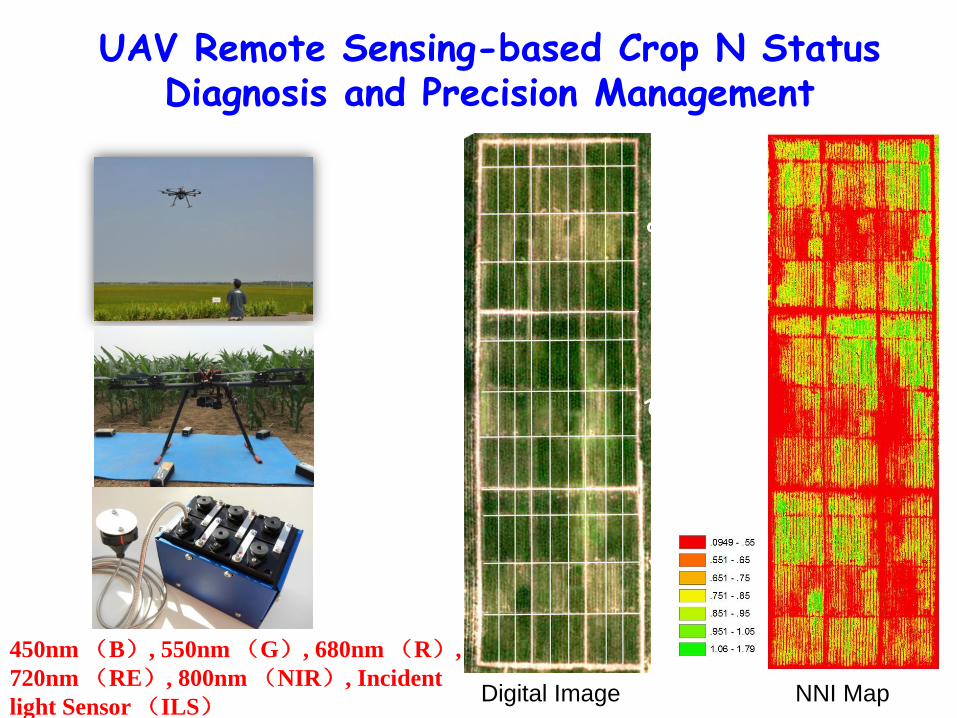
450nm (B), 550nm (G), 680nm (R),
720nm (RE), 800nm (NIR), Incident
light Sensor (ILS)
UAV Remote Sensing-based Crop N Status Diagnosis and Precision Management
Digital Image NNI Map
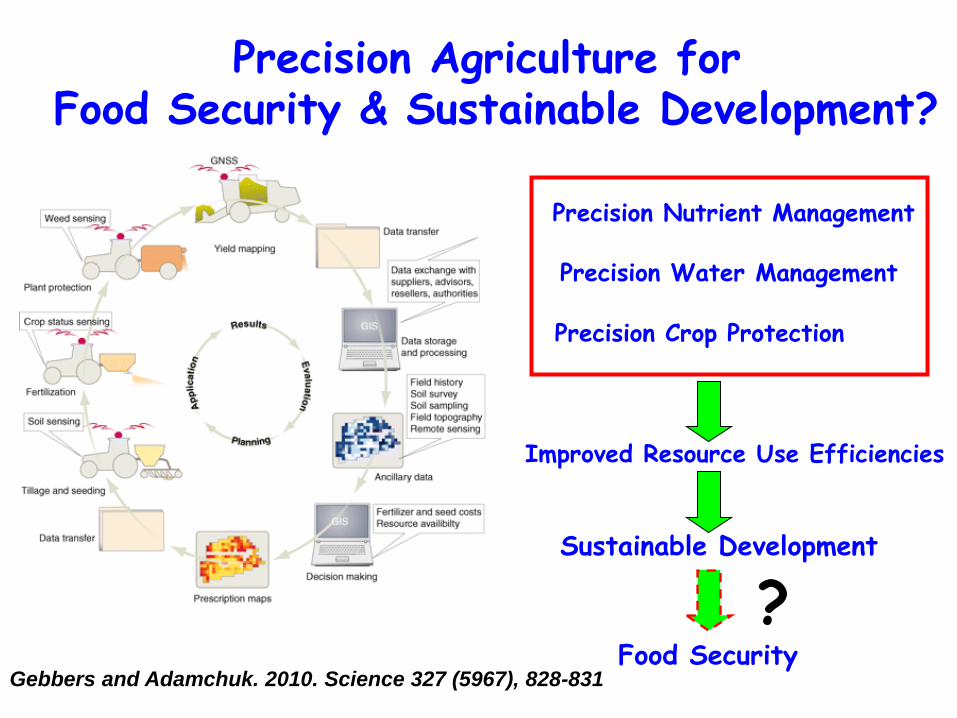
Precision Agriculture for Food Security & Sustainable Development?
Precision Nutrient Management
Precision Water Management
Precision Crop Protection
Gebbers and Adamchuk. 2010. Science 327 (5967), 828-831
Improved Resource Use Efficiencies
Sustainable Development
Food Security
?
Different Scales of Farming
Jiansanjiang, Heilongjiang
Large scale (20-30 ha, 5-10%)
Family Farm
Rice
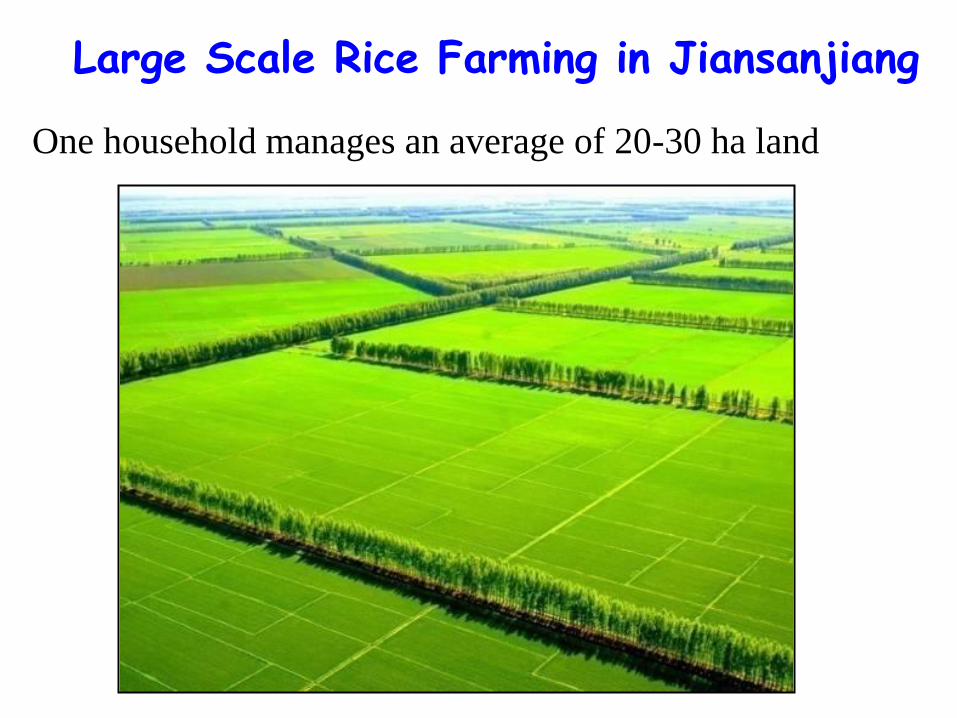
Large Scale Rice Farming in Jiansanjiang
One household manages an average of 20-30 ha land
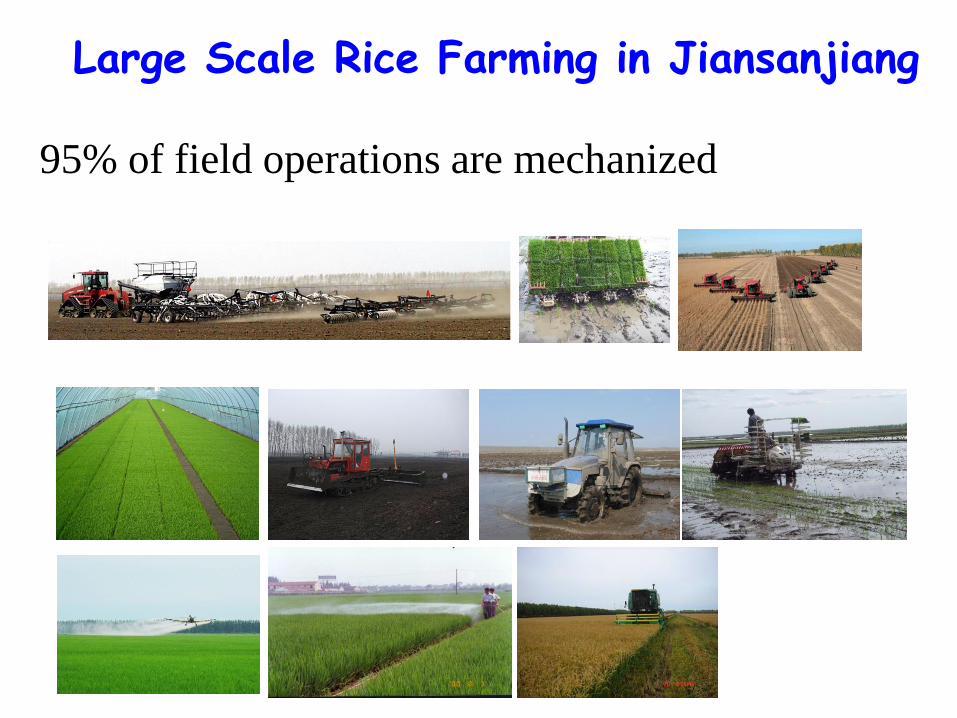
95% of field operations are mechanized
Large Scale Rice Farming in Jiansanjiang
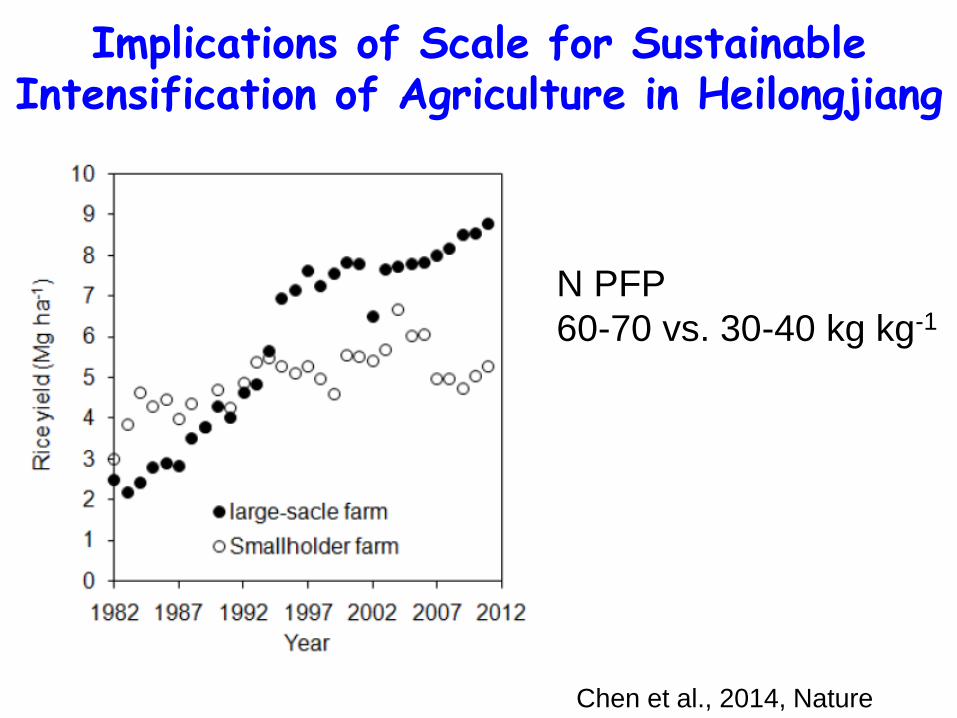
Chen et al., 2014, Nature
N PFP
60-70 vs. 30-40 kg kg-1
Implications of Scale for Sustainable Intensification of Agriculture in Heilongjiang
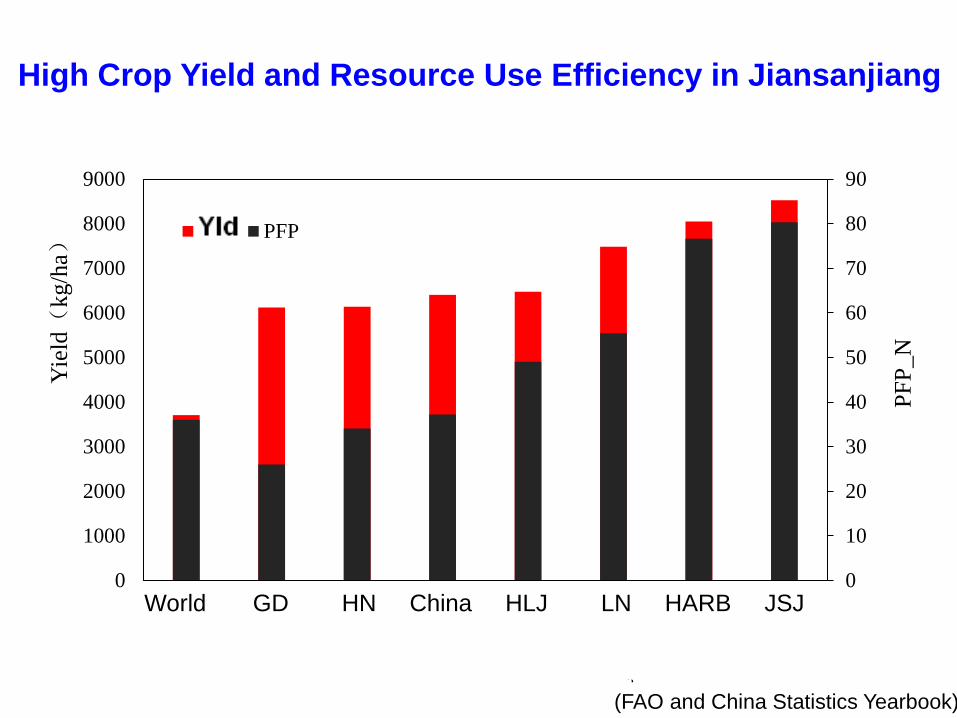
(FAO and China Statistics Yearbook)
High Crop Yield and Resource Use Efficiency in Jiansanjiang Y
ield(
kg/h
a)
PF
P_N
0
10
20
30
40
50
60
70
80
90
0
1000
2000
3000
4000
5000
6000
7000
8000
9000
产量 PFP
World GD HN China HLJ LN HARB JSJ
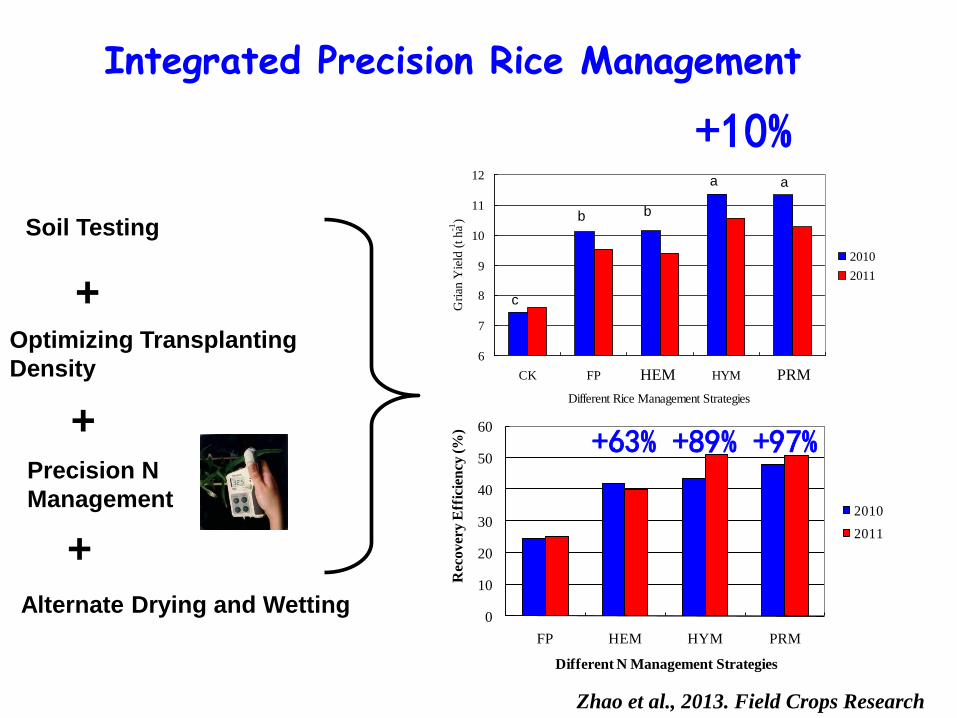
Soil Testing
Precision N
Management
Optimizing Transplanting
Density
Alternate Drying and Wetting
+
+
+
0
10
20
30
40
50
60
FP HEM HYM PRM
Rec
over
y E
ffic
ien
cy (
%)
Different N Management Strategies
2010
2011
+10%
+63% +89% +97%
6
7
8
9
10
11
12
CK FP OWNM HYM IRM
Different Rice Management Strategies
Gri
an Y
ield
(t ha-1
)
2010
2011
aa
bb
c
6
7
8
9
10
11
12
CK FP OWNM HYM IRM
Different Rice Management Strategies
Gri
an Y
ield
(t ha-1
)
2010
2011
aa
bb
c
HEM PRM
Zhao et al., 2013. Field Crops Research
Integrated Precision Rice Management
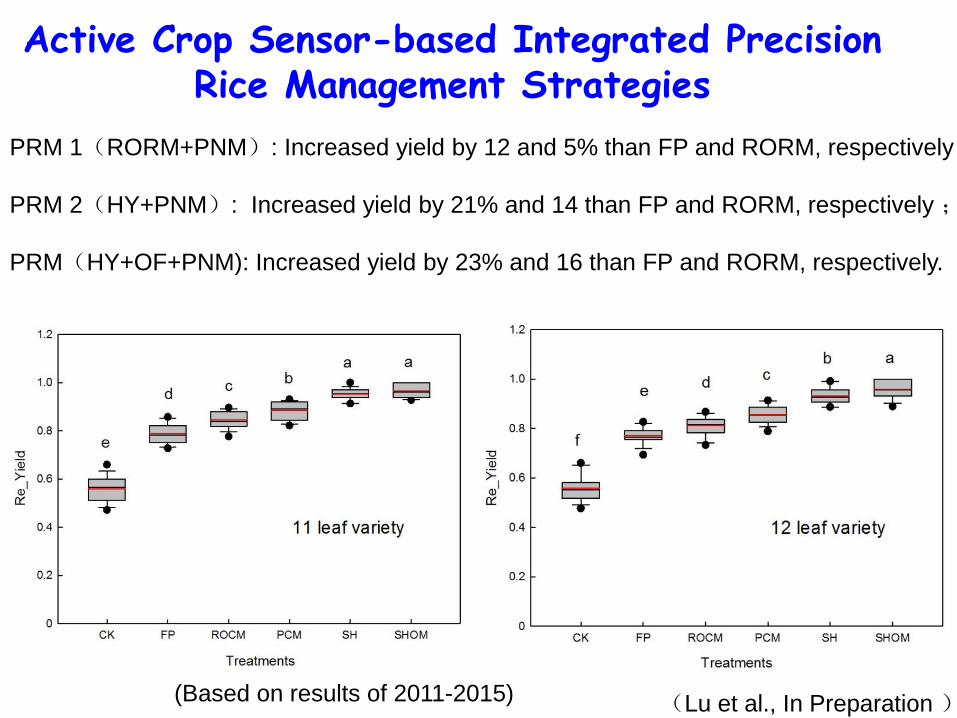
(Lu et al., In Preparation )
PRM 1(RORM+PNM): Increased yield by 12 and 5% than FP and RORM, respectively
PRM 2(HY+PNM): Increased yield by 21% and 14 than FP and RORM, respectively ;
PRM(HY+OF+PNM): Increased yield by 23% and 16 than FP and RORM, respectively.
Active Crop Sensor-based Integrated Precision Rice Management Strategies
(Based on results of 2011-2015)
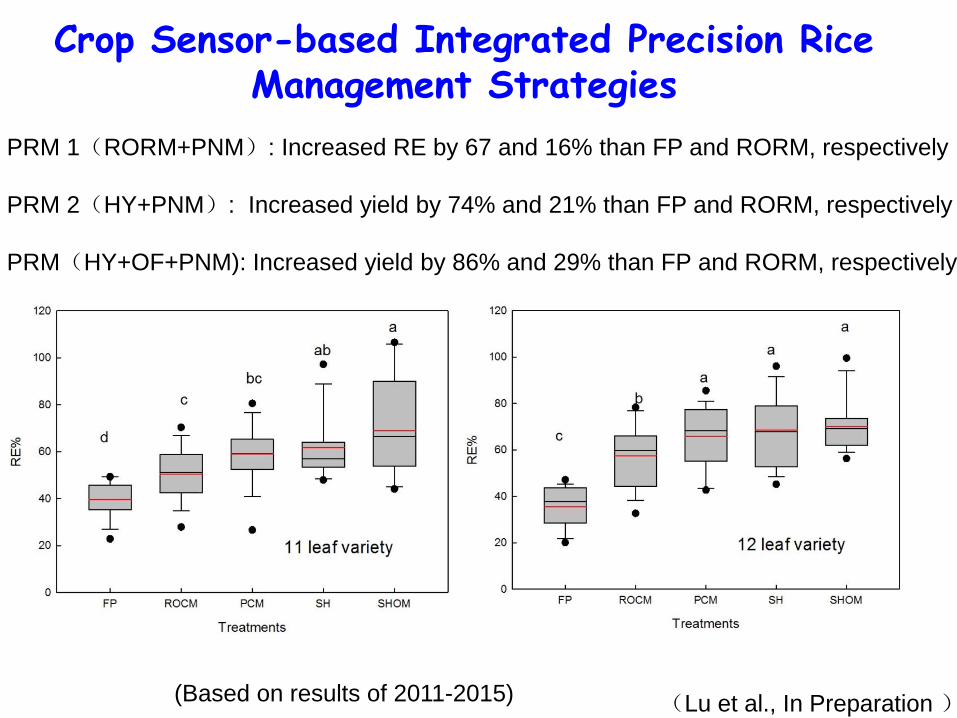
(Lu et al., In Preparation ) (Based on results of 2011-2015)
Crop Sensor-based Integrated Precision Rice Management Strategies
PRM 1(RORM+PNM): Increased RE by 67 and 16% than FP and RORM, respectively
PRM 2(HY+PNM): Increased yield by 74% and 21% than FP and RORM, respectively
PRM(HY+OF+PNM): Increased yield by 86% and 29% than FP and RORM, respectively
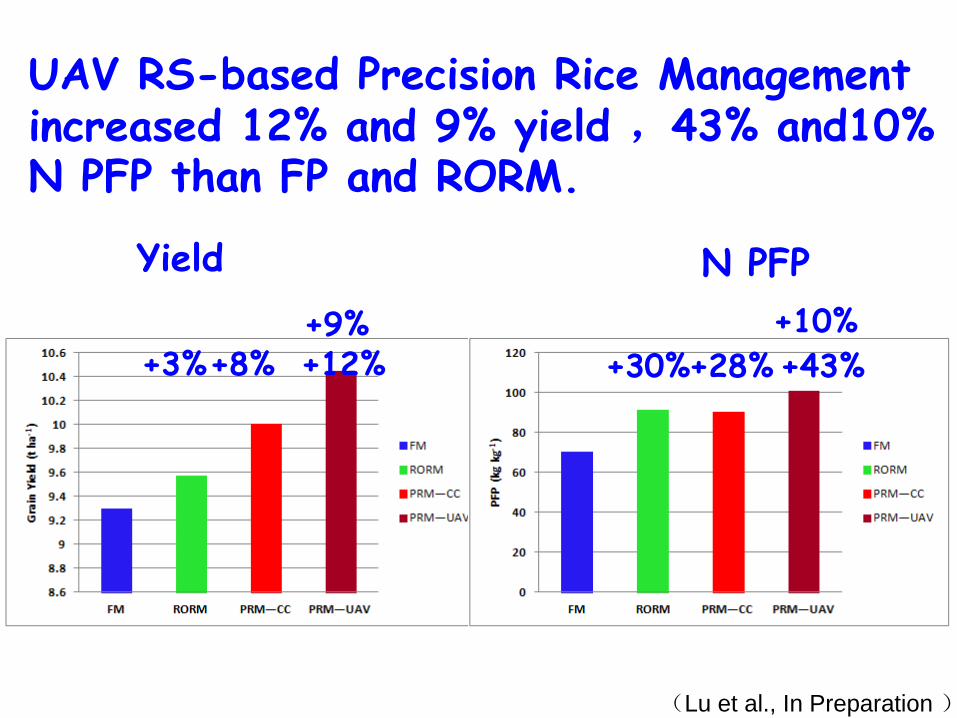
+3% +8% +12% +9%
Yield
+30% +28% +43%
+10%
N PFP
UAV RS-based Precision Rice Management increased 12% and 9% yield ,43% and10% N PFP than FP and RORM.
(Lu et al., In Preparation )
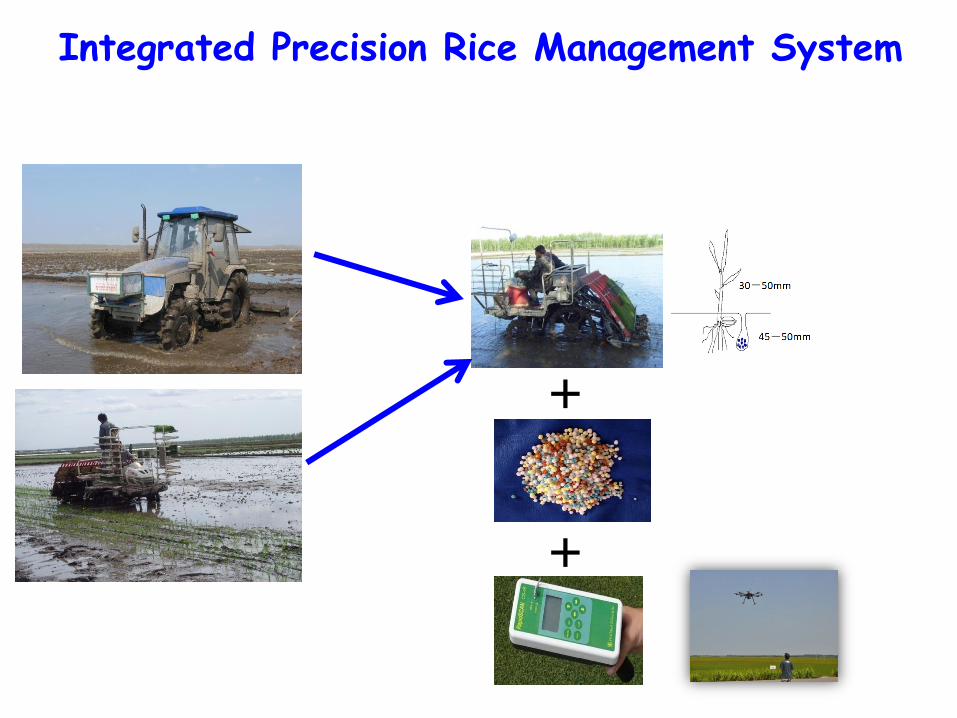
Integrated Precision Rice Management System
+
+
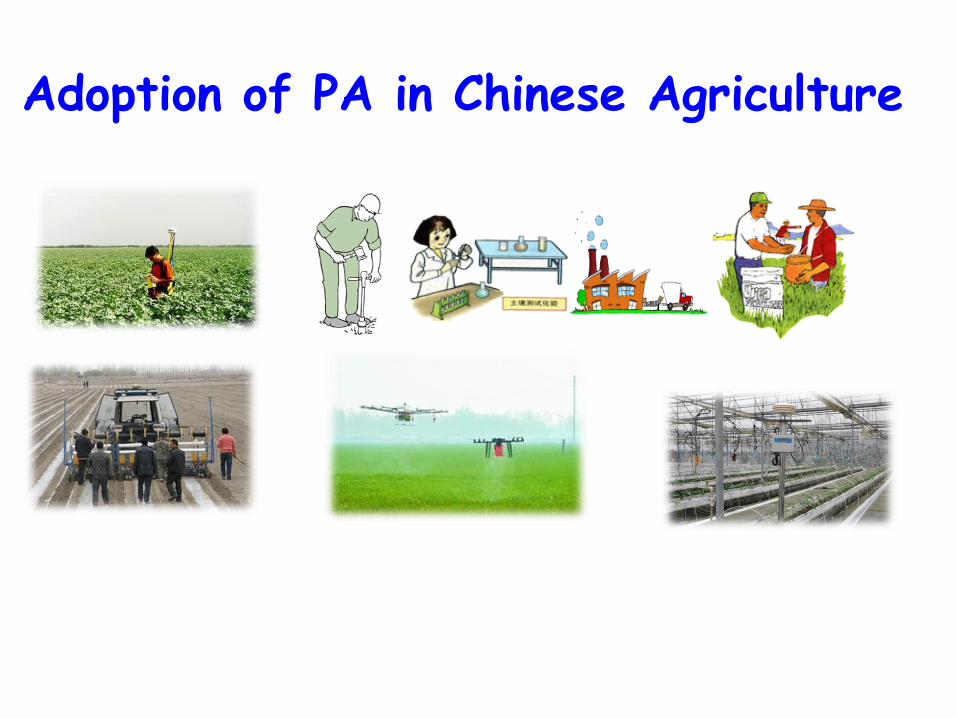
Adoption of PA in Chinese Agriculture
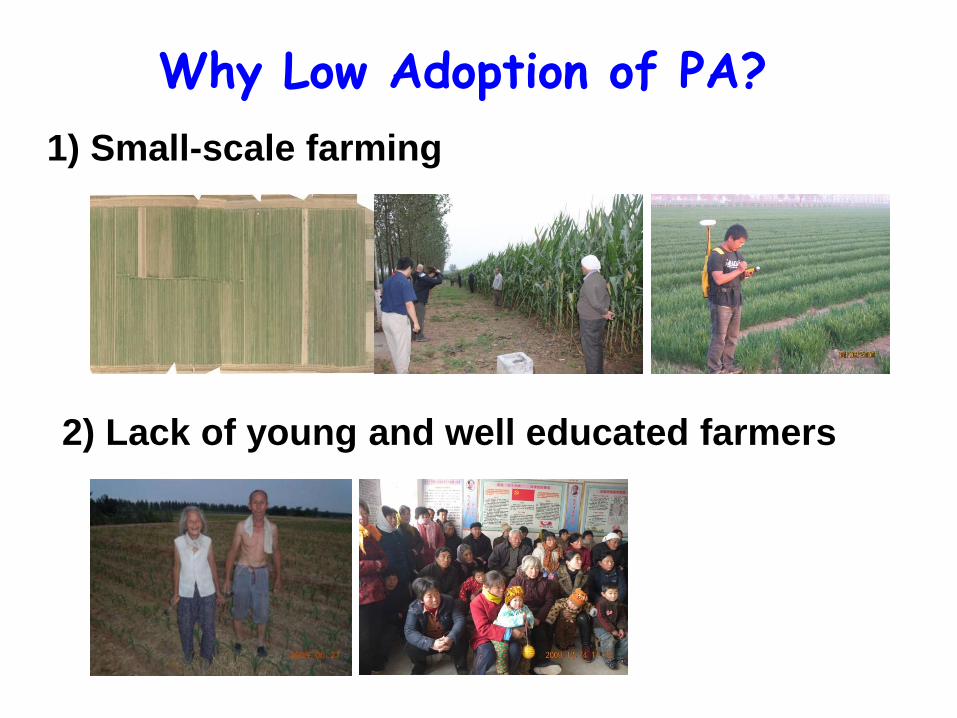
1) Small-scale farming
Why Low Adoption of PA?
2) Lack of young and well educated farmers
Why Low Adoption of PA?
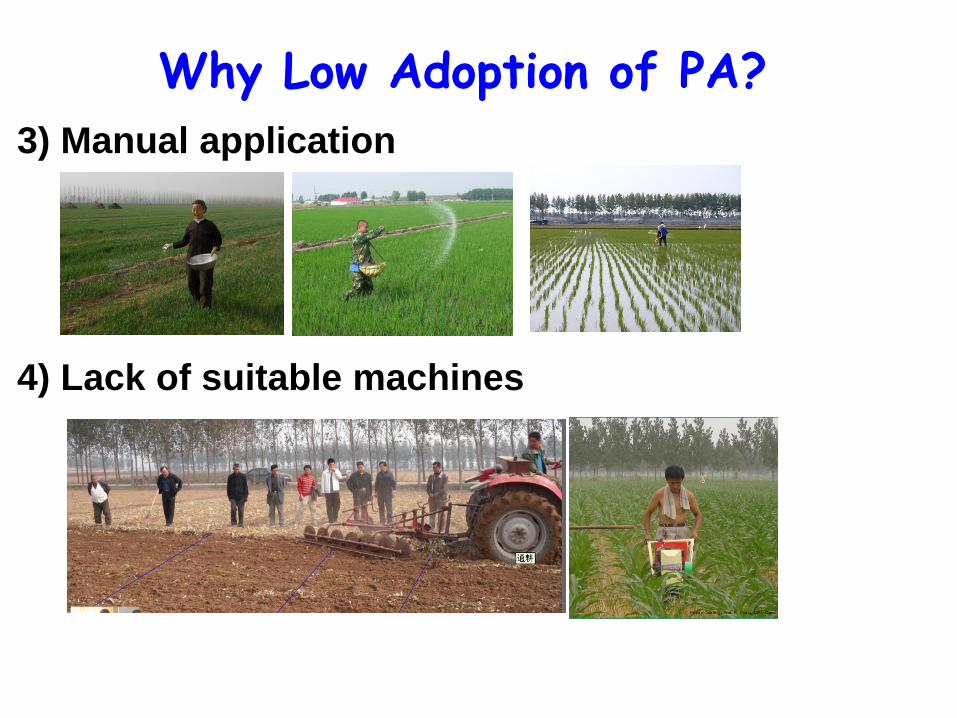
3) Manual application
4) Lack of suitable machines
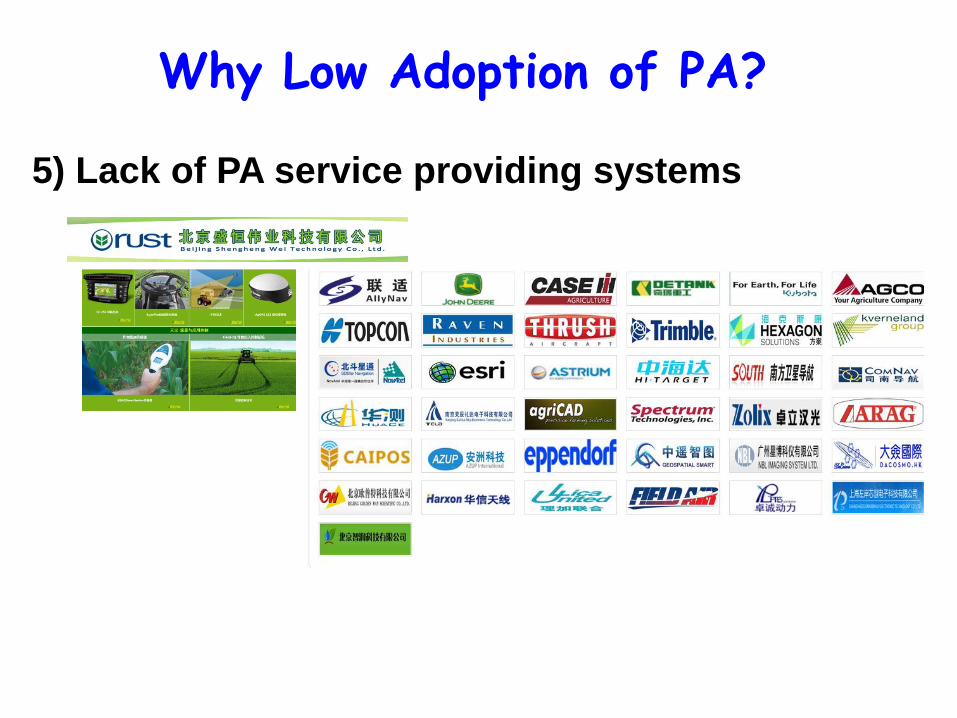
Why Low Adoption of PA?
5) Lack of PA service providing systems
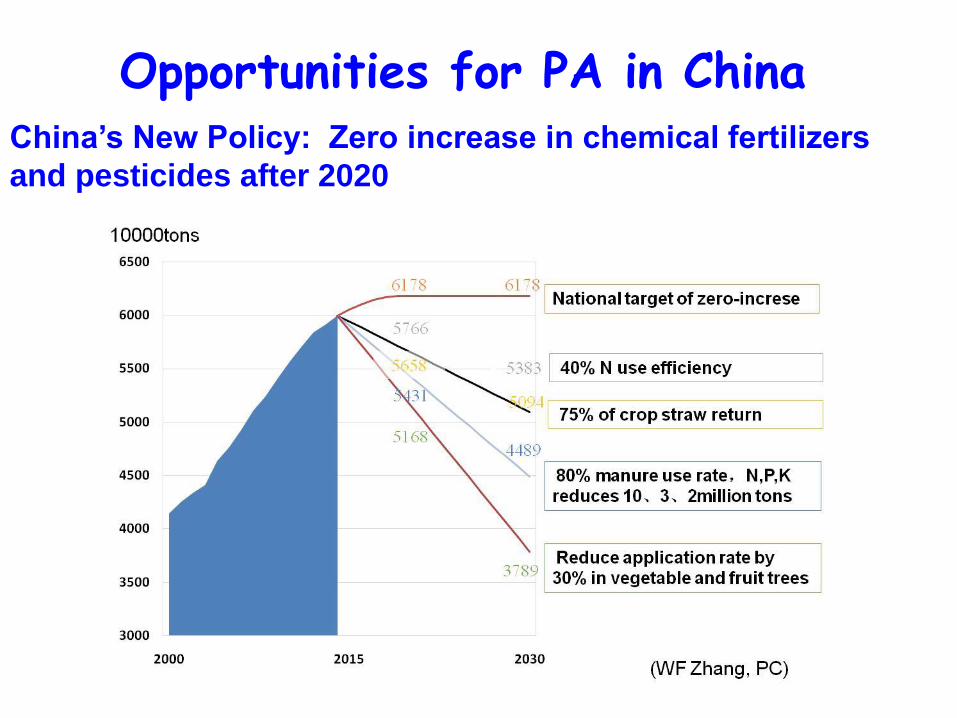
Opportunities for PA in China China’s New Policy: Zero increase in chemical fertilizers
and pesticides after 2020
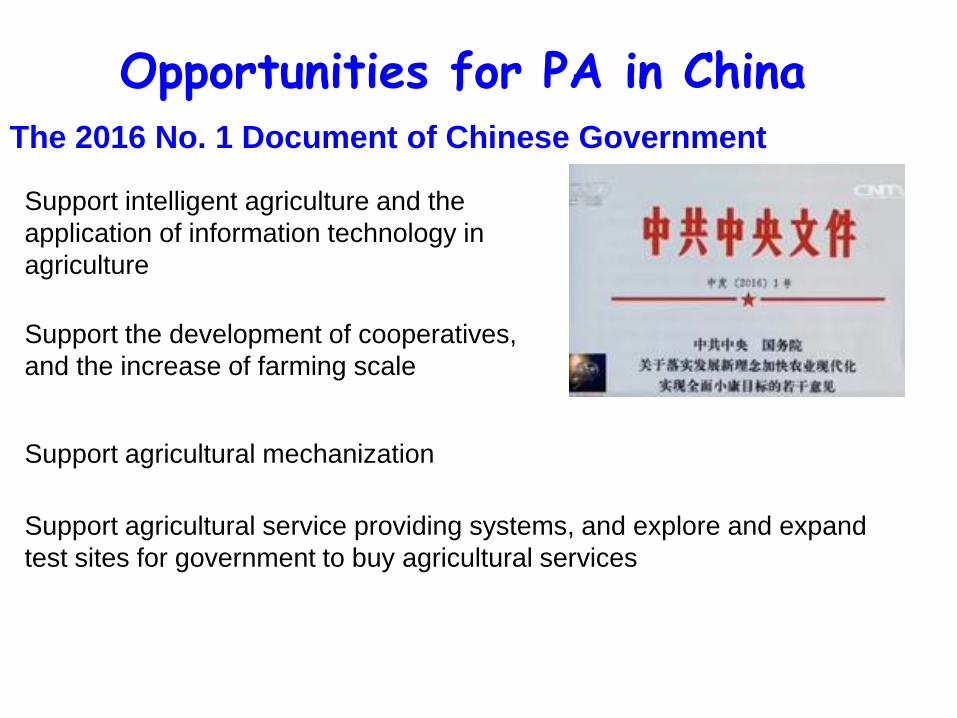
Opportunities for PA in China The 2016 No. 1 Document of Chinese Government
Support intelligent agriculture and the
application of information technology in
agriculture
Support the development of cooperatives,
and the increase of farming scale
Support agricultural mechanization
Support agricultural service providing systems, and explore and expand
test sites for government to buy agricultural services
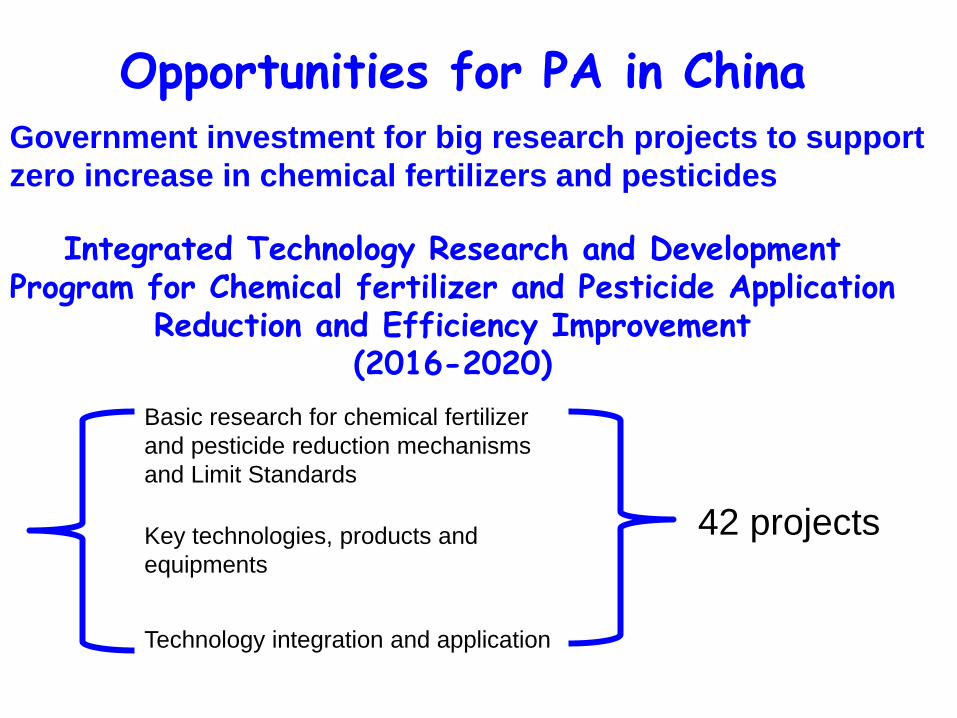
Opportunities for PA in China Government investment for big research projects to support
zero increase in chemical fertilizers and pesticides
Integrated Technology Research and Development Program for Chemical fertilizer and Pesticide Application
Reduction and Efficiency Improvement (2016-2020)
Basic research for chemical fertilizer
and pesticide reduction mechanisms
and Limit Standards
Key technologies, products and
equipments
Technology integration and application
42 projects
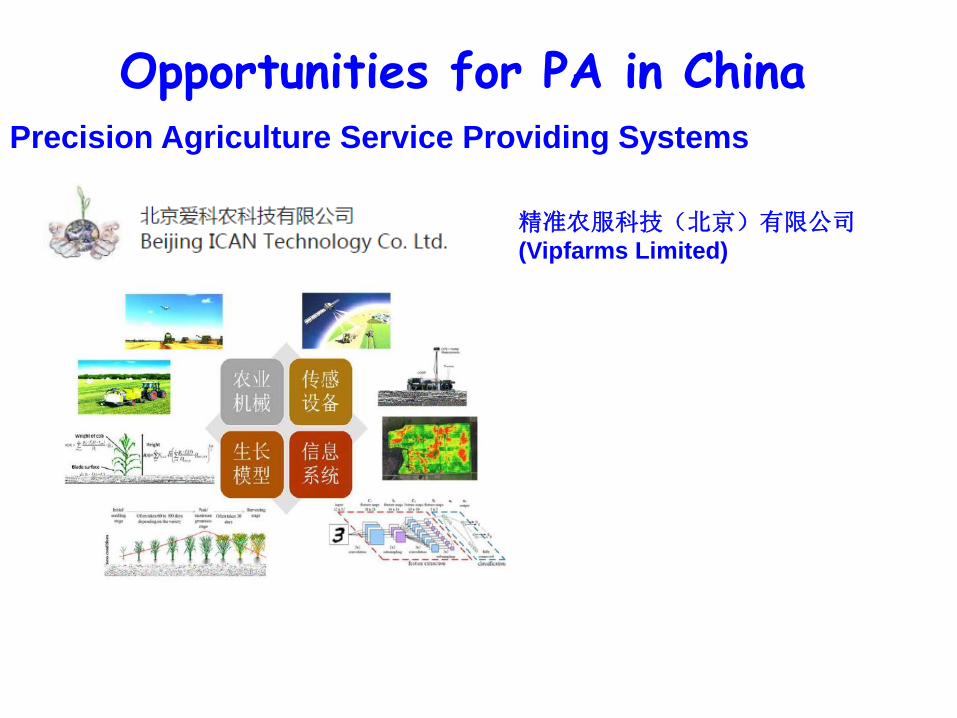
Opportunities for PA in China Precision Agriculture Service Providing Systems
精准农服科技(北京)有限公司
(Vipfarms Limited)

Thanks