Embed Size (px)
Citation preview
Research ArticlePredicting Individual Survival after Curative Esophagectomy forSquamous Cell Carcinoma of Esophageal
Zhiyong Zhao,1 Xiaolong Huang,2 Ting Gu,1 Zhu Chen,2 Limin Gan,3 Biao Zhu ,1
and Ning Wu 4
1Intensive Care Unit, Fudan University Shanghai Cancer Center, Shanghai, China2Intensive Care Unit, The First Affiliated Hospital of Xiamen University, Xiamen, China3Zoe Softe Corp, Ltd., Xiamen, China4Department of Cardio-Thoracic Surgery, Huashan Hospital of Fudan University, Shanghai, China
Correspondence should be addressed to Biao Zhu; [email protected] and Ning Wu; [email protected]
Received 2 February 2021; Revised 1 March 2021; Accepted 9 March 2021; Published 5 April 2021
Academic Editor: Qingyuan Yang
Copyright © 2021 Zhiyong Zhao et al. This is an open access article distributed under the Creative Commons Attribution License,which permits unrestricted use, distribution, and reproduction in any medium, provided the original work is properly cited.
Background. Esophageal cancer is one of the leading causes of cancer-related death worldwide. Despite the significant progress inthe overall treatment of esophageal cancer in recent years, the prognosis for patients who require surgery remains poor. Methods.The present study investigated the clinicopathological features of 503 patients who underwent radical esophagectomy at HuashanHospital of Fudan University between January 2005 and January 2015. Nomograms that predicted the esophageal squamous cellcarcinoma (ESCC) survival rates were established using the Cox proportional hazard regression model. Discrimination andcalibration, which were calculated after bootstrapping, were used as a measure of accuracy. Results. Multivariate analyses wereused to select five independent prognostic variables and build the nomogram. These variables were pathological T stage,pathological N factor, rate of positive LNs, history of chronic obstructive pulmonary disease (COPD) and postoperative sepsis.The nomogram was built to predict the rates for overall survival (OS) and disease-free survival (DFS). The concordance index forthe nomogram prediction for OS and DFS was 0.720 and 0.707, respectively. Compared to the conventional TNM staging system,the nomogram had better predictive accuracy for survival (OS 0.720 vs. 0.672, P < 0:001; DFS 0.707 vs. 0.667; P < 0:001).Conclusions. The present study incorporated pathological T stage, pathological N factor, rate of positive LNs, history of COPD,and postoperative sepsis into a nomogram to predict the OS and DFS of ESCC patients. This practical system may help cliniciansin both decision-making and clinical study design. The assessment of lung function for patients with COPD preoperative, and thecontrol of disease progression are needed. Furthermore, the postoperative infection of patients should be controlled. Furtherstudies may help to extend the validation of this method and improve the model through parameter optimization.
1. Introduction
Esophageal cancer is one of the leading causes of cancer-related death worldwide [1]. Despite the significant progressin the overall treatment of esophageal cancer in recent years,the prognosis for patients who require surgery remains poor.The establishment of an accurate cancer staging systemwould be valuable for both the provision of informationand in guiding patient follow-up and subsequent treatments.The most commonly used staging system for esophagealsquamous cell carcinoma (ESCC) is the tumor node metasta-sis (TNM) classification system from the 7th edition of the
American Joint Committee on Cancer (AJCC). However,studies have demonstrated that other clinicopathologicalfactors, such as lymph node ratio [2–4], comorbidities [5,6], and postoperative complications [2], are also significantprognostic variables. Furthermore, there are no models thatcan concurrently take comorbidities and postoperative com-plications into account in constructing an accurate predictivemodel. Hence, the present study is aimed at assessing thecomorbidities and postoperative complications in patientswith esophageal cancer and designing a nomogram for theprediction of long-term survival in patients with resectedESCC. To the best of the knowledge of the authors, the
HindawiGastroenterology Research and PracticeVolume 2021, Article ID 5595718, 10 pageshttps://doi.org/10.1155/2021/5595718
present study is the first to attempt to establish an ESCCnomogram based on comorbidities and postoperativecomplications using a relatively large cohort of patients.
2. Materials and Methods
A total of 503 patients participated in the present study.These patients underwent potential curative esophagectomyfor squamous cell carcinoma of the esophagus betweenJanuary 2005 and January 2015 in Huashan Hospital atFudan University, which is a tertiary referral center withsignificant experience in esophageal surgery. The patientsin the present study (1) underwent transthoracic esopha-gectomy with mediastinal and two-field abdominal lymph-adenectomy with R0 resection, (2) had no in-hospitalmortality, and (3) did not have other malignancies ordistant metastases. The surgical methods used have beenpreviously described [7].
The collected patient information included the demo-graphic information such as age, gender, body mass index(BMI), tobacco use, alcohol use, preoperative albumin,preoperative platelet, preoperative white blood cell (WBC),and preoperative neutrophil to lymphocyte ratio (NLR).Additional variables included comorbidities, clinicopatho-logical features, postoperative complications, and survival.
The comorbidities were identified during the preopera-tive evaluation of the physician or other healthcare profes-sional notes and subsequently confirmed via appropriatemedical tests. These comorbidities included history of cardio-vascular disease (previous myocardial infarction, heart fail-ure, peripheral arterial disease, or cerebrovascular disease),history of chronic obstructive pulmonary disease (COPD)[6], history of hepatitis, history of hypertension, and historyof diabetes (with or without complications). Renal comorbid-ities were too rare to include in the statistical analyses.
The clinicopathological factors were evaluated in accor-dance to the guidelines for clinical and pathological studieson carcinoma of the esophagus. The tumor staging was basedon the TNM classification specified by the InternationalUnion Against Cancer [8], and depth of invasion and lymphnode metastasis were determined based on from the pathol-ogy of the surgically resected specimens. The postoperativepathological T (pT), N (pN), and Stage (pStage) factors wereused for all cases. For patients who received preoperativetherapy, the depth of invasion was determined through boththe microscopic distribution of viable cancers, and the scartissue and disappearance of normal structures, such as thelamina propria and proper muscular layer.
The 7th edition of the AJCC recommends removing asufficient number of LNs during the operation, and the detec-tion of at least 12 nodes. However, in clinical practice, due tovarious factors such as individual physical condition, operat-ing conditions, and pathological diagnosis, it remains diffi-cult to ensure the removal of a sufficient number of LNsfrom each patient. Hence, this may result in the stage migra-tion phenomenon. The metastatic lymph node ratio is theratio of metastatic LNs to the number of total detected LNs,which may be affected by variability during detection. Thisvariable was included in the present study.
The present study evaluated the postoperative complica-tions that developed within 30 days after esophagectomy,which required either medication or surgical intervention.A postoperative pulmonary complication was defined as thepresence of one or more of the following postoperativeconditions: initial ventilator support for more than 48 hoursor reintubation for respiratory failure, the need for tracheos-tomy, pneumonia, or acute respiratory distress syndrome(ARDS). Postoperative anastomotic leakage was defined interms of the clinical signs of leaking, such as erythema, skinedema, emission of pus from a surgical wound or cervicaldrain, or a radiographically apparent leak confirmed byperforming an esophagography or computed tomography,or both. Cardiovascular morbidity was defined as the pres-ence of any cardiac disease or cerebrovascular disease, suchas arrhythmia, ischemic heart disease, or pericardial fluid col-lection, which required pharmacological, electrical, or inter-ventional treatment, or the presence of any thrombosis inline with the common terminology criteria for adverse events(CTCAE) version 4.03 [2]. Sepsis was defined as clinical signsof SIRS along with a culture or visually identified infection.
2.1. Statistical Analysis. The statistical analyses were per-formed using the statistical package R for Windows (version3.4.2, http://www.r-project.org/). For the purpose of develop-ing the nomograms, the outcome predictor was developedwith the clinical experience of the authors, as well as throughthe search of prior literature. Quantitative data wereexpressed in median and interquartile range (IQR), and cat-egorical data were expressed numerically and in percentage.The Kaplan-Meier method was used to estimate the OS andDFS. Cox regression analysis was used for the univariateand multivariate analyses. Variables with a P value of <0.05in the univariate analysis were subjected to the multivariableCox regression analysis. A final model selection was per-formed using backward stepwise regression with Akaike’sInformation Criterion (AIC) [9]. Furthermore, the graphicalassessment of proportional hazards assumptions and the testof nonlinear terms for significance using analysis of variance(ANOVA) were performed. A nomogram was formulatedbased on the results of the multivariate analysis using therms statistical package [10].
Discrimination and calibration were used to test theaccuracy of the nomograms. The discrimination of thenomogram was measured using a concordance index (C-index) and the bootstrap bias-corrected estimates of the C-index. Calibration curves, which measure the relationshipbetween the outcomes predicted by the models and theobserved outcomes in the patients, were used to assess cali-bration accuracy in predicting the probability of the overallsurvival probability and progression-free survival probabilityfor 1, 3, and 5 years. These analyses were performed using abootstrapping strategy with 200 replications. The nomogramand pathological staging systems were compared using thercorrp.cens package.
The total points for each patient were calculated accord-ing to the established nomogram. Three groups of patientswith high, moderate, and low risk of survival were delineatedusing maximally selected rank statistics, as implemented in
2 Gastroenterology Research and Practice
the Maxstat package [11]. The survival curves were drawnusing the Kaplan-Meier method. Finally, with the risk groupas a factor, these were compared using log-rank test.
All statistical tests were two-sided, and P values of <0.05were considered statistically significant.
3. Results
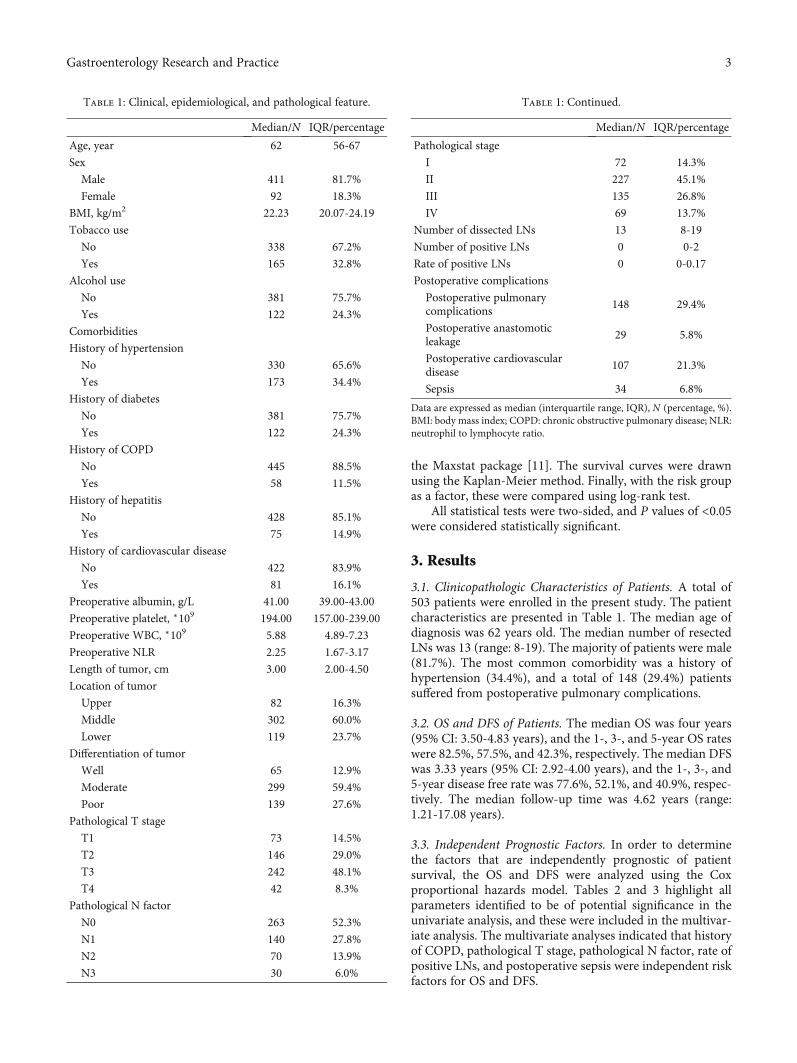
3.1. Clinicopathologic Characteristics of Patients. A total of503 patients were enrolled in the present study. The patientcharacteristics are presented in Table 1. The median age ofdiagnosis was 62 years old. The median number of resectedLNs was 13 (range: 8-19). The majority of patients were male(81.7%). The most common comorbidity was a history ofhypertension (34.4%), and a total of 148 (29.4%) patientssuffered from postoperative pulmonary complications.
3.2. OS and DFS of Patients. The median OS was four years(95% CI: 3.50-4.83 years), and the 1-, 3-, and 5-year OS rateswere 82.5%, 57.5%, and 42.3%, respectively. The median DFSwas 3.33 years (95% CI: 2.92-4.00 years), and the 1-, 3-, and5-year disease free rate was 77.6%, 52.1%, and 40.9%, respec-tively. The median follow-up time was 4.62 years (range:1.21-17.08 years).
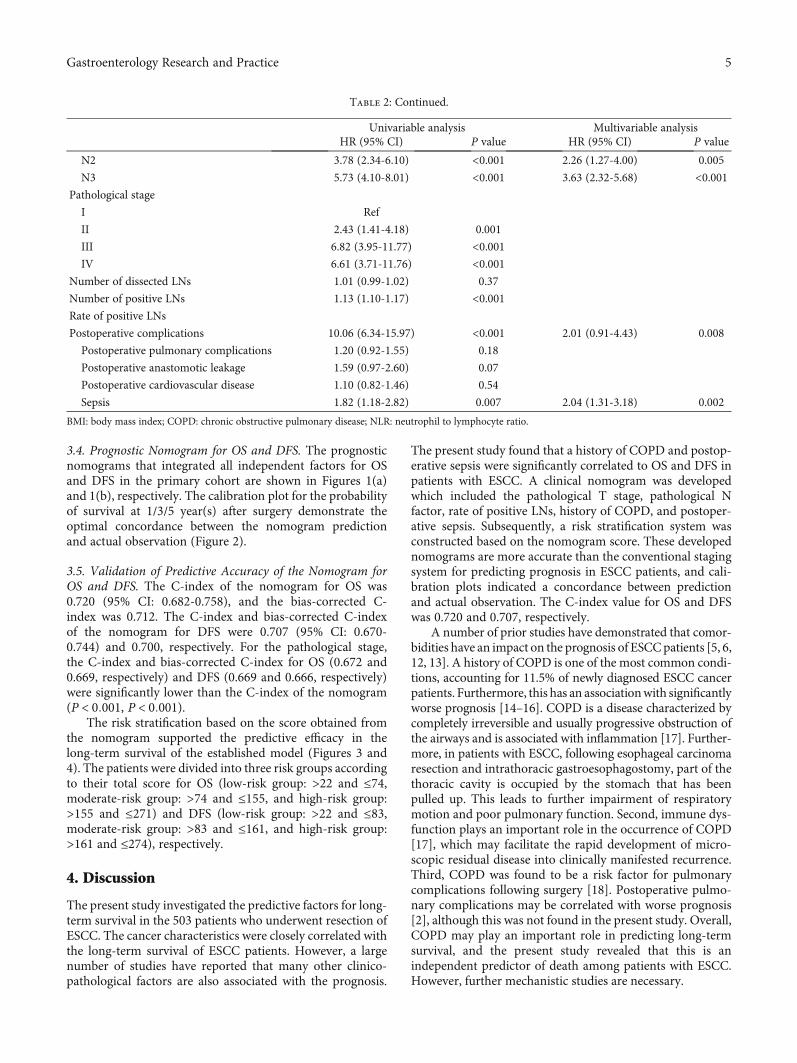
3.3. Independent Prognostic Factors. In order to determinethe factors that are independently prognostic of patientsurvival, the OS and DFS were analyzed using the Coxproportional hazards model. Tables 2 and 3 highlight allparameters identified to be of potential significance in theunivariate analysis, and these were included in the multivar-iate analysis. The multivariate analyses indicated that historyof COPD, pathological T stage, pathological N factor, rate ofpositive LNs, and postoperative sepsis were independent riskfactors for OS and DFS.
Table 1: Clinical, epidemiological, and pathological feature.
Median/N IQR/percentage
Age, year 62 56-67
Sex
Male 411 81.7%
Female 92 18.3%
BMI, kg/m2 22.23 20.07-24.19
Tobacco use
No 338 67.2%
Yes 165 32.8%
Alcohol use
No 381 75.7%
Yes 122 24.3%
Comorbidities
History of hypertension
No 330 65.6%
Yes 173 34.4%
History of diabetes
No 381 75.7%
Yes 122 24.3%
History of COPD
No 445 88.5%
Yes 58 11.5%
History of hepatitis
No 428 85.1%
Yes 75 14.9%
History of cardiovascular disease
No 422 83.9%
Yes 81 16.1%
Preoperative albumin, g/L 41.00 39.00-43.00
Preoperative platelet, ∗109 194.00 157.00-239.00
Preoperative WBC, ∗109 5.88 4.89-7.23
Preoperative NLR 2.25 1.67-3.17
Length of tumor, cm 3.00 2.00-4.50
Location of tumor
Upper 82 16.3%
Middle 302 60.0%
Lower 119 23.7%
Differentiation of tumor
Well 65 12.9%
Moderate 299 59.4%
Poor 139 27.6%
Pathological T stage
T1 73 14.5%
T2 146 29.0%
T3 242 48.1%
T4 42 8.3%
Pathological N factor
N0 263 52.3%
N1 140 27.8%
N2 70 13.9%
N3 30 6.0%
Table 1: Continued.
Median/N IQR/percentage
Pathological stage
I 72 14.3%
II 227 45.1%
III 135 26.8%
IV 69 13.7%
Number of dissected LNs 13 8-19
Number of positive LNs 0 0-2
Rate of positive LNs 0 0-0.17
Postoperative complications
Postoperative pulmonarycomplications
148 29.4%
Postoperative anastomoticleakage
29 5.8%
Postoperative cardiovasculardisease
107 21.3%
Sepsis 34 6.8%
Data are expressed as median (interquartile range, IQR), N (percentage, %).BMI: body mass index; COPD: chronic obstructive pulmonary disease; NLR:neutrophil to lymphocyte ratio.
3Gastroenterology Research and Practice
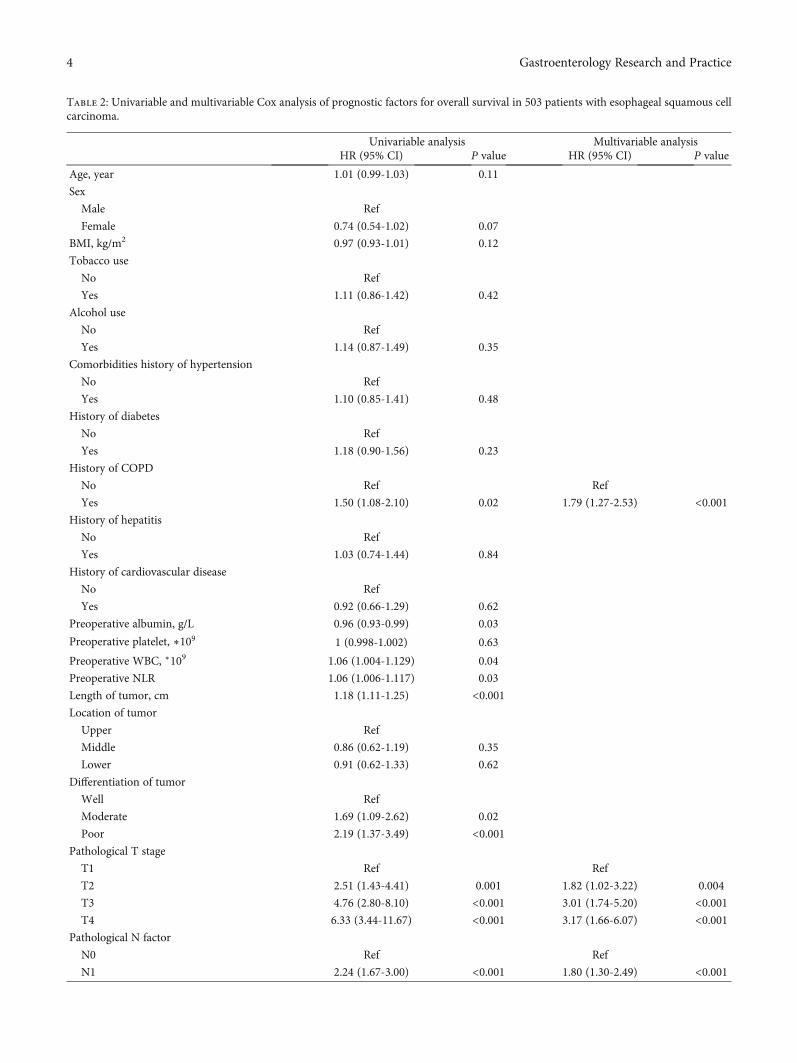
Table 2: Univariable and multivariable Cox analysis of prognostic factors for overall survival in 503 patients with esophageal squamous cellcarcinoma.
Univariable analysis Multivariable analysisHR (95% CI) P value HR (95% CI) P value
Age, year 1.01 (0.99-1.03) 0.11
Sex
Male Ref
Female 0.74 (0.54-1.02) 0.07
BMI, kg/m2 0.97 (0.93-1.01) 0.12
Tobacco use
No Ref
Yes 1.11 (0.86-1.42) 0.42
Alcohol use
No Ref
Yes 1.14 (0.87-1.49) 0.35
Comorbidities history of hypertension
No Ref
Yes 1.10 (0.85-1.41) 0.48
History of diabetes
No Ref
Yes 1.18 (0.90-1.56) 0.23
History of COPD
No Ref Ref
Yes 1.50 (1.08-2.10) 0.02 1.79 (1.27-2.53) <0.001History of hepatitis
No Ref
Yes 1.03 (0.74-1.44) 0.84
History of cardiovascular disease
No Ref
Yes 0.92 (0.66-1.29) 0.62
Preoperative albumin, g/L 0.96 (0.93-0.99) 0.03
Preoperative platelet, ∗109 1 (0.998-1.002) 0.63
Preoperative WBC, ∗109 1.06 (1.004-1.129) 0.04
Preoperative NLR 1.06 (1.006-1.117) 0.03
Length of tumor, cm 1.18 (1.11-1.25) <0.001Location of tumor
Upper Ref
Middle 0.86 (0.62-1.19) 0.35
Lower 0.91 (0.62-1.33) 0.62
Differentiation of tumor
Well Ref
Moderate 1.69 (1.09-2.62) 0.02
Poor 2.19 (1.37-3.49) <0.001Pathological T stage
T1 Ref Ref
T2 2.51 (1.43-4.41) 0.001 1.82 (1.02-3.22) 0.004
T3 4.76 (2.80-8.10) <0.001 3.01 (1.74-5.20) <0.001T4 6.33 (3.44-11.67) <0.001 3.17 (1.66-6.07) <0.001
Pathological N factor
N0 Ref Ref
N1 2.24 (1.67-3.00) <0.001 1.80 (1.30-2.49) <0.001
4 Gastroenterology Research and Practice
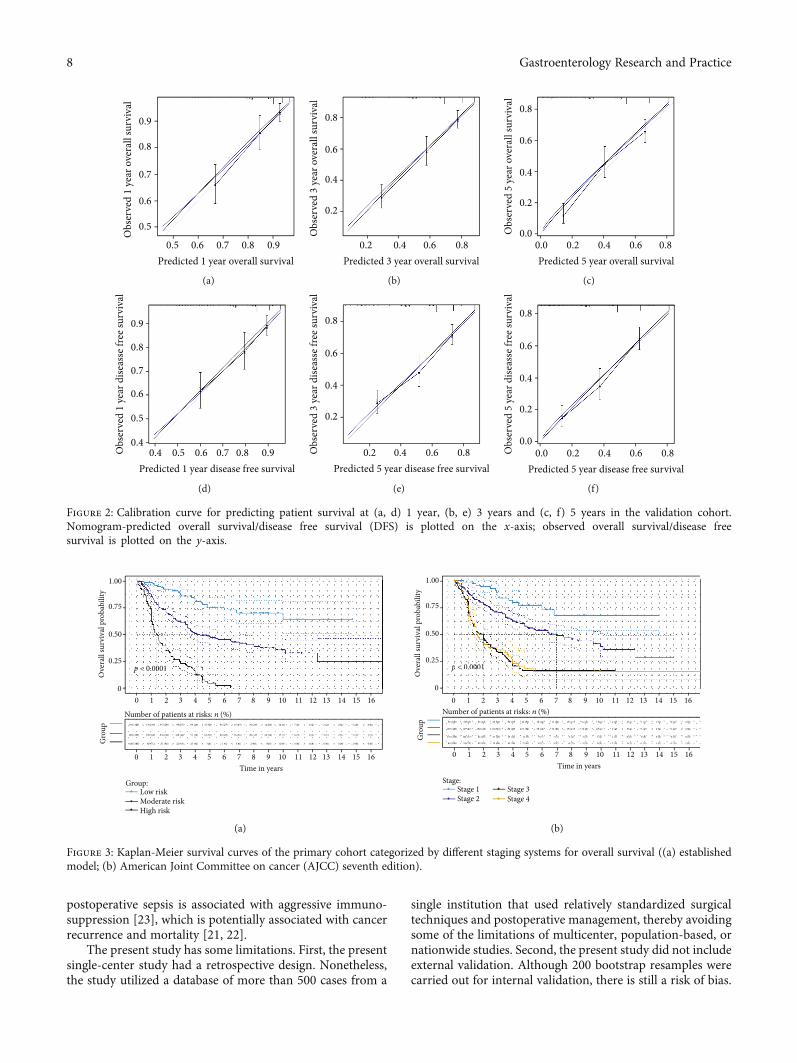
3.4. Prognostic Nomogram for OS and DFS. The prognosticnomograms that integrated all independent factors for OSand DFS in the primary cohort are shown in Figures 1(a)and 1(b), respectively. The calibration plot for the probabilityof survival at 1/3/5 year(s) after surgery demonstrate theoptimal concordance between the nomogram predictionand actual observation (Figure 2).
3.5. Validation of Predictive Accuracy of the Nomogram forOS and DFS. The C-index of the nomogram for OS was0.720 (95% CI: 0.682-0.758), and the bias-corrected C-index was 0.712. The C-index and bias-corrected C-indexof the nomogram for DFS were 0.707 (95% CI: 0.670-0.744) and 0.700, respectively. For the pathological stage,the C-index and bias-corrected C-index for OS (0.672 and0.669, respectively) and DFS (0.669 and 0.666, respectively)were significantly lower than the C-index of the nomogram(P < 0:001, P < 0:001).
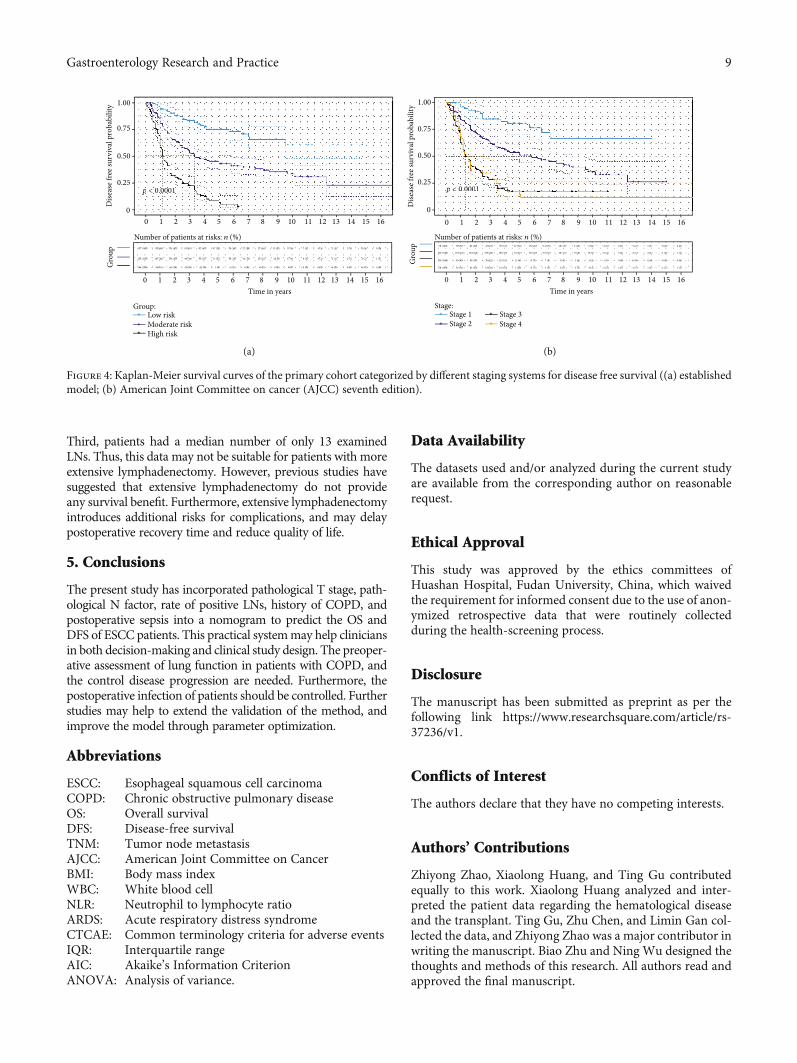
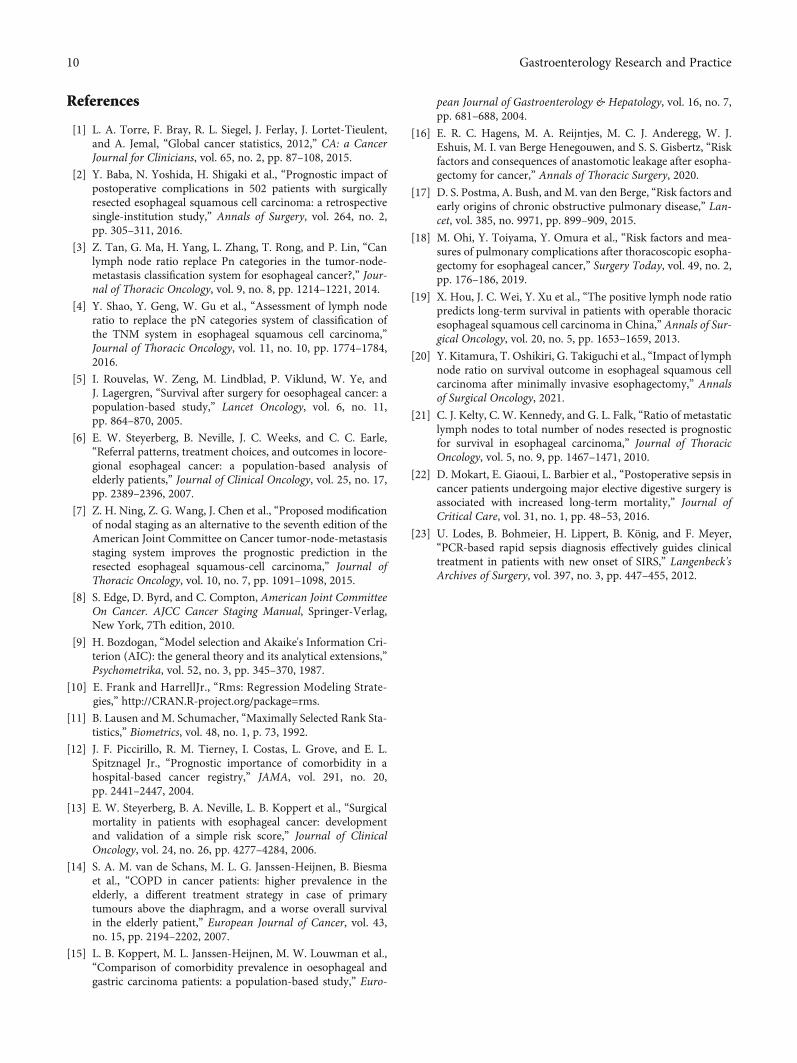
The risk stratification based on the score obtained fromthe nomogram supported the predictive efficacy in thelong-term survival of the established model (Figures 3 and4). The patients were divided into three risk groups accordingto their total score for OS (low-risk group: >22 and ≤74,moderate-risk group: >74 and ≤155, and high-risk group:>155 and ≤271) and DFS (low-risk group: >22 and ≤83,moderate-risk group: >83 and ≤161, and high-risk group:>161 and ≤274), respectively.
4. Discussion
The present study investigated the predictive factors for long-term survival in the 503 patients who underwent resection ofESCC. The cancer characteristics were closely correlated withthe long-term survival of ESCC patients. However, a largenumber of studies have reported that many other clinico-pathological factors are also associated with the prognosis.
The present study found that a history of COPD and postop-erative sepsis were significantly correlated to OS and DFS inpatients with ESCC. A clinical nomogram was developedwhich included the pathological T stage, pathological Nfactor, rate of positive LNs, history of COPD, and postoper-ative sepsis. Subsequently, a risk stratification system wasconstructed based on the nomogram score. These developednomograms are more accurate than the conventional stagingsystem for predicting prognosis in ESCC patients, and cali-bration plots indicated a concordance between predictionand actual observation. The C-index value for OS and DFSwas 0.720 and 0.707, respectively.
A number of prior studies have demonstrated that comor-bidities have an impact on the prognosis of ESCCpatients [5, 6,12, 13]. A history of COPD is one of the most common condi-tions, accounting for 11.5% of newly diagnosed ESCC cancerpatients. Furthermore, this has an associationwith significantlyworse prognosis [14–16]. COPD is a disease characterized bycompletely irreversible and usually progressive obstruction ofthe airways and is associated with inflammation [17]. Further-more, in patients with ESCC, following esophageal carcinomaresection and intrathoracic gastroesophagostomy, part of thethoracic cavity is occupied by the stomach that has beenpulled up. This leads to further impairment of respiratorymotion and poor pulmonary function. Second, immune dys-function plays an important role in the occurrence of COPD[17], which may facilitate the rapid development of micro-scopic residual disease into clinically manifested recurrence.Third, COPD was found to be a risk factor for pulmonarycomplications following surgery [18]. Postoperative pulmo-nary complications may be correlated with worse prognosis[2], although this was not found in the present study. Overall,COPD may play an important role in predicting long-termsurvival, and the present study revealed that this is anindependent predictor of death among patients with ESCC.However, further mechanistic studies are necessary.
Table 2: Continued.
Univariable analysis Multivariable analysisHR (95% CI) P value HR (95% CI) P value
N2 3.78 (2.34-6.10) <0.001 2.26 (1.27-4.00) 0.005
N3 5.73 (4.10-8.01) <0.001 3.63 (2.32-5.68) <0.001Pathological stage
I Ref
II 2.43 (1.41-4.18) 0.001
III 6.82 (3.95-11.77) <0.001IV 6.61 (3.71-11.76) <0.001
Number of dissected LNs 1.01 (0.99-1.02) 0.37
Number of positive LNs 1.13 (1.10-1.17) <0.001Rate of positive LNs
Postoperative complications 10.06 (6.34-15.97) <0.001 2.01 (0.91-4.43) 0.008
Postoperative pulmonary complications 1.20 (0.92-1.55) 0.18
Postoperative anastomotic leakage 1.59 (0.97-2.60) 0.07
Postoperative cardiovascular disease 1.10 (0.82-1.46) 0.54
Sepsis 1.82 (1.18-2.82) 0.007 2.04 (1.31-3.18) 0.002
BMI: body mass index; COPD: chronic obstructive pulmonary disease; NLR: neutrophil to lymphocyte ratio.
5Gastroenterology Research and Practice
Table 3: Univariable and multivariable Cox analysis of prognostic factors for disease free survival in 503 patients with esophageal squamouscell carcinoma.
Univariable analysis Multivariable analysisHR (95% CI) P value HR (95% CI) P value
Age, year 1.01 (0.99-1.02) 0.17
Sex
Male Ref
Female 0.75 (0.54-1.02) 0.07
BMI, kg/m2 0.97 (0.94-1.01) 0.20
Tobacco use
No Ref
Yes 1.07 (0.84-1.36) 0.60
Alcohol use
No Ref
Yes 1.12 (0.86-1.45) 0.42
Comorbidities
History of hypertension
No
Yes 1.11 (0.87-1.41) 0.42
History of diabetes
No Ref
Yes 1.26 (0.96-1.64) 0.09
History of COPD
No Ref Ref
Yes 1.42 (1.02-1.97) 0.04 1.65 (1.17-2.31) 0.004
History of hepatitis
No Ref
Yes 0.96 (0.69-1.33)
History of cardiovascular disease
No Ref
Yes 0.91 (0.66-1.26)
Preoperative albumin 0.96 (0.93-0.99) 0.04
Preoperative platelet, ∗109 1.001 (0.999-1.003) 0.436
Preoperative WBC, ∗109 1.05 (0.99-1.12) 0.08
Preoperative NLR 1.05 (0.99-1.11) 0.05
Length of tumor, cm 1.17 (1.11-1.25) <0.001Location of tumor
Upper Ref
Middle 0.85 (0.62-1.17) 0.33
Lower 0.93 (0.65-1.35) 0.71
Differentiation of tumor
Well Ref
Moderate 1.62 (1.07-2.46) 0.02
Poor 2.04 (1.31-3.18) 0.002
Pathological T stage
T1 Ref Ref
T2 2.92 (1.67-5.09) <0.001 2.21 (1.25-3.89) 0.006
T3 5.23 (3.08-8.89) <0.001 3.46 (2.00-5.97) <0.001T4 6.42 (3.48-11.82) <0.001 3.47 (1.82-6.60) <0.001
Pathological N factor
N0 Ref Ref
N1 2.09 (1.58-2.78) <0.001 1.65 (1.30-2.49) 0.002
N2 3.72 (2.37-5.84) <0.001 2.20 (1.27-3.79) 0.005
N3 5.11 (3.68-7.09) <0.001 3.20 (2.07-4.93) <0.001
6 Gastroenterology Research and Practice
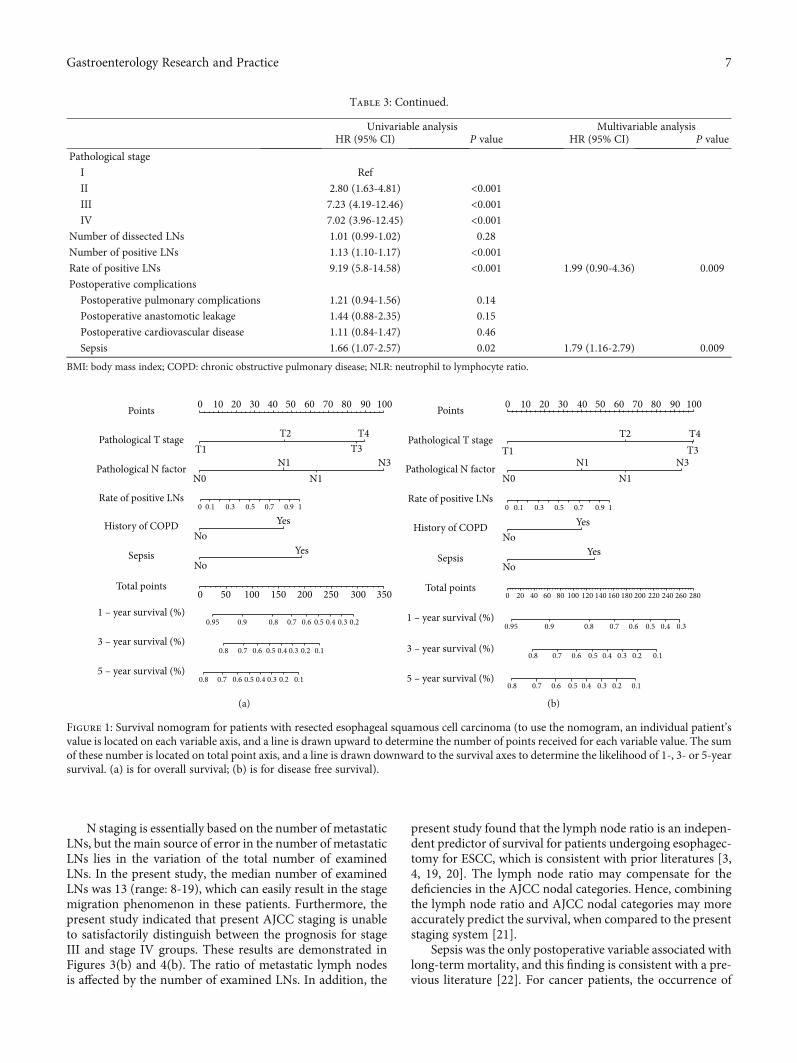
N staging is essentially based on the number of metastaticLNs, but the main source of error in the number of metastaticLNs lies in the variation of the total number of examinedLNs. In the present study, the median number of examinedLNs was 13 (range: 8-19), which can easily result in the stagemigration phenomenon in these patients. Furthermore, thepresent study indicated that present AJCC staging is unableto satisfactorily distinguish between the prognosis for stageIII and stage IV groups. These results are demonstrated inFigures 3(b) and 4(b). The ratio of metastatic lymph nodesis affected by the number of examined LNs. In addition, the
present study found that the lymph node ratio is an indepen-dent predictor of survival for patients undergoing esophagec-tomy for ESCC, which is consistent with prior literatures [3,4, 19, 20]. The lymph node ratio may compensate for thedeficiencies in the AJCC nodal categories. Hence, combiningthe lymph node ratio and AJCC nodal categories may moreaccurately predict the survival, when compared to the presentstaging system [21].
Sepsis was the only postoperative variable associated withlong-termmortality, and this finding is consistent with a pre-vious literature [22]. For cancer patients, the occurrence of
Table 3: Continued.
Univariable analysis Multivariable analysisHR (95% CI) P value HR (95% CI) P value
Pathological stage
I Ref
II 2.80 (1.63-4.81) <0.001III 7.23 (4.19-12.46) <0.001IV 7.02 (3.96-12.45) <0.001
Number of dissected LNs 1.01 (0.99-1.02) 0.28
Number of positive LNs 1.13 (1.10-1.17) <0.001Rate of positive LNs 9.19 (5.8-14.58) <0.001 1.99 (0.90-4.36) 0.009
Postoperative complications
Postoperative pulmonary complications 1.21 (0.94-1.56) 0.14
Postoperative anastomotic leakage 1.44 (0.88-2.35) 0.15
Postoperative cardiovascular disease 1.11 (0.84-1.47) 0.46
Sepsis 1.66 (1.07-2.57) 0.02 1.79 (1.16-2.79) 0.009
BMI: body mass index; COPD: chronic obstructive pulmonary disease; NLR: neutrophil to lymphocyte ratio.
0Points
Pathological T stage
Pathological N factor
Rate of positive LNs
History of COPD
Sepsis
Total points
1 – year survival (%)
3 – year survival (%)
5 – year survival (%)
10 20 30 40 50
T2 T4T3T1
N1N0
No
No
Yes
Yes
N1
0 0.1
0.95 0.9
0.8 0.7 0.6 0.5 0.4 0.3 0.2 0.1
0.10.20.30.40.50.60.70.8
0.8 0.7 0.6 0.5 0.4 0.3 0.2
0.3 0.5 0.7 0.9 1
N3
60 70
0 50 100 150 200 250 300 350
80 90 100
(a)
Points
Pathological T stage
Pathological N factor
Rate of positive LNs
History of COPD
Sepsis
Total points
1 – year survival (%)
3 – year survival (%)
5 – year survival (%)
T2 T4T3T1
N1
NoYes
NoYes
N0 N1
0.8 0.7 0.6 0.5 0.4 0.3 0.2 0.1
0.10.20.30.40.50.60.70.8
0.95
0 20 40 60 80 100 120 140 160 180 200 220 240 260 280
0.9 0.8 0.7 0.6 0.5 0.4 0.3
0 0.1 0.3 0.5 0.7 0.9 1
N3
0 10 20 30 40 50 60 70 80 90 100
(b)
Figure 1: Survival nomogram for patients with resected esophageal squamous cell carcinoma (to use the nomogram, an individual patient’svalue is located on each variable axis, and a line is drawn upward to determine the number of points received for each variable value. The sumof these number is located on total point axis, and a line is drawn downward to the survival axes to determine the likelihood of 1-, 3- or 5-yearsurvival. (a) is for overall survival; (b) is for disease free survival).
7Gastroenterology Research and Practice
postoperative sepsis is associated with aggressive immuno-suppression [23], which is potentially associated with cancerrecurrence and mortality [21, 22].
The present study has some limitations. First, the presentsingle-center study had a retrospective design. Nonetheless,the study utilized a database of more than 500 cases from a
single institution that used relatively standardized surgicaltechniques and postoperative management, thereby avoidingsome of the limitations of multicenter, population-based, ornationwide studies. Second, the present study did not includeexternal validation. Although 200 bootstrap resamples werecarried out for internal validation, there is still a risk of bias.
0.8
0.8
0.6
0.6
0.7
0.7
0.9
0.9
0.5
0.5
Obs
erve
d 1
year
ove
rall
surv
ival
Predicted 1 year overall survival
(a)
0.8
0.8
0.6
0.6
0.4
0.4
0.2
0.2
Obs
erve
d 3
year
ove
rall
surv
ival
Predicted 3 year overall survival
(b)
0.8
0.8
0.6
0.6
0.4
0.4
0.2
0.2
Obs
erve
d 5
year
ove
rall
surv
ival
0.00.0Predicted 5 year overall survival
(c)
0.8
0.9
0.7
0.6
0.5
0.4
Obs
erve
d 1
year
dise
asse
free
surv
ival
0.80.6 0.7 0.90.50.4Predicted 1 year disease free survival
(d)
0.8
0.6
0.4
0.2
Obs
erve
d 3
year
dise
asse
free
surv
ival
0.80.60.40.2Predicted 5 year disease free survival
(e)
0.8
0.6
0.4
0.2
Obs
erve
d 5
year
dise
asse
free
surv
ival
0.00.80.60.40.20.0
Predicted 5 year disease free survival
(f)
Figure 2: Calibration curve for predicting patient survival at (a, d) 1 year, (b, e) 3 years and (c, f) 5 years in the validation cohort.Nomogram-predicted overall survival/disease free survival (DFS) is plotted on the x-axis; observed overall survival/disease freesurvival is plotted on the y-axis.
134 (100)
0
1.00
0.75
0.50
0.25
0
Number of patients at risks: n (%)
Ove
rall
surv
ival
pro
babi
lity
1 2 3 4 5 6 7 8 9 10 11 12 13 14 15 16
p < 0.0001
0 1 2 3 4 5 6 7 8Time in years
Gro
up
9 10 11 12 13 14 15 16
229 (100)
140 (100)
131 (98)
193 (84)
99 (71)
115 (86)
156 (68)
51 (36)
90 (67)
109 (48)
25 (18)
66 (49)
77 (34)
15 (11)
47 (35)
61 (27)
3 (2)
36 (27)
46 (20)
1 (1)
25 (19)
36 (16)
0 (0)
22 (16)
29 (13)
0 (0)
14 (10)
22 (10)
0 (0)
12 (9)
17 (7)
0 (0)
7 (5)
8 (3)
0 (0)
4 (3)
4 (2)
0 (0)
3 (2)
2 (1)
0 (0)
2 (1)
2 (1)
0 (0)
2 (0)
2 (1)
0 (0)
0 (0)
1 (1)
0 (0)
Group:Low riskModerate riskHigh risk
p < 0.000000000 1
(a)
1.00
0.75
0.50
0.25
0
Ove
rall
surv
ival
pro
babi
lity
p < 0.0001
0Number of patients at risks: n (%)
1 2 3 4 5 6 7 8 9 10 11 12 13 14 15 16
0 1 2 3 4 5 6 7 8Time in years
9 10 11 12 13 14 15 16
Stage:Stage 1Stage 2
Stage 3Stage 4
72 (100)
227 (100)
135 (100)
70 (97)
197 (87)
104 (77)
63 (88)
168 (74)
62 (46)
50 (69)
120 (53)
35 (26)
38 (53)
88 (39)
19 (14)
26 (36)
67 (30)
11 (8)
19 (26)
50 (22)
9 (7)
13 (18)
36 (16)
7 (5)
12 (17)
29 (13)
5 (4)
9 (12)
19 (8)
3 (2)
7 (10)
16 (7)
3 (2)
4 (6)
8 (4)
1 (1)
2 (3)
5 (2)
0 (0)
1 (1)
3 (1)
0 (0)
1 (1)
2 (1)
0 (0)
0 (0)
1 (0)
0 (0)
0 (0)
0 (0)
0 (0)
69 (100) 52 (75) 29 (42) 19 (28) 13 (19) 7 (10) 5 (7) 5 (7) 5 (7) 5 (7) 3 (4) 2 (3) 1 (1) 1 (1) 1 (1) 1 (1) 1 (1)
Gro
up
p < 0.0000000 1111111111
(b)
Figure 3: Kaplan-Meier survival curves of the primary cohort categorized by different staging systems for overall survival ((a) establishedmodel; (b) American Joint Committee on cancer (AJCC) seventh edition).
8 Gastroenterology Research and Practice
Third, patients had a median number of only 13 examinedLNs. Thus, this data may not be suitable for patients with moreextensive lymphadenectomy. However, previous studies havesuggested that extensive lymphadenectomy do not provideany survival benefit. Furthermore, extensive lymphadenectomyintroduces additional risks for complications, and may delaypostoperative recovery time and reduce quality of life.
5. Conclusions
The present study has incorporated pathological T stage, path-ological N factor, rate of positive LNs, history of COPD, andpostoperative sepsis into a nomogram to predict the OS andDFS of ESCC patients. This practical systemmay help cliniciansin both decision-making and clinical study design. The preoper-ative assessment of lung function in patients with COPD, andthe control disease progression are needed. Furthermore, thepostoperative infection of patients should be controlled. Furtherstudies may help to extend the validation of the method, andimprove the model through parameter optimization.
Abbreviations
ESCC: Esophageal squamous cell carcinomaCOPD: Chronic obstructive pulmonary diseaseOS: Overall survivalDFS: Disease-free survivalTNM: Tumor node metastasisAJCC: American Joint Committee on CancerBMI: Body mass indexWBC: White blood cellNLR: Neutrophil to lymphocyte ratioARDS: Acute respiratory distress syndromeCTCAE: Common terminology criteria for adverse eventsIQR: Interquartile rangeAIC: Akaike’s Information CriterionANOVA: Analysis of variance.
Data Availability
The datasets used and/or analyzed during the current studyare available from the corresponding author on reasonablerequest.
Ethical Approval
This study was approved by the ethics committees ofHuashan Hospital, Fudan University, China, which waivedthe requirement for informed consent due to the use of anon-ymized retrospective data that were routinely collectedduring the health-screening process.
Disclosure
The manuscript has been submitted as preprint as per thefollowing link https://www.researchsquare.com/article/rs-37236/v1.
Conflicts of Interest
The authors declare that they have no competing interests.
Authors’ Contributions
Zhiyong Zhao, Xiaolong Huang, and Ting Gu contributedequally to this work. Xiaolong Huang analyzed and inter-preted the patient data regarding the hematological diseaseand the transplant. Ting Gu, Zhu Chen, and Limin Gan col-lected the data, and Zhiyong Zhao was a major contributor inwriting the manuscript. Biao Zhu and Ning Wu designed thethoughts and methods of this research. All authors read andapproved the final manuscript.
1.00
0.75
0.50
0.25
0
Dise
ase f
ree s
urvi
val p
roba
bilit
y
0
Number of patients at risks: n (%)
p < 0.0001
1 2 3 4 5 6 7 8 9 10 11 12 13 14 15 16
0 1 2 3 4 5 6 7 8Time in years
9 10 11 12 13 14 15 16
Gro
up
Group:Low riskModerate riskHigh risk
137 (100)
222 (100)
144 (100)
130 (98)
181 (82)
94 (65)
114 (83)
134 (60)
41 (28)
83 (61)
98 (44)
23 (16)
62 (45)
69 (31)
12 (8)
47 (35)
55 (25)
5 (3)
36 (26)
40 (18)
2 (1)
27 (20)
32 (14)
0 (0)
22 (16)
26 (12)
0 (0)
15 (11)
20 (9)
0 (0)
11 (8)
17 (8)
0 (0)
7 (5)
8 (4)
0 (0)
4 (3)
4 (2)
0 (0)
3 (2)
2 (1)
0 (0)
2 (1)
2 (1)
0 (0)
0 (0)
2 (1)
0 (0)
0 (0)
1 (1)
0 (0)
p < 0.000000 1
(a)
1.00
0.75
0.50
0.25
0Dise
ase f
ree s
urvi
val p
roba
bilit
y
p < 0.0001
0
Number of patients at risks: n (%)
1 2 3 4 5 6 7 8 9 10 11 12 13 14 15 16
0 1 2 3 4 5 6 7 8Time in years
9 10 11 12 13 14 15 16
Stage:Stage 1Stage 2
Stage 3Stage 4
72 (100)
227 (100)
135 (100)
70 (97)
191 (84)
93 (69)
62 (86)
154 (68)
50 (37)
47 (65)
109 (48)
30 (22)
37 (51)
80 (35)
15 (11)
27 (38)
62 (27)
11 (8)
19 (26)
45 (20)
9 (7)
14 (19)
33 (15)
7 (5)
12 (17)
26 (11)
5 (4)
9 (12)
18 (8)
3 (2)
7 (10)
15 (7)
3 (2)
4 (6)
8 (4)
1 (1)
2 (3)
5 (2)
0 (0)
1 (2)
3 (1)
0 (0)
1 (1)
2 (1)
0 (0)
0 (0)
1 (0)
0 (0)
0 (0)
1 (1)
0 (0)
69 (100) 51 (74) 23 (33) 18 (26) 11 (16) 7 (10) 5 (7) 5 (7) 5 (7) 5 (7) 3 (4) 2 (3) 1 (1) 1 (1) 1 (1) 1 (1) 1 (1)
Gro
up
p < 0.00000000000000000000 1
(b)
Figure 4: Kaplan-Meier survival curves of the primary cohort categorized by different staging systems for disease free survival ((a) establishedmodel; (b) American Joint Committee on cancer (AJCC) seventh edition).
9Gastroenterology Research and Practice
References
[1] L. A. Torre, F. Bray, R. L. Siegel, J. Ferlay, J. Lortet-Tieulent,and A. Jemal, “Global cancer statistics, 2012,” CA: a CancerJournal for Clinicians, vol. 65, no. 2, pp. 87–108, 2015.
[2] Y. Baba, N. Yoshida, H. Shigaki et al., “Prognostic impact ofpostoperative complications in 502 patients with surgicallyresected esophageal squamous cell carcinoma: a retrospectivesingle-institution study,” Annals of Surgery, vol. 264, no. 2,pp. 305–311, 2016.
[3] Z. Tan, G. Ma, H. Yang, L. Zhang, T. Rong, and P. Lin, “Canlymph node ratio replace Pn categories in the tumor-node-metastasis classification system for esophageal cancer?,” Jour-nal of Thoracic Oncology, vol. 9, no. 8, pp. 1214–1221, 2014.
[4] Y. Shao, Y. Geng, W. Gu et al., “Assessment of lymph noderatio to replace the pN categories system of classification ofthe TNM system in esophageal squamous cell carcinoma,”Journal of Thoracic Oncology, vol. 11, no. 10, pp. 1774–1784,2016.
[5] I. Rouvelas, W. Zeng, M. Lindblad, P. Viklund, W. Ye, andJ. Lagergren, “Survival after surgery for oesophageal cancer: apopulation-based study,” Lancet Oncology, vol. 6, no. 11,pp. 864–870, 2005.
[6] E. W. Steyerberg, B. Neville, J. C. Weeks, and C. C. Earle,“Referral patterns, treatment choices, and outcomes in locore-gional esophageal cancer: a population-based analysis ofelderly patients,” Journal of Clinical Oncology, vol. 25, no. 17,pp. 2389–2396, 2007.
[7] Z. H. Ning, Z. G. Wang, J. Chen et al., “Proposed modificationof nodal staging as an alternative to the seventh edition of theAmerican Joint Committee on Cancer tumor-node-metastasisstaging system improves the prognostic prediction in theresected esophageal squamous-cell carcinoma,” Journal ofThoracic Oncology, vol. 10, no. 7, pp. 1091–1098, 2015.
[8] S. Edge, D. Byrd, and C. Compton, American Joint CommitteeOn Cancer. AJCC Cancer Staging Manual, Springer-Verlag,New York, 7Th edition, 2010.
[9] H. Bozdogan, “Model selection and Akaike's Information Cri-terion (AIC): the general theory and its analytical extensions,”Psychometrika, vol. 52, no. 3, pp. 345–370, 1987.
[10] E. Frank and HarrellJr., “Rms: Regression Modeling Strate-gies,” http://CRAN.R-project.org/package=rms.
[11] B. Lausen and M. Schumacher, “Maximally Selected Rank Sta-tistics,” Biometrics, vol. 48, no. 1, p. 73, 1992.
[12] J. F. Piccirillo, R. M. Tierney, I. Costas, L. Grove, and E. L.Spitznagel Jr., “Prognostic importance of comorbidity in ahospital-based cancer registry,” JAMA, vol. 291, no. 20,pp. 2441–2447, 2004.
[13] E. W. Steyerberg, B. A. Neville, L. B. Koppert et al., “Surgicalmortality in patients with esophageal cancer: developmentand validation of a simple risk score,” Journal of ClinicalOncology, vol. 24, no. 26, pp. 4277–4284, 2006.
[14] S. A. M. van de Schans, M. L. G. Janssen-Heijnen, B. Biesmaet al., “COPD in cancer patients: higher prevalence in theelderly, a different treatment strategy in case of primarytumours above the diaphragm, and a worse overall survivalin the elderly patient,” European Journal of Cancer, vol. 43,no. 15, pp. 2194–2202, 2007.
[15] L. B. Koppert, M. L. Janssen-Heijnen, M. W. Louwman et al.,“Comparison of comorbidity prevalence in oesophageal andgastric carcinoma patients: a population-based study,” Euro-
pean Journal of Gastroenterology & Hepatology, vol. 16, no. 7,pp. 681–688, 2004.
[16] E. R. C. Hagens, M. A. Reijntjes, M. C. J. Anderegg, W. J.Eshuis, M. I. van Berge Henegouwen, and S. S. Gisbertz, “Riskfactors and consequences of anastomotic leakage after esopha-gectomy for cancer,” Annals of Thoracic Surgery, 2020.
[17] D. S. Postma, A. Bush, andM. van den Berge, “Risk factors andearly origins of chronic obstructive pulmonary disease,” Lan-cet, vol. 385, no. 9971, pp. 899–909, 2015.
[18] M. Ohi, Y. Toiyama, Y. Omura et al., “Risk factors and mea-sures of pulmonary complications after thoracoscopic esopha-gectomy for esophageal cancer,” Surgery Today, vol. 49, no. 2,pp. 176–186, 2019.
[19] X. Hou, J. C. Wei, Y. Xu et al., “The positive lymph node ratiopredicts long-term survival in patients with operable thoracicesophageal squamous cell carcinoma in China,” Annals of Sur-gical Oncology, vol. 20, no. 5, pp. 1653–1659, 2013.
[20] Y. Kitamura, T. Oshikiri, G. Takiguchi et al., “Impact of lymphnode ratio on survival outcome in esophageal squamous cellcarcinoma after minimally invasive esophagectomy,” Annalsof Surgical Oncology, 2021.
[21] C. J. Kelty, C. W. Kennedy, and G. L. Falk, “Ratio of metastaticlymph nodes to total number of nodes resected is prognosticfor survival in esophageal carcinoma,” Journal of ThoracicOncology, vol. 5, no. 9, pp. 1467–1471, 2010.
[22] D. Mokart, E. Giaoui, L. Barbier et al., “Postoperative sepsis incancer patients undergoing major elective digestive surgery isassociated with increased long-term mortality,” Journal ofCritical Care, vol. 31, no. 1, pp. 48–53, 2016.
[23] U. Lodes, B. Bohmeier, H. Lippert, B. König, and F. Meyer,“PCR-based rapid sepsis diagnosis effectively guides clinicaltreatment in patients with new onset of SIRS,” Langenbeck'sArchives of Surgery, vol. 397, no. 3, pp. 447–455, 2012.
10 Gastroenterology Research and Practice