Embed Size (px)
Citation preview
1
Predicting the Young’s modulus of nanowires from first-principles
calculations on their surface and bulk materials
Guofeng Wang 1,* and Xiaodong Li 2
1 Department of Mechanical Engineering, Indiana University-Purdue University
Indianapolis, Indianapolis, IN 46202
2 Department of Mechanical Engineering, University of South Carolina, Columbia, SC
29208
Abstract:
Using the concept of surface stress, we developed a model that is able to predict the
Young’s modulus of nanowires as a function of nanowire diameters from the calculated
properties of their surface and bulk materials. We took both equilibrium strain effect and
surface stress effect into consideration to account for the geometric size influence on the
elastic properties of nanowires. In this work, we combined first-principles density
functional theory calculations of material properties with linear elasticity theory of
clamped-end three-point bending. Furthermore, we applied this computation approach to
Ag, Au, and ZnO nanowires. For both Ag and Au nanowires, our theoretical predictions
agree well with the experimental data in the literature. For ZnO nanowires, our
predictions are qualitatively consistent with some of experimental data for ZnO
nanostructures. Consequently, we found that surface stress plays a very important role in
determining the Young’s modulus of nanowires. Our finding suggests that the elastic
properties of nanowires could be possibly engineered by altering the surface stress of
their lateral surfaces.
* Corresponding author. Electronic mail: [email protected]
2
I. INTRODUCTION
Currently, many powerful electromechanical devices can be designed and fabricated
at the micro level such as microelectromechanical systems (MEMS). It is a highly active
research forefront to develop future electromechanical devices with size in the nano
scale, for instance, nanoelectromechanical systems (NEMS). 1 For example, a
nanogenerator, which uses ZnO nanowires to convert mechanical energy to electrical
energy, has been successfully fabicated.2 NEMS employs one-dimensional (1D)
nanomaterials (nanowires, nanobelts, and/or nanotubes) as its active components to
generate, transmit, and convert powers and motions. Hence, the dependence of the
mechanical properties on the geometric size of 1D nanomaterials is a very important
factor in affecting the performance of those 1D nanomaterials in the NEMS devices. So
far, several different fashions of the size dependence of the elastic properties of
nanomaterials have been revealed: (1) Young’s modulus increases with the decreasing
size, for example, in Ag and Pd nanowires; 3,4 (2) Young’s modulus decreases with the
decreasing size, for example, in Cr and Si nanocantilevers; 5,6 and (3) Young’s modulus
shows little dependence of the size of the nanomaterials such as Au nanowires.7
Moreover, for a same nanomaterial, different research groups could observe and report
the opposite size-dependence of its elastic properties. For the case of 1D ZnO
nanomaterials, some measurements 8-13 indicated that their Young’s modulus should be
lower than the bulk modulus. In contrast, some investigations 14,15 declared the
observation of the exact opposite trend.
Despite of its significance, the mechanism for how the Young’s modulus of 1D
nanomaterials depends on their size and surface conditions is barely understood.
3
Generally speaking, the surface of the nanomaterials will exert great influence on its
overall mechanical properties. Consequently, the Young’s modulus of a 1D nanomaterial
is believed to be determined by both bulk elastic modulus and surface elastic
modulus.16,17 In other words, the elastic response of a 1D nanomaterial depends strongly
on its surface elastic constant.18 The relative increase or decrease of the elastic properties
of nanomaterials may be the results of surface bonding 19 and bulk nonlinear
phenomena.20 Therefore, it is of great interest to quantitatively investigate how to predict
the elastic properties of 1D nanomaterials from the properties of the surface and bulk
materials. In this paper, we will present a model developed for that purpose.
Our model mainly focuses on the role of surface stress effect in determining the
Young’s modulus of 1D nanomaterials. Surface stress is defined as the reversible work
per unit area required to elastically stretch a surface.21 The experimental data and analysis
in Ref. 3 showed that a positive (tensile) surface stress will lead to an increase in Young’s
modulus as the diameter decreases. Our previous theoretical study pointed out that a
negative (compressive) surface stress is the reason for the observed decrease in Young’s
modulus with decreasing diameter of the ZnO nanowires. 22 Recently, it was proposed
that the surface stress effect are also responsible for the reduction in the resonant
frequencies of fixed/fixed Si nanowires 23 and the asymmetric yield strength of Al
nanowires. 24 Here, we further elucidate how the surface stress affects the Young’s
modulus of nanowires.
This paper is structured as follows: in Sec. II, we present our model that predicts the
Young’s modulus of the nanowire with a given diameter based on surface stress effect; in
Sec. III, we give the required properties of bulk and surface materials calculated using
4
first-principles density functional theory (DFT) method and then evaluate the Young’s
modulus of the nanowires using our developed model. Our model predictions are
compared with the available experimental data in this section; at last, final conclusions
are drawn in Sec. IV.
II. MODELS
In this work, we derived the quantitative relation between the Young’s modulus of a
nanowire (with a circular cross-section) and its material properties assuming clamped-end
three-point bending loading condition.
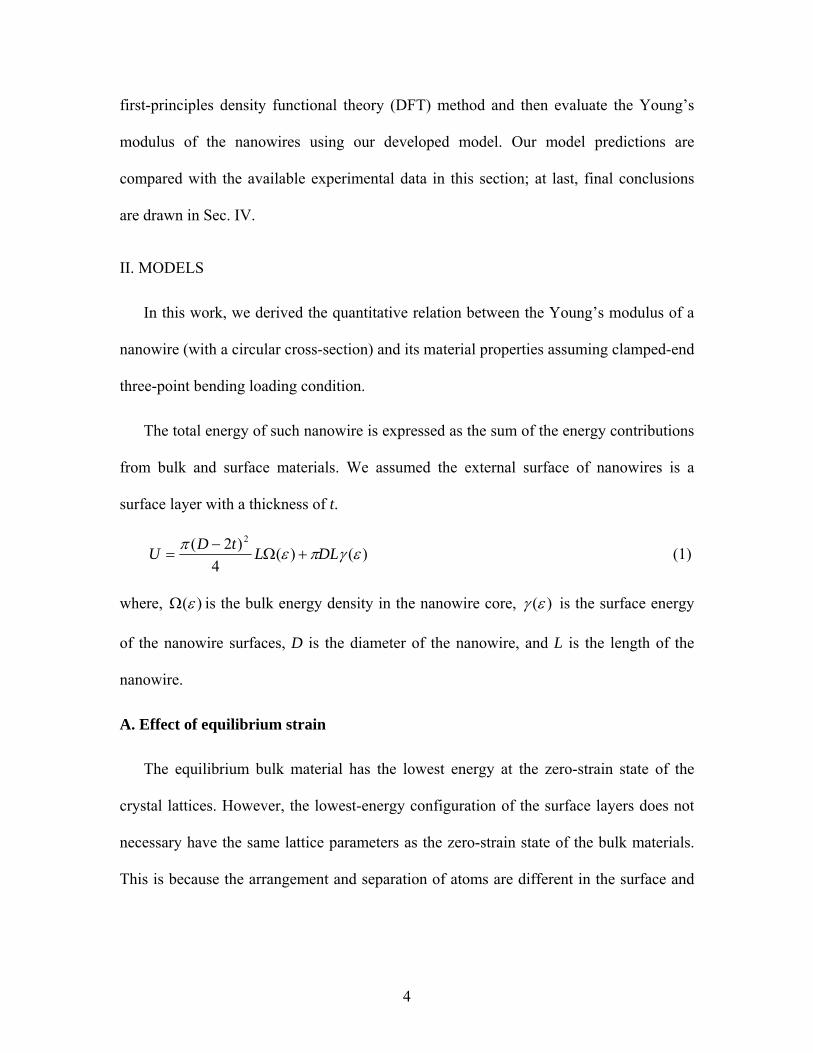
The total energy of such nanowire is expressed as the sum of the energy contributions
from bulk and surface materials. We assumed the external surface of nanowires is a
surface layer with a thickness of t.
)()(4
)2( 2
εγπεπ DLLtDU +Ω−
= (1)
where, )(εΩ is the bulk energy density in the nanowire core, )(εγ is the surface energy
of the nanowire surfaces, D is the diameter of the nanowire, and L is the length of the
nanowire.
A. Effect of equilibrium strain
The equilibrium bulk material has the lowest energy at the zero-strain state of the
crystal lattices. However, the lowest-energy configuration of the surface layers does not
necessary have the same lattice parameters as the zero-strain state of the bulk materials.
This is because the arrangement and separation of atoms are different in the surface and
5
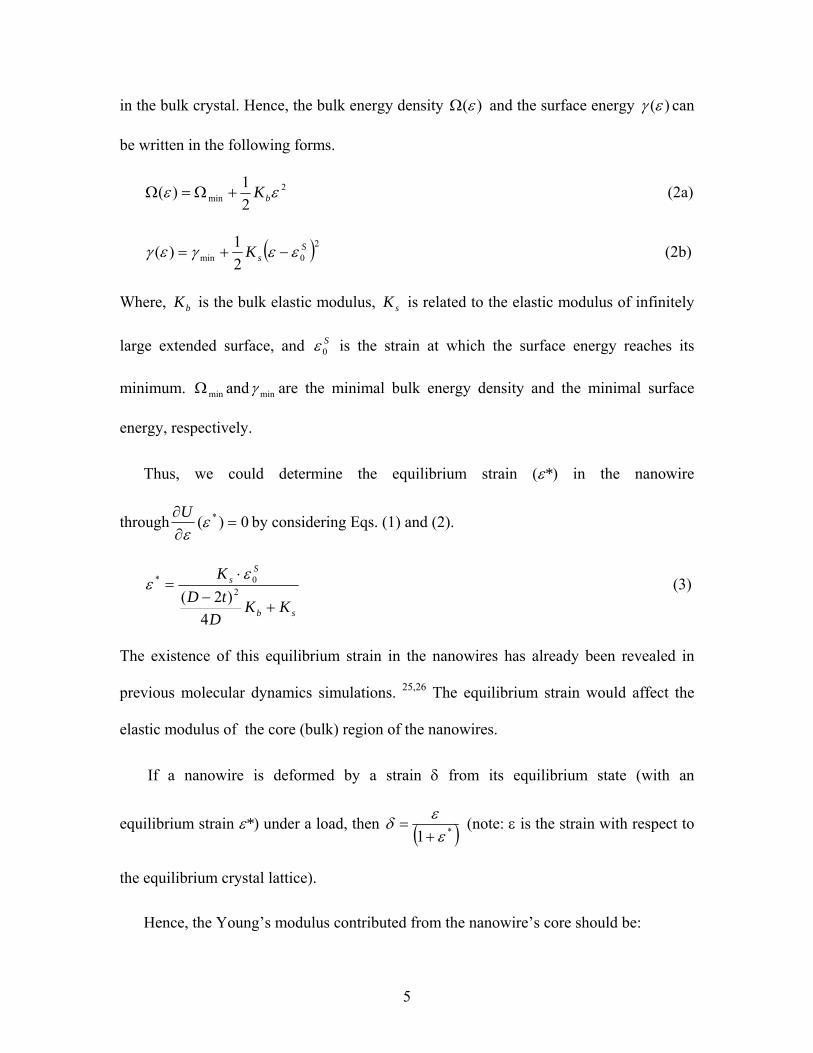
in the bulk crystal. Hence, the bulk energy density )(εΩ and the surface energy )(εγ can
be written in the following forms.
2min 2
1)( εε bK+Ω=Ω (2a)
( )20min 21)( S
sK εεγεγ −+= (2b)
Where, bK is the bulk elastic modulus, sK is related to the elastic modulus of infinitely
large extended surface, and S0ε is the strain at which the surface energy reaches its
minimum. minΩ and minγ are the minimal bulk energy density and the minimal surface
energy, respectively.
Thus, we could determine the equilibrium strain (ε*) in the nanowire
through 0)( * =∂∂ εεU by considering Eqs. (1) and (2).
sb
Ss
KKD
tDK
+−
⋅=
4)2( 2
0* εε (3)
The existence of this equilibrium strain in the nanowires has already been revealed in
previous molecular dynamics simulations. 25,26 The equilibrium strain would affect the
elastic modulus of the core (bulk) region of the nanowires.
If a nanowire is deformed by a strain δ from its equilibrium state (with an
equilibrium strain ε*) under a load, then ( )*1 εεδ+
= (note: ε is the strain with respect to
the equilibrium crystal lattice).
Hence, the Young’s modulus contributed from the nanowire’s core should be:
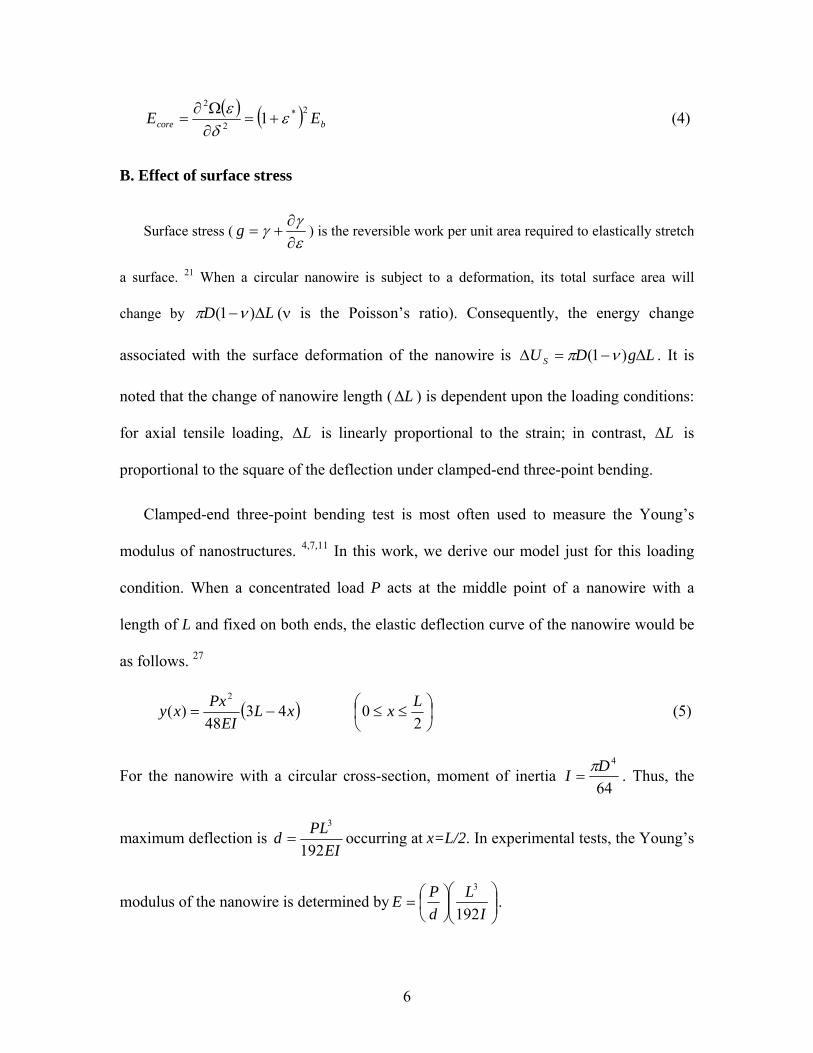
6
( ) ( ) bcore EE 2*2
2
1 εδε
+=∂Ω∂
= (4)
B. Effect of surface stress
Surface stress (εγγ∂∂
+=g ) is the reversible work per unit area required to elastically stretch
a surface. 21 When a circular nanowire is subject to a deformation, its total surface area will
change by LD Δ− )1( νπ (ν is the Poisson’s ratio). Consequently, the energy change
associated with the surface deformation of the nanowire is LgDU S Δ−=Δ )1( νπ . It is
noted that the change of nanowire length ( LΔ ) is dependent upon the loading conditions:
for axial tensile loading, LΔ is linearly proportional to the strain; in contrast, LΔ is
proportional to the square of the deflection under clamped-end three-point bending.
Clamped-end three-point bending test is most often used to measure the Young’s
modulus of nanostructures. 4,7,11 In this work, we derive our model just for this loading
condition. When a concentrated load P acts at the middle point of a nanowire with a
length of L and fixed on both ends, the elastic deflection curve of the nanowire would be
as follows. 27
( ) ⎟⎠⎞
⎜⎝⎛ ≤≤−=
2043
48)(
2 LxxLEI
Pxxy (5)
For the nanowire with a circular cross-section, moment of inertia 64
4DI π= . Thus, the
maximum deflection is EI
PLd192
3
= occurring at x=L/2. In experimental tests, the Young’s
modulus of the nanowire is determined by ⎟⎟⎠
⎞⎜⎜⎝
⎛⎟⎠⎞
⎜⎝⎛=
IL
dPE
192
3
.
7
The elongation of the nanowire under bending is given by
( )[ ]L
ddxxyLL 22/
0
2'
512
==Δ ∫ (6)
Consequently, the resistant force to the bending due to surface stress in the nanowire is
( )LdgD
dU
P SS νπ −−=
∂∂
−= 1524 (7)
Hence, the Young’s modulus contributed from the nanowire’s surface should be:
( ) 3
23
158
192 DLg
IL
dP
E Ssurface ν−=⎟⎟
⎠
⎞⎜⎜⎝
⎛⎟⎠⎞
⎜⎝⎛ −= (8)
Similar derivation has been done previously by Cuenot et al. 3 Note that Esurface in Eq.
(8) is the Young’s modulus of the curved circular nanowire surface, different from Ks in
Eqs. (2b) and (3) referring to the elastic modulus of the flat extended surface along a
specific crystalline direction.
C. Young’s modulus of nanowire
Combining Eq. (4) and Eq. (8), we express the Young’s modulus of nanowires, which
have circular cross-sections and are subject to clamped-end three-point bending, as the
following function.
( ) 3
22* )1(
581
DLgEE bnanowire νε −++= (9)
With the increase of the diameter (D) of the nanowires, the equilibrium strain ε* would
approach to zero according to Eq. (3). Therefore, Enanowire in Eq. (9) would be equal to
bulk Young’s modulus Eb when D reaches the limit of bulk materials.
III. RESULTS
8
In order to examine the reliability of Eq. (9), we performed first-principles
calculations on example materials Ag, Au, and ZnO, predicted their size-dependent
Young’s modulus based on Eq. (9) using the calculated theoretical data, and further
compared our predictions with experimental measurements. Our first-principles
calculations for the three materials were performed using the VASP code. 28,29 We used
the projector augmented wave method 30 and the generalized gradient approximation of
Perdew and Wang 31 for exchange and correlation. We chose a kinetic energy cutoff of
600 eV to expand the electronic wave functions in the plane wave basis. The energy
convergence for all geometry optimization was set to be 1×10⁻⁵ eV.
A. Bulk materials
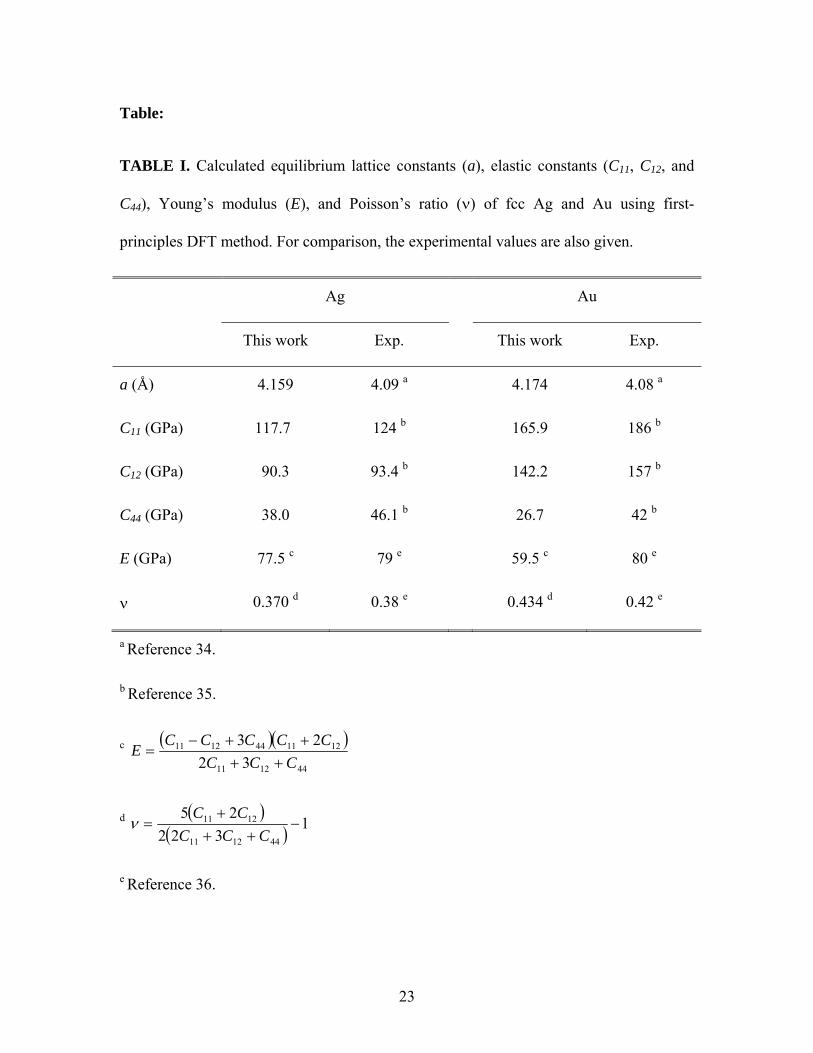
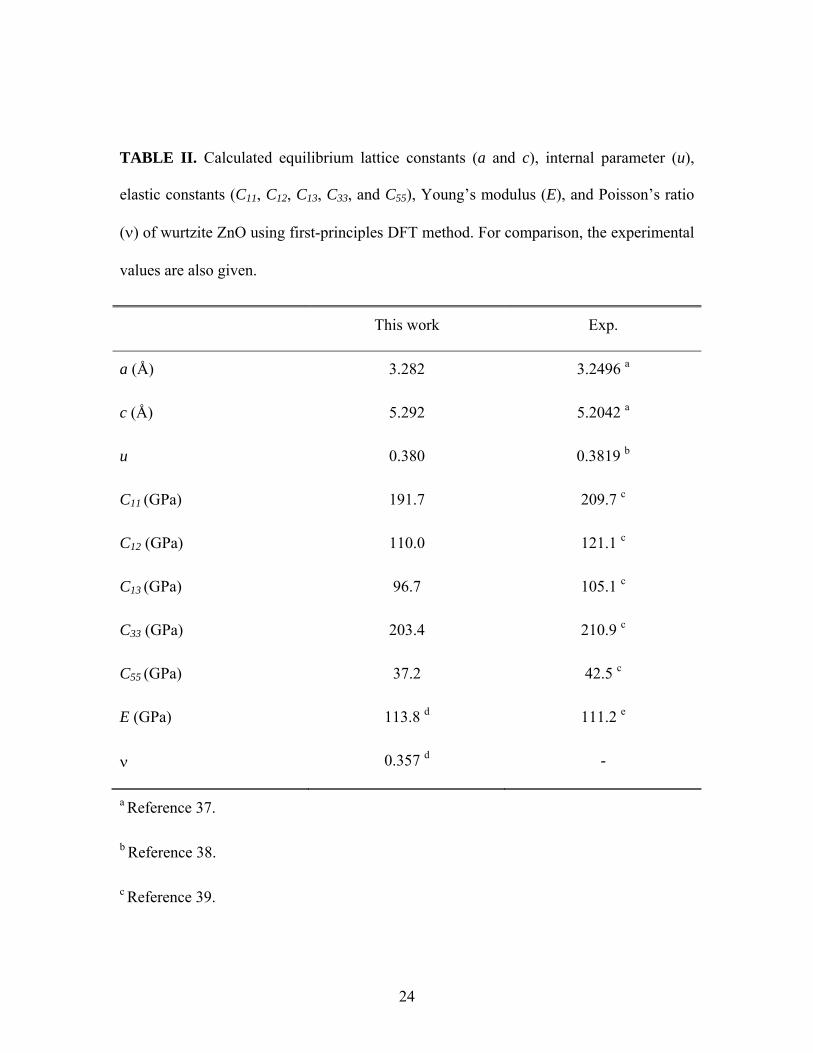
For Ag, Au, and ZnO in their bulk states, we computed the equilibrium lattice
constants and the corresponding elastic constants using first-principles calculations. The
results are given in Tables I and II. The equilibrium Ag and Au crystals have faced-
centered cubic (fcc) structures, while equilibrium ZnO has a wurtzite crystal structure.
Through calculations, we are able to determine the lattice constants that lead to the
minimal energy of the respective crystal structures. Using 16×16×16 k-point grid for k-
space integration, we determined the elastic constants of the crystals following the
procedure given in Ref. 32 (for fcc Ag and Au) and Ref. 33 (for wurtzite ZnO). As shown
in Tables I and II, our theoretical predictions agree well with the corresponding
experimental data. Furthermore, we calculated the averaged bulk Young’s modulus and
Poisson’s ratio from our theoretical results of the elastic constants. These two elastic
properties of bulk materials are needed in Eq. (9) to predict the Young’s modulus of
nanowires.
9
B. Surface materials
For fcc Ag and Au, the (111) surface has the lowest surface energy and thus is the
most probable external surfaces of their nanostructures. For ZnO nanowires grown along
[0001] direction, ( 0110 ) and ( 0211 ) surfaces are their lateral facets. Consequently, we
conducted the DFT relaxation calculations for the (111) surface slab of fcc Ag (and Au)
and ( 0110 ) and ( 0211 ) surface slabs of wurtzite ZnO. In our surface calculations, we
used a surface slab (with two surfaces) having Ns layers of atoms in a periodic supercell
which contains Nb atomic layers in the direction normal to the surface. To simulate the
(111) surface of fcc Ag and Au, we used a supercell spanned with three orthogonal
directions ([111], [ 211 ] and [ 011 ]). In the supercell (Nb=12), there are seven layer of
atoms (Ns=7, about 2t=14.4 Å thick of the Ag (111) slab and 2t=14.5 Å thick of the Au
(111) slab) and five layers of vacuum. For the (111) surface calculations, we used
8×12×2 k-point grid for k-space integration. For ( 0110 ) surfaces, we used a supercell
(Nb=16) containing eight atom layers (Ns=8, about 2t=9.5 Å thick) and eight layers of
vacuum. For ( 0211 ) surface, we used a supercell (Nb=12) containing six atom layers
(Ns=6, about 2t=8.2 Å thick) and six layers of vacuum. For k-space integration, we used a
10×6×2 k-point grid for ( 0110 ) surface and a 6×6×2 k-point grid for ( 0211 ) surface.
Using slabs to simulate surfaces, we need conciliate two requirements: (a) the slab
should be thin enough to represent two-dimensional surfaces and (b) the two surfaces of
the slab should be separated far enough to minimize their interactions. In this work, we
made our above choice of the thickness of the slabs by examining the separation of the
layers in the slab after relaxation. For seven-layer Ag and Au (111) slab, the separation of
the central layers differs by less than 0.2 % from the corresponding bulk value. For eight-
10
layer ZnO ( 0110 ) slab, the separation of the central layers differs by 5 % from the
corresponding bulk value in contrast the separation of the outermost surface layers differs
by 49.8 % from the corresponding bulk value. For six-layer ZnO ( 0211 ) slab, the
separation of the central layers differs by 3 % from the corresponding bulk value while
the separation of the outermost surface layers differs by 18.1 % from the corresponding
bulk value. In this way, we attained a slab model whose central region is very close to the
bulk materials and surface regions are subjected to the relaxation in vacuum.
Surface relaxation is quite insignificant for the (111) surfaces of Ag and Au. After
geometry optimization, the outermost surface layer is found to move inward by 0.3 % of
its bulk layer separation for Ag. This is close to the experimental measurement of about
0.0% relaxation of Ag(111) surface. 41 For Au, we found that the outermost surface layer
moves outward by 1.2 % of its bulk layer separation. Prior DFT calculations also
predicted an outward motion of the outermost layer of Au (111) surface. 42
However, significant relaxation in both ( 0110 ) and ( 0211 ) surfaces of ZnO have
been observed from our calculations. In bulk terminated ( 0110 ) and ( 0211 ) surfaces,
Zn-O dimers lay in parallel to the surface. In contrast, the Zn-O dimers would tilt relative
to the surface after relaxation. We found in our calculations that: in the outermost layer of
( 0110 ) surface, Zn cations move inward by ⊥Δd (Zn)= -0.34 Å and move laterally
toward O by ||dΔ (Zn)= 0.16 Å, O anions move inward by ⊥Δd (O)= -0.002 Å, and the
resultant tilt angle of Zn-O dimers to be ω= 10.6 °. Our results for the ( 0110 ) surface are
in good agreement with the experimental data43 ( ⊥Δd (Zn)= -0.45±0.1 Å, ||dΔ (Zn)=
0.1±0.2 Å, ⊥Δd (O)= -0.05±0.1 Å, and ω=12°±5°). We also found in the outermost layer
11
of ( 0211 ) surface the tilt angle for Zn-O dimers to be 7.7 ° and a 6.1 % reduction of the
Zn-O bond length, consistent with previous DFT results. 44
Furthermore, we calculated the surface energy (γ) and surface stress tensor (g) for the
relaxed Ag, Au, and ZnO surfaces using Eq. (10) as suggested in Ref. 45.
])/([21
bbss ENNEA
−=γ (10a)
])/([21 b
bbss VNNV
Ag αβαβαβ σσ −= (10b)
where, A is the area on one side of the surface slab, Es, V, and sαβσ are the energy,
volume, and stress tensor for the supercell containing the relaxed surface slab, Eb, Vb, and
bαβσ are the energy, volume, and stress tensor of the equilibrium bulk materials in the
supercell.
To examine strain effect, we deformed the surfaces by a strain of ε, relaxed the
surface slabs at each given strain, and calculated the corresponding surface energy and
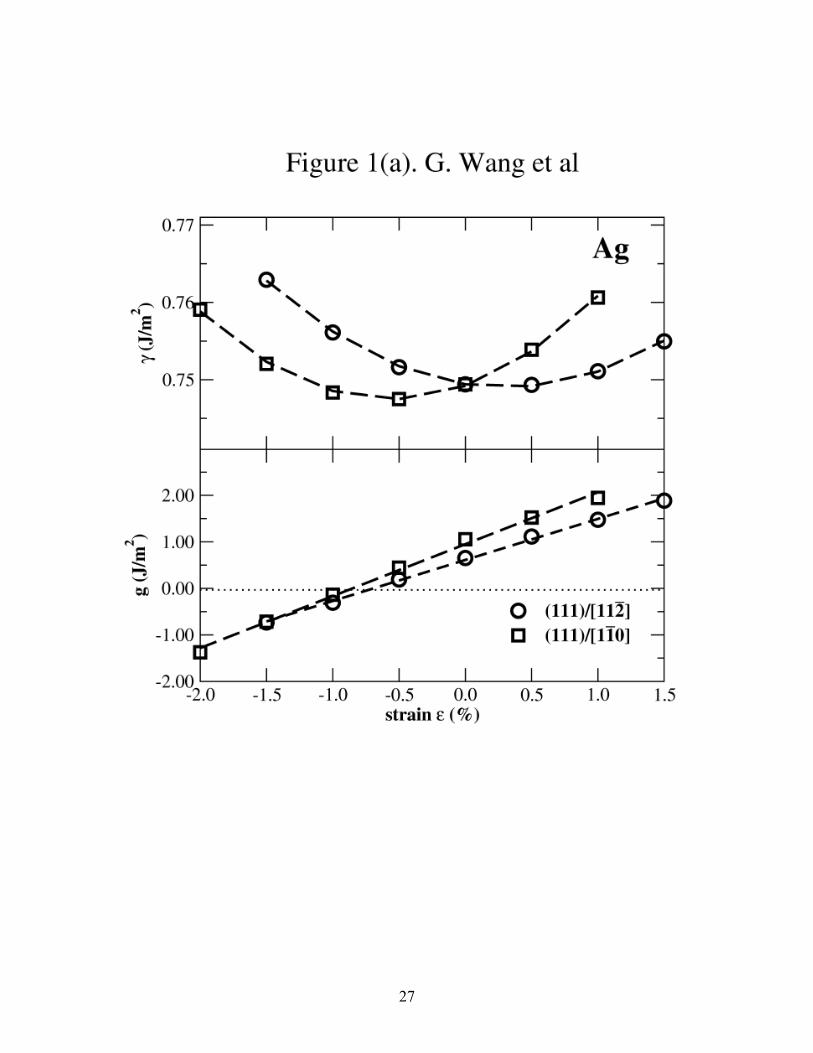
surface stress using Eq. (10). In Figure 1, we plot the calculated surface energies and
surface stresses as a function of strain ε for Ag, Au, and ZnO. For Ag and Au, we
deformed the (111) surfaces along both [ 211 ] and [ 011 ] directions. For ZnO, we
expanded the ( 0110 ) and ( 0211 ) surfaces along the [0001] direction.
Figure 1(a) shows that the surface energy of Ag (111) varies with the strain in a
quadratic function form. The surface energy will have its minimum value at a strain of
0.3 % along [ 211 ] direction and a strain of -0.6 % along [ 011 ] direction. Based on Eq.
(3), the equilibrium strain in the Ag nanowires would be larger than -0.6 %. The surface
stress exhibits a linear function of strain and is always positive when the strain in the
12
surface is larger than -0.7 %. Hence, surface stress will enhance (or stiffen) the Young’s
modulus of Ag nanowires according to Eq. (9). It is noticeable in the lower panel of Fig.
1 that the calculated surface stresses along [ 211 ] and [ 011 ] directions are not equal to
each other at the zero strain state of Ag (111) surface. This result is quite puzzling,
because the surface stress should be isotropic for the undeformed (111) surface of fcc
crystals owning to its three-fold rotational symmetry. 25 In some further tests, we found
that a non-negligible discrepancy in the calculated surface stress along the two directions
still exists even after we increase the k-points for integration, vary the number of surface
layers in our model, and/or switch to ultra-soft pseudopotential. Consequently, it appears
that there is some numerical error in determining surface stresses using DFT method.
However, our results (Fig. 3) will show that such errors in the values of calculated
surface stress do not have much effect on our model prediction of Young’s modulus of
Ag nanowires.
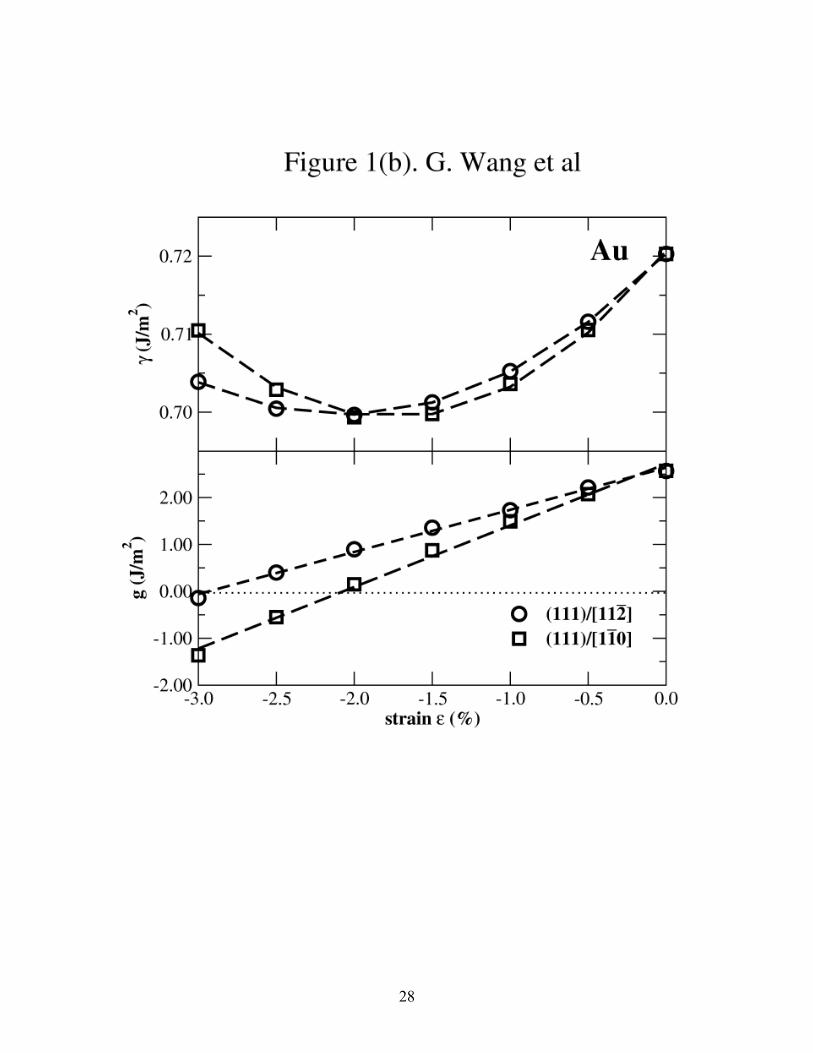
Figure 1(b) for Au (111) surface indicates that the minimum of its surface energy will
be at a strain of -2.1 % along [ 211 ] direction and a strain of -1.8 % along [ 011 ]
direction. The surface stress would change from negative to positive at the strain of -2.9
% along the [ 211 ] direction and the strain of -2.1 % along the [ 011 ] direction.
Conceivably, surface stress will enhance the Young’s modulus for Au nanowires.
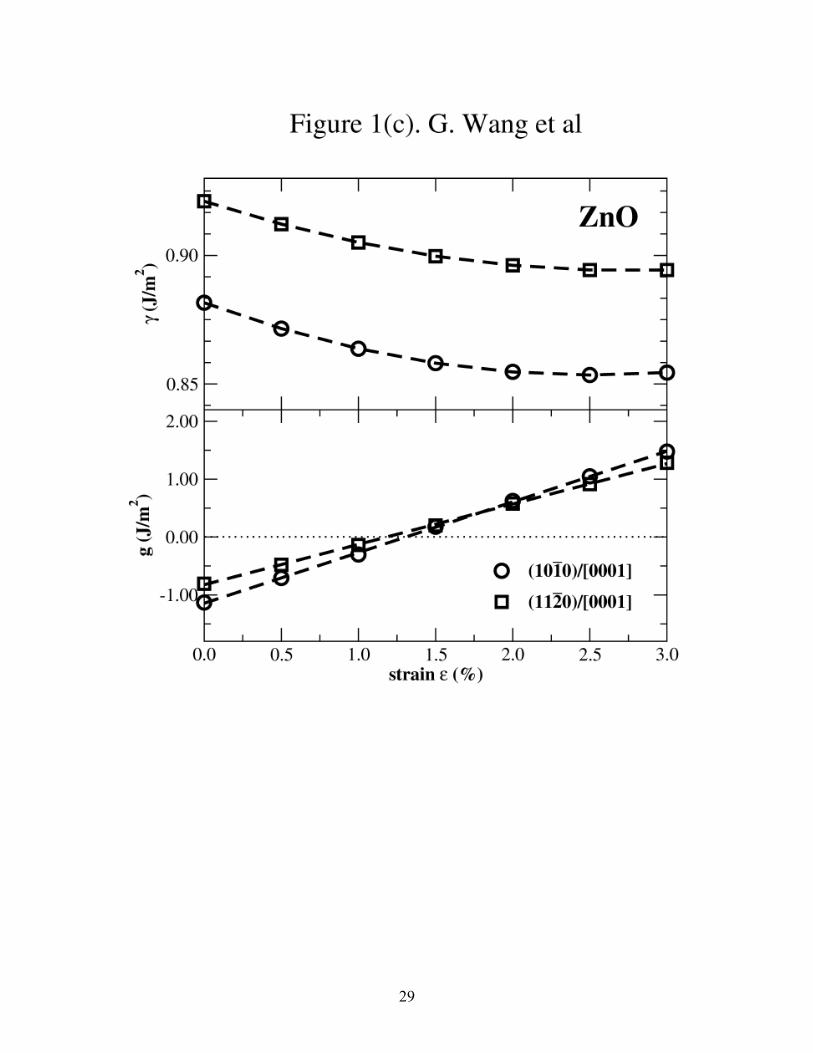
In stark contrast to the results of Ag and Au, it is seen in Fig. 1(c) for the two surfaces
of wurzite ZnO that the surface energies decrease with the expansion strain up to about
2.5 %, while the surface stresses (along [0001] direction) increase with the strain and
change signs (from negative to positive) at the strain about 1.25 %. Thus, our results in
Fig. 1(c) qualitatively point out that along [0001] direction the non-polar surfaces with a
13
strain below 1.25 % would facilitate elastic deformation and decrease (or soften) the
elastic modulus of 1D ZnO nanomaterials.
C. Model predictions
Figures 1 (b) and (c) show clearly that the surfaces do not always have their minimum
energy configuration at the state with a zero strain, where the bulk materials would reach
their minimum energy. Thus, the surfaces will exert a contraction (for Au) or expansion
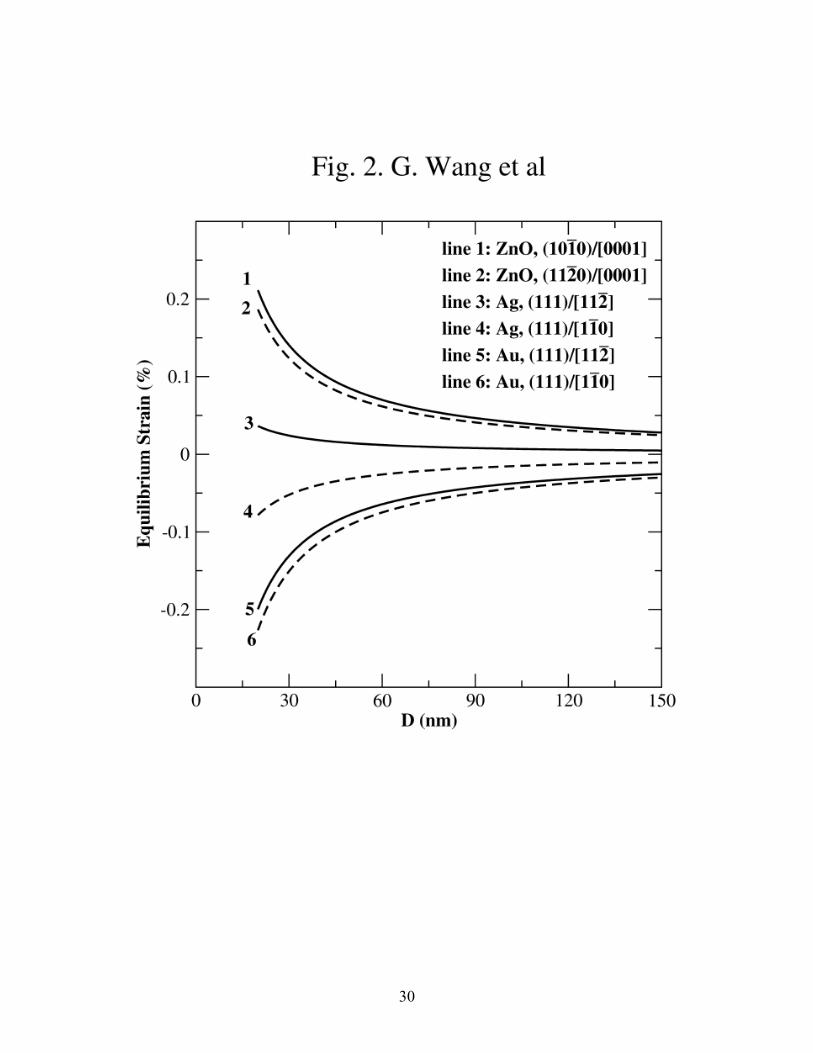
(for ZnO) force on the whole nanowires. As a result, it is expected that the equilibrium
Au nanowires are shorter than their bulk material counterparts and the equilibrium ZnO
nanowires are longer than their bulk material counterparts. To quantify this equilibrium
strain, we calculated the energy variations with the strains for bulk materials using DFT
method. Then, we employed Eq. (3) to find the equilibrium strain (ε*) for the nanowires
with different diameters. We plotted the calculated equilibrium strain compared to the
bulk lattice parameters in Fig. 2 for Ag, Au, and ZnO. Using the surface energies of
( 0110 )/[0001] and ( 0211 )/[0001] in Fig. 1(c), we predict an appreciable elongation
(positive equilibrium strain) in the equilibrium ZnO nanowires; using the surface energies
of (111)/[ 211 ] and (111)/[ 011 ] in Fig. 1(b), we predict an appreciable contraction
(negative equilibrium strain) in the equilibrium Au nanowires. However, we found in the
equilibrium Ag nanowires a small positive strain using the surface energies of
(111)/[ 211 ] (Fig. 1(a)) but a small negative strain using the surface energies of
(111)/[ 011 ] (Fig. 1(a)).
Through first-principles calculations, we have determined the value of bulk Young’s
modulus (Eb), Poisson’s ratio (ν), equilibrium strain (ε*), and surface stress (g) as a
14
function of strain. In this work, we assume L=1000 nm, which is the typical suspended
length of the nanowires in atomic force microscopy three-point bending tests. Inputting
all those calculated material-dependent parameters into Eq. (9), we predict the Young’s
modulus of the nanowires for Ag (Fig. 3), Au (Fig. 4), and ZnO (Fig. 5) as a function of
their diameters.
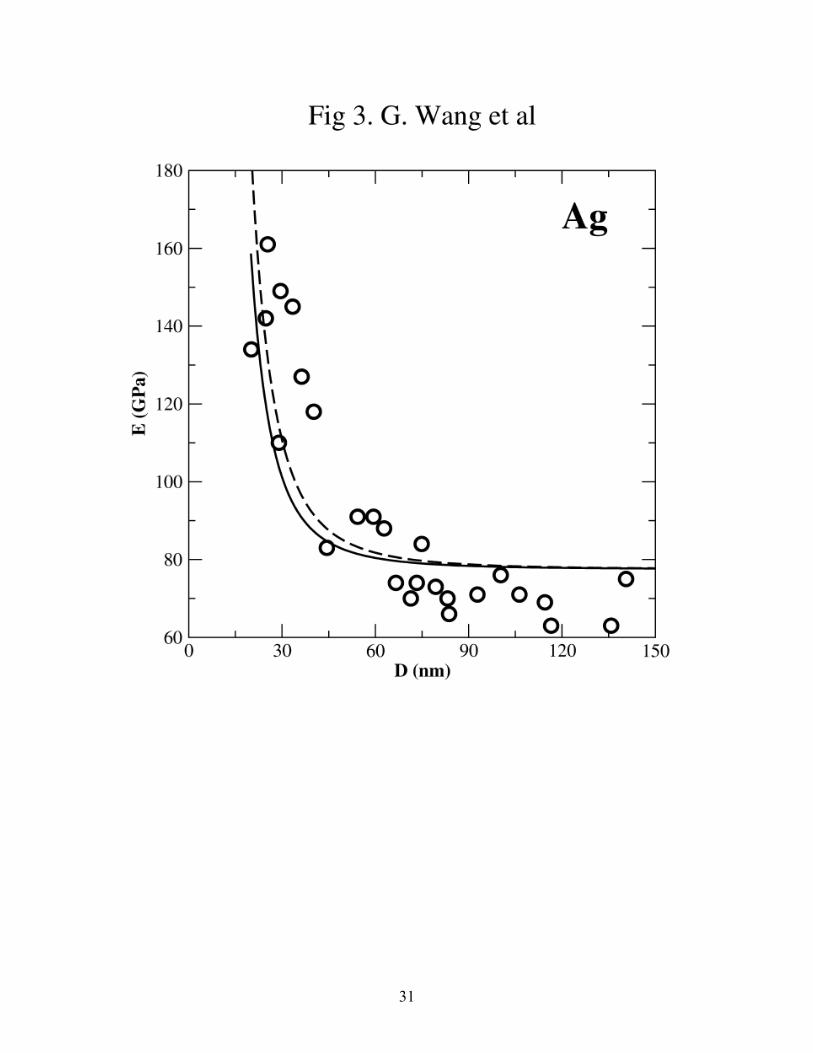
In Fig. 3, we predict that the Young’s modulus of Ag nanowire increases when its
diameter decreases. This is because Ag (111) surfaces have a positive surface stress and
thus enhance the Young’s modulus of the nanowires. Moreover, our theoretical
predictions (lines) agree excellently with experimental measurement data (circles) in Fig.
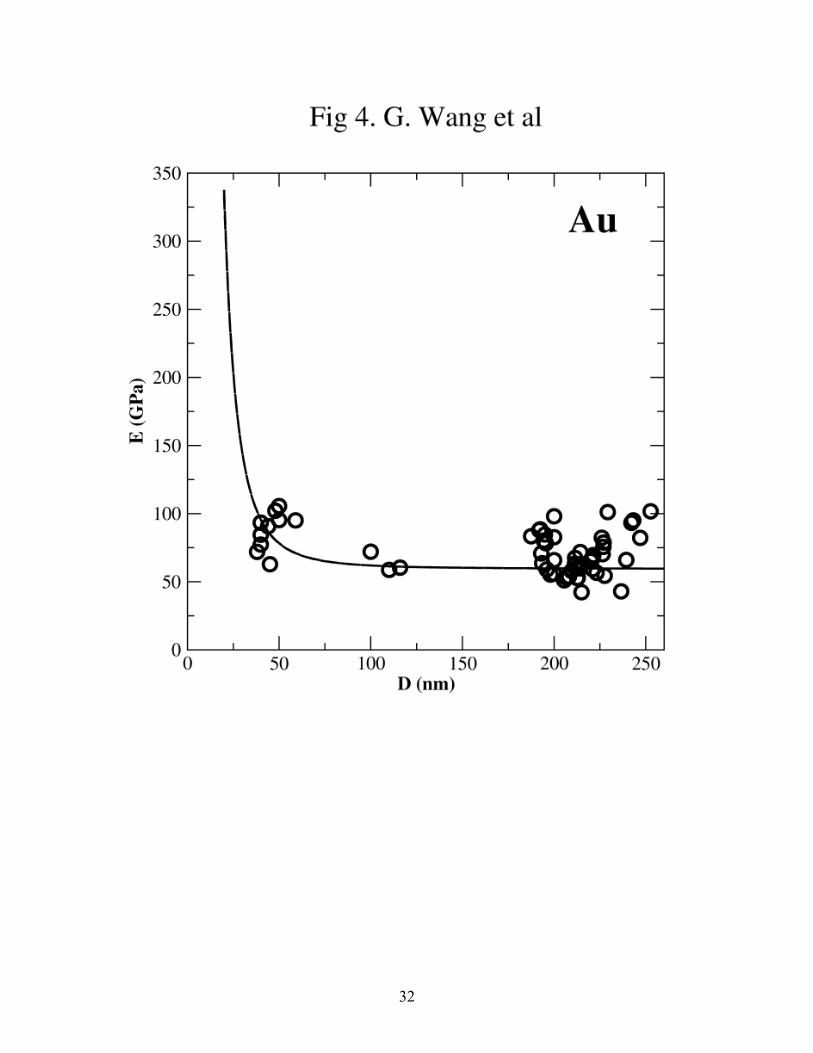
3. Moreover, our model predicts in Fig. 4 that the Young’s modulus of Au nanowire
would also increase when its diameter decreases due to its positive surface stress.
Although it was believed that the Young’s modulus of Au nanowires is “independent” of
diameter in Ref. 7, Fig. 4 shows that the same experimental data (especially the data for
the Au nanowires with diameters around 50 nm) are actually consistent with our model of
enhancing Young’s modulus for Au nanowires.
It is worth mentioning that the increase of the Young’s modulus with the decreasing
diameter of Au nanowires is quite slow when the nanowire diameters are larger than 75
nm. The calculated Young’s modulus of the Au nanowire with a diameter of 75 nm is
only about 9 % higher than the bulk Young’s modulus of Au. This apparent
“independency” is a result of two effects: (1) a compressive (negative) equilibrium strain
in the nanowire core leads to a decrease of the Young’s modulus of the nanowires, and
(2) a positive surface stress in the nanowire surface leads to an increase of the Young’s
modulus of the nanowires. When the diameter of Au nanowires are small (less than 75
15
nm), surface stress effect becomes dominant and is responsible for the sharp increase of
the Young’s modulus as shown in Fig. 4.
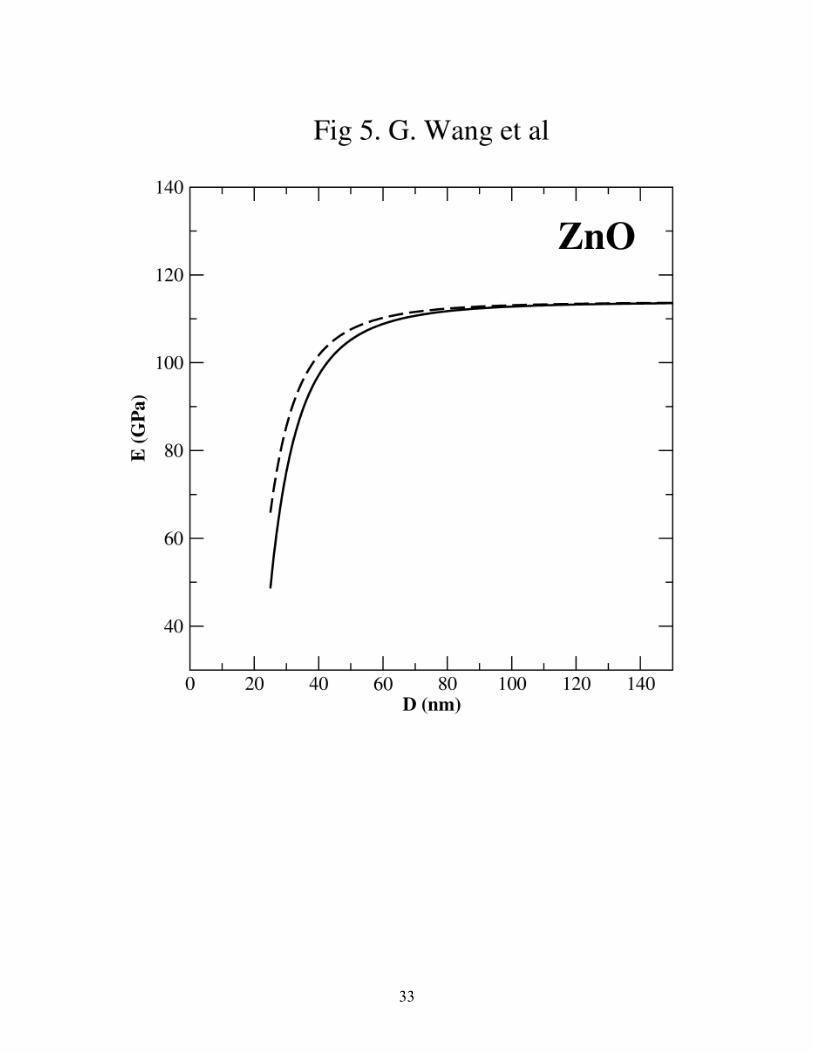
Plotted in Fig. 5 for ZnO nanowires with D>20 nm, our model predicts a decrease in
their Young’s modulus when reducing their diameters. This is due to the negative surface
stress of ZnO surfaces (see Fig. 1(c)). At this moment, there are no available (three-point
bending) experimental data of the Young’s modulus of ZnO nanowires for us to directly
compare our theoretical predictions with. However, there is much experimental evidence
that ZnO nanostructures have a lower elastic modulus than ZnO bulk materials. 8-13 Thus,
our model prediction in Fig. 5 is qualitatively consistent with those measurements. We
also notice that some studies report that ZnO nanowires have higher Young’s modulus
that increases with the decreasing size. 14,15 Here, we postulate an explanation to this
discrepancy in the literature. Our results in Figs. 1(c) and 5 are obtained from the fully-
relaxed ZnO surfaces, which are quite different from the corresponding bulk terminated
surfaces (see details in Sec. III.B). We found from our calculations for ZnO that the
surface stresses are negative for the fully-relaxed surfaces but positive for the un-relaxed
bulk terminated surfaces. This suggests that the value (positive or negative) of surface
stress may strongly depend on the extent of the surface relaxation process. Surface
relaxation process can be changed by surface contamination or surface charges, 46 which
can be introduced during sample preparation and measurement process. Thus, the
Young’s modulus of ZnO nanowires with a same diameter might exhibit different values
due to the surface stress effect for various surface conditions of the experimental samples.
Although our model (Eq. (9)) leads to satisfactory agreement between the theoretical
and experimental data for nanowires with a diameter larger than 20 nm, some further
16
improvement is required to accurately predict the Young’s modulus of small nanowires
with a diameter below 20 nm. For example, we express the total energy of nanowires as a
linear combination of its bulk and surface contribution in Eq. (1). When the nanowires
have very small diameters, some non-linear term must be included to that equation. In
addition, we currently use a flat, extended surface slab to model the nanowire surfaces.
For small nanowires, their surfaces are highly curved and hence have a significant
transverse stress (strain) component. Thus, the curvature effect must also be properly
addressed in an elaborated model for small nanowires.
IV. CONCLUSIONS
In this work, we first developed a model to predict the Young’s modulus of
nanowires from the properties of the corresponding bulk and surface materials. We
included two effects (equilibrium strain and surface stress) in our model to account for
the geometric size influence on the elastic properties of nanowires. To accurately
describe the surface stress effect, we must know the exact deformation process of
nanowires. This is because different loading conditions (for example, axial tensile test
and three-point bending test) would lead to different values of the changes in the length
and surface area of the nanowires during the elastic deformation. For a direct comparison
to experimental data, we focus on studying the clamped-end three-point bending loading
condition.
Furthermore, we calculated the bulk and surface properties of the materials using
first-principles DFT method. The calculated properties include Young’s modulus,
Poisson’s ratio, surface energy, and surface stress. Taking those theoretical data as inputs,
we predicted the Young’s modulus of Ag, Au, and ZnO nanowires as a function of
17
nanowire diameter. To validate our model and approach, we compared our theoretical
results with the experiment measurement results. It is found that our model predictions
for Ag and Au nanowires agree excellently with those experimental data. For ZnO
nanowires with D>20 nm, our predictions also agree qualitatively with a series of
experimental results. We believe that the agreement between our model and experimental
data is remarkable since we did not introduce any empirical data modifications in our
theoretical approach.
Our model reveals two major effects that the surface exerts on the elastic deformation
process of nanomaterials. First, the surface may have different minimum-energy lattice
parameters than the bulk lattice parameters of the material and thus result an equilibrium
strain in the nanowire core region. Second, the surface may have tensile or compressive
surface stress that is the energy required to elastically deform the surface. A tensile
surface stress would lead to an increase in Young’s modulus with the decreasing size of
nanowires, while a compressive surface stress would lead to a decrease in Young’s
modulus with the decreasing size of nanowires.
Our model indicates that the tensile (positive) surface stress is the reason for Ag and
Au nanowires showing an enhanced Young’s modulus when reducing nanowire
diameters. This viewpoint has been accepted owning to the support of myriads of
experimental and simulation studies. 4,7,25 Our model also points out that the compressive
(negative) surface stress in ZnO nanowires (with D> 20 nm) would lead to a softened
Young’s modulus when reducing nanowire diameters. We notice that some other
materials, such as Si, 6 GaN, 47-49 and ZnS, 50,51 exhibit the reduced Young’s modulus
when decreasing the size of their nanomaterials. Hence, we proposed based on our results
18
that the compressive surface stress, which is an inherent material property, is responsible
for the observed lower Young’s modulus of those nanomaterials compared to their bulk
modulus.
Since surface stress plays a very important role in determining the Young’s modulus
of nanomaterials, it is reasonable to expect that the elastic properties of nanomaterials
could be engineered by altering the surface stress through rational control of the
adsorptions, charges, structure, and impurities in the surfaces.
ACKNOWLEDGMENTS
The authors thank Dr. G.Y. Jing for providing the experimental Young’s modulus
data of Ag nanowires and Dr. B. Wu for providing the experimental Young’s modulus
data of Au nanowires. G.F. Wang acknowledges the research grants from Richard G.
Lugar Center for Renewable Energy and the Office of the Vice Chancellor for Research
(RSFG program) at Indiana University-Purdue University Indianapolis. X.D. Li
acknowledges the research grants from the National Science Foundation (GrantNo. EPS-
0296165 and CMMI-0653651), the ACS Petroleum Research Fund (ACS PRF#40450-
AC10), and the University of South Carolina NanoCenter.
19
References:
1. K.L. Ekinci and M.L. Roukes, Rev. Sci. Instrum. 76, 061101 (2005).
2. X. Wang, J. Song, J. Liu, and Z.L. Wang, Science 316, 102 (2007).
3. S. Cuenot, C. Frétigny, S. Demoustier-Champagne, and B. Nysten, Phys. Rev. B 69,
165410 (2004).
4. G.Y. Jing, H.L. Duan, X.M. Sun, Z.S. Zhang, J. Xu, Y.D. Li, J.X. Wang, and D.P. Yu,
Phys. Rev. B 73, 235409 (2006).
5. X. Li, T. Ono, Y. Wang, and M. Esashi, Appl. Phys. Lett. 83, 3081 (2003).
6. S.G. Nilsson, X. Borrisé, and L. Montelius, Appl. Phys. Lett. 85, 3555 (2004).
7. B. Wu, A. Heidelberg, and J.J. Boland, Nature Mater. 4, 525 (2005).
8. X.D. Bai, P.X. Gao, Z.L. Wang, and E.G. Wang, Appl. Phys. Lett. 82, 4806 (2003).
9. J. Song, X. Wang, E. Riedo, and Z.L. Wang, Nano Lett. 5, 1954 (2005).
10. M.H. Zhao, C.B. Jiang, S.X. Li, and S.X. Mao, Mater. Sci Eng. A 409, 223 (2005).
11. H. Ni and X.D. Li, Nanotechnology 17, 3591 (2006).
12. W. Mai and Z.L. Wang, Appl. Phys. Lett. 89, 073112 (2006).
13. M. Lucas, W. Mai, R. Yang, Z.L. Wang, and E. Reido, Nano Lett. 7, 1314 (2007).
14. C.Q. Chen, Y. Shi, Y.S. Zhang, J. Zhu, and Y.J. Yan, Phys. Rev. Lett. 96, 075505
(2006).
15. G. Stan, C.V. Ciobanu, P.M. Parthangal, and R.F. Cook, Nano Lett. 7, 3691 (2007).
20
16. J. Q. Broughton, C. A. Meli, P. Vashishta, and R. K. Kalia, Phys. Rev. B 56, 611
(1997).
17. R. E. Miller and V. B. Shenoy, Nanotechnology, 11, 139 (2000).
18. V. B. Shenoy, Phys. Rev. B 71, 094104 (2005).
19. L. G. Zhou and H. C. Huang, Appl. Phys. Lett. 84, 1940 (2004).
20. H. Y. Liang, M. Upmanyu, and H. C. Huang, Phys. Rev. B 71, 241403 (2005).
21. R. C. Cammarata, Prog. Surf. Sci. 1, 1 (1994).
22. G. Wang and X.D. Li, Appl. Phys. Lett. 91, 231912 (2007).
23. H.S. Park, J. Appl. Phys. 103, 123504 (2008).
24. W. Zhang, T. Wang, and X. Chen, J. Appl. Phys. 103, 123527 (2008).
25. J. Diao, k. Gall, and M.L. Dunn, J. Mech. Phys. Solids 52, 1935 (2004).
26. B. Lee and R.E. Rudd, Phys. Rev. B 75, 041305(R) (2007).
27. J.M. Gere and S.P. Timoshenko, Mechanics of Materials (PWS Engineering, Boston,
1987), p. 434.
28. G. Kresse and J. Hafner, Phys. Rev. B 47, 558 (1993).
29. G. Kresse and J. Furthmüller, Phys. Rev. B 54, 11169 (1996).
30. G. Kresse and D. Joubert, Phys. Rev. B 59, 1758 (1999).
31. J.P. Perdew and Y. Wang, Phys. Rev. B 45, 13244 (1992).
32. P. Söderlind, O. Eriksson, J.M. Wills, and A.M. Boring, Phys. Rev. B 48, 5844
(1993).
21
33. L. Fast, J.M. Wills, B. Johansson, and O. Eriksson, Phys. Rev. B 51, 17431 (1995).
34. N.W. Ashcroft and N.D. Mermin, Solid State Physics (Holt, Rinehart and Winston,
New York, 1976).
35. G. Simmons and H. Wang, Single Crystal Elastic Constants and Calculated
Aggregate Properties: A Handbook (MIT Press, Cambridge, 1971).
36. H. Rolnick, Phys. Rev. 36, 506 (1930).
37. H. Karzel, W. Potzel, M. Köfferlein, W. Schiessl, M. Steiner, U. Hiller, G.M.
Kalvius, D.W. Mitchell, T.P. Das, P. Blaha, K. Schwarz, and M.P. Pasternak, Phys.
Rev. B 53, 11425 (1996).
38. J. Albertsson, S.C. Abrahams, and Å. Kvick, Acta Crystallogr. B 45, 34 (1989).
39. T.B. Bateman, J. Appl. Phys. 33, 3309 (1962).
40. S.O. Kucheyev, J.E. Bradby, J.S. Williams, C. Jagadish, and M.V. Swain, Appl. Phys.
Lett. 80, 956 (2002).
41. F. Soria, J.L. Sacedon, P.M. Echenigire, and D. Titherington, Surf. Sci. 68, 448
(1977).
42. Ž. Crljen, P. Lazić, D. Šokčević, and R, Brako, Phys. Rev. B 68, 195411 (2003).
43. C.B. Duke, R.J. Meyer, A. Paton, and P. Mark, Phys. Rev. B 18, 4225 (1978).
44. B. Meyer and D. Marx, Phys. Rev. B 67, 035403 (2003).
45. R.J. Needs, Phys. Rev. Lett. 58, 53 (1987).
46. G.A. Somorjai, Annu. Rev. Phys. Chem. 45, 721 (1994).
22
47. C.Y. Nam, P. Jaroenapibal, D. Tham, D.E. Luzzi, S. Evoy, and J.E. Fischer, Nano
Lett. 6, 153 (2006).
48. H. Ni, X. D. Li, G. S. Cheng, and R. Klie, J. Mater. Res. 21, 2882 (2006).
49. G. Feng, W.D. Nix, Y. Yoon, and C.J. Lee, J. Appl. Phys. 99, 074304 (2006).
50. X. D. Li, X.X. Wang, Q.H. Xiong, and P.C. Eklund, Nano Lett. 5, 1982 (2005).
51. Q. Xiong, N. Duarte, S. Tadigadapa, and P.C. Eklund, Nano Lett. 5, 1904 (2006).
23
Table:
TABLE I. Calculated equilibrium lattice constants (a), elastic constants (C11, C12, and
C44), Young’s modulus (E), and Poisson’s ratio (ν) of fcc Ag and Au using first-
principles DFT method. For comparison, the experimental values are also given.
Ag Au
This work Exp. This work Exp.
a (Å) 4.159 4.09 a 4.174 4.08 a
C11 (GPa) 117.7 124 b 165.9 186 b
C12 (GPa) 90.3 93.4 b 142.2 157 b
C44 (GPa) 38.0 46.1 b 26.7 42 b
E (GPa) 77.5 c 79 e 59.5 c 80 e
ν 0.370 d 0.38 e 0.434 d 0.42 e
a Reference 34.
b Reference 35.
c ( )( )
441211
1211441211
3223
CCCCCCCC
E++
++−=
d ( )
( ) 1322
25
441211
1211 −++
+=
CCCCC
ν
e Reference 36.
24
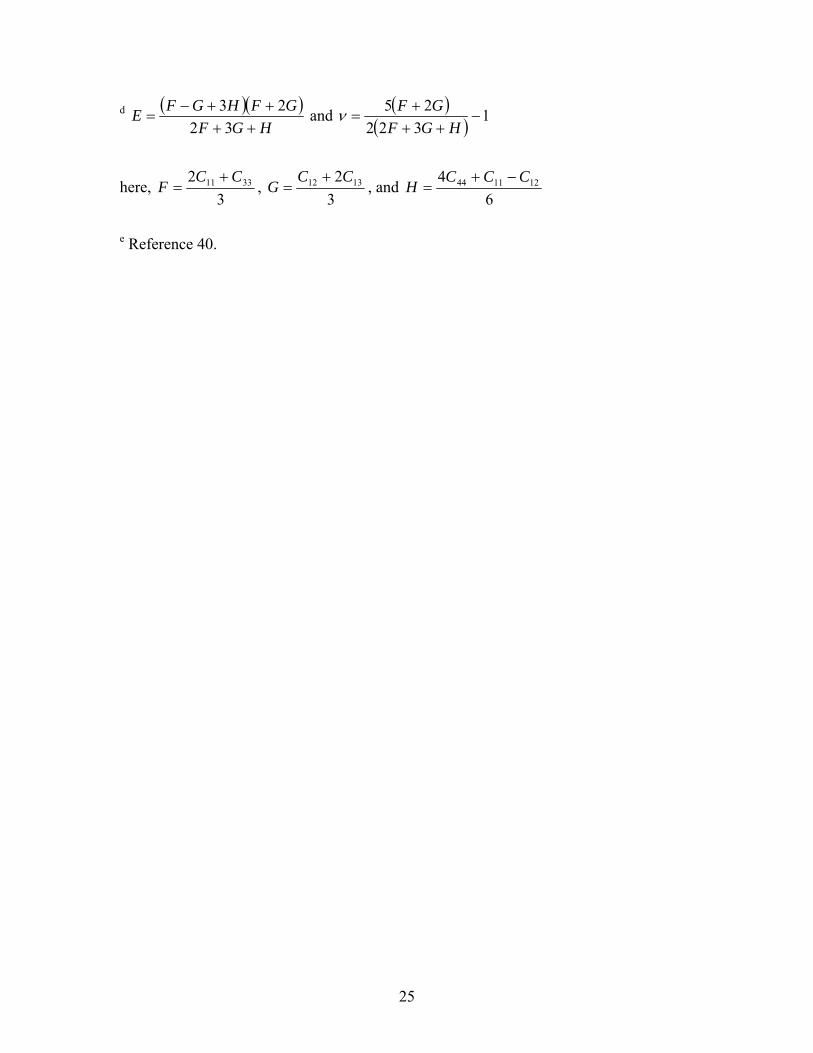
TABLE II. Calculated equilibrium lattice constants (a and c), internal parameter (u),
elastic constants (C11, C12, C13, C33, and C55), Young’s modulus (E), and Poisson’s ratio
(ν) of wurtzite ZnO using first-principles DFT method. For comparison, the experimental
values are also given.
This work Exp.
a (Å) 3.282 3.2496 a
c (Å) 5.292 5.2042 a
u 0.380 0.3819 b
C11 (GPa) 191.7 209.7 c
C12 (GPa) 110.0 121.1 c
C13 (GPa) 96.7 105.1 c
C33 (GPa) 203.4 210.9 c
C55 (GPa) 37.2 42.5 c
E (GPa) 113.8 d 111.2 e
ν 0.357 d -
a Reference 37.
b Reference 38.
c Reference 39.
25
d ( )( )HGF
GFHGFE++
++−=
3223 and ( )
( ) 1322
25−
+++
=HGF
GFν
here, 3
2 3311 CCF
+= ,
32 1312 CC
G+
= , and 6
4 121144 CCCH
−+=
e Reference 40.
26
Figure Captions:
Figure 1. Variation of the surface energies (γ) and the surface stresses (g) along (a) the
[ 211 ] and [ 011 ] directions of Ag (111) surface, (b) the [ 211 ] and [ 011 ]
directions of Au (111) surface, and (c) the [0001] direction of ZnO ( 0110 )
and ( 0211 ) surfaces. In the figures, the dashed lines in the upper panel are the
quadratic function fitting of calculated surface energy data and the dashed
lines in the lower panel are the linear fitting of calculated surface stress data.
Figure 2. Calculated equilibrium strains in the equilibrium Ag, Au, and ZnO nanowires
as a function of nanowire diameter.
Figure 3. Size dependency of the Young’s modulus of Ag nanowires enclosed by (111)
surfaces. The solid line and dashed line show the model predictions using the
surface properties of (111)/[ 211 ] and (111)/[ 011 ], respectively. For
comparison, the experimental data from Ref. 4 are plotted as circles.
Figure 4. Size dependency of the Young’s modulus of Au nanowires enclosed by (111)
surfaces. The two dashed lines (overlapped with each other) show the model
predictions using the surface properties of (111)/[ 211 ] and (111)/ [ 011 ]. For
comparison, the experimental data from Ref. 7 are plotted as circles.
Figure 5. Predicted size dependency of the Young’s modulus of ZnO nanowires enclosed
by ( 0110 ) surfaces (solid line) or ( 0211 ) surfaces (dashed line).
27
28
29
30
31
32
33