Embed Size (px)
Citation preview
INTERNATIONAL JOURNAL OF OPTIMIZATION IN CIVIL ENGINEERING
Int. J. Optim. Civil Eng., 2018; 8(3):381-399
PREDICTION OF BIAXIAL BENDING BEHAVIOR OF STEEL-
CONCRETE COMPOSITE BEAM-COLUMNS BY ARTIFICIAL
NEURAL NETWORK
A. Behnam and M. R. Esfahani*, †
Department of Civil Engineering, Faculty of Engineering, Ferdowsi University of Mashhad,
Iran
ABSTRACT
In this study, the complex behavior of steel encased reinforced concrete (SRC) composite
beam–columns in biaxial bending is predicted by multilayer perceptron neural network. For
this purpose, the previously proposed nonlinear analysis model, mixed beam-column
formulation, is verified with biaxial bending test results. Then a large set of benchmark
frames is provided and P-Mx-My triaxial interaction curve is obtained for them. The
specifications of these frames and their analytical results are defined as inputs and targets of
artificial neural network and a relatively accurate estimation model of the nonlinear behavior
of these beam-columns is presented. In the end, the results of neural network are compared
to some analytical examples of biaxial bending to determine the accuracy of the model.
Keywords: steel-concrete composite; composite beam-column; steel encased
reinforced concrete; nonlinear analysis; artificial neural network; multilayer
perceptron.
Received: 10 September 2017; Accepted: 12 November 2017
1. INTRODUCTION
SRC steel-concrete composite frames are highly efficient and economic structures that
directed less attention than concrete and steel structures due to the complexities in their
behavior analysis. The features of steel structures include high strength, ductility and fast
implementation. Also concrete structures are cost effective and durable and have high
resistance to fire. Composite structures by using steel and concrete in the appropriate
location, utilize the features of both groups. SRC columns include higher resistance to
*Corresponding author: Department of Civil Engineering, Faculty of Engineering, Ferdowsi University of
Mashhad, Iran
[email protected] (M. R. Esfahani)
A. Behnam and M. R. Esfahani
382
reinforced concrete columns in the same section, resistance against fire and corrosion of
steel, more unbraced length in tall columns and more resistance against explosion and strike.
Different models are presented for analyzing the behavior of composite beam-columns.
Three types of modeling are possible for these structures. The first model is a continuous
three-dimensional analysis which is very accurate. In this analysis, concrete and steel are
modeled with brick and shell elements and contact surface of two materials are modeled
with gap and frictional elements. Schneider [1], Johansson and Gylltoft [2],Varma et al. [3],
Hu et al. [4] used this model to analyze composite beam-columns. Despite high accuracy,
heavy cost of calculations makes this method impractical in analysis of frames. The second
model considers the nonlinear behavior of material only at the end of the members' joints
and it is called concentrated plasticity model. Hajjar and Gourley [5], El-Tawil and Deierlein
[6], Inai et al. [7] used this model to examine the behavior of composite beam-columns. The
third model is distributed plasticity model which provides nonlinear behavior of materials at
integration points of member elements. This method has higher accuracy compared to
concentrated plasticity. Also it requires less time to analyze than a continuous three-
dimensional model. Hajjar et al. [8], Aval et al. [9], Varma et al. [3], Tort et al. [10], Denavit
and Hajjar [11], Liang et al. [12] and Denavit et al. [13] have used distributed plasticity
model to analyze composite beam-columns. Among these models Denavit and Hajjar [11],
Liang et al. [12] have used three-dimensional model for biaxial bending analysis of these
beam-columns.
Many different experiments have been conducted with regard to investigation of behavior
and biaxial bending resistance of composite beam–columns. Virdi and Dowling [14] tested
ultimate strength of SRC beam-columns in biaxial bending. In these experiments, 9 concrete
beam-column samples with central core in the form of H in biaxial eccentricity and lengths
were examined. In 1984, Morino et al. [15] conducted laboratory studies on elasto-plastic
behavior of SRC composite beam-columns by applying biaxial eccentricity loading. In these
experiments, eccentricity effects, the angle between the loading point and the main axis and
slenderness ratio on load-displacement behavior and maximum load capacity were
performed. Munoz and Hsu [16] applied curvilinear axial force and biaxial bending on four
small scale concrete beam-columns with I-shaped steel core. The sections include one short
column and three slender columns with square sections.
Different types of artificial neural networks have been used in various civil engineering
subjects, including estimation of beam–columns behavior. These networks with nonlinear
behavior and large number of parameters are able to accurately estimate different issues.
Kaveh and Iranmanesh [17-19] performed a comparative study of backpropagation and
improved counter propagation neural networks in structural analysis and optimization.
Ahmadi et al. [20, 21] predicted the capacity of short and long circular composite columns
filled with concrete under axial load. The input data are laboratory results and the effects of
yield stress, tube wall thickness, column length, concrete strength and column dimensions
have been investigated. Kaveh et al. [22, 23] predicted the moment-rotation characteristic
for saddle-like and semi-rigid connections using FEM and BP neural networks. Afaq et al.
[24] examined the effect of steel fibers on load bearing capacity of RC beams using artificial
neural network. The database of neural networks has been extracted from previous results of
experiments and after validation, this network was used for a parametric research on the
effect of various parameters related to steel fibers, material properties, and cross sectional
PREDICTION OF BIAXIAL BENDING BEHAVIOR OF STEEL-CONCRETE... 383
geometry. By analyzing output estimates, it was determined that this neural network can
quantify the effects of different parameters for RC load capacity. Kaveh and Servati [25, 26]
used artificial neural networks for the purpose of analysis and design optimization of double
layer grids. Also Kaveh and Raiessi Dehkordi [27] investigated the application of artificial
neural networks in predicting the deformation of domes under wind load. Kumar and Yadav
[28] performed beam–columns buckling analysis using mathematical model and neural
network of multilayer perceptron, and compared the output results of neural network with
Euler's mathematical formula. Rofoei et al. [29] estimated the vulnerability of the concrete
moment resisting frame structures using artificial neural networks. Kotsovou et al. [30]
predicted the behavior of circumferential RC beam–columns connections using neural
network. The neural network predictions for failure mode and load bearing capacity of these
connections confirmed the shortcomings in the regulation which was previously identified
by analytical methods. Sadowski et al. [31] performed and compared non-destructive
detection of adhesion tension of a concrete substrate layer added to concrete layer with
variable thickness using a neural network and with different algorithms.
There are only a few experiments on biaxial bending of composite beam–columns which
are limited to axial forces and specific angles. Therefore, it is not possible to create a neural
network using laboratory results to predict their behavior. Also due to complexity and time-
consuming analytical methods, it is not possible to easily use them for researchers. For this
reason, in this study after re-verification of composite columns model of Denavit and Hajjar
[32] with the laboratory results of biaxial bending, a large set of square SRC composite
columns with different lengths and dimensions created and for each one the three
dimensional P-Mx-My interaction curve was designed. After that, by using multilayer
perceptron neural network, a fairly accurate estimate for three-dimensional behavior of these
columns was presented and the neural network output was compared with analytical results
to determine the accuracy of model.
2. NONLINEAR ANALYSIS
2.1 Constitutive relationships presented for composite sections
Nonlinear behavior of material in cross section is followed at integral points within the
element. The cycling comprehensive constitutive formulas for steel and concrete presented
in the researches of Denavit and Hajjar [32] have been used. These models consider
prominent features of each material and the interaction between them.
Constitutive formulas between concrete and steel are selected in accordance with AISC
360-16 [33] and ACI 318-14 [34] regulations. Therefore, in this study, the tension in
concrete has been neglected and local buckling has not been considered. The method based
on Chang and Mander [35] is used for the cyclic behavior of concrete. Also for uniform
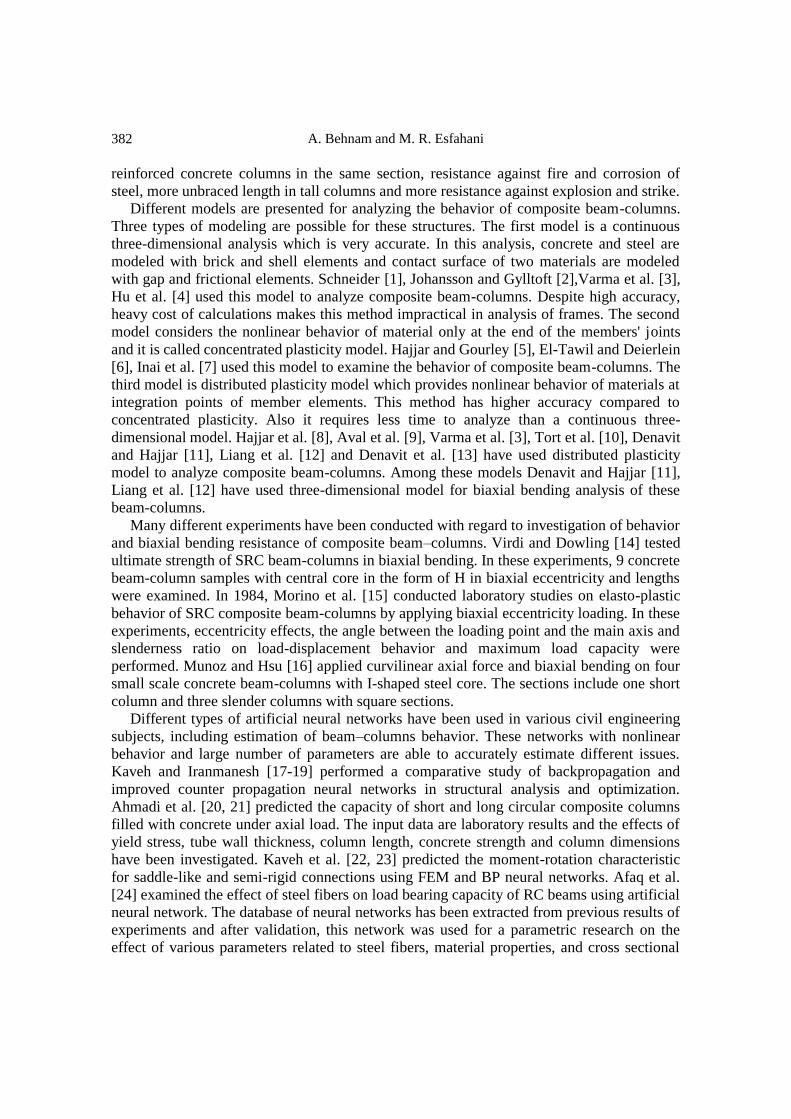
response of concrete strength Popovic equation [36] (equation 1) has been used. A schematic
view of this relationship is presented in Fig. 1. The confined model of Mander [37] has been
used to determine the increase of compressive strength and ductility.
A. Behnam and M. R. Esfahani
384
(1a) 𝑦 =𝑟𝑥
𝑟 − 1 + 𝑥𝑟
Popovic
(1973) (1b) 𝑟 =𝑛
𝑛 − 1
In these formulas, x is normalized strain and n is normalized module of elasticity.
Figure 1. Constitutive formula presented by Popovic for uniform response of concrete
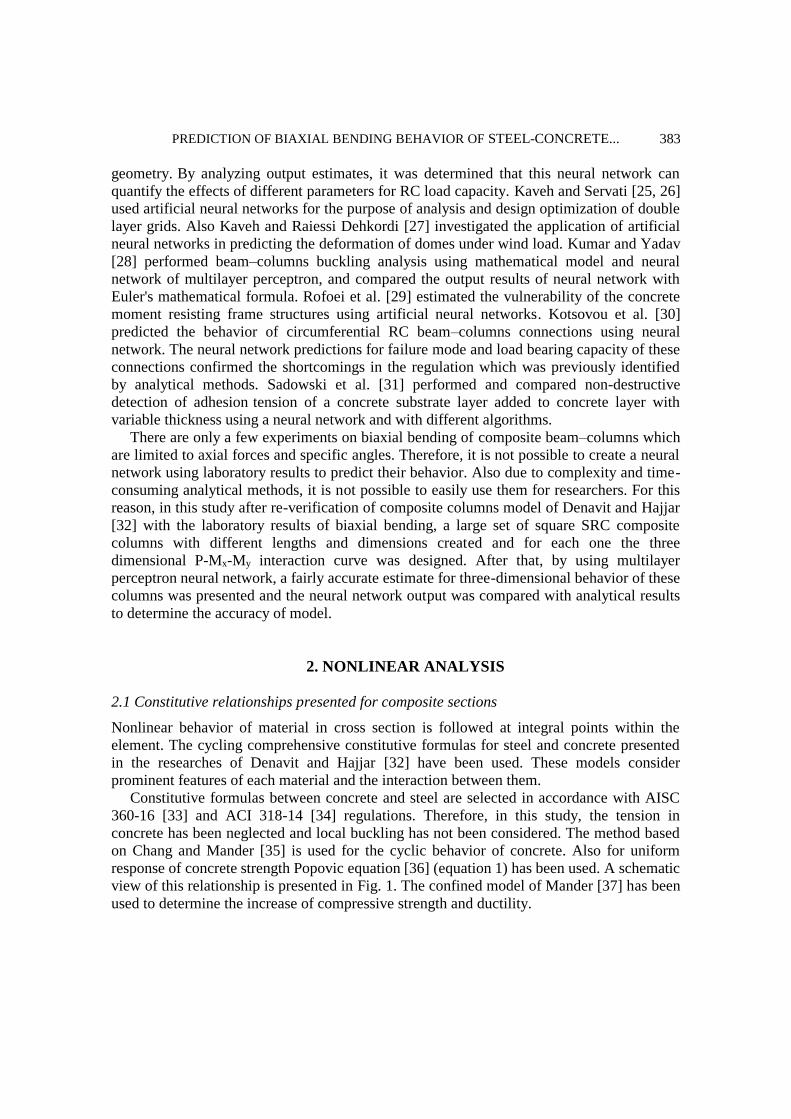
In SRC columns, constitutive formula of elastic–perfectly plastic has been used to model
the steel core. This formula is defined with initial stiffness and yield strength (Fig. 2). This
model is suitable to be used in hot-rolled steel sections and armatures.
Figure 2. elastic–perfectly plastic constitutive relationship for steel sections of SRC beam-
columns
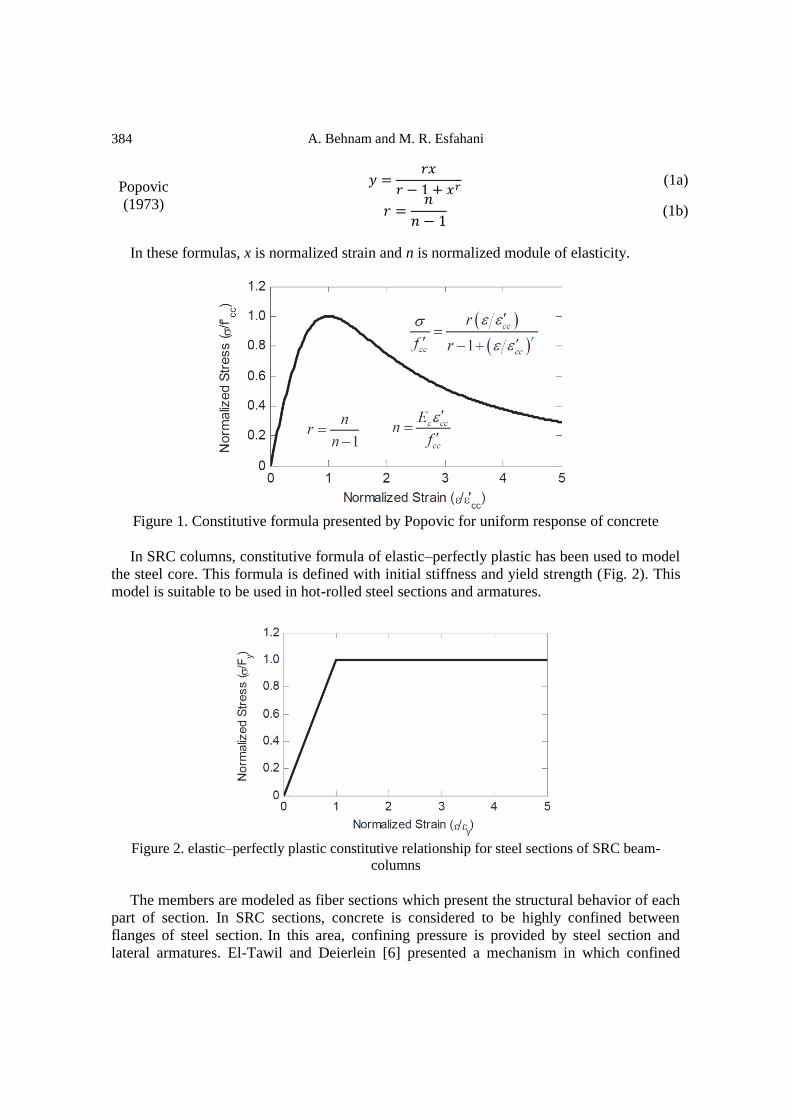
The members are modeled as fiber sections which present the structural behavior of each
part of section. In SRC sections, concrete is considered to be highly confined between
flanges of steel section. In this area, confining pressure is provided by steel section and
lateral armatures. El-Tawil and Deierlein [6] presented a mechanism in which confined
PREDICTION OF BIAXIAL BENDING BEHAVIOR OF STEEL-CONCRETE... 385
pressure created by steel section is calculated by equation 2a, only along the y axis, by
considering plastic moment capacity of the flange, shown in Fig. 5a. The distance between
parabolic vertex and central line of steel section is defined with equation 2b. This area
indicates the boundary between highly confined area and medium confined area. This
parabolic area has been modeled in different directions of the steel section directly with
different equations (Fig. 3b). The area between cover and parabolic shape is modeled in
order to provide average behavior through using ke coefficient.
(a) (b)
Figure 3. SRC fiber cross section (a) Different area division of SRC column section, (b) A
sample of fiber section of SRC composite column
(2a) 𝐹𝑙𝑦,ℎ𝑖𝑔ℎ = 𝐹𝑙𝑦,𝑚𝑒𝑑𝑖𝑢𝑚 +𝑡𝑓2𝐹𝑦𝑠
0.75(𝑏𝑓 − 𝑡𝑤)2
(2b) 𝑧𝑎 = 0.50𝑏𝑓 − 0.25(𝑑 − 2𝑡𝑓) ≥ 0.50𝑡𝑤
(2c) 𝑟𝑛,𝑝𝑜𝑠𝑡 = 0.75
2.1 The formulation used in nonlinear analysis
Beam elements are classified based on major unknown variables into three groups including
displacement-based, force-based and the mixture of these two methods. In the deformation-
based method, or in other words stiffness method, elements consider joint deformations as
major unknowns, Hajjar and Gourley [5], Aval et al. [9], Alemdar and White [38].
The deformations of element are calculated using interpolator functions. The equilibrium
of the element is satisfied only in a variational state and internal forces of element do not
accurately satisfy the equilibrium. This type of formulation is normally considered for use
and expansion of simple nonlinear geometric behavior. Interpolator functions, which are
commonly used for deformations, only model linear curvature distribution along the
element. This is a very important limitation, especially when the plastic joints are formed
which causes a highly nonlinear curvature distribution. In force-based method, or in other
words softness method, the elements consider tensions as the major unknowns, De Souza
[39], El-Tawil and Deierlein [6], Alemdar and White [38].
The forces are calculated along the length of elements using interpolator functions. The
equilibrium of the element is certainly satisfied but compatibility of deformations in element
A. Behnam and M. R. Esfahani
386
will be only satisfied in the variational state. Compared to element with displacement-based
method, force-based elements are often time-consuming and have high computational costs.
Elements mixed by element forces and joint displacements are considered as the major
unknowns which allows the use of interpolator functions for deformation of elements and
stresses along with the length of element, Nukala and White [40], Alemdar and White [38],
Tort and Hajjar [10], Denavit and Hajjar [11].
Despite complexity of analysis process, which is usually longer than the methods based
on displacement and force, the mixed method is a proper balance between estimation of
nonlinear curves along the element and the ability to consider direct nonlinear geometric
behavior.
In this study, mixed beam element, implemented in the framework of OpenSees software
by Denavit and Hajjar [11, 32] has been used for the nonlinear analysis of composite
columns.
2.2 Interaction curve
By a set of complete nonlinear analysis, interaction curves of biaxial bending moment –
axial forces for each section and each frame was created. An analysis was performed only
with axial force to determine the critical axial load, then a set of analysis was carried out to
apply constant axial load and incremental lateral load. In the case of zero axial load, section
analysis was performed instead of frame analysis. In each analysis, the critical point is
determined when the minimum eigenvalue is zero. In cases where this does not occur, the
critical point is created when the maximum longitudinal strain in each section of each
member reaches 0.05. At critical point, the amount of applied loads and internal forces is
recorded, and it is possible to construct the interaction curve of first-order loads and
interaction of second-order internal forces. A sample of these diagrams is shown for SRC
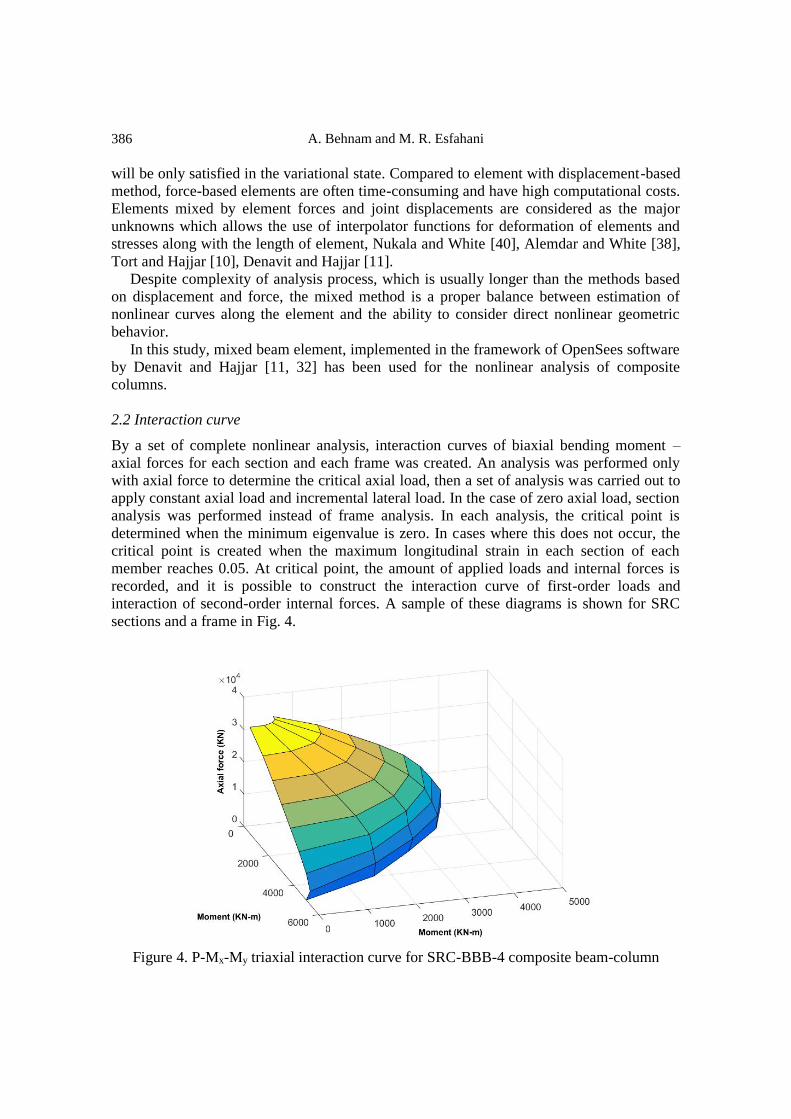
sections and a frame in Fig. 4.
Figure 4. P-Mx-My triaxial interaction curve for SRC-BBB-4 composite beam-column
PREDICTION OF BIAXIAL BENDING BEHAVIOR OF STEEL-CONCRETE... 387
3. COMPARING THE MODEL WITH BIAXIAL LABORATORY RESULTS
The nonlinear model described in the previous section is compared and verified in Denavit
and Hajjar [32] research with the existing laboratory results. In this section, the results of
nonlinear analysis of SRC columns with biaxial bending tests are verified by Morino et al.
[15] and Virdi and Dowling [14]. That is, P-Mx-My interaction diagram for the sections used
in the tests is obtained by using nonlinear analysis. Because in tests the biaxial bending
behavior is examined only in one axial load, three-dimensional interaction curve was cut at
this axial load and Mx-My two-dimensional curve was obtained. In this case, the recorded
moments in the lab was compared with analysis results. In table 3 the ratio of test results to
analysis results is presented. Fig. 4 is an example of this comparison.
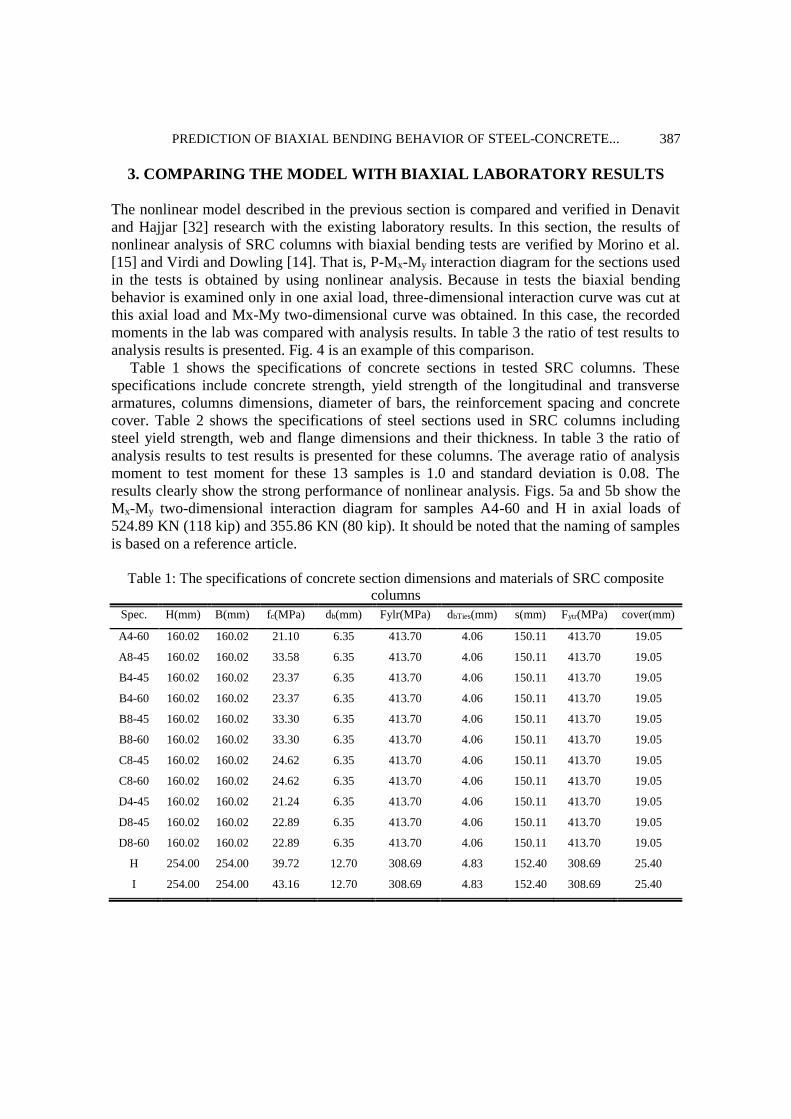
Table 1 shows the specifications of concrete sections in tested SRC columns. These
specifications include concrete strength, yield strength of the longitudinal and transverse
armatures, columns dimensions, diameter of bars, the reinforcement spacing and concrete
cover. Table 2 shows the specifications of steel sections used in SRC columns including
steel yield strength, web and flange dimensions and their thickness. In table 3 the ratio of
analysis results to test results is presented for these columns. The average ratio of analysis
moment to test moment for these 13 samples is 1.0 and standard deviation is 0.08. The
results clearly show the strong performance of nonlinear analysis. Figs. 5a and 5b show the
Mx-My two-dimensional interaction diagram for samples A4-60 and H in axial loads of
524.89 KN (118 kip) and 355.86 KN (80 kip). It should be noted that the naming of samples
is based on a reference article.
Table 1: The specifications of concrete section dimensions and materials of SRC composite
columns
Spec. H(mm) B(mm) fc(MPa) db(mm) Fylr(MPa) dbTies(mm) s(mm) Fytr(MPa) cover(mm)
A4-60 160.02 160.02 21.10 6.35 413.70 4.06 150.11 413.70 19.05
A8-45 160.02 160.02 33.58 6.35 413.70 4.06 150.11 413.70 19.05
B4-45 160.02 160.02 23.37 6.35 413.70 4.06 150.11 413.70 19.05
B4-60 160.02 160.02 23.37 6.35 413.70 4.06 150.11 413.70 19.05
B8-45 160.02 160.02 33.30 6.35 413.70 4.06 150.11 413.70 19.05
B8-60 160.02 160.02 33.30 6.35 413.70 4.06 150.11 413.70 19.05
C8-45 160.02 160.02 24.62 6.35 413.70 4.06 150.11 413.70 19.05
C8-60 160.02 160.02 24.62 6.35 413.70 4.06 150.11 413.70 19.05
D4-45 160.02 160.02 21.24 6.35 413.70 4.06 150.11 413.70 19.05
D8-45 160.02 160.02 22.89 6.35 413.70 4.06 150.11 413.70 19.05
D8-60 160.02 160.02 22.89 6.35 413.70 4.06 150.11 413.70 19.05
H 254.00 254.00 39.72 12.70 308.69 4.83 152.40 308.69 25.40
I 254.00 254.00 43.16 12.70 308.69 4.83 152.40 308.69 25.40
A. Behnam and M. R. Esfahani
388
Table 2: The specifications of steel section dimensions of SRC composite columns
Spec. d(mm) tw(mm) bf(mm) tf(mm) Fy (MPa)
A4-60 100.08 6.10 100.08 7.87 344.75
A8-45 100.08 6.10 100.08 7.87 344.75
B4-45 100.08 6.10 100.08 7.87 344.75
B4-60 100.08 6.10 100.08 7.87 344.75
B8-45 100.08 6.10 100.08 7.87 344.75
B8-60 100.08 6.10 100.08 7.87 344.75
C8-45 100.08 6.10 100.08 7.87 344.75
C8-60 100.08 6.10 100.08 7.87 344.75
D4-45 100.08 6.10 100.08 7.87 344.75
D8-45 100.08 6.10 100.08 7.87 344.75
D8-60 100.08 6.10 100.08 7.87 344.75
H 152.40 6.35 152.40 6.35 314.69
I 152.40 6.35 152.40 6.35 314.69
Table 3: The ratio of test results to nonlinear analysis results for SRC columns
Spec. H(mm) B(mm) L(mm) Angle Pexp
(KN)
Mexp
(KN.m) Manal(KN.m) Manal/Mexp Ref.
A4-60 160.02 160.02 960.12 60.00 524.02 24.15 24.42 1.01 Morino 1984
A8-45 160.02 160.02 960.12 45.00 378.61 31.63 30.07 0.95 Morino 1984
B4-45 160.02 160.02 2400.30 45.00 389.60 23.43 23.69 1.01 Morino 1984
B4-60 160.02 160.02 2400.30 60.00 436.39 26.99 24.38 0.90 Morino 1984
B8-45 160.02 160.02 2400.30 45.00 294.19 31.27 29.22 0.93 Morino 1984
B8-60 160.02 160.02 2400.30 60.00 328.31 33.28 31.24 0.94 Morino 1984
C8-45 160.02 160.02 3600.45 45.00 195.27 25.88 24.37 0.94 Morino 1984
C8-60 160.02 160.02 3600.45 60.00 194.02 23.04 26.61 1.15 Morino 1984
D4-45 160.02 160.02 4800.60 45.00 209.01 19.10 18.12 0.95 Morino 1984
D8-45 160.02 160.02 4800.60 45.00 146.61 21.69 22.67 1.04 Morino 1984
D8-60 160.02 160.02 4800.60 60.00 158.35 21.29 24.25 1.14 Morino 1984
H 254.00 254.00 7432.29 30.11 353.66 84.20 86.90 1.03 Virdi 1973
I 254.00 254.00 7432.29 30.11 293.88 96.38 89.74 0.93 Virdi 1973
Mean 1.00
Standard Deviation 0.08
Coheficient of Variation 0.08
(a) (b)
Figure 5. Mx-My two-dimensional interaction curve: (a) A4-60 specimen, (b) H specimen
PREDICTION OF BIAXIAL BENDING BEHAVIOR OF STEEL-CONCRETE... 389
4. BENCHMARK FRAMES
In researches of Kanchanalai [41], Surovek-Maleck and White [42, 43], benchmark frames
with supporting conditions and various lateral bracings were used to analyze the stability of
steel columns. Denavit et al. [13] expanded these frames and used with a set of composite
sections of CFT and SRC to analyze the stability of composite columns. One of the main
features of these base frames is the complete coverage of possible modes for composite
beam – columns in terms of supporting conditions, lateral bracings, column bearing loads,
material strength and the size of sections. In this study, these SRC composite sections and
frames have been used to obtain a complete set of interaction curves of biaxial bending
moment – axial force related to composite columns in different situations.
4.1 Sections
SRC composite section are selected to incorporate practical range of concrete strength and
steel ratio. Other specifications of sections such as steel yield stress are considered to be
common values. Steel yield stress for rectangular sections of wide flange W is considered to
be Fy = 344.74MPa (50 ksi). For concrete with a typical strength f'c = 27.6MPa (4 ksi) and
for high strength concrete it is f'c = 68.9MPa (10 ksi).
In composite section there is no upper limit for steel ratio. But practical and dimensional
considerations in which the steel sections are made will impose the upper limit of about 12%
for SRC. Also AISC 360-16 regulation considers at least 1% steel for composite sections.
Also this design code specified minimum of 0.4% for reinforcement and there is no
specification for maximum value. ACI regulation specified maximum of 8% for
reinforcement.
Given these limitations, three wide flange section of W for SRC section, three
reinforcement configuration and three external dimensions of 560 mm in 560 mm (22 in 22
inches), 710 mm in 710 mm (28 in 28 inches), and 865 mm in 865 mm (34 in 34 inches)
have been used. A total of 36 sections (18 sections and two concrete strengths) were selected
for SRCs. Table 4 and 5 show the type and ratio of used steel and the configuration of SRC
sections reinforcement.
Table 4: Selected steel sections
Index Steel Shape ρs
A W360х463 11.66%
B W360х347 8.74%
C W360х179 4.49%
SRC steel shapes
Table 5: Reinforcement configuration
Index Steel Shape ρs
A 20 #36 3.98%
B 12 #32 1.94%
SRC reinforcing configuration
A. Behnam and M. R. Esfahani
390
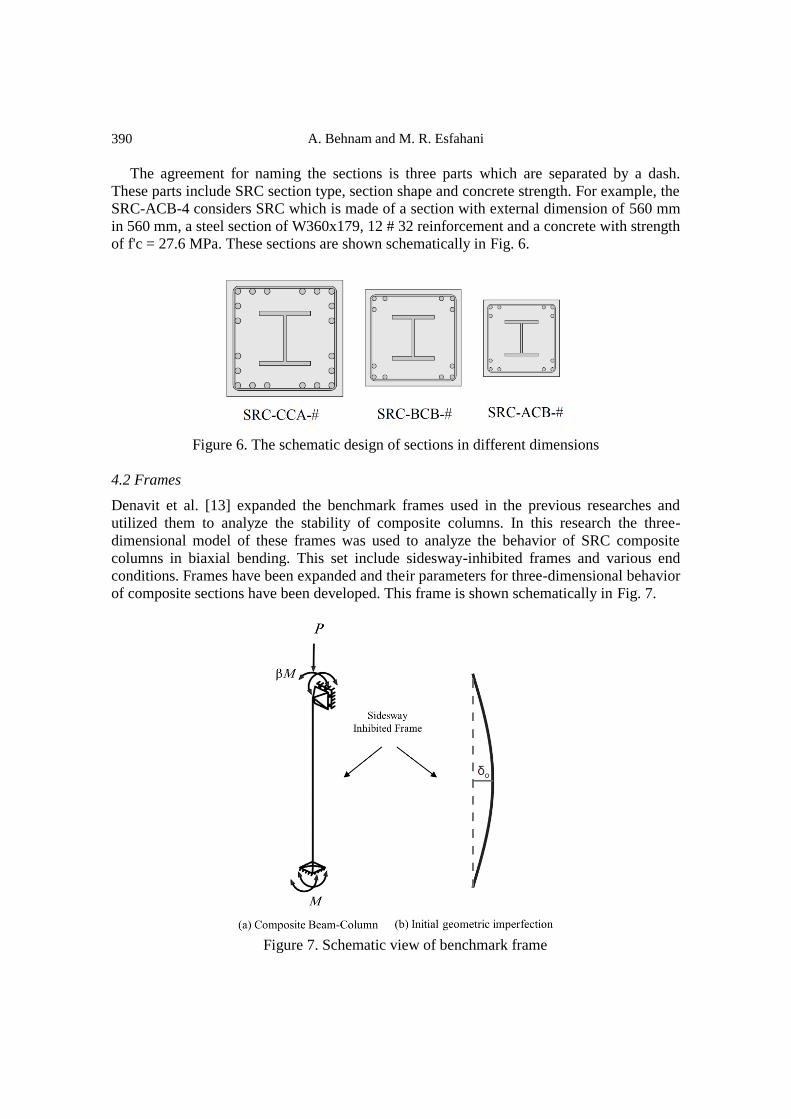
The agreement for naming the sections is three parts which are separated by a dash.
These parts include SRC section type, section shape and concrete strength. For example, the
SRC-ACB-4 considers SRC which is made of a section with external dimension of 560 mm
in 560 mm, a steel section of W360x179, 12 # 32 reinforcement and a concrete with strength
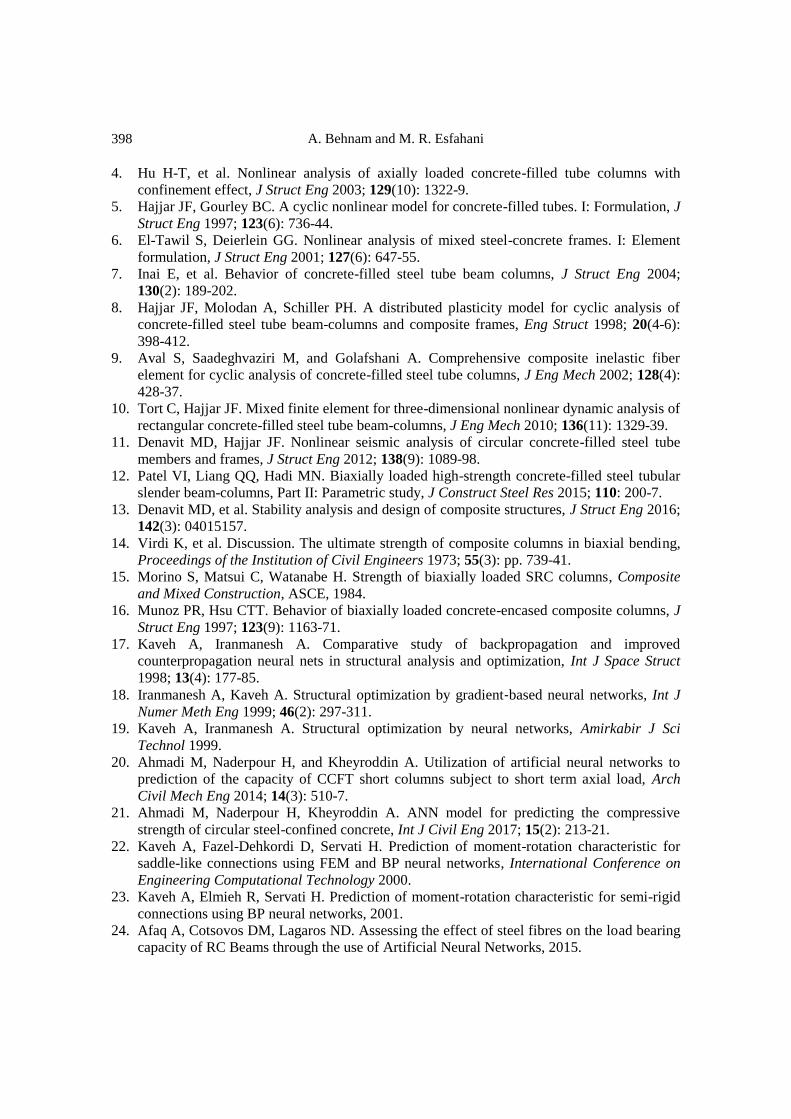
of f'c = 27.6 MPa. These sections are shown schematically in Fig. 6.
Figure 6. The schematic design of sections in different dimensions
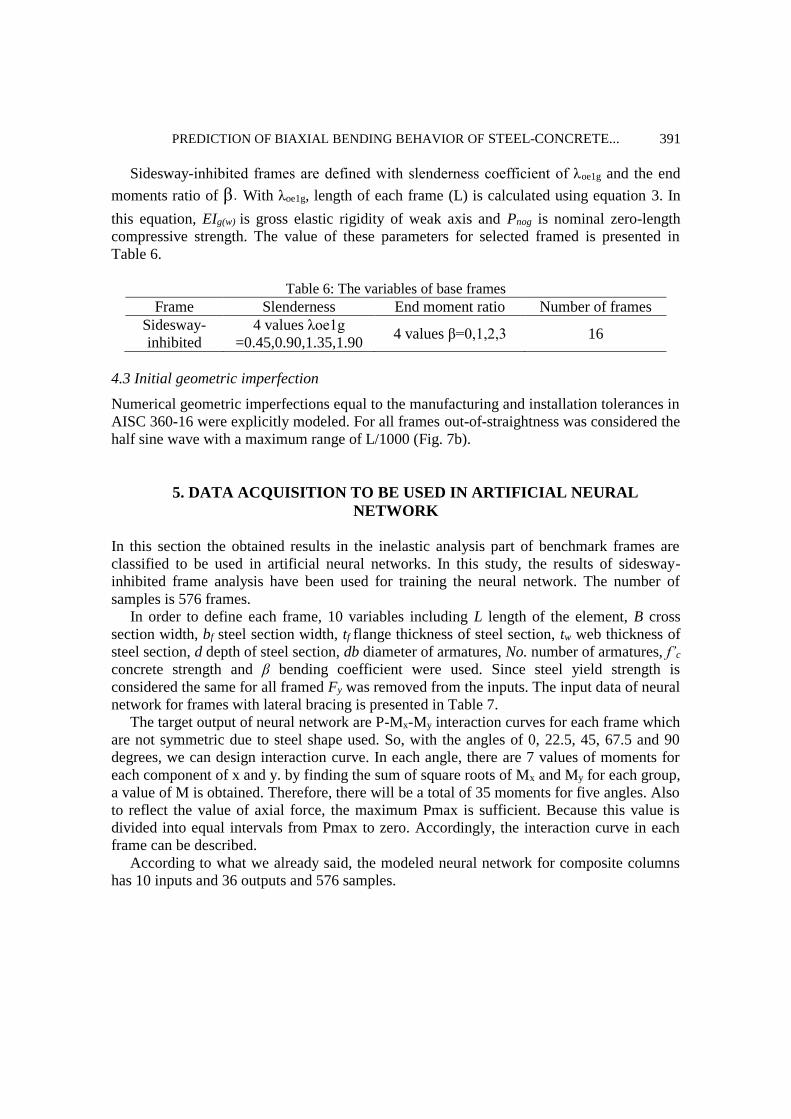
4.2 Frames
Denavit et al. [13] expanded the benchmark frames used in the previous researches and
utilized them to analyze the stability of composite columns. In this research the three-
dimensional model of these frames was used to analyze the behavior of SRC composite
columns in biaxial bending. This set include sidesway-inhibited frames and various end
conditions. Frames have been expanded and their parameters for three-dimensional behavior
of composite sections have been developed. This frame is shown schematically in Fig. 7.
Figure 7. Schematic view of benchmark frame
PREDICTION OF BIAXIAL BENDING BEHAVIOR OF STEEL-CONCRETE... 391
Sidesway-inhibited frames are defined with slenderness coefficient of λoe1g and the end
moments ratio of β. With λoe1g, length of each frame (L) is calculated using equation 3. In
this equation, EIg(w) is gross elastic rigidity of weak axis and Pnog is nominal zero-length
compressive strength. The value of these parameters for selected framed is presented in
Table 6.
Table 6: The variables of base frames
Frame Slenderness End moment ratio Number of frames
Sidesway-
inhibited
4 values λoe1g
=0.45,0.90,1.35,1.90 4 values β=0,1,2,3 16
4.3 Initial geometric imperfection
Numerical geometric imperfections equal to the manufacturing and installation tolerances in
AISC 360-16 were explicitly modeled. For all frames out-of-straightness was considered the
half sine wave with a maximum range of L/1000 (Fig. 7b).
5. DATA ACQUISITION TO BE USED IN ARTIFICIAL NEURAL
NETWORK
In this section the obtained results in the inelastic analysis part of benchmark frames are
classified to be used in artificial neural networks. In this study, the results of sidesway-
inhibited frame analysis have been used for training the neural network. The number of
samples is 576 frames.
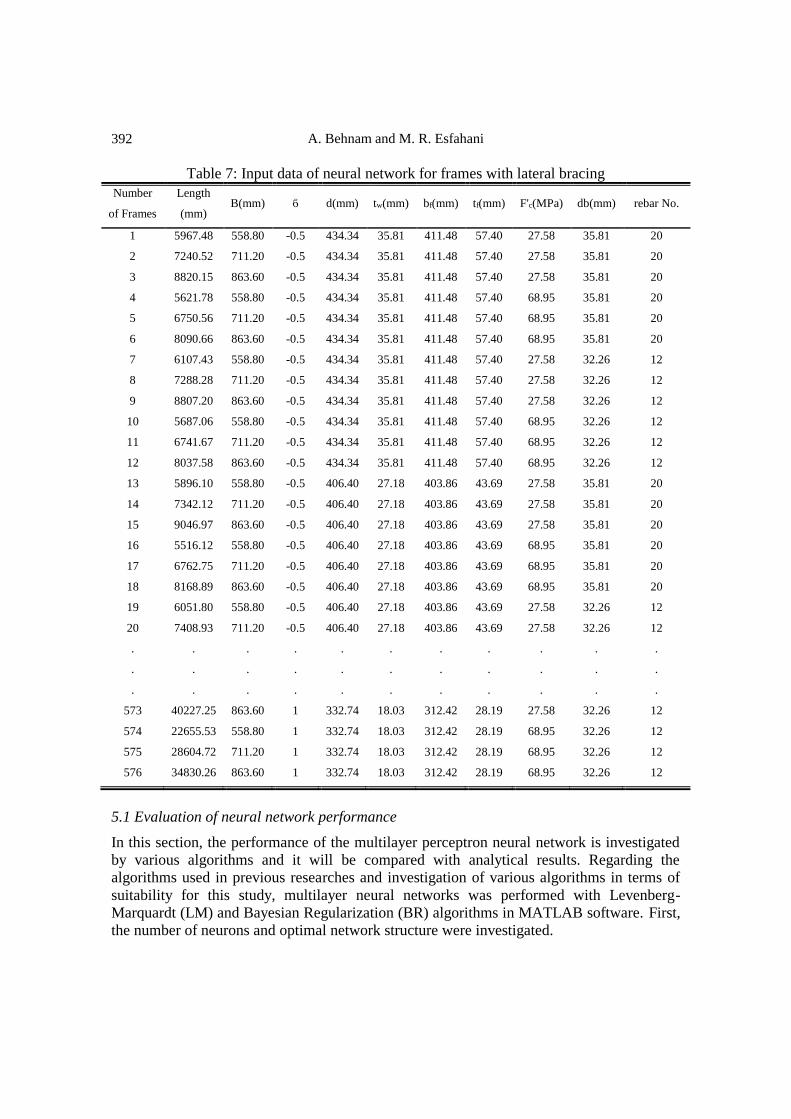
In order to define each frame, 10 variables including L length of the element, B cross
section width, bf steel section width, tf flange thickness of steel section, tw web thickness of
steel section, d depth of steel section, db diameter of armatures, No. number of armatures, f’c
concrete strength and β bending coefficient were used. Since steel yield strength is
considered the same for all framed Fy was removed from the inputs. The input data of neural
network for frames with lateral bracing is presented in Table 7.
The target output of neural network are P-Mx-My interaction curves for each frame which
are not symmetric due to steel shape used. So, with the angles of 0, 22.5, 45, 67.5 and 90
degrees, we can design interaction curve. In each angle, there are 7 values of moments for
each component of x and y. by finding the sum of square roots of Mx and My for each group,
a value of M is obtained. Therefore, there will be a total of 35 moments for five angles. Also
to reflect the value of axial force, the maximum Pmax is sufficient. Because this value is
divided into equal intervals from Pmax to zero. Accordingly, the interaction curve in each
frame can be described.
According to what we already said, the modeled neural network for composite columns
has 10 inputs and 36 outputs and 576 samples.
A. Behnam and M. R. Esfahani
392
Table 7: Input data of neural network for frames with lateral bracing
Number
of Frames
Length
(mm) B(mm) ϐ d(mm) tw(mm) bf(mm) tf(mm) F'c(MPa) db(mm) rebar No.
1 5967.48 558.80 -0.5 434.34 35.81 411.48 57.40 27.58 35.81 20
2 7240.52 711.20 -0.5 434.34 35.81 411.48 57.40 27.58 35.81 20
3 8820.15 863.60 -0.5 434.34 35.81 411.48 57.40 27.58 35.81 20
4 5621.78 558.80 -0.5 434.34 35.81 411.48 57.40 68.95 35.81 20
5 6750.56 711.20 -0.5 434.34 35.81 411.48 57.40 68.95 35.81 20
6 8090.66 863.60 -0.5 434.34 35.81 411.48 57.40 68.95 35.81 20
7 6107.43 558.80 -0.5 434.34 35.81 411.48 57.40 27.58 32.26 12
8 7288.28 711.20 -0.5 434.34 35.81 411.48 57.40 27.58 32.26 12
9 8807.20 863.60 -0.5 434.34 35.81 411.48 57.40 27.58 32.26 12
10 5687.06 558.80 -0.5 434.34 35.81 411.48 57.40 68.95 32.26 12
11 6741.67 711.20 -0.5 434.34 35.81 411.48 57.40 68.95 32.26 12
12 8037.58 863.60 -0.5 434.34 35.81 411.48 57.40 68.95 32.26 12
13 5896.10 558.80 -0.5 406.40 27.18 403.86 43.69 27.58 35.81 20
14 7342.12 711.20 -0.5 406.40 27.18 403.86 43.69 27.58 35.81 20
15 9046.97 863.60 -0.5 406.40 27.18 403.86 43.69 27.58 35.81 20
16 5516.12 558.80 -0.5 406.40 27.18 403.86 43.69 68.95 35.81 20
17 6762.75 711.20 -0.5 406.40 27.18 403.86 43.69 68.95 35.81 20
18 8168.89 863.60 -0.5 406.40 27.18 403.86 43.69 68.95 35.81 20
19 6051.80 558.80 -0.5 406.40 27.18 403.86 43.69 27.58 32.26 12
20 7408.93 711.20 -0.5 406.40 27.18 403.86 43.69 27.58 32.26 12
. . . . . . . . . . .
. . . . . . . . . . .
. . . . . . . . . . .
573 40227.25 863.60 1 332.74 18.03 312.42 28.19 27.58 32.26 12
574 22655.53 558.80 1 332.74 18.03 312.42 28.19 68.95 32.26 12
575 28604.72 711.20 1 332.74 18.03 312.42 28.19 68.95 32.26 12
576 34830.26 863.60 1 332.74 18.03 312.42 28.19 68.95 32.26 12
5.1 Evaluation of neural network performance
In this section, the performance of the multilayer perceptron neural network is investigated
by various algorithms and it will be compared with analytical results. Regarding the
algorithms used in previous researches and investigation of various algorithms in terms of
suitability for this study, multilayer neural networks was performed with Levenberg-
Marquardt (LM) and Bayesian Regularization (BR) algorithms in MATLAB software. First,
the number of neurons and optimal network structure were investigated.
PREDICTION OF BIAXIAL BENDING BEHAVIOR OF STEEL-CONCRETE... 393
5.2 Selecting the number of hidden layer neurons
Selection of neurons has a very important impact on neural network performance. In the
case of uncontrolled increase of neurons, overfitting occurs. That is, the modeled neural
network offers accurate results with specific samples but by using this model in samples
other than the samples used in network, we face very inaccurate results. Various methods
have been proposed in order to determine the number of neurons to prevent overfitting.
Some of these methods only depend on the number of inputs, and some depend on the
number of inputs and outputs at the same time.
According to Kolmogorov theory the number of hidden layer neurons K must be equal to
square root of multiplication of inputs and outputs.
(3) 𝐾 = √𝑀.𝑁
By using this formula, the number of neurons will be 19. Normally, the number of
neurons is between the number of inputs and the number of outputs, and also their number is
never twice more than the number of inputs. The following experimental formula is
presented to find the right value.
(4) 𝐾 = (𝑀 + 𝑁)2/3
By using this formula, the number of neurons must be 13. Also based on researches of
Hush and Horne (1993) the maximum number of hidden layer neurons must be based on the
following formula:
(5) 𝐾 ≤ 2𝑀 + 1
Therefore, the number of neurons must not exceed 21.
In this study, the number of training data is 403 (70% randomly selected from 576) for
braced frames. Based on the previous values and examination of different values for the
number of neurons, the number 14 had the best results.
5.3 The output results of neural network
In this section the performance of modeled neural network for the frames is investigated
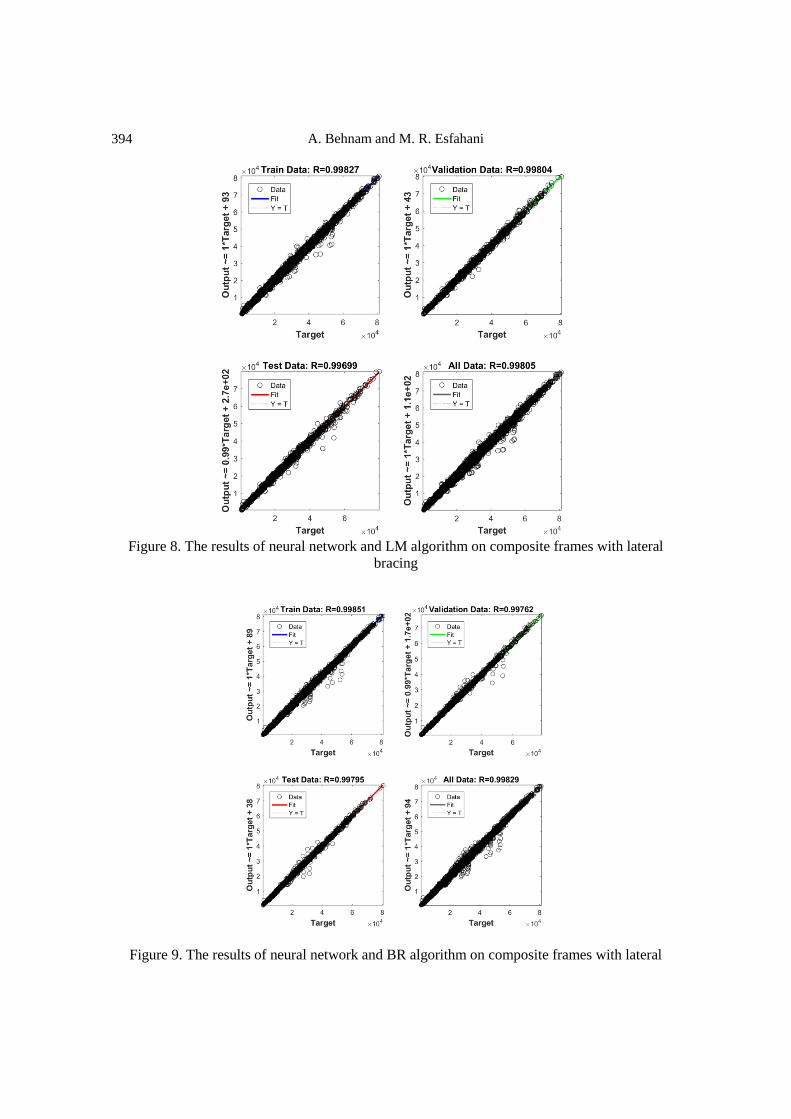
using LM and BR algorithms. Fig. 8 shows the performance of trained neural network using
LM algorithm for the sidesway-inhibited frames. This figure has 4 diagrams including the
performance of training parts, validation, testing, and total data. The linear correlation
coefficient for these parts is in the range of 0.996 and 0.998. This correlation represents a
very good performance of this model for determining the behavior of composite columns.
Fig. 9 presents the performance of artificial neural network with BR algorithm for
sidesway-inhibited frames. Range of variation in correlation factor R is 0.997 for test and
validation data and 0.998 for train data which illustrate better performance of this algorithm
rather than LM algorithm.
A. Behnam and M. R. Esfahani
394
Figure 8. The results of neural network and LM algorithm on composite frames with lateral
bracing
Figure 9. The results of neural network and BR algorithm on composite frames with lateral
PREDICTION OF BIAXIAL BENDING BEHAVIOR OF STEEL-CONCRETE... 395
bracing
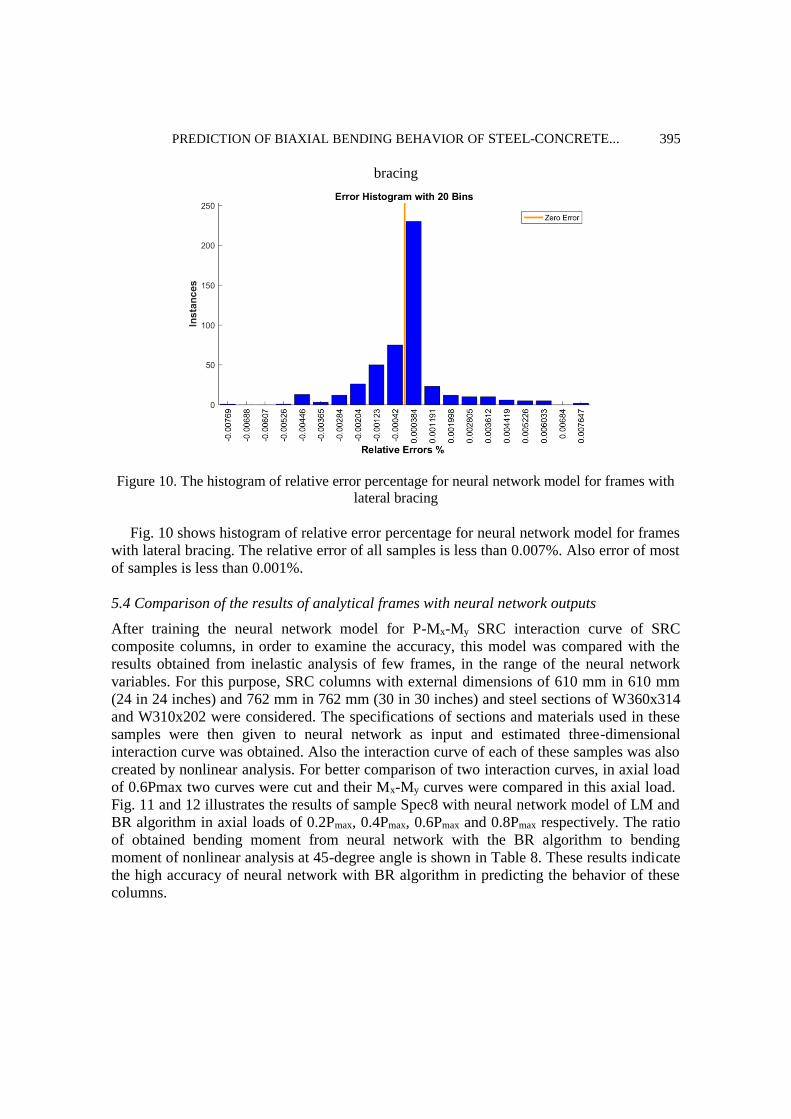
Figure 10. The histogram of relative error percentage for neural network model for frames with
lateral bracing
Fig. 10 shows histogram of relative error percentage for neural network model for frames
with lateral bracing. The relative error of all samples is less than 0.007%. Also error of most
of samples is less than 0.001%.
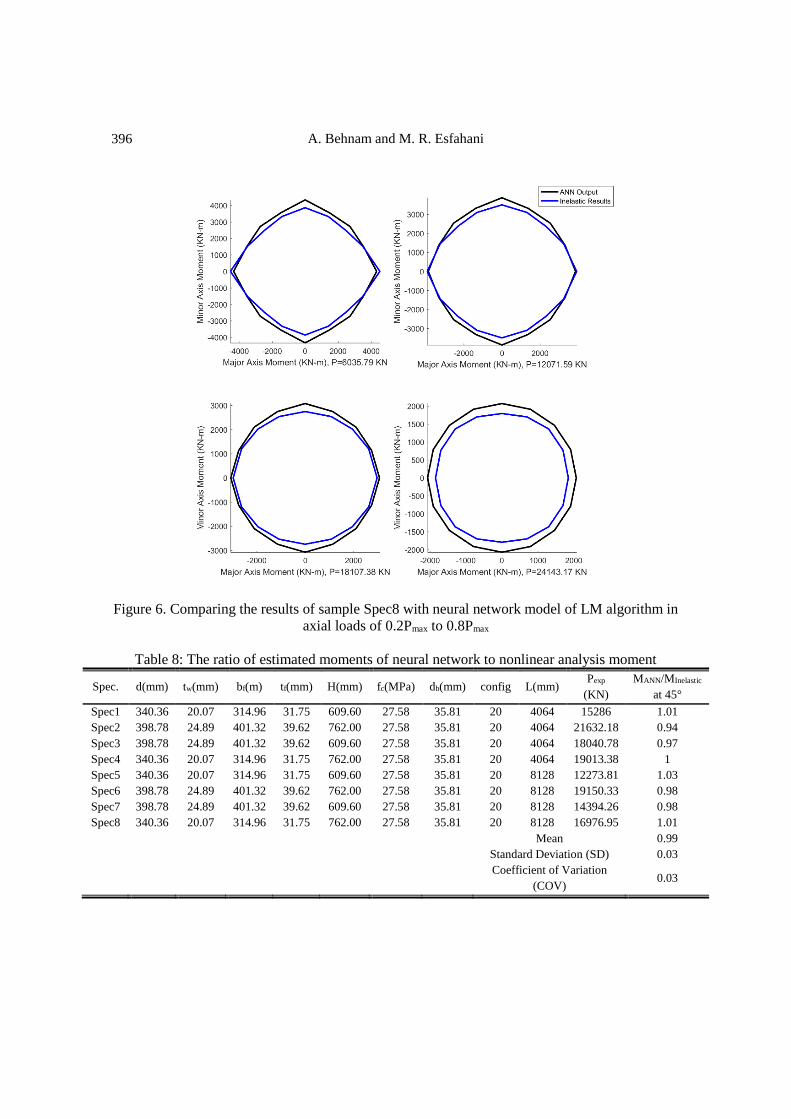
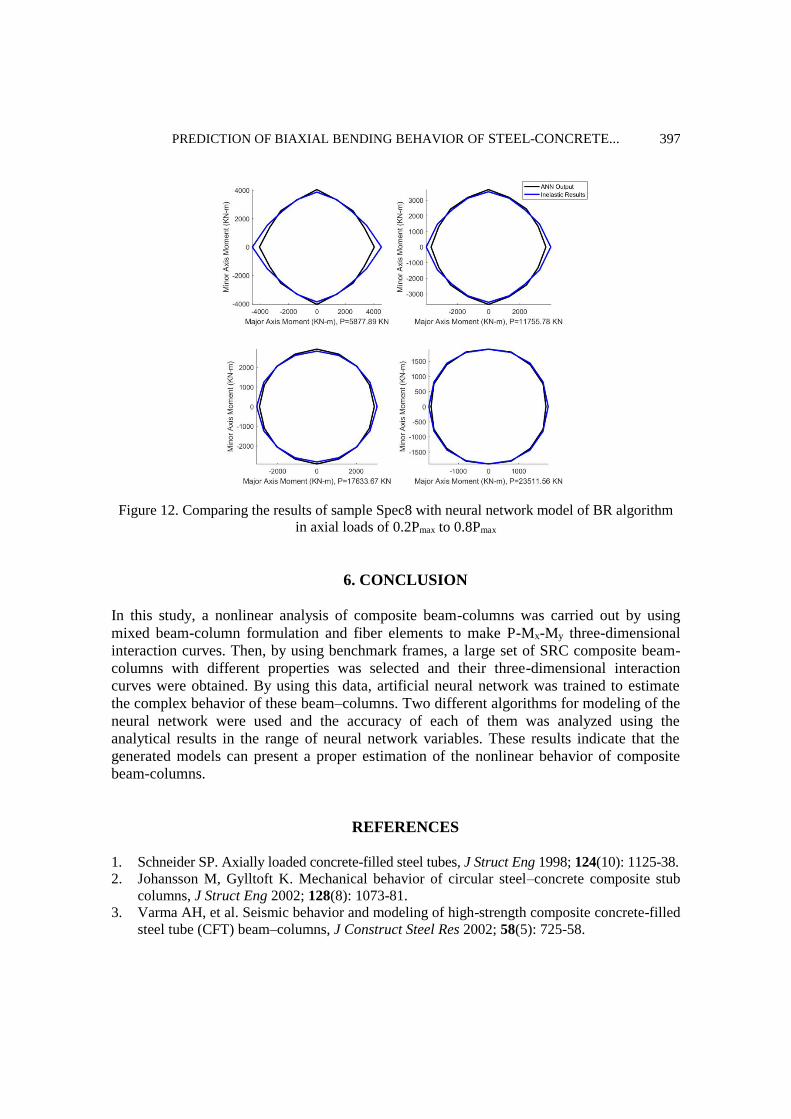
5.4 Comparison of the results of analytical frames with neural network outputs
After training the neural network model for P-Mx-My SRC interaction curve of SRC
composite columns, in order to examine the accuracy, this model was compared with the
results obtained from inelastic analysis of few frames, in the range of the neural network
variables. For this purpose, SRC columns with external dimensions of 610 mm in 610 mm
(24 in 24 inches) and 762 mm in 762 mm (30 in 30 inches) and steel sections of W360x314
and W310x202 were considered. The specifications of sections and materials used in these
samples were then given to neural network as input and estimated three-dimensional
interaction curve was obtained. Also the interaction curve of each of these samples was also
created by nonlinear analysis. For better comparison of two interaction curves, in axial load
of 0.6Pmax two curves were cut and their Mx-My curves were compared in this axial load. Fig. 11 and 12 illustrates the results of sample Spec8 with neural network model of LM and
BR algorithm in axial loads of 0.2Pmax, 0.4Pmax, 0.6Pmax and 0.8Pmax respectively. The ratio
of obtained bending moment from neural network with the BR algorithm to bending
moment of nonlinear analysis at 45-degree angle is shown in Table 8. These results indicate
the high accuracy of neural network with BR algorithm in predicting the behavior of these
columns.
A. Behnam and M. R. Esfahani
396
Figure 6. Comparing the results of sample Spec8 with neural network model of LM algorithm in
axial loads of 0.2Pmax to 0.8Pmax
Table 8: The ratio of estimated moments of neural network to nonlinear analysis moment
Spec. d(mm) tw(mm) bf(m) tf(mm) H(mm) fc(MPa) db(mm) config L(mm) Pexp
(KN)
MANN/MInelastic
at 45°
Spec1 340.36 20.07 314.96 31.75 609.60 27.58 35.81 20 4064 15286 1.01
Spec2 398.78 24.89 401.32 39.62 762.00 27.58 35.81 20 4064 21632.18 0.94
Spec3 398.78 24.89 401.32 39.62 609.60 27.58 35.81 20 4064 18040.78 0.97
Spec4 340.36 20.07 314.96 31.75 762.00 27.58 35.81 20 4064 19013.38 1
Spec5 340.36 20.07 314.96 31.75 609.60 27.58 35.81 20 8128 12273.81 1.03
Spec6 398.78 24.89 401.32 39.62 762.00 27.58 35.81 20 8128 19150.33 0.98
Spec7 398.78 24.89 401.32 39.62 609.60 27.58 35.81 20 8128 14394.26 0.98
Spec8 340.36 20.07 314.96 31.75 762.00 27.58 35.81 20 8128 16976.95 1.01
Mean 0.99
Standard Deviation (SD) 0.03
Coefficient of Variation
(COV) 0.03
PREDICTION OF BIAXIAL BENDING BEHAVIOR OF STEEL-CONCRETE... 397
Figure 12. Comparing the results of sample Spec8 with neural network model of BR algorithm
in axial loads of 0.2Pmax to 0.8Pmax
6. CONCLUSION
In this study, a nonlinear analysis of composite beam-columns was carried out by using
mixed beam-column formulation and fiber elements to make P-Mx-My three-dimensional
interaction curves. Then, by using benchmark frames, a large set of SRC composite beam-
columns with different properties was selected and their three-dimensional interaction
curves were obtained. By using this data, artificial neural network was trained to estimate
the complex behavior of these beam–columns. Two different algorithms for modeling of the
neural network were used and the accuracy of each of them was analyzed using the
analytical results in the range of neural network variables. These results indicate that the
generated models can present a proper estimation of the nonlinear behavior of composite
beam-columns.
REFERENCES
1. Schneider SP. Axially loaded concrete-filled steel tubes, J Struct Eng 1998; 124(10): 1125-38.
2. Johansson M, Gylltoft K. Mechanical behavior of circular steel–concrete composite stub
columns, J Struct Eng 2002; 128(8): 1073-81.
3. Varma AH, et al. Seismic behavior and modeling of high-strength composite concrete-filled
steel tube (CFT) beam–columns, J Construct Steel Res 2002; 58(5): 725-58.
A. Behnam and M. R. Esfahani
398
4. Hu H-T, et al. Nonlinear analysis of axially loaded concrete-filled tube columns with
confinement effect, J Struct Eng 2003; 129(10): 1322-9.
5. Hajjar JF, Gourley BC. A cyclic nonlinear model for concrete-filled tubes. I: Formulation, J
Struct Eng 1997; 123(6): 736-44.
6. El-Tawil S, Deierlein GG. Nonlinear analysis of mixed steel-concrete frames. I: Element
formulation, J Struct Eng 2001; 127(6): 647-55.
7. Inai E, et al. Behavior of concrete-filled steel tube beam columns, J Struct Eng 2004;
130(2): 189-202.
8. Hajjar JF, Molodan A, Schiller PH. A distributed plasticity model for cyclic analysis of
concrete-filled steel tube beam-columns and composite frames, Eng Struct 1998; 20(4-6):
398-412.
9. Aval S, Saadeghvaziri M, and Golafshani A. Comprehensive composite inelastic fiber
element for cyclic analysis of concrete-filled steel tube columns, J Eng Mech 2002; 128(4):
428-37.
10. Tort C, Hajjar JF. Mixed finite element for three-dimensional nonlinear dynamic analysis of
rectangular concrete-filled steel tube beam-columns, J Eng Mech 2010; 136(11): 1329-39.
11. Denavit MD, Hajjar JF. Nonlinear seismic analysis of circular concrete-filled steel tube
members and frames, J Struct Eng 2012; 138(9): 1089-98.
12. Patel VI, Liang QQ, Hadi MN. Biaxially loaded high-strength concrete-filled steel tubular
slender beam-columns, Part II: Parametric study, J Construct Steel Res 2015; 110: 200-7.
13. Denavit MD, et al. Stability analysis and design of composite structures, J Struct Eng 2016;
142(3): 04015157.
14. Virdi K, et al. Discussion. The ultimate strength of composite columns in biaxial bending,
Proceedings of the Institution of Civil Engineers 1973; 55(3): pp. 739-41.
15. Morino S, Matsui C, Watanabe H. Strength of biaxially loaded SRC columns, Composite
and Mixed Construction, ASCE, 1984.
16. Munoz PR, Hsu CTT. Behavior of biaxially loaded concrete-encased composite columns, J
Struct Eng 1997; 123(9): 1163-71.
17. Kaveh A, Iranmanesh A. Comparative study of backpropagation and improved
counterpropagation neural nets in structural analysis and optimization, Int J Space Struct
1998; 13(4): 177-85.
18. Iranmanesh A, Kaveh A. Structural optimization by gradient‐based neural networks, Int J
Numer Meth Eng 1999; 46(2): 297-311.
19. Kaveh A, Iranmanesh A. Structural optimization by neural networks, Amirkabir J Sci
Technol 1999.
20. Ahmadi M, Naderpour H, and Kheyroddin A. Utilization of artificial neural networks to
prediction of the capacity of CCFT short columns subject to short term axial load, Arch
Civil Mech Eng 2014; 14(3): 510-7.
21. Ahmadi M, Naderpour H, Kheyroddin A. ANN model for predicting the compressive
strength of circular steel-confined concrete, Int J Civil Eng 2017; 15(2): 213-21.
22. Kaveh A, Fazel-Dehkordi D, Servati H. Prediction of moment-rotation characteristic for
saddle-like connections using FEM and BP neural networks, International Conference on
Engineering Computational Technology 2000.
23. Kaveh A, Elmieh R, Servati H. Prediction of moment-rotation characteristic for semi-rigid
connections using BP neural networks, 2001.
24. Afaq A, Cotsovos DM, Lagaros ND. Assessing the effect of steel fibres on the load bearing
capacity of RC Beams through the use of Artificial Neural Networks, 2015.
PREDICTION OF BIAXIAL BENDING BEHAVIOR OF STEEL-CONCRETE... 399
25. Kaveh A, Servati H. Design of double layer grids using backpropagation neural networks,
Comput Struct 2001; 79(17): 1561-8.
26. Kaveh A, Servati H. Neural networks for the approximate analysis and design of double
layer grids, Int J Space Struct 2002; 17(1): 77-89.
27. Kaveh A, Raiessi Dehkordi M. Application of artificial neural networks in predicting the
deformation of domes under wind load, Int J IUST 2007; 18(2007): 45-53.
28. Kumar M, Yadav N. Buckling analysis of a beam–column using multilayer perceptron
neural network technique, J Franklin Institute 2013; 350(10): 3188-204.
29. Rofooei F, Kaveh A, Farahani F. Estimating the vulnerability of the concrete moment
resisting frame structures using artificial neural networks, Int J Optim Civil Eng 2011; 1(3):
433-48.
30. Kotsovou GM, Cotsovos DM, Lagaros ND. Assessment of RC exterior beam-column joints
based on artificial neural networks and other methods, Eng Struct 2017; 144: 1-18.
31. Sadowski L, Hoła J. Neural prediction of the pull-off adhesion of the concrete layers in
floors on the basis of nondestructive tests, Procedia Eng 2013; 57: 986-95.
32. Denavit MD, Hajjar JF, Characterization of behavior of steel-concrete composite members
and frames with applications for design, University of Illinois at Urbana-Champaign, 2014.
33. ANSI B. AISC 360-16-specification for structural steel buildings, Chicago AISC, 2016.
34. ACI, Building Code Requirements for Structural Concrete and Commentary (ACI 318-14).
1 ed, American Concrete Institute, 2015.
35. Chang G, Mander JB. Seismic energy based fatigue damage analysis of bridge columns:
part 1-evaluation of seismic capacity, 1994.
36. Popovics S. A numerical approach to the complete stress-strain curve of concrete, Cement
Concrete Res 1973; 3(5): 583-99.
37. Mander JB, Priestley MJ, Park R. Theoretical stress-strain model for confined concrete, J
Struct Eng 1988; 114(8): 1804-26.
38. Alemdar BN, White DW. Displacement, flexibility, and mixed beam–column finite element
formulations for distributed plasticity analysis, J Struct Eng 2005; 131(12): 1811-9.
39. De Souza RM, Force-based finite element for large displacement inelastic analysis of
frames, University of California, Berkeley California, 2000.
40. Nukala PKV, White DW. A mixed finite element for three-dimensional nonlinear analysis
of steel frames, Comput Meth Appl Mech Eng 2004; 193(23): 2507-45.
41. Kanchanalai T. The design and behavior of beam-columns in unbraced steel frames, AISI
Project No. 189, Report, 1977.
42. Surovek-Maleck AE, White DW. Alternative approaches for elastic analysis and design of
steel frames. I: Overview, J Struct Eng 2004; 130(8): 1186-96.
43. Surovek-Maleck AE, White DW. Alternative approaches for elastic analysis and design
of steel frames. II: Verification studies, J Struct Eng 2004; 130(8): 1197-205.


![Experimental behaviour and strength of concrete-encased … · 2019-03-27 · bending and axial compressive load [3–6], and behaviour under biaxial bending and axial compressive](https://img.pdfslide.net/doc/110x75/5e54a910ee6ea919d33e4e9a/experimental-behaviour-and-strength-of-concrete-encased-2019-03-27-bending-and.jpg)