Embed Size (px)
Citation preview
Prediction of Chinese Coal Ash Fusion Temperatures in Ar and H2
Atmospheres
Wen J. Song,† Li H. Tang,† Xue D. Zhu,† Yong Q. Wu,† Zi B. Zhu,*,† andShuntarou Koyama‡
Engineering Research Center of Large Scale Reactor Engineering and Technology, East China UniVersityof Science and Technology, Shanghai 200237, People’s Republic of China, and Electric Powder
DeVelopment Corporation Limited, Tokyo 167-0023, Japan
ReceiVed NoVember 11, 2008. ReVised Manuscript ReceiVed January 21, 2009
The ash fusion temperatures (AFTs) of 21 typical Chinese coal ash samples and 60 synthetic ash sampleswere measured in Ar and H2 atmospheres. The computer software package FactSage was used to calculate thetemperatures corresponding to different proportions of the liquid phase and predict the phase equilibria ofsynthetic ash samples. Empirical liquidus models were derived to correlate the AFTs under both Ar and H2
atmospheres of 60 synthetic ash samples, with their liquidus temperatures calculated by FactSage. These modelswere used to predict the AFTs of 21 Chinese coal ash samples in Ar and H2 atmospheres, and then the AFTdifferences between the atmospheres were analyzed. The results show that, for both atmospheres, there was anapparently linear correlation and good agreement between the AFTs of synthetic ash samples and the liquidustemperatures calculated by FactSage (R > 0.89, and σ < 30 °C). These models predict the AFTs of coal ashsamples with a high level of accuracy (SE < 30 °C). Because the iron oxides in coal ash samples fused undera H2 atmosphere are reduced to metallic iron and lead to changes of mineral species and micromorphology,the AFTs in a H2 atmosphere are always higher than those with an Ar atmosphere.
Introduction
The ash fusion temperature (AFT) is the most traditionalparameter used to access the fusibility of coal ash in acombustion system and predict the flow properties of ash inpractical gasification systems.1,2 For example, the initial defor-mation temperature, which is the temperature at which therounding of the tip of an ash cone is noted, can give anindication to designers and operators of pulverized-fired (pf)furnaces that the coal ash has been melting and therefore hasbecome sticky.3 Meanwhile, for all types of slagging entrained-flow gasifiers, the operating temperature should be above theAFT to enable continuous slag tapping.4 It is therefore importantto be able to accurately predict the AFTs of coal ash.
For the entrained-flow gasifier, the raw syngas consists mainlyof strongly reducing gases (CO and H2). Particularly, in dry-coal feed entrained gasifiers (Kopper-Totzek, Shell, CCP, Engle,and Plenflo gasifiers), the content of the strongly reducing gasin raw syngas can be over 90%.5 A number of researchers havestudied the fusibility of coal ash in oxidizing, inert, and mildlyreducing atmospheres.6,7 For example, Vassilev et al.8 discussedthe influence of mineral and chemical composition of coal ash
on their fusibility in an oxidizing atmosphere (air), and Wall etal.9 applied thermomechanical analysis to describe the fusibilityof blended coal ash in an inert atmosphere (100% Ar). Huffmanet al.10 investigated the high-temperature behavior of coal ashin oxidizing and mildly reducing atmospheres (60% CO/40%CO2). However, to our knowledge, little research has beenreported on the fusibility of coal ash in strongly reducingatmospheres. Thus, it is necessary to study the fusibility instrongly reducing atmospheres and the difference of fusibilitybetween different atmospheres and to predict accurately theAFTs of coal ashes in different atmospheres.
Many researchers have used different methods to test andpredict the AFTs of coal ash.11-13 Some investigations haveattempted to relate the AFT to the coal ash composition, andfairly detailed relations, both statistical and empirical, have beenestablished.14,15 For example, Gray et al.16 carried out multipleand stepwise regression analysis to relate the AFT to the coal
* To whom correspondence should be addressed. Telephone: +86-21-64252309. Fax: +86-21-64253626. E-mail: [email protected].
† East China University of Science and Technology.‡ Electric Powder Development Corporation Ltd.(1) Wall, T. F.; Creelman, R. A.; Gupta, R. P.; Gupta, S. K.; Coin, C.;
Lowe, A. Prog. Energy Combust. Sci. 1998, 24, 345–353.(2) Bryers, R. W. Prog. Energy Combust. Sci. 1996, 22, 29–120.(3) Gupta, S. K.; Wall, T. F.; Creelman, R. A.; Gupta, R. P. Fuel Process.
Technol. 1998, 56, 33–43.(4) Hurst, H. J.; Novak, F.; Patterson, J. H. Fuel 1999, 78, 1831–1840.(5) Higman, C.; Burgt, M. V. Gasification; Elsevier: Burlington, MA,
2003; pp 109-127.(6) Gupta, S. K.; Gupta, R. P.; Bryant, G. W.; Wall, T. F. Fuel 1998,
77, 1195–1201.
(7) Bryant, G. W.; Browning, G. J.; Gupta, S. K.; Lucas, J. A.; Gupta,R. P.; Wall, T. F. Energy Fuels 2000, 14, 326–335.
(8) Vassilev, S. V.; Kitano, K.; Takeda, S.; Tsurue, T. Fuel Process.Technol. 1995, 45, 27–51.
(9) Bryant, G. W.; Browning, G. J.; Emanuel, H.; Gupta, S. K.; Gupta,R. P.; Lucas, J. A.; Wall, T. F. Energy Fuels 2000, 14, 316–325.
(10) Huffman, G. P.; Huggins, F. E.; Dunmyre, G. R. Fuel 1981, 60,585–597.
(11) Kahraman, H.; Bos, F.; Reifenstein, A.; Coin, C. D. A. Fuel 1998,77, 1005–1011.
(12) Kahraman, H.; Reifenstein, A. P.; Coin, C. D. A. Fuel 1999, 78,1463–1471.
(13) Yin, C. G.; Luo, Z. Y.; Ni, M. J.; Cen, K. F. Fuel 1998, 77, 1777–1782.
(14) Winegartner, B. C.; Rhodes, B. T. J. Eng. Power 1975, 97, 395–401.
(15) Lloyd, W. G.; Riley, J. T.; Zhon, S.; Risen, M. A.; Tibbitts, R. L.Energy Fuels 1993, 7, 490–494.
(16) Gray, V. R. Fuel 1987, 66, 1230–1239.
Energy & Fuels 2009, 23, 1990–19971990
10.1021/ef800974d CCC: $40.75 2009 American Chemical SocietyPublished on Web 03/03/2009
ash composition. Kucukabyrak et al.17 established the relation-ship between chemical composition and AFTs for some Turkishlignites. However, although these approaches can give goodresults if applied to some coal ash samples with similar chemicalcomposition, it is less effective when applied to samples fromdifferent sources and with a wide range of composition.18
Some researchers have applied thermodynamic considerationsto AFT predications. Huggins et al.19 correlated the liquidussurfaces of the SiO2-Al2O3-XO (where X ) Fe, Ca, and K2)ternary systems with trends obtained for the AFT of coal ash.Hurst et al.20 and Wall et al.21 used SiO2-Al2O3-CaO andCaO-MgO-FeOn ternary equilibrium diagrams to predict theeffect of CaO and Fe2O3 on the AFT of coal ash. However,these methods could only be applied to a limited range ofconditions and were only able to qualitatively predict the AFTsof coal ashes.
Predictions of AFTs have recently been undertaken with theaid of computer thermodynamic modeling of phase equilibria.22,23
Goni et al.24 evaluated slagging by the determination of AFTcurves using MTDATA software and the NPLOX3 databasefor the main coal ash oxides. Jak et al.25 applied the thermo-dynamic computer package FactSage to predict AFTs and foundthat they do correlate with the liquidus temperatures. Theseapproaches are based on phase equilibrium science rather thansimple relationships with bulk composition.
Analysis of coal ashes on a weight percent basis shows thatthey consist mainly of SiO2, Al2O3, Fe2O3, CaO, and MgO, sothat the properties of coal ashes at high temperature might be
modeled by a five system SiO2-Al2O3-Fe2O3-CaO-MgOsynthetic ash. For example, both Hurst et al.26 and Vorres etal.27 used synthetic ashes to study the flow properties of coalashes at high temperature. However, to our knowledge, littlework has been published regarding the use of synthetic ashesto study the fusibility of coal ashes. Meanwhile, because thecomposition of synthetic ash samples can be easily controlled,the experimental conditions can be simplified and can excludeany interference by trace elements. Thus, we have measuredthe AFTs of 60 synthetic ash samples formed by mixtures ofthese five oxides (SiO2, Al2O3, CaO, Fe2O3, and MgO) and 21Chinese coal ash samples, in both an inert atmosphere (100%Ar) and a strongly reducing atmosphere (100% H2). Thecomputer software package FactSage was used to calculate thetemperatures corresponding to different proportions of the liquidphase and predict the phase equilibria of synthetic ash samples.
(17) Kucukbayrak, S.; Ersoy, M. A.; Haykiri, A. H.; Guner, H.; Urkan,K. Fuel Sci. Technol. Int. 1993, 11, 1231–1249.
(18) Seggiani, M. Fuel 1999, 78, 1121–1125.(19) Huggins, F. E.; Kosmack, D. A.; Huffman, G. P. Fuel 1981, 60,
577–584.(20) Hurst, H. J.; Novak, F.; Patterson, J. H. Energy Fuels 1996, 10,
1215–1219.(21) Bryant, G.; Bailey, C.; Wu, H. W.; McLennan, A.; Stanmore, B.;
Wall, T. In The Impact of Mineral Impurities in Solid Fuel Combustion;Gupta, R. P., Wall, T. F., Baxter, L., Eds.; Kluwer Academic/Plenum Press:New York, 1999; pp 581-594.
(22) Li, H. X.; Ninomiya, Y.; Dong, Z. B.; Zhang, M. X. Chin. J. Chem.Eng. 2006, 14, 784–789.
(23) Dyk, J. C. V.; Melzer, S.; Sobiecki, A. Miner. Eng. 2006, 19, 1126–1135.
(24) Goni, Ch.; Helle, S.; Garcia, X.; Gordon, A.; Parra, R.; Kelm, U.;Jimenez, R.; Alfaro, G. Fuel 2003, 82, 2087–2095.
(25) Jak, E. Fuel 2002, 81, 1655–1668.
(26) Hurst, H. J.; Novak, F.; Patterson, J. H. Fuel 1999, 78, 439–444.(27) Vorres, K. S.; Greenberg, S.; Poeppel, R. In Mineral Matter and
Ash in Coal; Vorres, K. S., Eds.; American Chemical Society: Washington,D.C., 1986; pp 109-116.
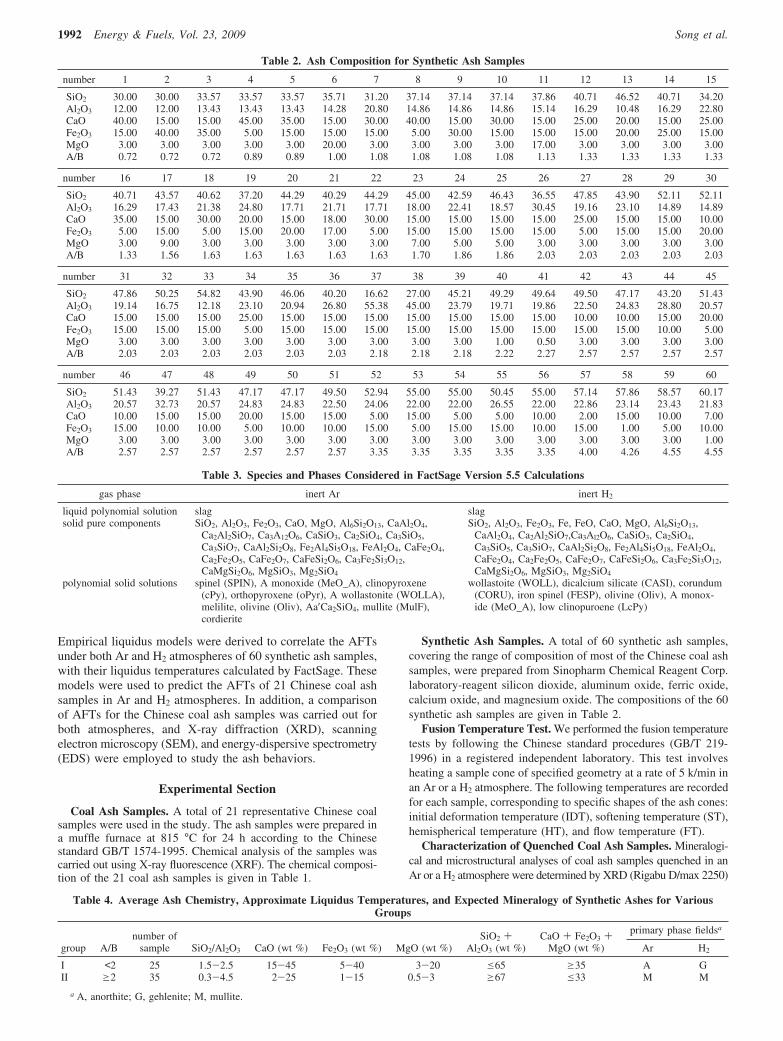
Table 1. Ash Composition for Coal Ash Samples
composition (wt %)
number ash samples SiO2 Al2O3 CaO Fe2O3 MgO A/Ba
1 Shanxi Tongchuan 29.34 14.35 34.53 16.73 5.03 0.782 Yunnan Xiaolongtan 30.28 18.61 34.13 13.21 3.77 0.963 Shandong Zaozhuang 34.92 16.50 37.76 8.77 2.04 1.064 Ningxia Lingwu 20.54 31.32 28.19 16.54 3.41 1.085 Shanxi Gujiao 25.21 28.13 18.65 27.21 0.79 1.146 Shanxi Gaoyang 28.81 26.78 19.13 23.57 1.71 1.257 Shandong Yanzhou 22.97 34.76 17.77 22.77 1.73 1.368 Neimenggu 22.90 36.61 27.58 10.17 2.75 1.469 Neimenggu Houbulian 33.80 29.08 16.27 17.04 3.81 1.6910 Shanxi Xishan 35.11 32.01 12.09 17.23 3.56 2.0411 Shanxi Changyan 36.29 33.84 7.51 14.66 7.70 2.3412 Shanxi Shenmu 45.95 28.02 14.77 7.61 3.66 2.8413 Liaoning Shenyang 50.12 23.87 9.48 10.23 6.30 2.8414 Anhui Huaibei 45.21 30.36 18.80 3.76 1.87 3.0915 Shanxi Shenfu 47.54 31.55 15.72 7.00 1.61 3.2516 Shanxi Xiaoyi 50.34 26.38 8.55 11.45 3.28 3.3017 Shandong Huangxian 54.12 24.17 10.64 6.21 4.85 3.6018 Gansu Huating 48.77 29.79 6.59 11.47 3.37 3.6719 Shanxi Yangquan 59.47 21.76 6.71 7.08 6.98 3.8120 NeimengguDongsheng 56.67 24.01 7.98 8.52 2.83 4.1721 Shanxi Jincheng 42.44 38.83 7.92 7.84 2.97 4.34
a A/B ) (SiO2 + Al2O3)/(CaO + Fe2O3 + MgO).
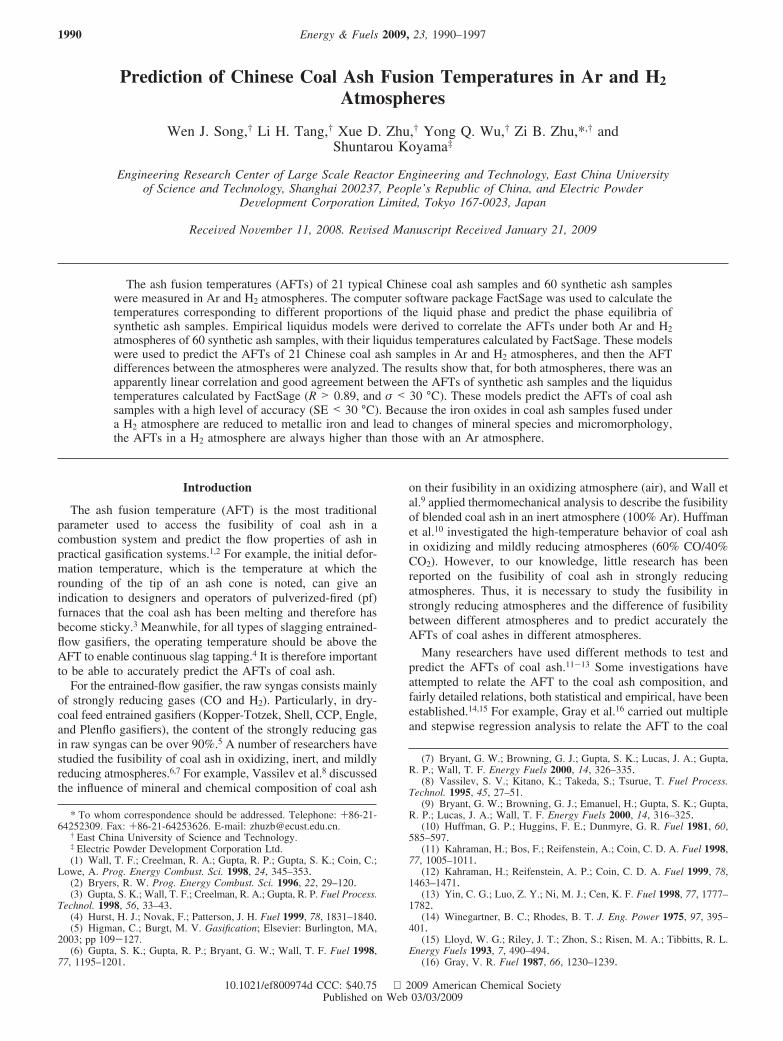
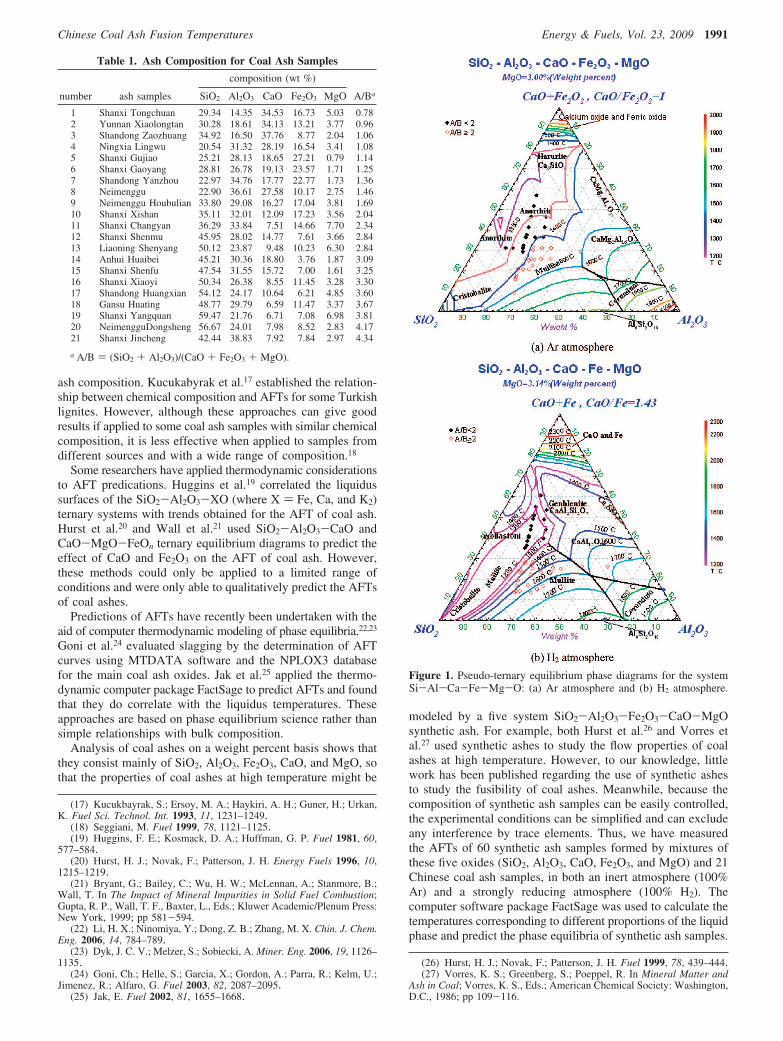
Figure 1. Pseudo-ternary equilibrium phase diagrams for the systemSi-Al-Ca-Fe-Mg-O: (a) Ar atmosphere and (b) H2 atmosphere.
Chinese Coal Ash Fusion Temperatures Energy & Fuels, Vol. 23, 2009 1991
Empirical liquidus models were derived to correlate the AFTsunder both Ar and H2 atmospheres of 60 synthetic ash samples,with their liquidus temperatures calculated by FactSage. Thesemodels were used to predict the AFTs of 21 Chinese coal ashsamples in Ar and H2 atmospheres. In addition, a comparisonof AFTs for the Chinese coal ash samples was carried out forboth atmospheres, and X-ray diffraction (XRD), scanningelectron microscopy (SEM), and energy-dispersive spectrometry(EDS) were employed to study the ash behaviors.
Experimental Section
Coal Ash Samples. A total of 21 representative Chinese coalsamples were used in the study. The ash samples were prepared ina muffle furnace at 815 °C for 24 h according to the Chinesestandard GB/T 1574-1995. Chemical analysis of the samples wascarried out using X-ray fluorescence (XRF). The chemical composi-tion of the 21 coal ash samples is given in Table 1.
Synthetic Ash Samples. A total of 60 synthetic ash samples,covering the range of composition of most of the Chinese coal ashsamples, were prepared from Sinopharm Chemical Reagent Corp.laboratory-reagent silicon dioxide, aluminum oxide, ferric oxide,calcium oxide, and magnesium oxide. The compositions of the 60synthetic ash samples are given in Table 2.
Fusion Temperature Test. We performed the fusion temperaturetests by following the Chinese standard procedures (GB/T 219-1996) in a registered independent laboratory. This test involvesheating a sample cone of specified geometry at a rate of 5 k/min inan Ar or a H2 atmosphere. The following temperatures are recordedfor each sample, corresponding to specific shapes of the ash cones:initial deformation temperature (IDT), softening temperature (ST),hemispherical temperature (HT), and flow temperature (FT).
Characterization of Quenched Coal Ash Samples. Mineralogi-cal and microstructural analyses of coal ash samples quenched in anAr or a H2 atmosphere were determined by XRD (Rigabu D/max 2250)
Table 2. Ash Composition for Synthetic Ash Samples
number 1 2 3 4 5 6 7 8 9 10 11 12 13 14 15
SiO2 30.00 30.00 33.57 33.57 33.57 35.71 31.20 37.14 37.14 37.14 37.86 40.71 46.52 40.71 34.20Al2O3 12.00 12.00 13.43 13.43 13.43 14.28 20.80 14.86 14.86 14.86 15.14 16.29 10.48 16.29 22.80CaO 40.00 15.00 15.00 45.00 35.00 15.00 30.00 40.00 15.00 30.00 15.00 25.00 20.00 15.00 25.00Fe2O3 15.00 40.00 35.00 5.00 15.00 15.00 15.00 5.00 30.00 15.00 15.00 15.00 20.00 25.00 15.00MgO 3.00 3.00 3.00 3.00 3.00 20.00 3.00 3.00 3.00 3.00 17.00 3.00 3.00 3.00 3.00A/B 0.72 0.72 0.72 0.89 0.89 1.00 1.08 1.08 1.08 1.08 1.13 1.33 1.33 1.33 1.33
number 16 17 18 19 20 21 22 23 24 25 26 27 28 29 30
SiO2 40.71 43.57 40.62 37.20 44.29 40.29 44.29 45.00 42.59 46.43 36.55 47.85 43.90 52.11 52.11Al2O3 16.29 17.43 21.38 24.80 17.71 21.71 17.71 18.00 22.41 18.57 30.45 19.16 23.10 14.89 14.89CaO 35.00 15.00 30.00 20.00 15.00 18.00 30.00 15.00 15.00 15.00 15.00 25.00 15.00 15.00 10.00Fe2O3 5.00 15.00 5.00 15.00 20.00 17.00 5.00 15.00 15.00 15.00 15.00 5.00 15.00 15.00 20.00MgO 3.00 9.00 3.00 3.00 3.00 3.00 3.00 7.00 5.00 5.00 3.00 3.00 3.00 3.00 3.00A/B 1.33 1.56 1.63 1.63 1.63 1.63 1.63 1.70 1.86 1.86 2.03 2.03 2.03 2.03 2.03
number 31 32 33 34 35 36 37 38 39 40 41 42 43 44 45
SiO2 47.86 50.25 54.82 43.90 46.06 40.20 16.62 27.00 45.21 49.29 49.64 49.50 47.17 43.20 51.43Al2O3 19.14 16.75 12.18 23.10 20.94 26.80 55.38 45.00 23.79 19.71 19.86 22.50 24.83 28.80 20.57CaO 15.00 15.00 15.00 25.00 15.00 15.00 15.00 15.00 15.00 15.00 15.00 10.00 10.00 15.00 20.00Fe2O3 15.00 15.00 15.00 5.00 15.00 15.00 15.00 15.00 15.00 15.00 15.00 15.00 15.00 10.00 5.00MgO 3.00 3.00 3.00 3.00 3.00 3.00 3.00 3.00 3.00 1.00 0.50 3.00 3.00 3.00 3.00A/B 2.03 2.03 2.03 2.03 2.03 2.03 2.18 2.18 2.18 2.22 2.27 2.57 2.57 2.57 2.57
number 46 47 48 49 50 51 52 53 54 55 56 57 58 59 60
SiO2 51.43 39.27 51.43 47.17 47.17 49.50 52.94 55.00 55.00 50.45 55.00 57.14 57.86 58.57 60.17Al2O3 20.57 32.73 20.57 24.83 24.83 22.50 24.06 22.00 22.00 26.55 22.00 22.86 23.14 23.43 21.83CaO 10.00 15.00 15.00 20.00 15.00 15.00 5.00 15.00 5.00 5.00 10.00 2.00 15.00 10.00 7.00Fe2O3 15.00 10.00 10.00 5.00 10.00 10.00 15.00 5.00 15.00 15.00 10.00 15.00 1.00 5.00 10.00MgO 3.00 3.00 3.00 3.00 3.00 3.00 3.00 3.00 3.00 3.00 3.00 3.00 3.00 3.00 1.00A/B 2.57 2.57 2.57 2.57 2.57 2.57 3.35 3.35 3.35 3.35 3.35 4.00 4.26 4.55 4.55
Table 3. Species and Phases Considered in FactSage Version 5.5 Calculations
gas phase inert Ar inert H2
liquid polynomial solution slag slagsolid pure components SiO2, Al2O3, Fe2O3, CaO, MgO, Al6Si2O13, CaAl2O4,
Ca2Al2SiO7, Ca3A12O6, CaSiO3, Ca2SiO4, Ca3SiO5,Ca3SiO7, CaAl2Si2O8, Fe2Al4Si5O18, FeAl2O4, CaFe2O4,Ca2Fe2O5, CaFe2O7, CaFeSi2O6, Ca3Fe2Si3O12,CaMgSi2O6, MgSiO3, Mg2SiO4
SiO2, Al2O3, Fe2O3, Fe, FeO, CaO, MgO, Al6Si2O13,CaAl2O4, Ca2Al2SiO7,Ca3Al2O6, CaSiO3, Ca2SiO4,Ca3SiO5, Ca3SiO7, CaAl2Si2O8, Fe2Al4Si5O18, FeAl2O4,CaFe2O4, Ca2Fe2O5, CaFe2O7, CaFeSi2O6, Ca3Fe2Si3O12,CaMgSi2O6, MgSiO3, Mg2SiO4
polynomial solid solutions spinel (SPIN), A monoxide (MeO_A), clinopyroxene(cPy), orthopyroxene (oPyr), A wollastonite (WOLLA),melilite, olivine (Oliv), Aa′Ca2SiO4, mullite (MulF),cordierite
wollastoite (WOLL), dicalcium silicate (CASI), corundum(CORU), iron spinel (FESP), olivine (Oliv), A monox-ide (MeO_A), low clinopuroene (LcPy)
Table 4. Average Ash Chemistry, Approximate Liquidus Temperatures, and Expected Mineralogy of Synthetic Ashes for VariousGroups
primary phase fieldsa
group A/Bnumber of
sample SiO2/Al2O3 CaO (wt %) Fe2O3 (wt %) MgO (wt %)SiO2 +
Al2O3 (wt %)CaO + Fe2O3 +
MgO (wt %) Ar H2
I <2 25 1.5-2.5 15-45 5-40 3-20 e65 g35 A GII g2 35 0.3-4.5 2-25 1-15 0.5-3 g67 e33 M M
a A, anorthite; G, gehlenite; M, mullite.
1992 Energy & Fuels, Vol. 23, 2009 Song et al.
and SEM (JSM-6360 LV), respectively. We then used EDS (Falcon)to analyze the coal ash samples quenched in a H2 atmosphere.
Thermodynamic Equilibrium Calculations. The thermody-namic software package FactSage is the fusion of two well-knownsoftware packages in computational thermochemistry: Fact-Win andChemSage.28 FactSage consists of a series of information, database,calculation, and manipulation modules that enable one to accessand manipulate pure substances and solution databases. FactSageallows for the calculation and prediction of multiphase equilibria,liquidus temperatures, and the proportions of the liquid and solidphases in a specified atmosphere for a multicomponent system.
FactSage was used in this study to calculate the correspondingtemperatures with different proportions of the liquid phase as wellas the equilibrium product distributions for simplified coal ashsystems. Phase formation data for these oxides and their combina-tions were selected from the FToxid database. Calculations werecarried out between the solid temperature and liquidus temperaturein an Ar and a H2 atmosphere at 1 atm pressure. The calculationmethod of FactSage is based on Gibbs’ energy minimization foreach of the samples at a given temperature and composition range.Phases formed at concentrations below 0.01 wt % were ignored.Because of the complexity of the thermodynamic models (quasi-chemical and sublattice), which represents the interaction of thecomponents for phase formation, the convergence of the algorithmsis slow and sensitive. In this study, we used the method of Jak etal.,29 which permits the approximation to start from lower ordersubsystems and then finally reaching the real or complete system.Once the phases have been determined, a total mass balance verifiesthe consistency of the system.
Because iron in coal ash and synthetic ash samples is generallyassumed to exist as Fe2O3 in both oxidizing and inert atmospheres,16,18
all of the iron has been taken to be present in the ferric form in theash samples in our work. However, most of the iron is reduced tometallic iron in the strongly reducing atmosphere.30 It is reasonablethat the thermodynamic properties calculated for each ashsample in Ar and H2 atmospheres by FactSage may be predictedfrom the SiO2-Al2O3-CaO-Fe2O3-MgO and SiO2-Al2O3-CaO-Fe-MgO systems, respectively. The different definitions ofthe liquidus temperatures as calculated for each sample by FactSageare the following: (i) In the Ar atmosphere, the liquidus temperatureis the temperature at which the first solid just starts to precipitateupon cooling of a slag-liquid oxide melt. (ii) In the H2 atmosphere,the last solid to melt for all of the synthetic and coal ash samplesis metallic iron because it has the highest melting point and thedifference in temperature at which the metallic iron melts com-pletely for each sample was negligible. Thus, the liquidus temper-ature for each sample in a H2 atmosphere was defined as thetemperature at which the first mineral matter, except metallic iron,just starts to precipitate upon cooling of a slag-liquid oxide melt.
A list of species and phases considered in the calculations isprovided in Table 3.
Results and Discussion
Synthetic Ash Grouping. It is well-known that the acid/base(A/B) ratio, which relates the ash acidic compounds (SiO2, Al2O3,and TiO2), which increase AFTs (A) to the ash basic compounds(CaO, Fe2O3, MgO, Na2O, and K2O) that reduce them (B), ismainly responsible for differing melting characteristics and one ofthe first indexes used to predict ash fusibility.31,32 For instance, ahigh A/B ratio (g2.0) may indicate the presence of large amountsof refractory mineral matter (mullite) in ash, which may increasethe AFTs of ash samples. Therefore, a synthetic ash samplegrouping scheme based on the A/B ratio is designed to understandAFT measurements (see Table 4).
The melting and crystallization behaviors of ashes arecommonly explained by simplifying the ash compositions tothree or four oxides.33 Therefore, in our work, all of the syntheticash samples were normalized to the pseudo-ternary system[SiO2-Al2O3-(CaO + FeOn + MgO)], and then we usedFactSage to draw the pseudo-ternary diagrams (SiO2-Al2O3-
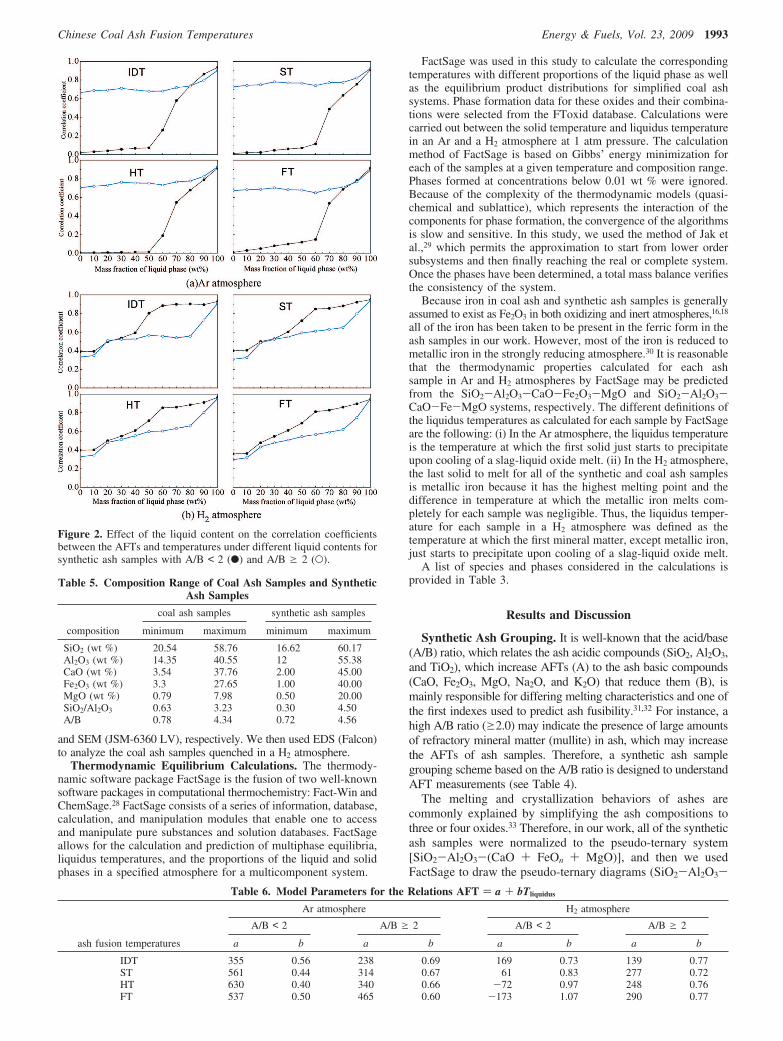
Figure 2. Effect of the liquid content on the correlation coefficientsbetween the AFTs and temperatures under different liquid contents forsynthetic ash samples with A/B < 2 (b) and A/B g 2 (O).
Table 5. Composition Range of Coal Ash Samples and SyntheticAsh Samples
coal ash samples synthetic ash samples
composition minimum maximum minimum maximum
SiO2 (wt %) 20.54 58.76 16.62 60.17Al2O3 (wt %) 14.35 40.55 12 55.38CaO (wt %) 3.54 37.76 2.00 45.00Fe2O3 (wt %) 3.3 27.65 1.00 40.00MgO (wt %) 0.79 7.98 0.50 20.00SiO2/Al2O3 0.63 3.23 0.30 4.50A/B 0.78 4.34 0.72 4.56
Table 6. Model Parameters for the Relations AFT ) a + bTliquidus
Ar atmosphere H2 atmosphere
A/B < 2 A/B g 2 A/B < 2 A/B g 2
ash fusion temperatures a b a b a b a b
IDT 355 0.56 238 0.69 169 0.73 139 0.77ST 561 0.44 314 0.67 61 0.83 277 0.72HT 630 0.40 340 0.66 -72 0.97 248 0.76FT 537 0.50 465 0.60 -173 1.07 290 0.77
Chinese Coal Ash Fusion Temperatures Energy & Fuels, Vol. 23, 2009 1993
CaO/Fe2O3 with a CaO/Fe2O3 weight ratio of 1.0, MgO )3.00%) in an Ar atmosphere (Figure 1a) and (SiO2-Al2O3-CaO/Fe with a CaO/Fe weight ratio of 1.43, MgO ) 3.14%) in a H2
atmosphere (Figure 1b), respectively. Note that the actual CaO/Fe2O3 weight ratio in an Ar atmosphere and the CaO/Fe weightratio in a H2 atmosphere of the 60 synthetic ash samples varied
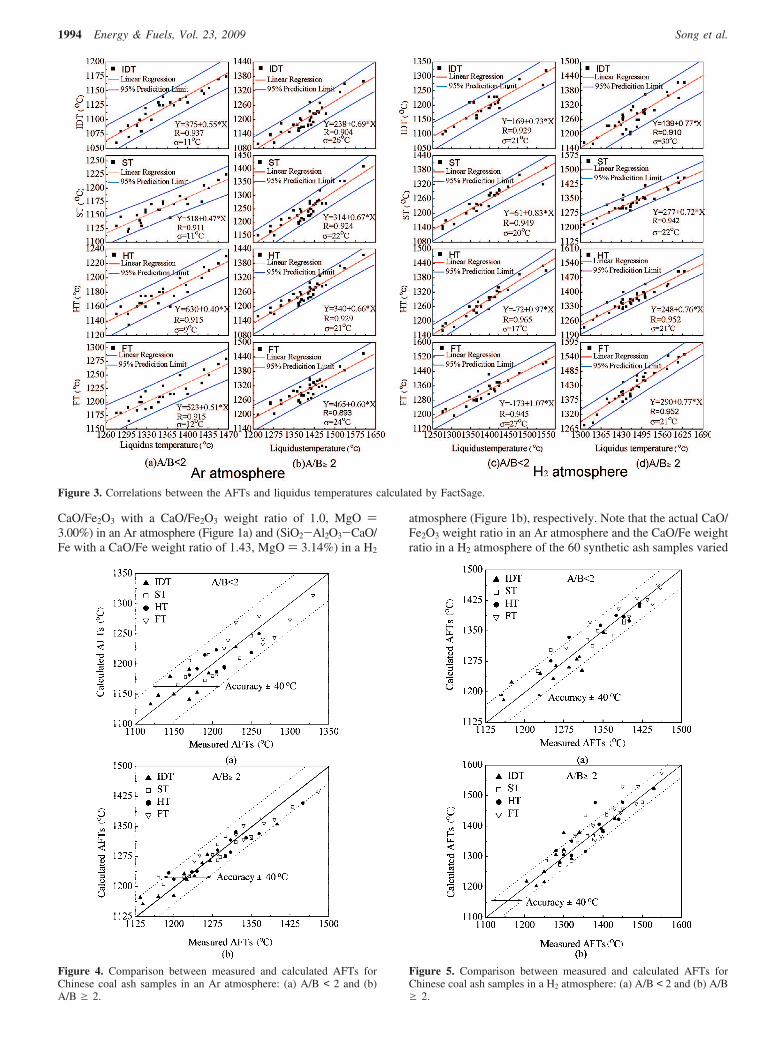
Figure 3. Correlations between the AFTs and liquidus temperatures calculated by FactSage.
Figure 4. Comparison between measured and calculated AFTs forChinese coal ash samples in an Ar atmosphere: (a) A/B < 2 and (b)A/B g 2.
Figure 5. Comparison between measured and calculated AFTs forChinese coal ash samples in a H2 atmosphere: (a) A/B < 2 and (b) A/Bg 2.
1994 Energy & Fuels, Vol. 23, 2009 Song et al.
from 0.5-2 and 0.48-1.9, respectively. However, because theeffects on liquidus temperature curves and mineral matter withthe variation of the CaO/Fe2O3 weight ratio and CaO/Fe weightratio was negligible, it is reasonable that the character of thesynthetic ash samples with A/B < 2 and A/B g 2 in Ar and H2
atmospheres may be analyzed by the pseudo-ternary diagramsSiO2-Al2O3-CaO/Fe2O3 and SiO2-Al2O3-CaO/Fe, respec-tively. Four kind of synthetic ash samples with MgO > 7% donot lie in the phase of these pseudo-ternary sections. In parts aand b of Figure 1, thick lines of the same color represent allcompositions having a given liquidus temperature.
Group I: A/B < 2. Group I synthetic ash samples contain veryhigh levels of fluxing components (CaO + Fe2O3 + MgO >35%) and only a little refractory components. As shown in partsa and b of Figure 1, the composition of the synthetic ash samples
with A/B < 2 under Ar and H2 atmospheres lie in the anorthite(CaAl2Si2O8) and genhlenite (CaAl2SiO7) primary phase fieldof the pseudo-ternary diagrams SiO2-Al2O3-CaO/Fe2O3 andSiO2-Al2O3-CaO/Fe, respectively, and their liquidus temper-atures are expected to be low.
Group II: A/B g 2. Group II synthetic ash samples arecharacterized by the presence of reasonable levels of refractorycomponents, so that the fluxing components CaO + Fe2O3 +MgO < 33%. Parts a and b of Figure 2 show that thecomposition of Group II ash samples have mullite (Al6Si2O13)as the first solid to precipitate and have high liquidus temperatures.
Composition Ranges for Coal and Synthetic Ash Sam-ples. The composition ranges for coal ash samples and syntheticash samples are given in Table 5. As can be seen from Table 5,
Table 7. Summary of Bias and Standard Errors for Predication of AFTs of Chinese Coal Ash Samples
Ar atmosphere H2 atmosphere
A/B < 2 A/B g 2 A/B < 2 A/B g 2
ash fusiontemperatures bias (°C)
standarderror (°C) bias (°C)
standarderror (°C) bias (°C)
standarderror (°C) bias (°C)
standarderror (°C)
IDT -2.05 21.78 2.37 22.3 6.53 9.81 6.66 9.14ST 0.789 21.85 -1.89 25.15 -0.74 8.84 -1.49 9.46HT 3.55 20.50 4.44 24.69 -6.61 7.51 10.38 10.36FT 4.81 21.39 4.26 22.37 7.35 7.97 -14.74 8.81
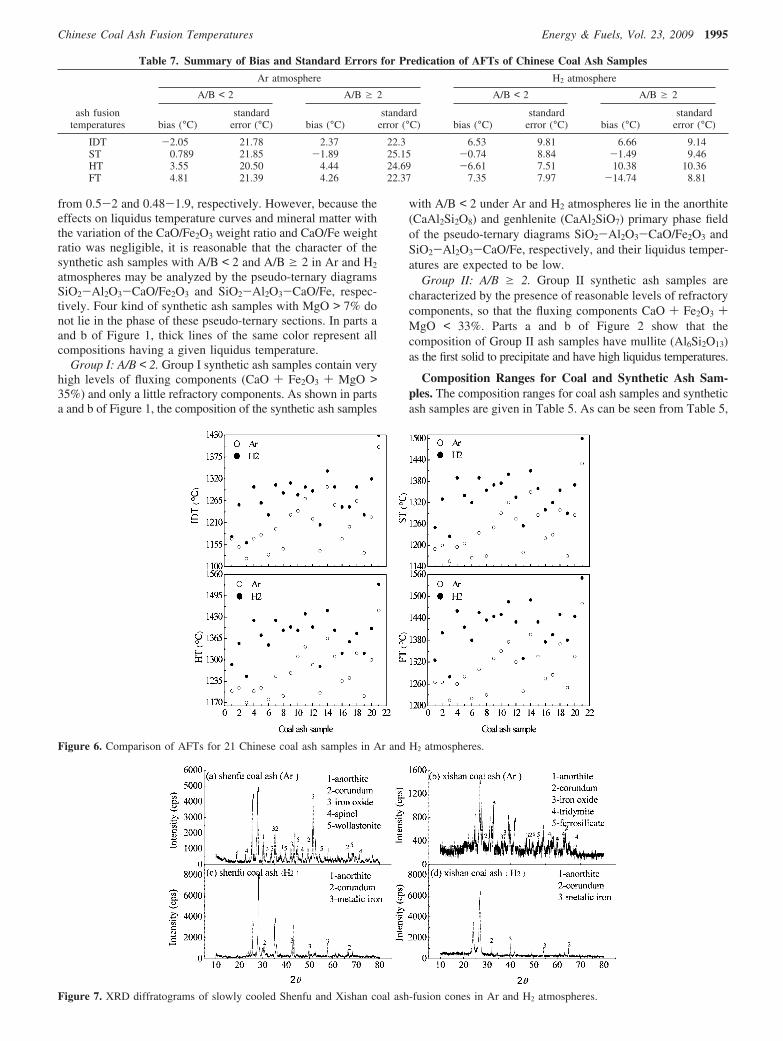
Figure 6. Comparison of AFTs for 21 Chinese coal ash samples in Ar and H2 atmospheres.
Figure 7. XRD diffratograms of slowly cooled Shenfu and Xishan coal ash-fusion cones in Ar and H2 atmospheres.
Chinese Coal Ash Fusion Temperatures Energy & Fuels, Vol. 23, 2009 1995
the range of content of the five oxides, SiO2/Al2O3, and theA/B ratio of synthetic ash samples covers those of the 21Chinese coal ash samples.
Correlation Analysis of Synthetic Ash. Linear regressionanalysis was used to compare correlations between the AFTsof synthetic ash samples and the temperatures with differentliquid content calculated by FactSage. Generally, the reliabilityof the values calculated using the correlations is indicated bythe correlation coefficient (R). The standard deviation, σ value,simply indicates how close the calculated value is to theexperimental values. In our work, the R values are used toanalyze the correlations between the four characteristic AFTsof synthetic ash samples and their temperatures with differentliquid content. A R value of 0.7 is generally acceptable forpredicting the AFTs of coal ash samples; a value of 0.8 is good;and a value of 0.9 or higher is excellent. Meanwhile, becausethe current standard ash fusion test, such as GB/T 219-1996, issomewhat subjective, being based on the operator’s judgmentof the degree of deformation of the ash sample as thetemperature rises at a specified rate in a controlled atmosphere,the repeatability limits for a single operator and apparatus is30-50 °C and the repeatability limits for different operatorsand apparatus is 80-150 °C.
Parts a and b of Figure 2 show the effect of the liquid contenton the correlation coefficients between the AFTs and temper-atures for different liquid content calculated by FactSage forsynthetic ash samples with different A/B ratios.
Figure 2a shows the increase in the four characteristic AFTscorresponding to R values of synthetic ash samples as the liquidcontents increase under an Ar atmosphere. In a H2 atmosphere,the effect of the liquid content on the R values is similar to thatfor an Ar atmosphere (Figure 2b). As can be seen from parts aand b of Figure 2, when the liquid content increases to 100%,the corresponding R values for the four characteristic AFTs arealmost the largest values for all of the samples in both Ar andH2 atmospheres, which indicates that there are significantcorrelations between the AFTs of synthetic ash samples andthe liquidus temperature in Ar and H2 atmospheres.
Parts a-d of Figure 3 present the AFTs of the synthetic ashsamples with different A/B ratios as a function of the calculatedliquidus temperatures in both Ar and H2 atmospheres. Goodcorrelations between the AFTs and liquidus temperatures can
be clearly seen in Figure 3: the higher the liquidus temperature,the higher the AFT. Also, the AFTs of synthetic ash samplesgive R values that are always higher than 0.89, which indicatesthat there are good correlations between the AFTs and liquidustemperatures. Meanwhile, the σ values are always less than 30°C, which indicates that the accuracy of the results is withinexperimental error.
The AFTs of the synthetic ash samples with different A/Bratios were expressed as linear functions of the liquidustemperature. For example, the IDT of the coal ash sample withA/B < 2 (I) in a H2 atmosphere (H) is
The sum of squared differences between the measured andpredicted AFT temperatures was minimized by adjusting theparameters a and b. The parameters obtained this way for thisset of synthetic ash samples are given in Table 6.
Prediction of AFTs of Coal Ash Samples. In our work, theliquidus models (eq 1), which have been developed by empiricalcorrelations between the liquidus temperatures calculated byFactSage and AFTs derived using linear regression analysis,are used to predict the AFTs of 21 Chinese coal ash samples inAr and H2 atmospheres.
Parts a and b of Figure 4 show parity plots of the measuredAFTs versus the predicted AFTs for 21 Chinese coal ashsamples with different A/B ratios in an Ar atmosphere. All ofthe coal ash samples show deformation temperatures withinexperimental errors of (40 °C; therefore, the liquidus modelscan predict AFTs of Chinese coal ash samples in an Aratmosphere.
Parity plots for AFT prediction of the Chinese coal ashsamples with different A/B ratios in a H2 atmosphere using thesemodels (eq 1) are given in parts a and b of Figure 5. It isapparent that all of coal ash samples (apart from one) areobserved to deform with experimental errors (40 °C, whichindicates that the liquidus models provide a good prediction ofthe AFTs of Chinese coal ash samples in a H2 atmosphere.
A summary of the bias and standard errors for each AFT isgiven in Table 7.
Bias is calculated from the following equation:
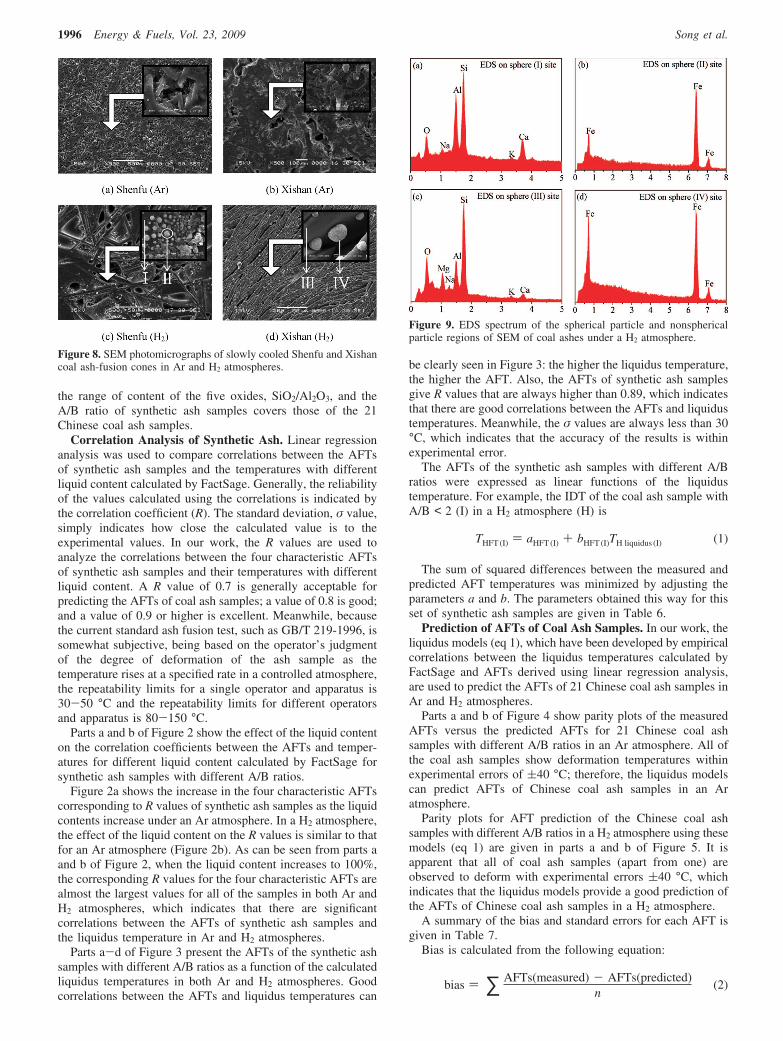
Figure 8. SEM photomicrographs of slowly cooled Shenfu and Xishancoal ash-fusion cones in Ar and H2 atmospheres.
Figure 9. EDS spectrum of the spherical particle and nonsphericalparticle regions of SEM of coal ashes under a H2 atmosphere.
THFT (I) ) aHFT (I) + bHFT (I)TH liquidus (I) (1)
bias ) ∑ AFTs(measured) - AFTs(predicted)n
(2)
1996 Energy & Fuels, Vol. 23, 2009 Song et al.
The standard error is calculated from the following:
where n is the number of data points and σ is the standarddeviation.
From Table 7, we see that the bias and standard error for theAFTs of each of the 21 Chinese coal ash samples are below 15and 25 °C, respectively, which are lower than experimentalerrors; therefore, the liquidus models can predict the AFTs verywell.
Comparison of AFTs of Coal Ash Samples in Ar andH2 Atmospheres. The AFTs of a given coal ash sample aredifferent in different atmospheres. For example, the AFTs ofcoal ash samples in mildly reducing atmospheres are lower thanthose of coal ash samples in oxidizing atmospheres. This isbecause most iron oxides in mildly reducing atmospheres arereduced to FeO, which can form a eutectic mixture with theother oxides.16,34 Figure 6 shows a comparison of the AFTs of21 Chinese coal ash samples in both Ar and H2 atmospheres.From the four graphs, we find that the AFTs of coal ash samplesin a H2 atmosphere are always higher than those in an Aratmosphere.
Parts a-d of Figure 7 depict the X-ray diffractograms of twoslowly cooled Chinese coal samples (Shenfu and Xishansamples) from ash-fusion cones in Ar and H2 atmospheres. Thespecies of mineral matters and the main forms of iron clearlychanges between the Ar and H2 atmospheres. For example, thecharacteristic peaks of minerals in a H2 atmosphere (parts c andd of Figure 7) are clearly less than that those in an Aratmosphere (parts a and b of Figure 7), which indicates that theamount of mineral matter in a H2 atmosphere is less than in anAr atmosphere. Meanwhile, the main form of iron in a H2
atmosphere is metallic iron.Figure 8 shows the SEM analysis for micromorphologies of
two slowly cooled Chinese coal samples (Shenfu and Xishansamples) from ash-fusion cones in Ar and H2 atmospheres. Itcan be seen that, in an Ar atmosphere, the micromorphologiesof the coal ash samples show irregular net structures (parts a
and b of Figure 8). However, in a H2 atmosphere, themicromorphologies show bracket structures, which may makethe physical structure of each coal ash samples firmer and noteasy to deform in a H2 atmosphere. This may be one of thereasons why the AFTs are higher than those of coal ash samplesin a H2 atmosphere. Also, from parts c and d of Figure 8, wecan see that there are lots of spherical particles formed in a H2
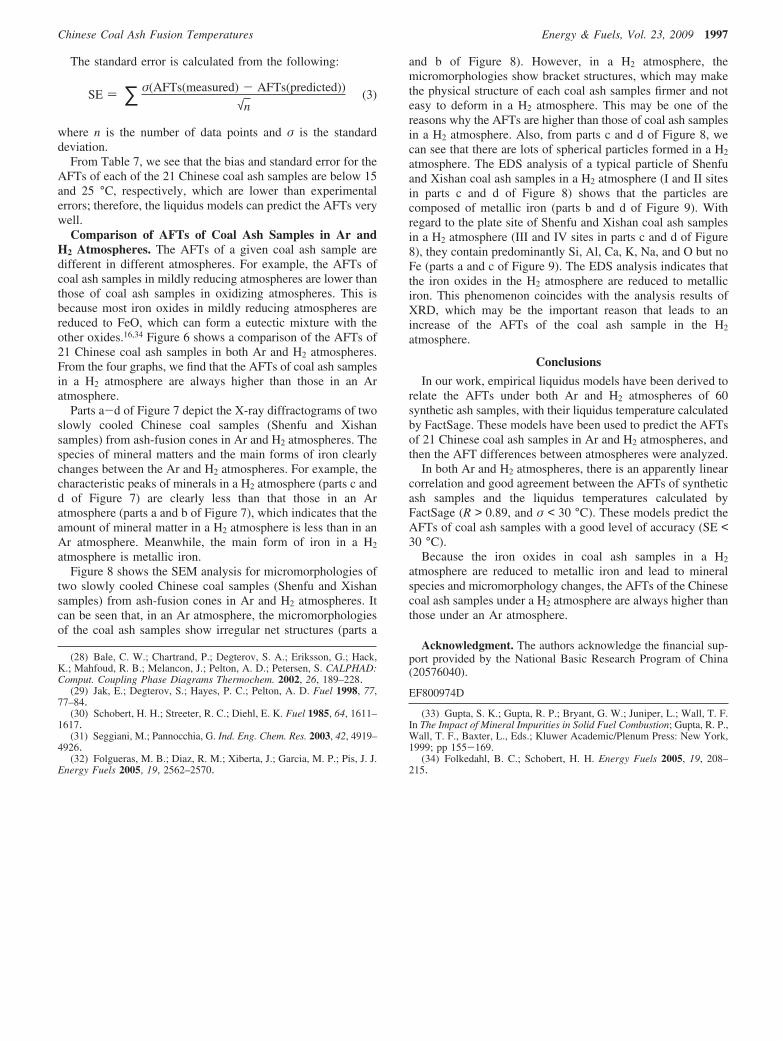
atmosphere. The EDS analysis of a typical particle of Shenfuand Xishan coal ash samples in a H2 atmosphere (I and II sitesin parts c and d of Figure 8) shows that the particles arecomposed of metallic iron (parts b and d of Figure 9). Withregard to the plate site of Shenfu and Xishan coal ash samplesin a H2 atmosphere (III and IV sites in parts c and d of Figure8), they contain predominantly Si, Al, Ca, K, Na, and O but noFe (parts a and c of Figure 9). The EDS analysis indicates thatthe iron oxides in the H2 atmosphere are reduced to metalliciron. This phenomenon coincides with the analysis results ofXRD, which may be the important reason that leads to anincrease of the AFTs of the coal ash sample in the H2
atmosphere.
Conclusions
In our work, empirical liquidus models have been derived torelate the AFTs under both Ar and H2 atmospheres of 60synthetic ash samples, with their liquidus temperature calculatedby FactSage. These models have been used to predict the AFTsof 21 Chinese coal ash samples in Ar and H2 atmospheres, andthen the AFT differences between atmospheres were analyzed.
In both Ar and H2 atmospheres, there is an apparently linearcorrelation and good agreement between the AFTs of syntheticash samples and the liquidus temperatures calculated byFactSage (R > 0.89, and σ < 30 °C). These models predict theAFTs of coal ash samples with a good level of accuracy (SE <30 °C).
Because the iron oxides in coal ash samples in a H2
atmosphere are reduced to metallic iron and lead to mineralspecies and micromorphology changes, the AFTs of the Chinesecoal ash samples under a H2 atmosphere are always higher thanthose under an Ar atmosphere.
Acknowledgment. The authors acknowledge the financial sup-port provided by the National Basic Research Program of China(20576040).
EF800974D
(28) Bale, C. W.; Chartrand, P.; Degterov, S. A.; Eriksson, G.; Hack,K.; Mahfoud, R. B.; Melancon, J.; Pelton, A. D.; Petersen, S. CALPHAD:Comput. Coupling Phase Diagrams Thermochem. 2002, 26, 189–228.
(29) Jak, E.; Degterov, S.; Hayes, P. C.; Pelton, A. D. Fuel 1998, 77,77–84.
(30) Schobert, H. H.; Streeter, R. C.; Diehl, E. K. Fuel 1985, 64, 1611–1617.
(31) Seggiani, M.; Pannocchia, G. Ind. Eng. Chem. Res. 2003, 42, 4919–4926.
(32) Folgueras, M. B.; Diaz, R. M.; Xiberta, J.; Garcia, M. P.; Pis, J. J.Energy Fuels 2005, 19, 2562–2570.
(33) Gupta, S. K.; Gupta, R. P.; Bryant, G. W.; Juniper, L.; Wall, T. F.In The Impact of Mineral Impurities in Solid Fuel Combustion; Gupta, R. P.,Wall, T. F., Baxter, L., Eds.; Kluwer Academic/Plenum Press: New York,1999; pp 155-169.
(34) Folkedahl, B. C.; Schobert, H. H. Energy Fuels 2005, 19, 208–215.
SE ) ∑ σ(AFTs(measured) - AFTs(predicted))
√n(3)
Chinese Coal Ash Fusion Temperatures Energy & Fuels, Vol. 23, 2009 1997