Embed Size (px)
Citation preview
ENVIRONMETRICS
Environmetrics 2009; 20: 633–646
Published online 25 March 2009 in Wiley InterScience
(www.interscience.wiley.com) DOI: 10.1002/env.968
Prediction of erythemally effective UVB radiation by meansof nonlinear regression model
Kamil Laska1*,y, Pavel Prosek1, Ladislav Budık2, Marie Budıkova3 and Gennadi Milinevsky4
1Department of Geography, Faculty of Science, Masaryk University, Brno 611 37, Czech Republic2Czech Hydrometeorological Institute, Brno Regional Office, Brno 616 67, Czech Republic
3Department of Mathematics and Statistics, Faculty of Science, Masaryk University, Brno 611 37, Czech Republic4 Space Physics Department, Physics Faculty, National Taras Shevchenko University of Kyiv, Kyiv, 03680, Ukraine
SUMMARY
One of the research programs carried out within the Czech-Ukrainian scientific co-operation is the monitoring ofglobal solar and ultraviolet radiation at the Vernadsky Station (formerly the British Faraday Station), Antarctica.Radiation measurements have been made since 2002. Recently, a special attention is devoted to the measurementsof the erythemally effective UVB radiation using a broadband Robertson Berger 501 UV-Biometer (Solar LightCo. Inc., USA). This paper brings some results from modelling the daily sums of erythemally effective UVBradiation intensity in relation to the total ozone content (TOC) in atmosphere and surface intensity of the globalsolar radiation. Differences between the satellite- and ground-based measurements of the TOC at the VernadskyStation are taken into consideration. The modelled erythemally effective UVB radiation differed slightlydepending on the seasons and sources of the TOC. The model relative prediction error for ground- andsatellite-based measurements varied between 9.5% and 9.6% in the period of 2002–2003, while it ranged from7.4% to 8.8% in the period of 2003–2004. Copyright # 2009 John Wiley & Sons, Ltd.
key words: Antarctica; UV radiation; ozone depletion; cloudiness; nonlinear regression model
1. INTRODUCTION
Antarctica plays a very significant role in many environmental aspects and processes of the Earth. One
of them is the impact on the global climate system (considerable influence on the planet’s albedo, long
‘‘climate memory’’ of the huge mass of ice, important factor of the meridional exchange of air masses)
and on the water circulation in the oceans. Many aspects of the Antarctic climate, such as seasonal
changes of sea ice in the Southern Ocean, temperature stability of the atmosphere, orographic and
katabatic winds, are affected by the annual regime of energy balance and solar radiation subsequently.
Specific feature of solar radiation in the Antarctic region is a seasonal increase of the ultraviolet (UV)
radiation intensity, due to the decrease of the stratospheric ozone concentration.
*Correspondence to: K. Laska, Department of Geography, Faculty of Science, Masaryk University, Kotlarska 2, Brno 611 37,Czech Republic.yE-mail: [email protected]
Copyright # 2009 John Wiley & Sons, Ltd.
Received 18 September 2008
Accepted 1 October 2008
634 K. LASKA ET AL.
The extraterrestrial solar radiation spectrum contains ultraviolet-C (UVC) radiation in the spectral
range of 100–280 nm, ultraviolet-B (UVB) radiation in the spectral range of 280–320 nm, and
ultraviolet-A (UVA) radiation in the spectral range of 320–400 nm. The UVC radiation is completely
absorbed by oxygen and ozone in the stratosphere. Due to the wavelength dependence of the ozone absorp-
tion, a decrease in the ozone amount determines a greater increase in the UVB radiation than in the UVA.
Surface UV irradiance is affected by extraterrestrial factors (Earth’s distance from the Sun, and solar
elevation angle, which determines the optical path length), as well as by terrestrial factors, such as
aerosol concentration in the atmosphere including cloudiness and cloud types, ozone concentration, its
vertical distribution and integrated column amount, particularly the surface geometry and the ground
albedo. Model calculations also indicate that the UVB radiation increases by about 5%/km in altitude
(Bodeker, 1997).
The spatiotemporal variation of incident solar UV radiation increases from the central part
(Antarctic plateau) to the coastline (maritime Antarctica). Apart from ozone concentration, the
cloudiness is the main factor. The mean annual cloudiness in coastal regions of Antarctica near 608S is
about 80–90% (result of the frontal activity). Near 708S, the surface observations show a total cloud
cover of about 45–50% with little variability through the year and only a small decrease during the
winter months (King and Turner, 1997). In contrast to oceanic and coastal areas, the amount of clouds
near the South Pole shows large seasonal variations—from about 35% in autumn and winter to nearly
55% in spring and summer. Latitudinal changes in cloud types exhibit a certain influence, too; a large
amount of stratus occurs close to 608S, cirrus and altostratus prevail at 708S. Over the interior of
Antarctica, cirrus is the most commonly reported type of cloud (King and Turner, 1997).
The stratospheric ozone depletion over Antarctica was discovered at the beginning of the 1980s
(Farman et al., 1985). The lowest total ozone content (TOCs) in Antarctica are usually reached in the
first week of October, which, despite the rather low solar elevation in the autumn season, produce high
intensities of UVB radiation (Hermann et al., 1995). The formation of ozone depletion begins
approximately in the second half of August, culminates in the first half of October, and dissolves in
November. During the ozone depletion development, the average ozone concentration has varied at the
time of its culmination in October from the original value reaching over 300 Dobson Unit (DU) in the
1950s and 1960s to a level between 100 and 150 DU in 1990–2000. The area of ozone depletion has
been growing, although with some anomalies, in parallel with the increasing ozonosphere destruction.
Satellite measurements showed that in the early 1980s, the average October surface area with ozone
concentration below 220 DU did not exceed 7.5 million km2, while at the end of the 1990s it was over
16 million km2. At the beginning of the new millennium, the ozone depletion development can be
described as considerably irregular. With the exception of the year 2001 (15.3 million km2), its surface
area did not surmount 10 million km2 (Antarctic Ozone Bulletin, 2002, 2003; Newman et al., 2004).
2. MATERIALS AND METHODS
Monitoring and forecasting of the UV radiation has become very important due to its harmful effects on
the biota as well as because of human health risks. Excessive exposure to UVB radiation can be harmful
to the skin and can result in damage of DNA and formation of skin cancers. Based on the cooperation
contract between the National Antarctic Scientific Center of Ukraine (NASCU) and the Faculty of
Science, Masaryk University, Brno, experts from the Department of Geography at the Faculty launched
a team work with the Ukrainian colleagues at the beginning of 2002 at the Ukrainian Vernadsky Station
in Antarctica (formerly the British Faraday Station) with geographical coordinates w¼ 6580104500S;
Copyright # 2009 John Wiley & Sons, Ltd. Environmetrics 2009; 20: 633–646
DOI: 10.1002/env
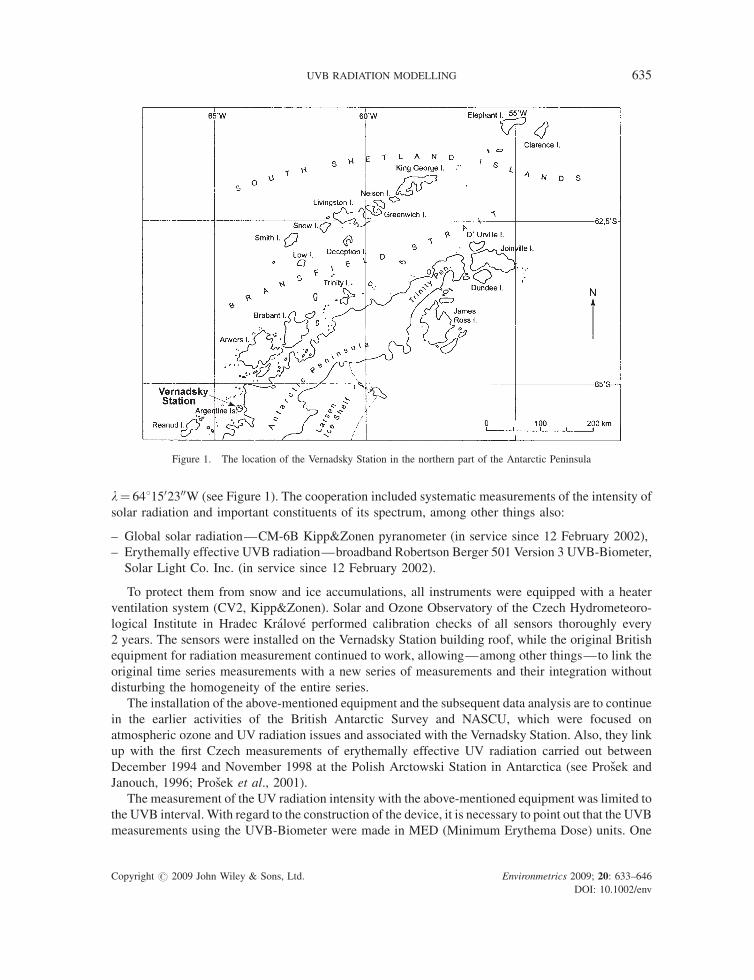
Figure 1. The location of the Vernadsky Station in the northern part of the Antarctic Peninsula
UVB RADIATION MODELLING 635
l¼ 6481502300W (see Figure 1). The cooperation included systematic measurements of the intensity of
solar radiation and important constituents of its spectrum, among other things also:
– G
Co
lobal solar radiation—CM-6B Kipp&Zonen pyranometer (in service since 12 February 2002),
– E
rythemally effective UVB radiation—broadband Robertson Berger 501 Version 3 UVB-Biometer,Solar Light Co. Inc. (in service since 12 February 2002).
To protect them from snow and ice accumulations, all instruments were equipped with a heater
ventilation system (CV2, Kipp&Zonen). Solar and Ozone Observatory of the Czech Hydrometeoro-
logical Institute in Hradec Kralove performed calibration checks of all sensors thoroughly every
2 years. The sensors were installed on the Vernadsky Station building roof, while the original British
equipment for radiation measurement continued to work, allowing—among other things—to link the
original time series measurements with a new series of measurements and their integration without
disturbing the homogeneity of the entire series.
The installation of the above-mentioned equipment and the subsequent data analysis are to continue
in the earlier activities of the British Antarctic Survey and NASCU, which were focused on
atmospheric ozone and UV radiation issues and associated with the Vernadsky Station. Also, they link
up with the first Czech measurements of erythemally effective UV radiation carried out between
December 1994 and November 1998 at the Polish Arctowski Station in Antarctica (see Prosek and
Janouch, 1996; Prosek et al., 2001).
The measurement of the UV radiation intensity with the above-mentioned equipment was limited to
the UVB interval. With regard to the construction of the device, it is necessary to point out that the UVB
measurements using the UVB-Biometer were made in MED (Minimum Erythema Dose) units. One
pyright # 2009 John Wiley & Sons, Ltd. Environmetrics 2009; 20: 633–646
DOI: 10.1002/env
636 K. LASKA ET AL.
MED h�1 is equivalent to UVB radiation intensity required for a minimum irritation (i.e., reddening,
skin erythema) in the skin of average pigmentation after 1 h of exposure. Conversion into physical units
is accomplished by means of the relationship: 1 MED h�1¼ 0.0583 W m�2, or 210 kJ m�2 h�1. In view
of the units of measurement and their relationship to the effects on human skin, the sensors are
calibrated using the knowledge about the erythemal effects of individual wavelengths. These
wavelengths are described by the McKinlay–Diffey Erythemal Action Spectrum, which quantifies the
contribution made by the particular spectral intensities within the defined band to the appearance of
erythema (CIE, 1987; McKinlay and Differy, 1987). From the above it follows that the results of the
measurements presented in this paper, whether our own or those of other stations, do not represent direct
daily measurements of total UVB intensities in the physical sense, but rather their biological impact.
This paper presents results from the analysis of two periods (seasons) of measuring the intensity of
erythemally effective UVB radiation: Season 1—from 23 July 2002 to 28 February 2003, and Season
2—from 23 July 2003 to 28 February 2004. Both analyzed periods differ significantly, particularly in
the ozone anomaly area with the ozone concentration below 220 DU (Newman et al., 2004). In 2002,
the October average amounted to mere 3.0 million km2 and its development was very slow from
August. At the beginning of October, it split into two parts, which reunited again and then became extinct
relatively rapidly. The average surface area in October 2003 amounted already to 9.8 million km2 with the
ozone depletion formed as early as in mid-August and retained without any significant change until
mid-October. It became rapidly extinct in the second half of November (Stolarski et al., 2005).
Data about the ozone concentration can be obtained either from ground measurements predo-
minantly taken with Dobson and Brewer ozone spectrophotometers or from satellite measurements.
TOC is a parameter that is frequently used to determine ozone content of the atmosphere. Recently,
many authors have assessed the uncertainties in the TOC from satellite measurements as well as differences
between ground and satellite observations (e.g., Labow et al., 2004; Vanicek, 2006; Schmalwieser et al.,
2007). In this study, both TOC data sources were used and compared due to uncertainties raised in the
measured ozone. The first data series was derived from space-based measurements of the Total Ozone
Mapping Spectrometer (TOMS) aboard the NASA’s Earth Probe Satellite (EPTOMS). The EPTOMS
Version 8 provided both single retrievals and daily gridded ozone data from 1996 to 2004 (McPeters
et al., 1998; Labow et al., 2004). The daily gridded TOC values were acquired for the geographical
coordinates of the Vernadsky Station (http://toms.gsfc.nasa.gov/ftpdata.html). The second TOC series
based on the Dobson No 031 spectrophotometer measurements at Vernadsky Station was applied here.
Figures 2 and 3 primarily show the high diurnal and seasonal variability and the logical similarity of
TOC, daily sums of global solar radiation (Ig) and erythemally effective UVB regimes.
Basic extraterrestrial factors affecting these regimes are the Earth–Sun distance and the solar
elevation angle; terrestrial factors—in addition to ozone—are cloudiness, presence of aerosols and
atmospheric gases, altitude and the Earth’s surface albedo. Of these, attention is paid at this place to the
effects of cloudiness and ozone, which logically show most particularly in the UVB regime as it is most
significantly affected by ozone content. At the same time, the two terrestrial factors apparently operate
in different time regimes. While the variable cloudiness determines shorter-term fluctuations of the
radiation fluxes, ozone declines cause radiation changes of prolonged periodicity in the second half of
the year. These impacts are furthermore overlaid by the effect of cloudiness. In 2002, the effects were
clearly demonstrated for example in the period of ozone hole occurrence between 20 September and
22 October, and in the period from 23 October to 10 November. In 2003, a significant increase of UVB
between 25 September and approximately 12 October was related to the decline of ozone while the
subsequent increase of the ozone concentration from 13 October suppressed the natural increasing
trend of UVB until late November. This is why the absolute UVB maxima did not relate—unlike in the
Copyright # 2009 John Wiley & Sons, Ltd. Environmetrics 2009; 20: 633–646
DOI: 10.1002/env
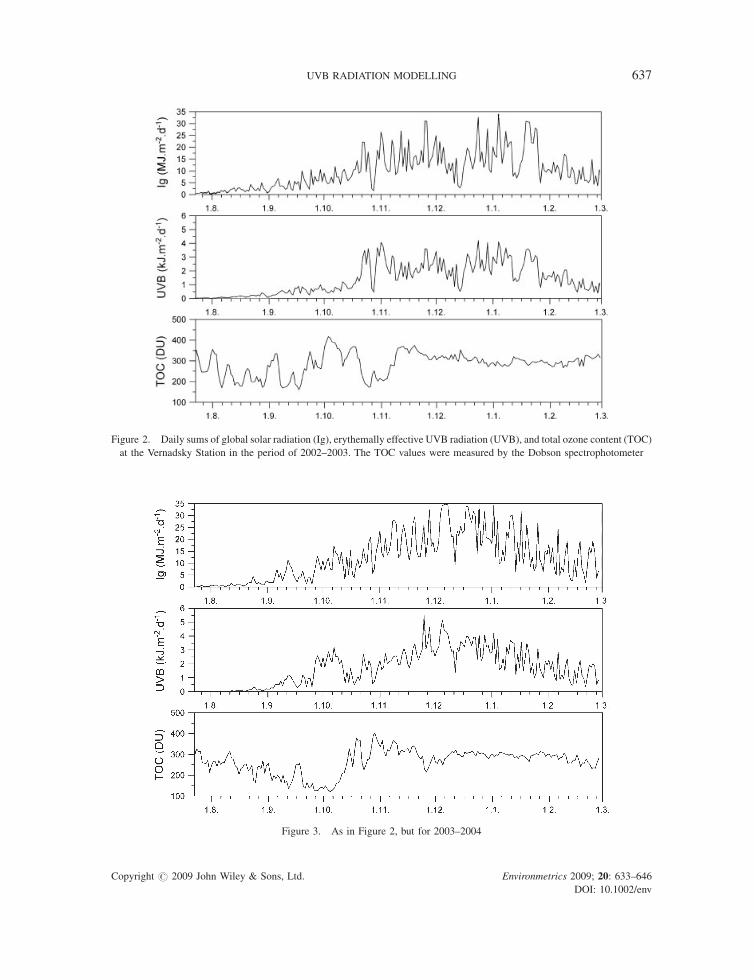
Figure 2. Daily sums of global solar radiation (Ig), erythemally effective UVB radiation (UVB), and total ozone content (TOC)
at the Vernadsky Station in the period of 2002–2003. The TOC values were measured by the Dobson spectrophotometer
Figure 3. As in Figure 2, but for 2003–2004
Copyright # 2009 John Wiley & Sons, Ltd. Environmetrics 2009; 20: 633–646
DOI: 10.1002/env
UVB RADIATION MODELLING 637
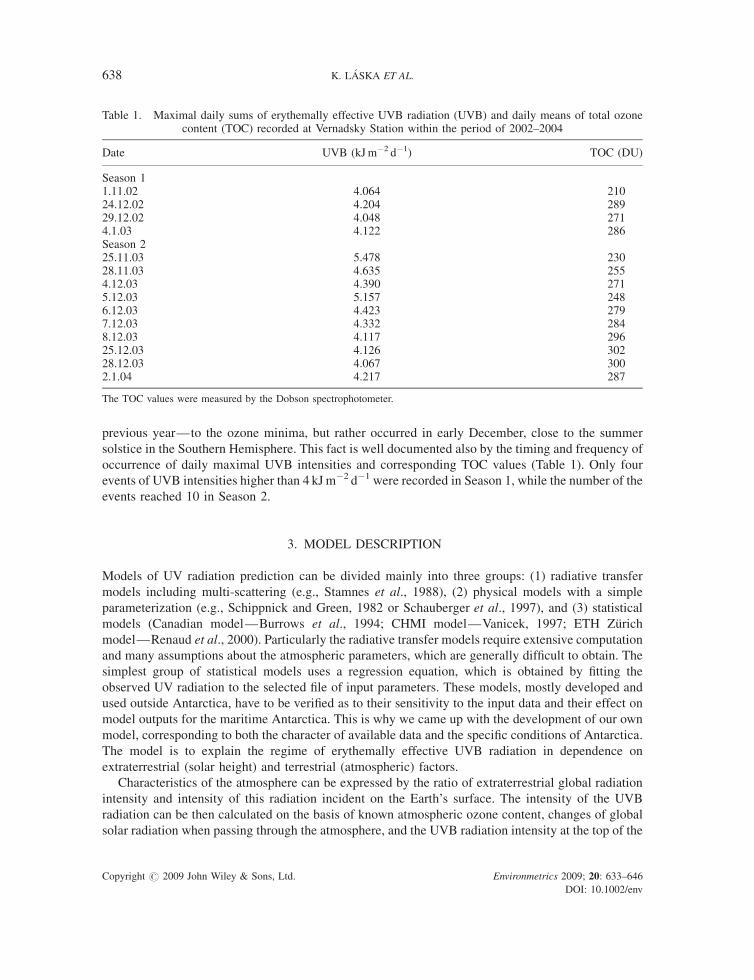
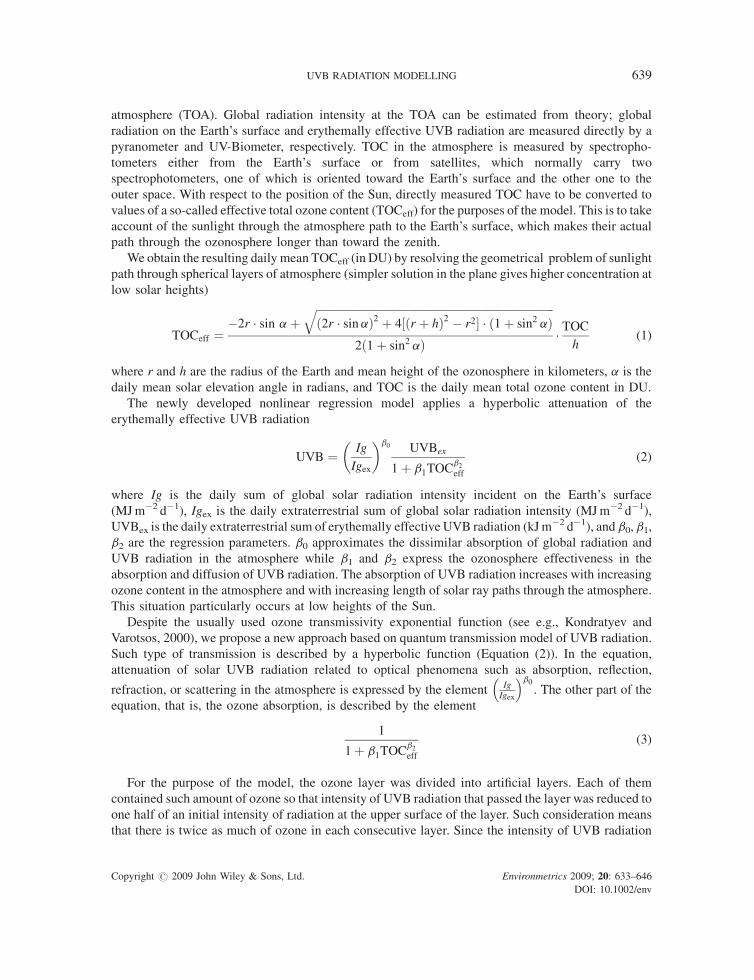
Table 1. Maximal daily sums of erythemally effective UVB radiation (UVB) and daily means of total ozonecontent (TOC) recorded at Vernadsky Station within the period of 2002–2004
Date UVB (kJ m�2 d�1) TOC (DU)
Season 11.11.02 4.064 21024.12.02 4.204 28929.12.02 4.048 2714.1.03 4.122 286Season 225.11.03 5.478 23028.11.03 4.635 2554.12.03 4.390 2715.12.03 5.157 2486.12.03 4.423 2797.12.03 4.332 2848.12.03 4.117 29625.12.03 4.126 30228.12.03 4.067 3002.1.04 4.217 287
The TOC values were measured by the Dobson spectrophotometer.
638 K. LASKA ET AL.
previous year—to the ozone minima, but rather occurred in early December, close to the summer
solstice in the Southern Hemisphere. This fact is well documented also by the timing and frequency of
occurrence of daily maximal UVB intensities and corresponding TOC values (Table 1). Only four
events of UVB intensities higher than 4 kJ m�2 d�1 were recorded in Season 1, while the number of the
events reached 10 in Season 2.
3. MODEL DESCRIPTION
Models of UV radiation prediction can be divided mainly into three groups: (1) radiative transfer
models including multi-scattering (e.g., Stamnes et al., 1988), (2) physical models with a simple
parameterization (e.g., Schippnick and Green, 1982 or Schauberger et al., 1997), and (3) statistical
models (Canadian model—Burrows et al., 1994; CHMI model—Vanicek, 1997; ETH Zurich
model—Renaud et al., 2000). Particularly the radiative transfer models require extensive computation
and many assumptions about the atmospheric parameters, which are generally difficult to obtain. The
simplest group of statistical models uses a regression equation, which is obtained by fitting the
observed UV radiation to the selected file of input parameters. These models, mostly developed and
used outside Antarctica, have to be verified as to their sensitivity to the input data and their effect on
model outputs for the maritime Antarctica. This is why we came up with the development of our own
model, corresponding to both the character of available data and the specific conditions of Antarctica.
The model is to explain the regime of erythemally effective UVB radiation in dependence on
extraterrestrial (solar height) and terrestrial (atmospheric) factors.
Characteristics of the atmosphere can be expressed by the ratio of extraterrestrial global radiation
intensity and intensity of this radiation incident on the Earth’s surface. The intensity of the UVB
radiation can be then calculated on the basis of known atmospheric ozone content, changes of global
solar radiation when passing through the atmosphere, and the UVB radiation intensity at the top of the
Copyright # 2009 John Wiley & Sons, Ltd. Environmetrics 2009; 20: 633–646
DOI: 10.1002/env
UVB RADIATION MODELLING 639
atmosphere (TOA). Global radiation intensity at the TOA can be estimated from theory; global
radiation on the Earth’s surface and erythemally effective UVB radiation are measured directly by a
pyranometer and UV-Biometer, respectively. TOC in the atmosphere is measured by spectropho-
tometers either from the Earth’s surface or from satellites, which normally carry two
spectrophotometers, one of which is oriented toward the Earth’s surface and the other one to the
outer space. With respect to the position of the Sun, directly measured TOC have to be converted to
values of a so-called effective total ozone content (TOCeff) for the purposes of the model. This is to take
account of the sunlight through the atmosphere path to the Earth’s surface, which makes their actual
path through the ozonosphere longer than toward the zenith.
We obtain the resulting daily mean TOCeff (in DU) by resolving the geometrical problem of sunlight
path through spherical layers of atmosphere (simpler solution in the plane gives higher concentration at
low solar heights)
TOCeff ¼�2r � sin aþ
ffiffiffiffiffiffiffiffiffiffiffiffiffiffiffiffiffiffiffiffiffiffiffiffiffiffiffiffiffiffiffiffiffiffiffiffiffiffiffiffiffiffiffiffiffiffiffiffiffiffiffiffiffiffiffiffiffiffiffiffiffiffiffiffiffiffiffiffiffiffiffiffiffiffiffiffiffiffiffiffiffiffiffiffiffiffið2r � sinaÞ2 þ 4½ðr þ hÞ2 � r2� � ð1 þ sin2 aÞ
q2ð1 þ sin2 aÞ
� TOC
h(1)
where r and h are the radius of the Earth and mean height of the ozonosphere in kilometers, a is the
daily mean solar elevation angle in radians, and TOC is the daily mean total ozone content in DU.
The newly developed nonlinear regression model applies a hyperbolic attenuation of the
erythemally effective UVB radiation
UVB ¼ Ig
Igex
� �b0 UVBex
1 þ b1TOCb2
eff
(2)
where Ig is the daily sum of global solar radiation intensity incident on the Earth’s surface
(MJ m�2 d�1), Igex is the daily extraterrestrial sum of global solar radiation intensity (MJ m�2 d�1),
UVBex is the daily extraterrestrial sum of erythemally effective UVB radiation (kJ m�2 d�1), and b0, b1,
b2 are the regression parameters. b0 approximates the dissimilar absorption of global radiation and
UVB radiation in the atmosphere while b1 and b2 express the ozonosphere effectiveness in the
absorption and diffusion of UVB radiation. The absorption of UVB radiation increases with increasing
ozone content in the atmosphere and with increasing length of solar ray paths through the atmosphere.
This situation particularly occurs at low heights of the Sun.
Despite the usually used ozone transmissivity exponential function (see e.g., Kondratyev and
Varotsos, 2000), we propose a new approach based on quantum transmission model of UVB radiation.
Such type of transmission is described by a hyperbolic function (Equation (2)). In the equation,
attenuation of solar UVB radiation related to optical phenomena such as absorption, reflection,
refraction, or scattering in the atmosphere is expressed by the element IgIgex
� �b0. The other part of the
equation, that is, the ozone absorption, is described by the element
1
1 þ b1TOCb2
eff
(3)
For the purpose of the model, the ozone layer was divided into artificial layers. Each of them
contained such amount of ozone so that intensity of UVB radiation that passed the layer was reduced to
one half of an initial intensity of radiation at the upper surface of the layer. Such consideration means
that there is twice as much of ozone in each consecutive layer. Since the intensity of UVB radiation
Copyright # 2009 John Wiley & Sons, Ltd. Environmetrics 2009; 20: 633–646
DOI: 10.1002/env
640 K. LASKA ET AL.
does not decrease in jumps but smoothly, this consideration does not fully reflect reality. Therefore, we
multiplied TOCeff in real atmosphere by a coefficient b1 that related to the UVB attenuation due to
ozone amount. However, there are additional processes connected with the effective diameter of ozone
molecules in the atmosphere. It is reported (Kondratyev and Varotsos, 2000) that the effective diameter
is usually higher than the geometric one which might alter absorption effectiveness of UVB. Then, the
higher TOCeff, the higher effectiveness of UVB quantum absorption by ozone molecules. That was why
we used coefficient b2 in exponential part of TOCeff.
A model used in this way does not fulfill a boundary condition. The condition is a changeless UVB
radiation intensity if there is no ozone in layer. If number 1 is added to the denominator in the element (3),
the condition is fulfilled. For real TOC in the atmosphere, addition of 1 into the denominator has only
negligible effect on UVB attenuation and the range of b1 value (see the Section 5 below).
4. MODEL RESULTS
We explored the model properties for the two analyzed seasons using both ground and satellite ozone
measurements. The b0, b1, b2 parameters of the nonlinear hyperbolic regression model were estimated
by using the STATISTICA system and Levenberg–Marquardt’s method through least squares with the
initial approximations of all three parameters equal to 0.1.
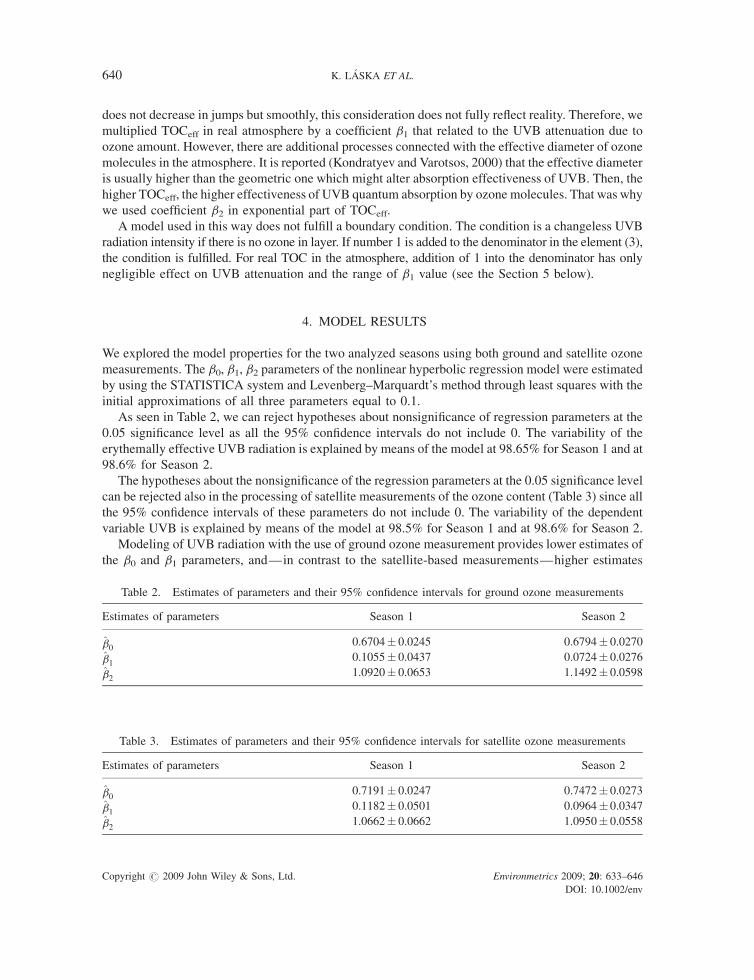
As seen in Table 2, we can reject hypotheses about nonsignificance of regression parameters at the
0.05 significance level as all the 95% confidence intervals do not include 0. The variability of the
erythemally effective UVB radiation is explained by means of the model at 98.65% for Season 1 and at
98.6% for Season 2.
The hypotheses about the nonsignificance of the regression parameters at the 0.05 significance level
can be rejected also in the processing of satellite measurements of the ozone content (Table 3) since all
the 95% confidence intervals of these parameters do not include 0. The variability of the dependent
variable UVB is explained by means of the model at 98.5% for Season 1 and at 98.6% for Season 2.
Modeling of UVB radiation with the use of ground ozone measurement provides lower estimates of
the b0 and b1 parameters, and—in contrast to the satellite-based measurements—higher estimates
Table 2. Estimates of parameters and their 95% confidence intervals for ground ozone measurements
Estimates of parameters Season 1 Season 2
b00.6704� 0.0245 0.6794� 0.0270
b10.1055� 0.0437 0.0724� 0.0276
b21.0920� 0.0653 1.1492� 0.0598
Table 3. Estimates of parameters and their 95% confidence intervals for satellite ozone measurements
Estimates of parameters Season 1 Season 2
b00.7191� 0.0247 0.7472� 0.0273
b10.1182� 0.0501 0.0964� 0.0347
b21.0662� 0.0662 1.0950� 0.0558
Copyright # 2009 John Wiley & Sons, Ltd. Environmetrics 2009; 20: 633–646
DOI: 10.1002/env
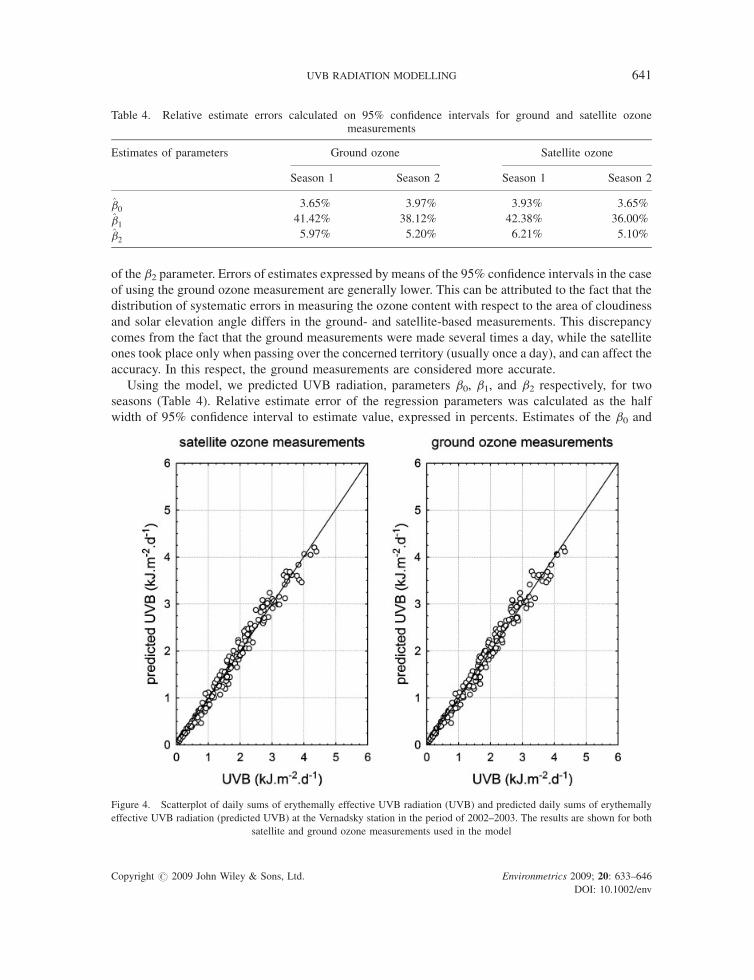
Table 4. Relative estimate errors calculated on 95% confidence intervals for ground and satellite ozonemeasurements
Estimates of parameters Ground ozone Satellite ozone
Season 1 Season 2 Season 1 Season 2
b03.65% 3.97% 3.93% 3.65%
b141.42% 38.12% 42.38% 36.00%
b25.97% 5.20% 6.21% 5.10%
UVB RADIATION MODELLING 641
of the b2 parameter. Errors of estimates expressed by means of the 95% confidence intervals in the case
of using the ground ozone measurement are generally lower. This can be attributed to the fact that the
distribution of systematic errors in measuring the ozone content with respect to the area of cloudiness
and solar elevation angle differs in the ground- and satellite-based measurements. This discrepancy
comes from the fact that the ground measurements were made several times a day, while the satellite
ones took place only when passing over the concerned territory (usually once a day), and can affect the
accuracy. In this respect, the ground measurements are considered more accurate.
Using the model, we predicted UVB radiation, parameters b0, b1, and b2 respectively, for two
seasons (Table 4). Relative estimate error of the regression parameters was calculated as the half
width of 95% confidence interval to estimate value, expressed in percents. Estimates of the b0 and
Figure 4. Scatterplot of daily sums of erythemally effective UVB radiation (UVB) and predicted daily sums of erythemally
effective UVB radiation (predicted UVB) at the Vernadsky station in the period of 2002–2003. The results are shown for both
satellite and ground ozone measurements used in the model
Copyright # 2009 John Wiley & Sons, Ltd. Environmetrics 2009; 20: 633–646
DOI: 10.1002/env
642 K. LASKA ET AL.
b2 parameters exhibited a considerable stability in both the cases and the relative estimate errors were
also very small. Differences in the estimated b1 values for Seasons 1 and 2 (see Tables 2 and 3) as well
as the large relative errors of the estimates were apparently caused by the moderate development of the
ozone anomaly over Antarctica in Season 1, while its influence in Season 2 was of much greater
significance (for details see Section 2).
5. DISCUSSION AND CONCLUSIONS
Figures 4 and 5 show the correlation between measured and predicted daily sums of erythemally
effective UVB radiation for Season 1 (2002–2003) and Season 2 (2003–2004). The results are shown
for both satellite and ground ozone measurements used in the model. The model quality for the two
considered seasons and both ozone estimation methods is comparable. High values of the indexes of
determination were reached. The mean average prediction errors ranged between 9.6 and 9.5% for
Season 1, and 7.4 and 8.8% for Season 2, when ground and satellite ozone measurements were applied.
Our results are in agreement with findings of Weihs and Webb (1997), Koepke et al. (1998), or De
Backer et al. (2001). They found differences between measurements and models in the range of 5–10%
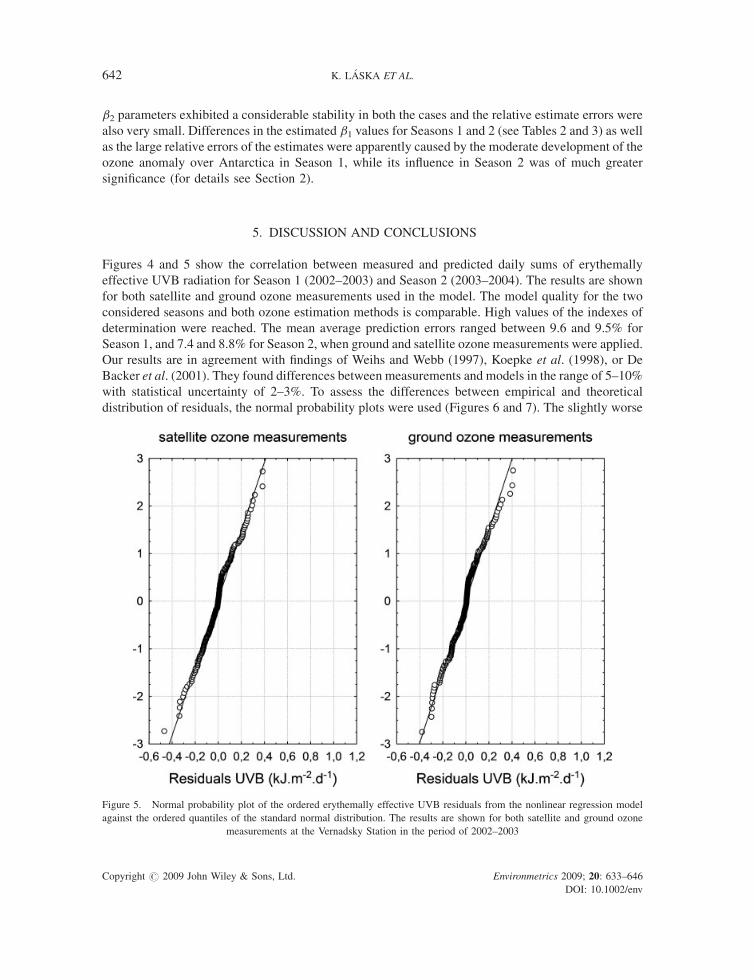
with statistical uncertainty of 2–3%. To assess the differences between empirical and theoretical
distribution of residuals, the normal probability plots were used (Figures 6 and 7). The slightly worse
Figure 5. Normal probability plot of the ordered erythemally effective UVB residuals from the nonlinear regression model
against the ordered quantiles of the standard normal distribution. The results are shown for both satellite and ground ozone
measurements at the Vernadsky Station in the period of 2002–2003
Copyright # 2009 John Wiley & Sons, Ltd. Environmetrics 2009; 20: 633–646
DOI: 10.1002/env
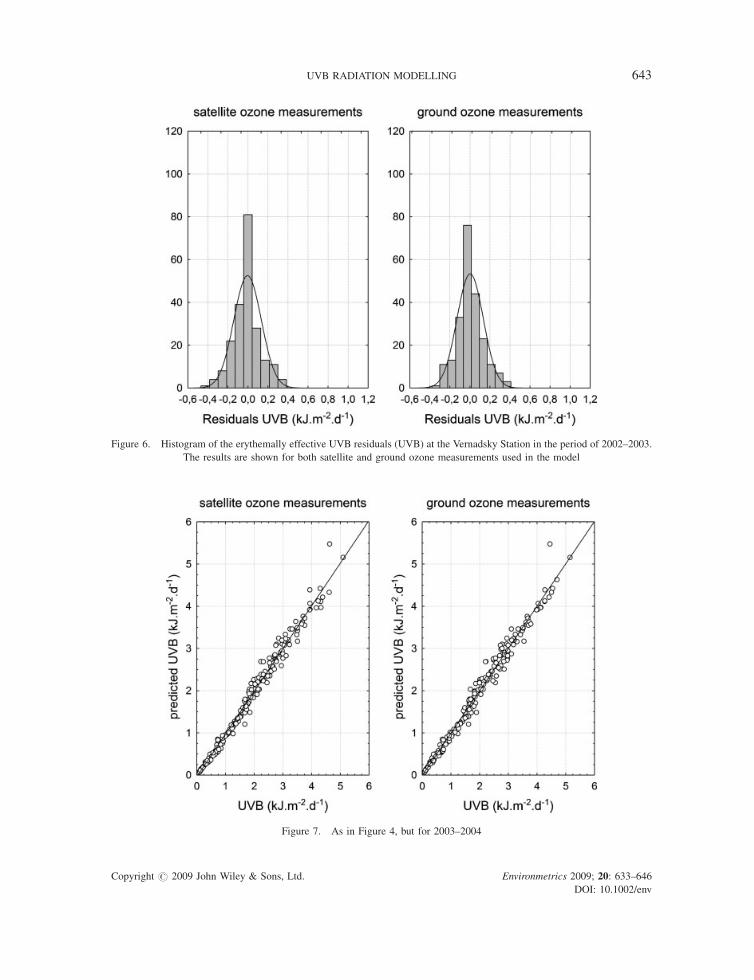
Figure 6. Histogram of the erythemally effective UVB residuals (UVB) at the Vernadsky Station in the period of 2002–2003.
The results are shown for both satellite and ground ozone measurements used in the model
Figure 7. As in Figure 4, but for 2003–2004
Copyright # 2009 John Wiley & Sons, Ltd. Environmetrics 2009; 20: 633–646
DOI: 10.1002/env
UVB RADIATION MODELLING 643
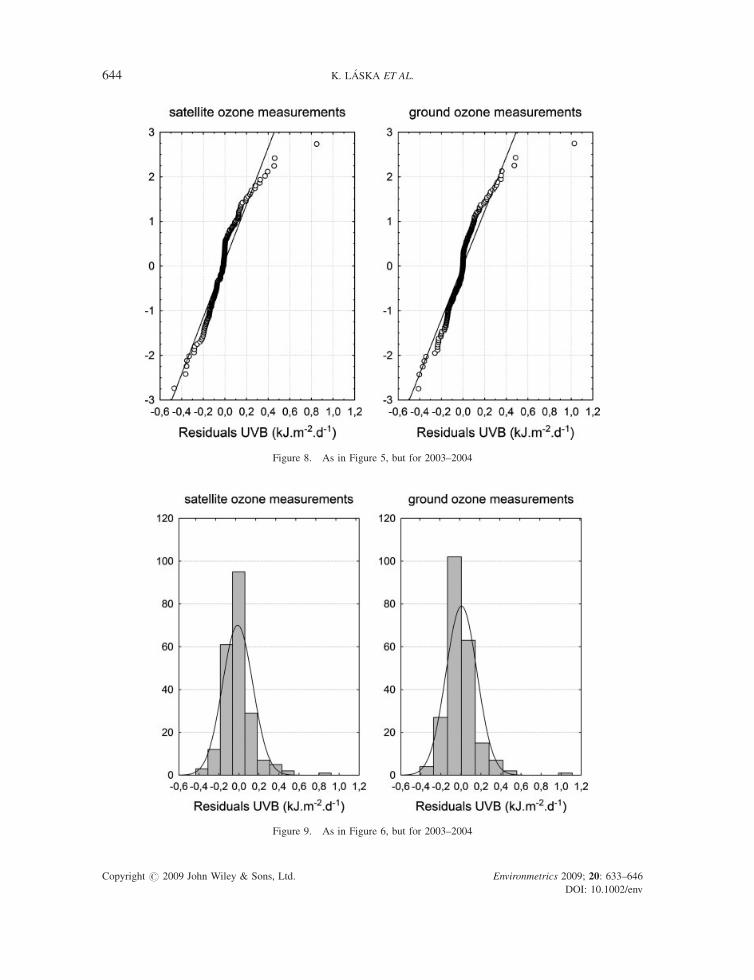
Figure 8. As in Figure 5, but for 2003–2004
Figure 9. As in Figure 6, but for 2003–2004
Copyright # 2009 John Wiley & Sons, Ltd. Environmetrics 2009; 20: 633–646
DOI: 10.1002/env
644 K. LASKA ET AL.
UVB RADIATION MODELLING 645
results for Season 2 can be partly explained also by the fact that extreme values occurred in the
measurement of UVB radiation in November and December, for example, 25 November 2003 (see
Table 1). In the case of great change of ozone content, the results may be unfavorably affected by daily
average or daily sum values used at its application. The consequence may be that the model either
underestimates or overestimates the UVB radiation value at an expressively uneven solar radiation
regime within the day period (particularly at a different radiation intensity in the noon hours as
compared with the morning and evening ones). This fact is likely to affect also the magnitude of the
errors for the parameters b1 and b2, which express general ozone content, its role in UVB absorption,
and scattering.
The quality of the regression model is also documented by the distribution of residuals, which
should be ideally near the normal distribution (Figures 8 and 9). Hence the accumulation of UVB
residuals occurs with values close to zero. Therefore, the resulting distribution has high kurtosis, which
is essentially greater than in the case of normal distribution.
A model-based prediction of erythemally effective UVB radiation toward real values could be
possibly improved through the transformation of UVB radiation values. Such modification would
achieve stabilization of the variance. Searching for an appropriate transformation will be subject to
further research. We also assume that the quality of the model can be further enhanced by using values
of the studied variables measured simultaneously with the atmospheric ozone content—both ground
and satellite. This should at least eliminate problems with the informative value of daily averages and
sums with respect to the UVB radiation absorption model and its properties.
ACKNOWLEDGEMENTS
The authors express gratitude to all employees of the National Antarctic Scientific Center of Ukrainein Kyiv and tomembers of crews wintering on the Vernadsky Station Alexander Kolesnik and Igor Gvozdovsky for the faultlessoperation of radiation instruments and regular mailing of measured data. This study was handled as a part ofresearch Grant No. 205/07/1377 The effects of atmospheric factors on the regime of UV radiation in the region ofAntarctic Peninsula funded by Grant Agency of the Czech Republic.
REFERENCES
Antarctic Ozone Bulletin. 2002. http://www.wmo.ch/pages/prog/arep/gawozobull02_en.html Accessed on 28 November 2007.Antarctic Ozone Bulletin. 2003. http://www.wmo.ch/pages/prog/arep/gawozobull03_en.html Accessed on 28 November 2007.Bodeker G. 1997. UV radiation in polar regions. In Ecosystem Processes in Antarctic Ice-Free Landscapes, Lyons WB, Howard-
Williams C, Hawes I (eds). Balkema: Rotterdam; 23–42.Burrows WR, Vallee M, Wardls DI, Kerr JB, Wilson LJ, Tarasick DW. 1994. The Canadian operational procedure for forecasting
total ozone and UV radiation. Meteorological Applications 1(3): 247–265.CIE. 1987. A reference action spectrum for ultraviolet induced erythema in human skin. In Commission Internationale de l’ E
clairage, CIE Publication No. 17.4, Vienna; 17–22.De Backer H, Koepke P, Bais A, De Cabo X, Frei T, Gillotay D, Haite Ch, Heikkila A, Kazantzidis A, Koskela T, Kyro E, Lapeta
B, Lorente J, Masson K, Mayer B, Plets H, Redondas A, Renaud A, Schauberger G, Schmalwiesser A, Schwander H, VanicekK. 2001. Comparison of measured and modelled UV indices for the assessment of health risks. Meteorological Applications8(3): 267–277.
Farman JC, Gardiner BG, Shanklin JD. 1985. Large losses of total ozone in Antarctica reveal seasonal CClOx/NOx interaction.Nature 315: 207–210.
Hermann JR, Newman PA, Larko D. 1995. Meteor-3/TOMS observations of the 1994 ozone hole. Geophysical Research Letters22(23): 3227–3229.
King JC, Turner J. 1997. Antarctic meteorology and climatology. Cambridge University Press: Cambridge.Koepke P, Bais A, Balis D, Buchwitz M, De Backer H, de Cabo X, Eckert P, Eriksen P, Gillotay D, Koskela T, Lapeta B, Litynska
Z, Lorente J, Mayer B, Renaud A, Ruggaber A, Schauberger G, Seckmeyer G, Seifert P, Schmalwieser A, Schwander H,
Copyright # 2009 John Wiley & Sons, Ltd. Environmetrics 2009; 20: 633–646
DOI: 10.1002/env
646 K. LASKA ET AL.
Vanicek K, Weber M. 1998. Comparison of models used for UV index-calculations. Photochemistry and Photobiology 67(6):657–662.
Kondratyev KY, Varotsos CA. 2000. Atmospheric Ozone Variability. Springer and Praxis Publishing: Chichester, UK.Labow GJ, McPeters RD, Bhartia PK. 2004. A comparison of TOMS & SBUV Version 8 total column ozone data with data from
ground stations. In Proccedings of the XX Quadrennial Ozone Symposium, Zerefos CS (ed.). University of Athens: Kos,Greece; 123–124.
McKinlay A, Differy BL. 1987. A reference action spectrum for ultraviolet induced erythema in human skin. In Human Exposureto Ultraviolet Radiation: Risks and Regulations, Passchler WR, Bosnajokovic BFM (eds). Elsevier: Amsterdam; 83–87.
McPeters RD, Bhartia PK, Krueger AJ, Herman JR. 1998. Earth Probe Total Ozone Mapping Spectrometer (TOMS) DataProducts User’s Guide. NASA Technical Publication 1998-206985. NASA Goddard Space Flights Center: Greenbelt, MD.
Newman PA, Kawa SR, Nash ER. 2004. On the size of the Antarctic ozone hole. Geophysical Research Letters 31: L21104. DOI:10.1029/2004GL020596
Prosek P, Janouch M. 1996. The measurement of ultraviolet radiation at the Polish Henryk Arctowski Station (South Shetlands,Antarctica) in the Summer of 1994/95. Problemy Klimatologii Polarnej 6: 139–148.
Prosek P, Laska K, Janouch M. 2001. Ultraviolet radiation intensity at the H. Arctowski Base (South Shetlands, King GeorgeIsland) during the period from December 1994–December 1996. In Ecology of the Antarctic Coastal Oasis, Prosek P, Laska K(eds). Folia Fac. Sci. Nat. Univ. Masarykianae Brunensis, Geographia 25: Brno; 35–48.
Renaud A, Staehelin J, Frohlich C, Philipona R, Heimo A. 2000. Influence of snow and clouds on erythemal UV radiation:analysis of Swiss measurements and comparison with models. Journal of Geophysical Research 105(D4): 4961–4969.
Schauberger G, Schmalwieser AW, Rubel F, Wang Y, Keck G. 1997. UV-index: Operationelle Prognose der solaren,biologischeffektiven Ultraviolett-Strahlung in Osterreich. Zeitschrift fuer Medizinische Physik 7: 153–160.
Schippnick PF, Green AES. 1982. Analytical characterisation of spectral actinic flux and spectral irradiance in the middleultraviolet. Photochemistry and Photobiology 35(1): 89–101.
Schmalwieser AW, Schauberger G, Erbertseder T, Janouch M, Coetzee JRC, Weihs P. 2007. Sensitivity of erythemally effectiveUV irradiance and daily exposure to uncertainties in measured total ozone. Photochemistry and Photobiology 83(2): 433–443.
Stamnes K, Tsay SC, Wiscombe W, Jayaweera K. 1988. Numerically stable algorithm for discrete ordinate method radiativetransfer in multiple scattering emitting layered media. Applied Optics 27(12): 2502–2509.
STATISTICA software. http://www.statsoft.com/products/analytics.htm and http://www.statsoft.com/textbook/stnonlin.htmlAccessed on 28 November 2007.
Stolarski RS, McPeters RD, Newman PA. 2005. The ozone hole of 2002 as measured by TOMS. Journal of Atmospheric Sciences62(3): 716–720.
Vanicek K. 1997. Relation between total ozone and erythemal solar radiation on clear days in Hradec Kralove. In Proceedings ofthe Workshop on Monitoring of UVB Radiation on Total Ozone. Slovak Hydrometeorological Institute: Poprad; 105–107.
Vanicek K. 2006. Differences between ground Dobson, Brewer and satellite TOMS-8, GOME-WFDOAS total ozoneobservations at Hradec Kralove, Czech. Atmospheric Chemistry and Physics 6: 5163–5171.
Weihs P, Webb AR. 1997. Accuracy of spectral UV model calculations: 2. Comparison of UV calculations with measurements.Journal of Geophysical Research 102(D1): 1551–1560.
Copyright # 2009 John Wiley & Sons, Ltd. Environmetrics 2009; 20: 633–646
DOI: 10.1002/env