Embed Size (px)
Citation preview
P
AD
ARRA
KWWCDE
1
iteturmArp
prfcganb
iap
H
1h
The Journal of Socio-Economics 45 (2013) 138– 145
Contents lists available at SciVerse ScienceDirect
The Journal of Socio-Economics
j our na l ho me pa g e: www.elsev ier .com/ locate /soceco
reference discontinuity in choice experiment: Determinants and implications
nna-Kaisa Kosenius ∗
epartment of Economics and Management, P.O. Box 27, FI-00014 University of Helsinki, Finland
a r t i c l e i n f o
rticle history:eceived 30 July 2012eceived in revised form 3 May 2013ccepted 4 May 2013
eywords:
a b s t r a c t
This analysis investigates determinants of preference discontinuity and tests whether accounting forinformation on preference discontinuity improves efficiency of willingness-to-pay estimates. Using twofollow-up questions, 10.4% of respondents are identified as potentially expressing discontinuous pref-erences. The probability to preference discontinuity increases with young age, female gender, higherincome, non-coastal residence, and having filled out the questionnaire in a hurry. The performance of
ater qualityillingness to pay
hoice experimentiscontinuous preferencesrror Component Multinomial Logit
Error Component Multinomial Logit model improves when accounting for information on preferencediscontinuity either by introducing a scale parameter in the model or by eliminating attributes perceivedless important by respondents. The Scale Model suggests equal variances of choices between respon-dent groups having continuous and discontinuous preferences. The elimination approach increases theefficiency of WTP estimates for attributes. The effect of more informed analysis on magnitudes of WTP
estimates remains small.. Introduction
The use of choice experiment (CE) method has drasticallyncreased in the elicitation of public preferences for environmen-al goods and in the estimation of welfare changes associated tonvironmental problems and policies (to be) implemented to solvehem. The hypothetical nature of the method, however, may causencertain or inconsistent expressions of the preferences due toespondents’ inexperience in making trade-off concerning environ-ental goods (see, e.g., Bennett and Blamey, 2001; Hensher, 2010).lthough advantageous and flexible, the complex and information-equiring preference elicitation method of the choice experimentoses challenges.
The core of a CE survey is a series of choice tasks. A taskresents alternative environmental goods to respondents. Envi-onmental goods, such as improvements in water quality resultingrom alternative management options, are described in terms of theharacteristics (attributes) reflecting different dimensions of theood, following Lancaster’s characteristics theory of value (Bennettnd Blamey, 2001; Lancaster, 1966). According to neoclassical eco-omic theory, the respondent maximizes her utility in a choice tasky choosing the alternative that yields the highest utility.
The underlying assumption of the utility maximizing behaviour
s that the individual makes rational choices over a given set oflternatives. One of the axioms of rationality is the continuity ofreferences (Mas-Colell et al., 1995). In the CE context, continuous∗ Present address: Pellervo Economic Research, Eerikinkatu 28 A, FI-00180elsinki, Finland. Tel.: +358 40 164 8169; fax: +358 9 3488 8500.
E-mail address: [email protected]
053-5357/$ – see front matter © 2013 Elsevier Inc. All rights reserved.ttp://dx.doi.org/10.1016/j.socec.2013.05.004
© 2013 Elsevier Inc. All rights reserved.
preference ordering means that the respondent’s choice amongalternatives in choice task bases on consideration of all charac-teristics of a good and on comparison of losses in one attributeto gains in another attribute. The standard analysis of choicedata implicitly postulates continuity of preferences. Non-standardattribute processing strategies (that is, other than accountingfor all attributes when comparing alternatives) do not receiveattention. Because real data sets contain many attribute processingstrategies, there is a growing interest on incorporating informationon attribute non-attendance in the analysis (see, e.g., Campbellet al., 2008, 2011; Hensher and Greene, 2010; Hensher et al., 2012;Meyerhoff and Liebe, 2009).
Previous research has found evidence of the deviations fromthe standard economic behaviour when processing attributes andchoosing the utility maximizing alternative. These non-standardattribute processing strategies refer to the following. A subsetof attributes have been ignored (see, e.g., Carlsson et al., 2010;DeShazo and Fermo, 2002; Hensher et al., 2005, 2007; Swait,2001) or the preference ordering has been lexicographic (e.g.,Rekola, 2003; Rulleau and Dachary-Bernard, 2012; Saelensminde,2006; Spash and Hanley, 1995). Preference discontinuity may stemfrom actual preference structure when some attributes are notbehaviourally relevant for the respondent. Another potential rea-sons are the use of a simplifying strategy to manage the cognitiveburden in a complex choice situation (e.g., Campbell et al., 2008;Hensher et al., 2005; Saelensminde, 2006) and ethical reasoning,for instance, some respondents refuse to trade money and envi-
ronmental attributes (Hess et al., 2010; Veisten et al., 2006; Rekola,2003; Spash and Hanley, 1995).Previous studies suggest that not taking into account the dif-ferences in respondents’ preference orderings may lead to a failure
Socio-
immTnma(tde
(tadvySir
aiKtarcapmshatUdm
ttoiMpdppnHeafe
astS
2
p
A.-K. Kosenius / The Journal of
n preference revelation and the associated willingness-to-pay esti-ates. Using biased welfare estimates as a guide in decision makingay end in inappropriate judgements from the society’s viewpoint.
he direction of bias, though, has been case-dependent. Ignoringon-standard attribute processing strategies, that is, other than theaximization of utility accounting for all attributes, has resulted in
n increase (Cantillo et al., 2006; Hensher et al., 2005) or a decreaseDeShazo and Fermo, 2004) in WTP estimates. Besides the magni-ude of WTP, accounting for discontinuous preferences affects theistribution of WTP (Hensher et al., 2007) and the efficiency of WTPstimates (e.g., Campbell et al., 2008).
Attribute non-attendance can be studied in the choice task levelsee Meyerhoff and Liebe, 2009) or in the serial level assuminghe same processing strategy through all tasks. Information onttribute processing strategies can be built into estimation of choiceata either parametrically by adjusting the model for unexplainedariance or by eliminating discontinuous responses from the anal-sis (Hensher et al., 2005; Hensher, 2006b; Hensher et al., 2007;aelensminde, 2006). Moreover, preference discontinuity can benferred from the data without utilizing the information stated byespondents (Hensher et al., 2012; Hess and Hensher, 2010).
This paper focuses on the stated serial non-attendance andddresses water quality improvement in the Gulf of Finland result-ng from an implementation of a nutrient reduction policy (see alsoosenius, 2010). The attributes refer to water quality characteris-
ics, such as water clarity, fish stocks, and occurrences of algae,nd a payment (price of improvement in water quality) for theespondent. Eutrophication of the Gulf of Finland involving diverseonsequences applies well for studying the effect of accounting forttribute processing strategies on monetary estimates. First, it islausible to assume that people differ in their perceptions of theost important consequences of eutrophication and only a sub-
et of attributes is of behavioural relevance to respondents. In aypothetical survey context, this can well be accounted for in thenalysis of choice behaviour. Second, gathering the WTP estimateshat are as efficient as possible is valuable for the policymaking.nbiased and efficient welfare estimates provide a good basis forecision making and judgement of policies that are worth imple-enting from a socio-economic point of view.The contribution of this paper is two-fold. Firstly, it analyses
he incidence of discontinuous preferences and examines, withhe logistic regression, the determinants of expressing discontinu-us preferences. Secondly, it estimates the WTP for water qualitymprovement in the Gulf of Finland with the Error Component
ultinomial Logit (ECM) model and provides information on therecision of the WTP estimation in the presence of preferenceiscontinuity. It tests the effect of two alternative treatments ofreference discontinuity on the estimates: (1) introducing a scalearameter in the model (see Campbell et al., 2008), and (2) elimi-ating attributes which a respondent perceived less important (seeensher et al., 2005). Finally, the paper compares the resulting WTPstimates with the estimates from the standard choice modellingpproach and discusses the implications of considering deviationsrom standard economic theory for choice modelling analysis andnvironmental decision-making.
The paper is structured as follows. Section 2 reviews empiricalpplications on discontinuous preferences and attribute processingtrategies and Section 3 presents the theoretical framework. Sec-ion 4 describes empirical data, Section 5 discusses the results, andection 6 concludes.
. Empirical applications on discontinuous preferences
Besides the standard rational utility-maximizing behaviour,eople may behave in two alternative ways when facing a
Economics 45 (2013) 138– 145 139
choice task: passive-bounded rationality and rationally adaptivebehaviour. These differ in terms of whether individuals intendto attend to all attributes or not. A passive-bounded rationalitymodel is based on assumption that individuals do attend to allattributes but levels of error (or, inconsistent choices) may appear.In a rationally adaptive model, individuals are aware of their lim-ited cognition and attend to information in the choice task suchthat they minimize the cost (or maximize the benefit) of evaluatinginformation (de Palma et al., 1994; DeShazo and Fermo, 2004).
Concerning passive-bounded rationality, inconsistent choicesrefer to the violation of the transitivity axiom of the neoclassicalconsumer theory. According to empirical evidence, choice incon-sistency may be induced by the characteristics of the choice taskand of the respondent. These include the complexity of the choicetask measured in terms of the number of choice situations, alter-natives, attributes, and attributes levels and their range (Caussadeet al., 2005; DeShazo and Fermo, 2002; Hensher, 2006a; Swait andAdamowicz, 2001), and socio-demographic characteristics, e.g.,lower education (Saelensminde, 2001, 2002).
The idea of rationally adaptive behaviour is that respondentsmay place boundaries on a choice task in order to assist in the choicemaking and to manage the cognitive burden, and thus, they expressthe seemingly lexicographic preference orderings. In addition tosimplifying behaviour owing to a difficult choice task, discontinu-ous preferences may result from real lexicographic preferences oractual non-lexicographic preferences when the ranges of attributelevels are too wide. The latter is supported by the evidence on theexistence of lexicographic choices in relatively easy choice taskshaving a small number of attributes that are a priori known by therespondent (Mazzotta and Opaluch, 1995; Saelensminde, 2006).
Many reasons for discontinuous preferences have been inves-tigated (see, e.g., Payne et al., 1992; Rosenberger et al., 2003).Saelensminde (2006) reports that less educated respondentschoose lexicographically for simplifying reasons more likely thanmore educated respondents. The same applies to those whoexpressed difficulties in concentrating. In addition, time pressureand cognitive load are found to be determinants of simplifying(Diederich, 2003; Drolet and Luce, 2004). Discontinuous prefer-ences may be caused by respondents’ unwillingness to trade moneyfor environment (i.e., ethical reasoning) or their uncertainty aboutthe meaning of a good (Spash and Hanley, 1995), and young ageand high income (Hensher et al., 2007).
When analysing the stated attribute non-attendance, the dis-continuous preference structure can be identified either byexploring answers to follow-up questions (Campbell et al., 2008;Hensher et al., 2005, 2007; Rosenberger et al., 2003; Spash andHanley, 1995) or by identifying actual choice behaviour (Lockwood,1999; McIntosh and Ryan, 2002). Once identified, one approach totreat preference discontinuity is to eliminate those observationsfrom the analysis. However, Lancsar and Louviere (2006) cautionthat eliminating responses from the data that are identified bythe researcher as being irrational may actually lead to uninten-tional removal of valid preferences. Another approach is to considerpreference discontinuity parametrically by adjusting the statisticalmodel. This can be done by specifying a decision strategy as anexplicit factor in the model (Campbell et al., 2008) or using thelatent class model to divide respondents into groups that attendto particular sets of attributes (Campbell et al., 2011). Moreover,information on attribute processing strategy can be consideredstochastically by introducing it as heterogeneity in the mean ofa random parameter (Hensher et al., 2007). These model specifi-cations show the effect of different preference structures on the
preference parameters and the associated willingness-to-pay esti-mates. Yet another way is to introduce scale parameter in the errorcomponent logit model to reveal differences in variance (that is,heterogeneity in the error term) of those who ignored a subset
1 Socio-
oeh
mwidoWt2w(eo(
3
ctcTttTe
tas
U
wp(ic
U
utnccai
nf
U
wpiatpduzr
40 A.-K. Kosenius / The Journal of
f attributes and those who attended to all attributes (Campbellt al., 2008). This reveals whether or not the choices of respondentsaving discontinuous preferences are “noisier”.
Previous studies suggest that the bias on marginal WTP esti-ates (that is, the WTP estimates for attributes) can be significanthen ignoring the differences the respondents’ preference order-
ngs. The results on the implications for the magnitude and theirection of WTP estimates are mixed. Accounting for discontinu-us preferences has resulted in both the increase in the marginalTP estimates (DeShazo and Fermo, 2004) and the decrease in
he marginal WTP estimates (Cantillo et al., 2006; Hensher et al.,005), as well as the decrease and the increase depending onhich attribute the respondent prefers on lexicographic grounds
Saelensminde, 2006). Moreover, statistically insignificant differ-nces in the WTP estimates between individuals having continuousr discontinuous preferences have been empirically evidencedRulleau and Dachary-Bernard, 2012).
. Theoretical framework and econometric specification
The choice experiment (CE) method is based on the neoclassicalonsumer theory. By assumption, an individual aims at maximiza-ion of her utility when choosing among alternative goods, in thisase alternative water quality improvements in the Gulf of Finland.he improvements are described with sea characteristics, followinghe attribute theory of value (Lancaster, 1966) according to whichhe value of the particular good is the sum of its characteristics.he presentation below follows the standard text books (Mas-Colellt al., 1995; Train, 2009).
The choice experiment is consistent with the random utilityheory. For j alternatives, individual n compares the utilities Unjssociated with alternatives. The additive utility function Unj con-ists of a deterministic part Vnj and the error term εnj:
nj = Vnj + εnj (1)
here, for individual n and alternative j, Vnj is the observableart of utility that is explained by the attributes of the goodand the respondent-specific and questionnaire-specific character-stics), and εnj is the unobserved part of utility. The individual nhooses the alternative j if:
j ≥ Uq, ∀q, j /= q (2)
That is, if the utility derived from the alternative j exceeds thetility from the alternative q. By assumptions of the consumerheory, well-behaving preferences are in accordance with the conti-uity axiom. In the CE context, continuity means that respondent’shoice is based on the trade-off between the alternatives in terms ofonsideration of all attributes. However, instead of considering allttributes fully, some respondents may be indifferent for changesn some attributes and ignore them.
This study analyses the data with the Error Components Multi-omial Logit model. In the probabilistic choice model, the utility
unction Unj for individual n of alternative j is specified as:
nj = Vnj + εnj = ˛j +∑
kˇkxjkn + εnj + �nEnj (3)
here ˛j is the alternative-specific constant (for identification pur-oses specified as one typically for the business-as-usual option), ˇk
s the coefficient for attribute k and xjkn is the value of attribute k forlternative j, and the error term εnj, which is independent of othererms in the equation. The error terms in utility functions are inde-endent and identically distributed (IID) with type I extreme value
istribution. The error term defines the stochastic proportion oftility with the error component Enj, and �n is a random term withero mean. The error component Enj refers to alternative-specificandom individual effects. In our model specification, it accounts forEconomics 45 (2013) 138– 145
substitution (correlation) patterns between the policy options. Thespecification of the error component Enj allows heteroscedasticityin its variance:
Var[Enj] = exp(�hn) (4)
where hn is the variable (individual and choice invariant) that pro-duces heterogeneity in the variances of the error components, and� is the associated scale parameter. The scale parameter measuresthe effect of preference ordering on the variance of the WTP.
In the random utility framework, the utility-maximizing choiceof the alternative j of the respondent n can only be determined upto probability. The type I extreme value distribution of the errorterm leads to the following expression of the probability to choosethe alternative j:
Pr(choice = j) =∫
exp(ˇ′jxnj) + �n(exp(�hn))Enj∑Ji
j=1exp(ˇ′jxnq) + �n(exp(�hn))Enj
(5)
For the selected water quality improvement, the expectedWTP (or consumer surplus) of individual n follows the standardHanemann (1982) utility difference expression, which assumes theconstant marginal utility of income over the population:
E(WTPn) = −1/ˇp
[ln
(∑exp(V1)
)− ln
(∑exp(V0)
)](6)
where ˇp is the parameter estimate of the cost of the policy for anindividual, V1 is the utility evaluated in the policy case, defined aschanges in attribute levels relative to the business-as-usual case,V0.
4. Data: water quality improvement in the Gulf of Finland
The 12-page mail questionnaire, investigating welfare effects ofimplementing a nutrient reduction policy, began with introductoryquestions and in-colour illustrations of the topic. The first questionsrevealed the respondent’s connections to the Gulf of Finland andperceptions of the current water quality in general and in termsof water quality attributes selected to describe an improvement.The presentation of the valuation scenario was accompanied withquestions about opinions on the likelihood of the future state of theGulf of Finland as described in the questionnaire, on the importanceof international co-operation, and on the acceptability of the tax asa payment method. Respondents also answered several attitudinalquestions about the topic, socio-demographic questions, and ques-tions related to completing the questionnaire. The questionnaire isavailable from the author by request.
The scenario was the base for a series of six discrete choice ques-tions. In choice tasks, respondents chose between three alternativewater quality states of the Gulf of Finland in the year 2030 thatresult from alternative nutrient reduction policies. The attributesselected to describe the states (Table 1) were water clarity, num-ber of coarse (not preferred) fish species (Cyprinids), health of aperennial macro algae species bladder wrack (Fucus vesiculosus)that provides an important reproduction environment for fish andinvertebrates, and abundance of mass occurrences of potentiallytoxic blue-green algae. All water quality attributes, except for theblue-green algae blooms, had three qualitatively described levels,while the price attribute had seven levels. The payment vehicle wasan additional annual tax for each Finnish household for a period of20 years to be invested in new measures to combat eutrophication.
In choice tasks (Fig. 1), the alternatives were labelled as“Agreement A,” “Agreement B,” and “No Agreement (C)”. The “No
Agreement” option referred to the business-as-usual (BAU) situa-tion described by worst levels of water quality attributes and noadditional payment (D 0). The policy options differed in terms ofecological states resulting from policy implementations and the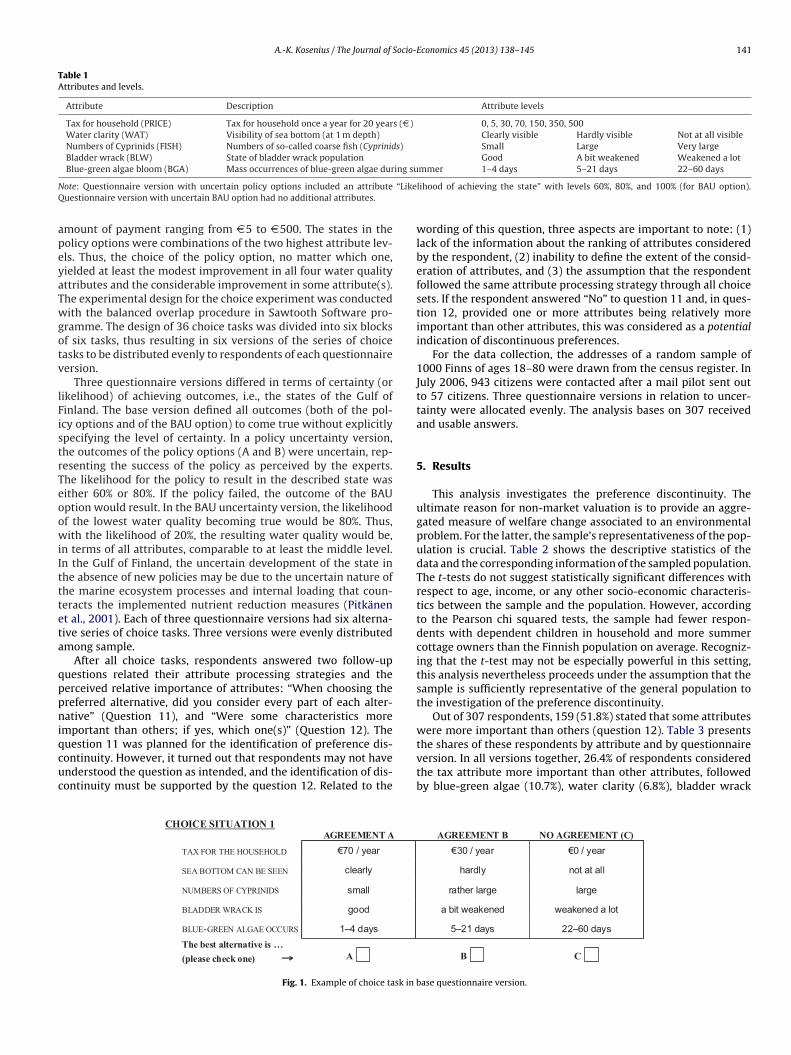
A.-K. Kosenius / The Journal of Socio-Economics 45 (2013) 138– 145 141
Table 1Attributes and levels.
Attribute Description Attribute levels
Tax for household (PRICE) Tax for household once a year for 20 years (D ) 0, 5, 30, 70, 150, 350, 500Water clarity (WAT) Visibility of sea bottom (at 1 m depth) Clearly visible Hardly visible Not at all visibleNumbers of Cyprinids (FISH) Numbers of so-called coarse fish (Cyprinids) Small Large Very largeBladder wrack (BLW) State of bladder wrack population Good A bit weakened Weakened a lotBlue-green algae bloom (BGA) Mass occurrences of blue-green algae during summer 1–4 days 5–21 days 22–60 days
N “LikeQ
apeyaTwgotv
lFistrTeoowiIttteta
qppniqcuc
ote: Questionnaire version with uncertain policy options included an attributeuestionnaire version with uncertain BAU option had no additional attributes.
mount of payment ranging from D 5 to D 500. The states in theolicy options were combinations of the two highest attribute lev-ls. Thus, the choice of the policy option, no matter which one,ielded at least the modest improvement in all four water qualityttributes and the considerable improvement in some attribute(s).he experimental design for the choice experiment was conductedith the balanced overlap procedure in Sawtooth Software pro-
ramme. The design of 36 choice tasks was divided into six blocksf six tasks, thus resulting in six versions of the series of choiceasks to be distributed evenly to respondents of each questionnaireersion.
Three questionnaire versions differed in terms of certainty (orikelihood) of achieving outcomes, i.e., the states of the Gulf ofinland. The base version defined all outcomes (both of the pol-cy options and of the BAU option) to come true without explicitlypecifying the level of certainty. In a policy uncertainty version,he outcomes of the policy options (A and B) were uncertain, rep-esenting the success of the policy as perceived by the experts.he likelihood for the policy to result in the described state wasither 60% or 80%. If the policy failed, the outcome of the BAUption would result. In the BAU uncertainty version, the likelihoodf the lowest water quality becoming true would be 80%. Thus,ith the likelihood of 20%, the resulting water quality would be,
n terms of all attributes, comparable to at least the middle level.n the Gulf of Finland, the uncertain development of the state inhe absence of new policies may be due to the uncertain nature ofhe marine ecosystem processes and internal loading that coun-eracts the implemented nutrient reduction measures (Pitkänent al., 2001). Each of three questionnaire versions had six alterna-ive series of choice tasks. Three versions were evenly distributedmong sample.
After all choice tasks, respondents answered two follow-upuestions related their attribute processing strategies and theerceived relative importance of attributes: “When choosing thereferred alternative, did you consider every part of each alter-ative” (Question 11), and “Were some characteristics more
mportant than others; if yes, which one(s)” (Question 12). The
uestion 11 was planned for the identification of preference dis-ontinuity. However, it turned out that respondents may not havenderstood the question as intended, and the identification of dis-ontinuity must be supported by the question 12. Related to theCHOICE SITUATION 1AGREEMENT A
TAX FOR THE HOUSEHOLD 70 / year
SEA BOTTOM CAN BE SEEN clearly
NUMBERS OF CYPRINIDS small
BLADDER WRACK IS good
BLUE-GREEN ALGA E OCCURS 1–4 days The best alternative is …
(please check one) A
Fig. 1. Example of choice task in b
lihood of achieving the state” with levels 60%, 80%, and 100% (for BAU option).
wording of this question, three aspects are important to note: (1)lack of the information about the ranking of attributes consideredby the respondent, (2) inability to define the extent of the consid-eration of attributes, and (3) the assumption that the respondentfollowed the same attribute processing strategy through all choicesets. If the respondent answered “No” to question 11 and, in ques-tion 12, provided one or more attributes being relatively moreimportant than other attributes, this was considered as a potentialindication of discontinuous preferences.
For the data collection, the addresses of a random sample of1000 Finns of ages 18–80 were drawn from the census register. InJuly 2006, 943 citizens were contacted after a mail pilot sent outto 57 citizens. Three questionnaire versions in relation to uncer-tainty were allocated evenly. The analysis bases on 307 receivedand usable answers.
5. Results
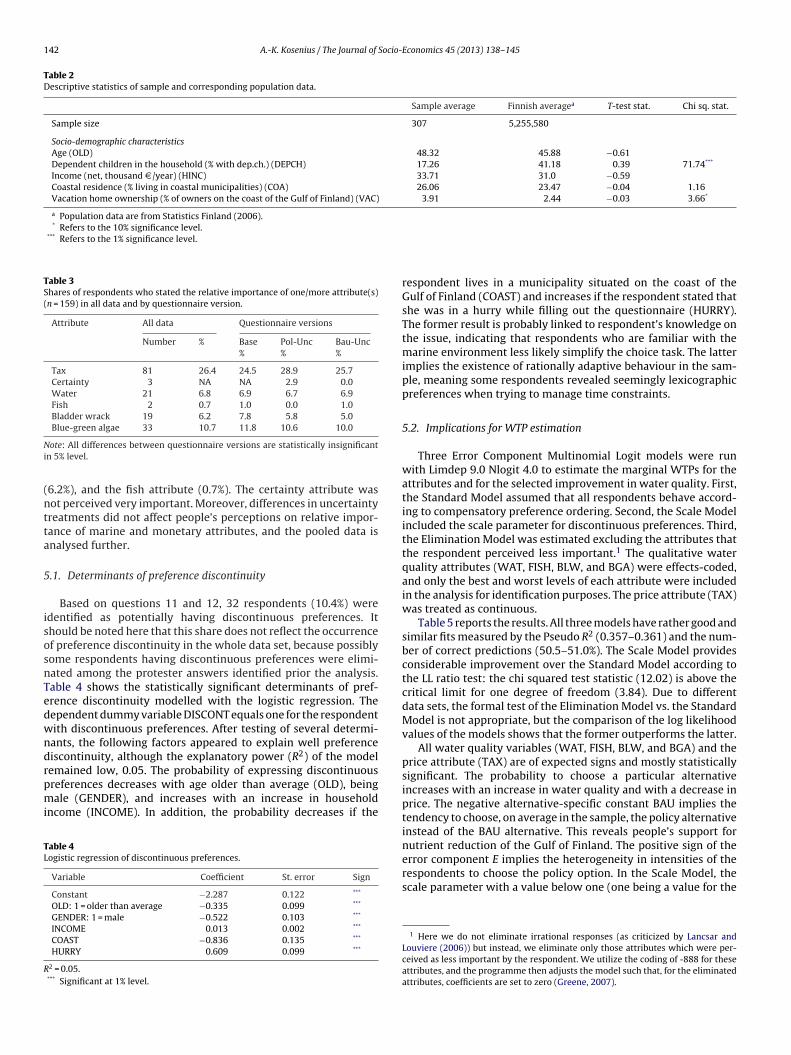
This analysis investigates the preference discontinuity. Theultimate reason for non-market valuation is to provide an aggre-gated measure of welfare change associated to an environmentalproblem. For the latter, the sample’s representativeness of the pop-ulation is crucial. Table 2 shows the descriptive statistics of thedata and the corresponding information of the sampled population.The t-tests do not suggest statistically significant differences withrespect to age, income, or any other socio-economic characteris-tics between the sample and the population. However, accordingto the Pearson chi squared tests, the sample had fewer respon-dents with dependent children in household and more summercottage owners than the Finnish population on average. Recogniz-ing that the t-test may not be especially powerful in this setting,this analysis nevertheless proceeds under the assumption that thesample is sufficiently representative of the general population tothe investigation of the preference discontinuity.
Out of 307 respondents, 159 (51.8%) stated that some attributeswere more important than others (question 12). Table 3 presents
the shares of these respondents by attribute and by questionnaireversion. In all versions together, 26.4% of respondents consideredthe tax attribute more important than other attributes, followedby blue-green algae (10.7%), water clarity (6.8%), bladder wrackAGREEMENT B NO AGREEMENT (C)
30 / year 0 / year
hardly not at all
rather large large
a bit wea kene d wea ken ed a lot
5–21 da ys 22–60 da ys
B C
ase questionnaire version.
142 A.-K. Kosenius / The Journal of Socio-Economics 45 (2013) 138– 145
Table 2Descriptive statistics of sample and corresponding population data.
Sample average Finnish averagea T-test stat. Chi sq. stat.
Sample size 307 5,255,580
Socio-demographic characteristicsAge (OLD) 48.32 45.88 −0.61Dependent children in the household (% with dep.ch.) (DEPCH) 17.26 41.18 0.39 71.74***
Income (net, thousand D /year) (HINC) 33.71 31.0 −0.59Coastal residence (% living in coastal municipalities) (COA) 26.06 23.47 −0.04 1.16Vacation home ownership (% of owners on the coast of the Gulf of Finland) (VAC) 3.91 2.44 −0.03 3.66*
a Population data are from Statistics Finland (2006).* Refers to the 10% significance level.
*** Refers to the 1% significance level.
Table 3Shares of respondents who stated the relative importance of one/more attribute(s)(n = 159) in all data and by questionnaire version.
Attribute All data Questionnaire versions
Number % Base Pol-Unc Bau-Unc% % %
Tax 81 26.4 24.5 28.9 25.7Certainty 3 NA NA 2.9 0.0Water 21 6.8 6.9 6.7 6.9Fish 2 0.7 1.0 0.0 1.0Bladder wrack 19 6.2 7.8 5.8 5.0Blue-green algae 33 10.7 11.8 10.6 10.0
Ni
(ntta
5
isosnTedwndrpmi
TL
R
ote: All differences between questionnaire versions are statistically insignificantn 5% level.
6.2%), and the fish attribute (0.7%). The certainty attribute wasot perceived very important. Moreover, differences in uncertaintyreatments did not affect people’s perceptions on relative impor-ance of marine and monetary attributes, and the pooled data isnalysed further.
.1. Determinants of preference discontinuity
Based on questions 11 and 12, 32 respondents (10.4%) weredentified as potentially having discontinuous preferences. Ithould be noted here that this share does not reflect the occurrencef preference discontinuity in the whole data set, because possiblyome respondents having discontinuous preferences were elimi-ated among the protester answers identified prior the analysis.able 4 shows the statistically significant determinants of pref-rence discontinuity modelled with the logistic regression. Theependent dummy variable DISCONT equals one for the respondentith discontinuous preferences. After testing of several determi-ants, the following factors appeared to explain well preferenceiscontinuity, although the explanatory power (R2) of the modelemained low, 0.05. The probability of expressing discontinuous
references decreases with age older than average (OLD), beingale (GENDER), and increases with an increase in householdncome (INCOME). In addition, the probability decreases if the
able 4ogistic regression of discontinuous preferences.
Variable Coefficient St. error Sign
Constant −2.287 0.122 ***
OLD: 1 = older than average −0.335 0.099 ***
GENDER: 1 = male −0.522 0.103 ***
INCOME 0.013 0.002 ***
COAST −0.836 0.135 ***
HURRY 0.609 0.099 ***
2 = 0.05.*** Significant at 1% level.
respondent lives in a municipality situated on the coast of theGulf of Finland (COAST) and increases if the respondent stated thatshe was in a hurry while filling out the questionnaire (HURRY).The former result is probably linked to respondent’s knowledge onthe issue, indicating that respondents who are familiar with themarine environment less likely simplify the choice task. The latterimplies the existence of rationally adaptive behaviour in the sam-ple, meaning some respondents revealed seemingly lexicographicpreferences when trying to manage time constraints.
5.2. Implications for WTP estimation
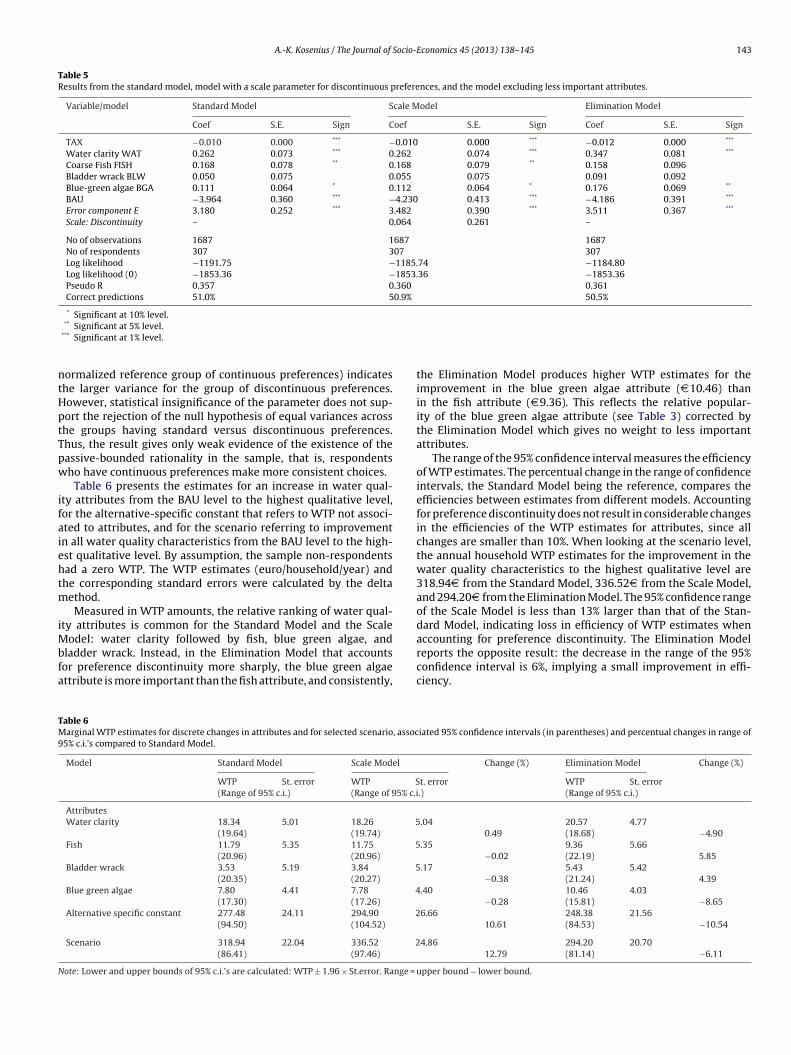
Three Error Component Multinomial Logit models were runwith Limdep 9.0 Nlogit 4.0 to estimate the marginal WTPs for theattributes and for the selected improvement in water quality. First,the Standard Model assumed that all respondents behave accord-ing to compensatory preference ordering. Second, the Scale Modelincluded the scale parameter for discontinuous preferences. Third,the Elimination Model was estimated excluding the attributes thatthe respondent perceived less important.1 The qualitative waterquality attributes (WAT, FISH, BLW, and BGA) were effects-coded,and only the best and worst levels of each attribute were includedin the analysis for identification purposes. The price attribute (TAX)was treated as continuous.
Table 5 reports the results. All three models have rather good andsimilar fits measured by the Pseudo R2 (0.357–0.361) and the num-ber of correct predictions (50.5–51.0%). The Scale Model providesconsiderable improvement over the Standard Model according tothe LL ratio test: the chi squared test statistic (12.02) is above thecritical limit for one degree of freedom (3.84). Due to differentdata sets, the formal test of the Elimination Model vs. the StandardModel is not appropriate, but the comparison of the log likelihoodvalues of the models shows that the former outperforms the latter.
All water quality variables (WAT, FISH, BLW, and BGA) and theprice attribute (TAX) are of expected signs and mostly statisticallysignificant. The probability to choose a particular alternativeincreases with an increase in water quality and with a decrease inprice. The negative alternative-specific constant BAU implies thetendency to choose, on average in the sample, the policy alternativeinstead of the BAU alternative. This reveals people’s support for
nutrient reduction of the Gulf of Finland. The positive sign of theerror component E implies the heterogeneity in intensities of therespondents to choose the policy option. In the Scale Model, thescale parameter with a value below one (one being a value for the1 Here we do not eliminate irrational responses (as criticized by Lancsar andLouviere (2006)) but instead, we eliminate only those attributes which were per-ceived as less important by the respondent. We utilize the coding of -888 for theseattributes, and the programme then adjusts the model such that, for the eliminatedattributes, coefficients are set to zero (Greene, 2007).
A.-K. Kosenius / The Journal of Socio-Economics 45 (2013) 138– 145 143
Table 5Results from the standard model, model with a scale parameter for discontinuous preferences, and the model excluding less important attributes.
Variable/model Standard Model Scale Model Elimination Model
Coef S.E. Sign Coef S.E. Sign Coef S.E. Sign
TAX −0.010 0.000 *** −0.010 0.000 *** −0.012 0.000 ***
Water clarity WAT 0.262 0.073 *** 0.262 0.074 *** 0.347 0.081 ***
Coarse Fish FISH 0.168 0.078 ** 0.168 0.079 ** 0.158 0.096Bladder wrack BLW 0.050 0.075 0.055 0.075 0.091 0.092Blue-green algae BGA 0.111 0.064 * 0.112 0.064 * 0.176 0.069 **
BAU −3.964 0.360 *** −4.230 0.413 *** −4.186 0.391 ***
Error component E 3.180 0.252 *** 3.482 0.390 *** 3.511 0.367 ***
Scale: Discontinuity – 0.064 0.261 –
No of observations 1687 1687 1687No of respondents 307 307 307Log likelihood −1191.75 −1185.74 −1184.80Log likelihood (0) −1853.36 −1853.36 −1853.36Pseudo R 0.357 0.360 0.361Correct predictions 51.0% 50.9% 50.5%
* Significant at 10% level.
ntHptTpw
ifaiehtm
iMbfa
TM9
N
** Significant at 5% level.*** Significant at 1% level.
ormalized reference group of continuous preferences) indicateshe larger variance for the group of discontinuous preferences.owever, statistical insignificance of the parameter does not sup-ort the rejection of the null hypothesis of equal variances acrosshe groups having standard versus discontinuous preferences.hus, the result gives only weak evidence of the existence of theassive-bounded rationality in the sample, that is, respondentsho have continuous preferences make more consistent choices.
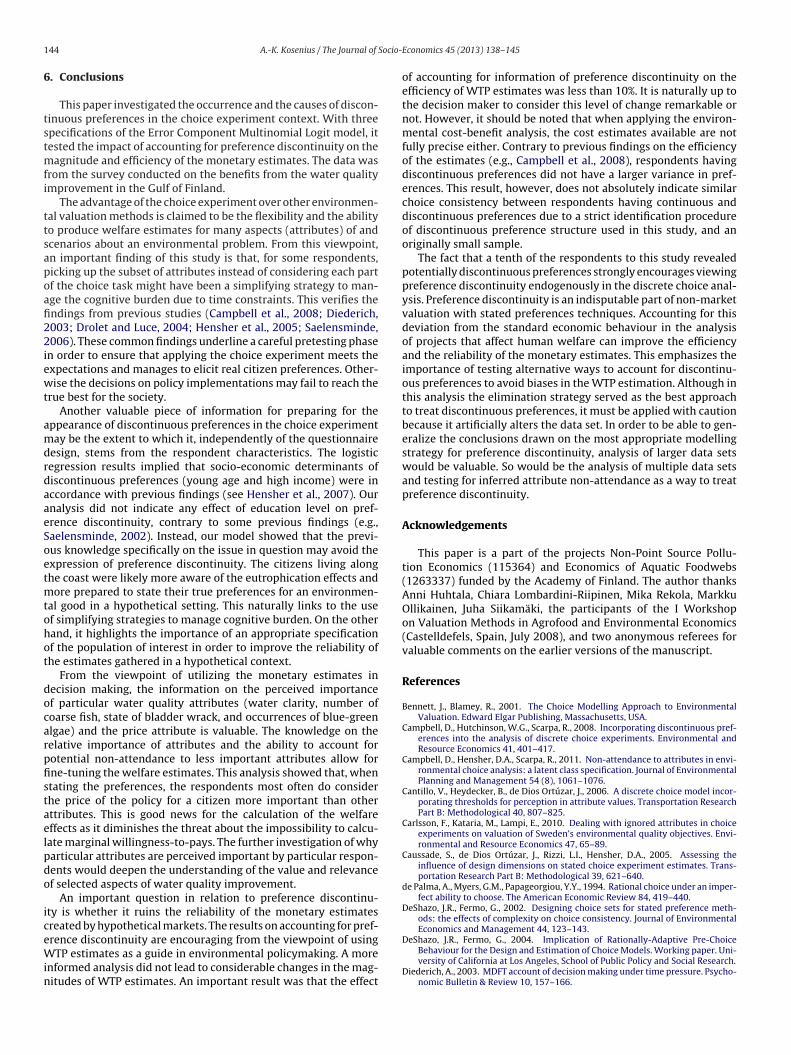
Table 6 presents the estimates for an increase in water qual-ty attributes from the BAU level to the highest qualitative level,or the alternative-specific constant that refers to WTP not associ-ted to attributes, and for the scenario referring to improvementn all water quality characteristics from the BAU level to the high-st qualitative level. By assumption, the sample non-respondentsad a zero WTP. The WTP estimates (euro/household/year) andhe corresponding standard errors were calculated by the delta
ethod.Measured in WTP amounts, the relative ranking of water qual-
ty attributes is common for the Standard Model and the Scale
odel: water clarity followed by fish, blue green algae, andladder wrack. Instead, in the Elimination Model that accountsor preference discontinuity more sharply, the blue green algaettribute is more important than the fish attribute, and consistently,
able 6arginal WTP estimates for discrete changes in attributes and for selected scenario, assoc
5% c.i.’s compared to Standard Model.
Model Standard Model Scale Model
WTP St. error WTP S(Range of 95% c.i.) (Range of 95% c.i
AttributesWater clarity 18.34 5.01 18.26 5
(19.64) (19.74)
Fish 11.79 5.35 11.75 5(20.96) (20.96)
Bladder wrack 3.53 5.19 3.84 5(20.35) (20.27)
Blue green algae 7.80 4.41 7.78 4(17.30) (17.26)
Alternative specific constant 277.48 24.11 294.90 2(94.50) (104.52)
Scenario 318.94 22.04 336.52 2(86.41) (97.46)
ote: Lower and upper bounds of 95% c.i.’s are calculated: WTP ± 1.96 × St.error. Range =
the Elimination Model produces higher WTP estimates for theimprovement in the blue green algae attribute (D 10.46) thanin the fish attribute (D 9.36). This reflects the relative popular-ity of the blue green algae attribute (see Table 3) corrected bythe Elimination Model which gives no weight to less importantattributes.
The range of the 95% confidence interval measures the efficiencyof WTP estimates. The percentual change in the range of confidenceintervals, the Standard Model being the reference, compares theefficiencies between estimates from different models. Accountingfor preference discontinuity does not result in considerable changesin the efficiencies of the WTP estimates for attributes, since allchanges are smaller than 10%. When looking at the scenario level,the annual household WTP estimates for the improvement in thewater quality characteristics to the highest qualitative level are318.94D from the Standard Model, 336.52D from the Scale Model,and 294.20D from the Elimination Model. The 95% confidence rangeof the Scale Model is less than 13% larger than that of the Stan-dard Model, indicating loss in efficiency of WTP estimates when
accounting for preference discontinuity. The Elimination Modelreports the opposite result: the decrease in the range of the 95%confidence interval is 6%, implying a small improvement in effi-ciency.iated 95% confidence intervals (in parentheses) and percentual changes in range of
Change (%) Elimination Model Change (%)
t. error WTP St. error.) (Range of 95% c.i.)
.04 20.57 4.770.49 (18.68) −4.90
.35 9.36 5.66−0.02 (22.19) 5.85
.17 5.43 5.42−0.38 (21.24) 4.39
.40 10.46 4.03−0.28 (15.81) −8.65
6.66 248.38 21.5610.61 (84.53) −10.54
4.86 294.20 20.7012.79 (81.14) −6.11
upper bound − lower bound.
1 Socio-
6
tstmfi
ttsapoafi22iewt
amdrdaaeSoetmtohot
docarpfistaelpdo
iceWin
44 A.-K. Kosenius / The Journal of
. Conclusions
This paper investigated the occurrence and the causes of discon-inuous preferences in the choice experiment context. With threepecifications of the Error Component Multinomial Logit model, itested the impact of accounting for preference discontinuity on the
agnitude and efficiency of the monetary estimates. The data wasrom the survey conducted on the benefits from the water qualitymprovement in the Gulf of Finland.
The advantage of the choice experiment over other environmen-al valuation methods is claimed to be the flexibility and the abilityo produce welfare estimates for many aspects (attributes) of andcenarios about an environmental problem. From this viewpoint,n important finding of this study is that, for some respondents,icking up the subset of attributes instead of considering each partf the choice task might have been a simplifying strategy to man-ge the cognitive burden due to time constraints. This verifies thendings from previous studies (Campbell et al., 2008; Diederich,003; Drolet and Luce, 2004; Hensher et al., 2005; Saelensminde,006). These common findings underline a careful pretesting phase
n order to ensure that applying the choice experiment meets thexpectations and manages to elicit real citizen preferences. Other-ise the decisions on policy implementations may fail to reach the
rue best for the society.Another valuable piece of information for preparing for the
ppearance of discontinuous preferences in the choice experimentay be the extent to which it, independently of the questionnaire
esign, stems from the respondent characteristics. The logisticegression results implied that socio-economic determinants ofiscontinuous preferences (young age and high income) were inccordance with previous findings (see Hensher et al., 2007). Ournalysis did not indicate any effect of education level on pref-rence discontinuity, contrary to some previous findings (e.g.,aelensminde, 2002). Instead, our model showed that the previ-us knowledge specifically on the issue in question may avoid thexpression of preference discontinuity. The citizens living alonghe coast were likely more aware of the eutrophication effects and
ore prepared to state their true preferences for an environmen-al good in a hypothetical setting. This naturally links to the usef simplifying strategies to manage cognitive burden. On the otherand, it highlights the importance of an appropriate specificationf the population of interest in order to improve the reliability ofhe estimates gathered in a hypothetical context.
From the viewpoint of utilizing the monetary estimates inecision making, the information on the perceived importancef particular water quality attributes (water clarity, number ofoarse fish, state of bladder wrack, and occurrences of blue-greenlgae) and the price attribute is valuable. The knowledge on theelative importance of attributes and the ability to account forotential non-attendance to less important attributes allow forne-tuning the welfare estimates. This analysis showed that, whentating the preferences, the respondents most often do considerhe price of the policy for a citizen more important than otherttributes. This is good news for the calculation of the welfareffects as it diminishes the threat about the impossibility to calcu-ate marginal willingness-to-pays. The further investigation of whyarticular attributes are perceived important by particular respon-ents would deepen the understanding of the value and relevancef selected aspects of water quality improvement.
An important question in relation to preference discontinu-ty is whether it ruins the reliability of the monetary estimatesreated by hypothetical markets. The results on accounting for pref-
rence discontinuity are encouraging from the viewpoint of usingTP estimates as a guide in environmental policymaking. A morenformed analysis did not lead to considerable changes in the mag-itudes of WTP estimates. An important result was that the effect
Economics 45 (2013) 138– 145
of accounting for information of preference discontinuity on theefficiency of WTP estimates was less than 10%. It is naturally up tothe decision maker to consider this level of change remarkable ornot. However, it should be noted that when applying the environ-mental cost-benefit analysis, the cost estimates available are notfully precise either. Contrary to previous findings on the efficiencyof the estimates (e.g., Campbell et al., 2008), respondents havingdiscontinuous preferences did not have a larger variance in pref-erences. This result, however, does not absolutely indicate similarchoice consistency between respondents having continuous anddiscontinuous preferences due to a strict identification procedureof discontinuous preference structure used in this study, and anoriginally small sample.
The fact that a tenth of the respondents to this study revealedpotentially discontinuous preferences strongly encourages viewingpreference discontinuity endogenously in the discrete choice anal-ysis. Preference discontinuity is an indisputable part of non-marketvaluation with stated preferences techniques. Accounting for thisdeviation from the standard economic behaviour in the analysisof projects that affect human welfare can improve the efficiencyand the reliability of the monetary estimates. This emphasizes theimportance of testing alternative ways to account for discontinu-ous preferences to avoid biases in the WTP estimation. Although inthis analysis the elimination strategy served as the best approachto treat discontinuous preferences, it must be applied with cautionbecause it artificially alters the data set. In order to be able to gen-eralize the conclusions drawn on the most appropriate modellingstrategy for preference discontinuity, analysis of larger data setswould be valuable. So would be the analysis of multiple data setsand testing for inferred attribute non-attendance as a way to treatpreference discontinuity.
Acknowledgements
This paper is a part of the projects Non-Point Source Pollu-tion Economics (115364) and Economics of Aquatic Foodwebs(1263337) funded by the Academy of Finland. The author thanksAnni Huhtala, Chiara Lombardini-Riipinen, Mika Rekola, MarkkuOllikainen, Juha Siikamäki, the participants of the I Workshopon Valuation Methods in Agrofood and Environmental Economics(Castelldefels, Spain, July 2008), and two anonymous referees forvaluable comments on the earlier versions of the manuscript.
References
Bennett, J., Blamey, R., 2001. The Choice Modelling Approach to EnvironmentalValuation. Edward Elgar Publishing, Massachusetts, USA.
Campbell, D., Hutchinson, W.G., Scarpa, R., 2008. Incorporating discontinuous pref-erences into the analysis of discrete choice experiments. Environmental andResource Economics 41, 401–417.
Campbell, D., Hensher, D.A., Scarpa, R., 2011. Non-attendance to attributes in envi-ronmental choice analysis: a latent class specification. Journal of EnvironmentalPlanning and Management 54 (8), 1061–1076.
Cantillo, V., Heydecker, B., de Dios Ortúzar, J., 2006. A discrete choice model incor-porating thresholds for perception in attribute values. Transportation ResearchPart B: Methodological 40, 807–825.
Carlsson, F., Kataria, M., Lampi, E., 2010. Dealing with ignored attributes in choiceexperiments on valuation of Sweden’s environmental quality objectives. Envi-ronmental and Resource Economics 47, 65–89.
Caussade, S., de Dios Ortúzar, J., Rizzi, L.I., Hensher, D.A., 2005. Assessing theinfluence of design dimensions on stated choice experiment estimates. Trans-portation Research Part B: Methodological 39, 621–640.
de Palma, A., Myers, G.M., Papageorgiou, Y.Y., 1994. Rational choice under an imper-fect ability to choose. The American Economic Review 84, 419–440.
DeShazo, J.R., Fermo, G., 2002. Designing choice sets for stated preference meth-ods: the effects of complexity on choice consistency. Journal of EnvironmentalEconomics and Management 44, 123–143.
DeShazo, J.R., Fermo, G., 2004. Implication of Rationally-Adaptive Pre-ChoiceBehaviour for the Design and Estimation of Choice Models. Working paper. Uni-versity of California at Los Angeles, School of Public Policy and Social Research.
Diederich, A., 2003. MDFT account of decision making under time pressure. Psycho-nomic Bulletin & Review 10, 157–166.
Socio-
D
G
H
H
H
H
H
H
H
H
H
H
K
L
L
L
A.-K. Kosenius / The Journal of
rolet, A., Luce, M.F., 2004. The rationalizing effects of cognitive load on emotion-based trade-off avoidance. Journal of Consumer Research 31, 63–77.
reene, W.H., 2007. Nlogit Version 4.0 Reference Guide. Econometric Software, Inc.,New York, USA.
anemann, W.M., 1982. Applied Welfare Analysis with Qualitative ResponseModels, Working Paper 241. Giannini Foundation of Agricultural Economics,University of California, Berkeley.
ensher, D.A., 2006a. Revealing differences in willingness to pay due to the dimen-sionality of stated choice designs: an initial assessment. Environmental andResource Economics 34, 7–44.
ensher, D.A., 2006b. Attribute processing in choice experiments and implicationson willingness to pay. In: Kanninen, B. (Ed.), Valuing Environmental AmenitiesUsing Stated Choice Studies. Springer, Arlington, Virginia, USA, pp. 135–157.
ensher, D.A., 2010. Hypothetical bias, choice experiments, and willingness to pay.Transportation Research Part B 44, 735–752.
ensher, D.A., Greene, W.H., 2010. Non-attendance and dual processing of common-metric attributes in choice analysis: a latent class specification. EmpiricalEconomics 39, 413–426.
ensher, D.A., Rose, J.M., Bertoia, T., 2007. The implications on willingness to payof a stochastic treatment of attribute processing in stated choice studies. Trans-portation Research Part E 43, 73–89.
ensher, D.A., Rose, J.M., Greene, W.H., 2005. The implications on willingness topay of respondents ignoring specific attributes. Transport Research Part E 32,203–222.
ensher, D.A., Rose, J.M., Greene, W.H., 2012. Inferring attribute non-attendancefrom stated choice data: implications for willingness to pay estimatesand a warning for stated choice experiment design. Transportation 39,235–245.
ess, S., Hensher, D., 2010. Using conditioning on observed choices to retrieveindividual-specific attribute processing strategies. Transportation Research PartB 44, 781–790.
ess, S., Rose, J.M., Polak, J., 2010. Non-trading, lexicographic and inconsistentbehavior in stated choice data. Transportation Research Part D 15, 405–417.
osenius, A., 2010. Heterogeneous preferences for water quality attributes: the Caseof eutrophication in the Gulf of Finland, the Baltic Sea. Ecological Economics 69,528–538.
ancaster, K.J., 1966. A new approach to consumer theory. Journal of Political Econ-omy 74, 132–157.
ancsar, E., Louviere, J.J., 2006. Deleting ‘irrational’ responses from discrete choiceexperiments: a case of investigating or imposing preferences? Health Economics15, 797–811.
ockwood, M., 1999. Preference structures, property rights, and paired comparisons.Environmental and Resource Economics 13, 107–122.
Economics 45 (2013) 138– 145 145
Mas-Colell, A., Whinston, M.D., Green, J.R., 1995. Microeconomic Theory. OxfordUniversity Press, USA.
Mazzotta, M.J., Opaluch, J.J., 1995. Decision making when choices are complex: atest of Heiner’s hypothesis. Land Economics 71, 500–515.
McIntosh, E., Ryan, M., 2002. Using discrete choice experiments to derive welfareestimates for the provision of elective surgery: implications of discontinuouspreferences. Journal of Economics and Psychology 23, 367–382.
Meyerhoff, J., Liebe, U., 2009. Discontinous preferences in choice experiments: evi-dence at the choice task level. In: EAERE 17th Annual Conference, 24–27 June2009, p. Amsterdam.
Payne, J.W., Bettman, J.R., Coupey, E., Johnson, E.J., 1992. A constructive process viewof decision making: multiple strategies in judgment and choice. Acta Psycholog-ica 80, 107–141.
Pitkänen, H., Lehtoranta, J., Räike, A., 2001. Internal fluxes counteract decreases inexternal load: the case of the Esturial Eastern Gulf of Finland, Baltic Sea. Ambio30, 195–201.
Rekola, M., 2003. Lexicographic preferences in contingent valuation: a theoreticalframework with illustrations. Land Economics 79, 277–291.
Rosenberger, R.S., Peterson, G.L., Clarke, A., Brown, T.C., 2003. Measuring dis-positions for lexicographic preferences of environmental goods: integratingeconomics, psychology and ethics. Ecological Economics 44, 63–76.
Rulleau, B., Dachary-Bernard, J., 2012. Preferences, rational choices and eco-nomic valuation: some empirical tests. Journal of Socio-Economics 41,198–206.
Saelensminde, K., 2001. Inconsistent choices in stated choice data: use of thelogit scaling approach to handle resulting variance increases. Transportation28, 269–296.
Saelensminde, K., 2002. The impact of choice inconsistencies in stated choice stud-ies. Environmental and Resource Economics 23, 403–420.
Saelensminde, K., 2006. Causes and consequences of lexicographic choices in statedchoice studies. Ecological Economics 59, 331–340.
Spash, C., Hanley, N., 1995. Preferences, information and biodiversity preservation.Ecological Economics 12, 191–208.
Swait, J., 2001. A non-compensatory choice model incorporating attribute cutoffs.Transportation Research Part B 35, 903–928.
Swait, J., Adamowicz, W., 2001. The influence of task complexity on consumerchoice: a Latent Class Model of decision strategy switching. Journal of ConsumerResearch 28, 135–148.
Train, K.E., 2009. Discrete Choice Methods with Simulation, 2nd ed. CambridgeUniversity Press, Cambridge.
Veisten, K., Navrud, S., Valen, J., 2006. Lexicographic preference in biodiversity val-uation: tests of inconsistencies and willingness to pay. Journal of EnvironmentalPlanning and Management 49, 167–180.