Embed Size (px)
Citation preview
Northwest and Alaska Fisheries Centers
National Marine Fisheries Service
U.S. DEPARTMENT OF COMMERCE
NWAFC PROCESSED REPORT 89-12
Preliminary Report on Genetic Diversity of Southern Southeast Alaska Chum Salmon Populations
July 1989
This report does not constitute a publication and is for information only. All data herein are to be considered provisional.
ERRATA NOTICE This document is being made available in .PDF format for the convenience of users; however, the accuracy and correctness of the document can only be certified as was presented in the original hard copy format. Inaccuracies in the OCR scanning process may influence text searches of the .PDF file. Light or faded ink in the original document may also affect the quality of the scanned document.
(
(
(
(
(
(
(
<.:
(
l
PRELIMINARY REPORT ON GENETIC DIVERSITY OF SOUTHERN
SOUTHEAST ALASKA CHUM SALMON POPULATIONS
by
C. M. Kondzela, C. M. Guthrie III, R. B. Wilson,
H. R. Carlson, and A. J. Gharrett
Auke Bay Laboratory
Alaska Fisheries Science Center
National Marine Fisheries Service
National Oceanic and Atmospheric Administration
P.O. Box 210155, Auke Bay, Alaska 99821
July 1989
iii
ABSTRACT
Using protein electrophoresis, genetic data were
obtained from adult chum salmon (Oncorhynchus keta) collected
in 1986 and 1987 from 32 streams in central and southern
Southeast Alaska. Genetic relationships among collections were
evaluated by three methods: principal component analysis,
maximum-likelihood evolutionary trees, and unweighted pair
group arithmetic average clustering of Rogers' and Nei's
genetic distances. All three clustering analyses showed that
chum salmon collected from Prince of Wales Island were distinct
from fish collected in streams emptying into inside waters
which include Portland Canal, Behm Canal, and Revillagigedo
Island. Log-likelihood ratios indicated that far more
heterogeneity existed between regions than within regions.
Comparison of data from this study to results from a previous
study of British Columbia chum salmon populations showed
significant genetic differences between some chum salmon
populations from northern British Columbia and Southeast
Alaska. Our results indicate that genetic data will be useful
for stock separation problems near the U.S.-Canada border.
It is recommended that development of a genetic baseline in
Southeast Alaska be continued and that the baseline in northern
British Columbia be improved to include an additional seven
loci at which substantial genetic variation exists.
Introduction
Materials and Methods
Samples
Analysis
Results
Discussion
Acknowledgement
References
Appendix
v
CONTENTS
1
2
2
10
11
27
29
31
35
INTRODUCTION
Genetic diversity of chum salmon (Oncorhychus keta)
populations in North America has only recently been reported.
The genetic structure of western Canadian populations has been
described in Beacham et ale (1987), and the Washington
Department of Fisheries is presently using starch gel
electrophoresis to identify Washington chum stocks. We
examined the genetic structure of chum salmon in southern
Southeast Alaska to determine if genetic divergence exists
among streams in this area or among regions near the northern
U.S.-Canada boundary. Prior to our study, little genetic
analysis had been done with Southeast Alaska chum salmon.
This project was a feasibility study; we subsampled fish
collected from Southeast Alaska streams in 1986 and 1987, and
examined them electrophoretically to obtain information about
the genetic relationships among these collections. A lack of
heterogeneity among collections or a lack of differences
between U.S. and Canadian stocks (for which inadequate data
presently exists) would indicate that the technique has little
promise for stock separation problems in this area. On the
other hand, useful differences identified from a preliminary
look using subsamples would be amplified when the entire set of
samples has been analyzed. In addition, further resolution
might also be identified.
Using guidelines for running starch-gel electrophoresis on
chum salmon developed by the Washington Department of Fisheries
(S. Phelps, personal communication), plus procedures that we
2
developed, we obtained preliminary data from chum salmon
collected from 32 Southeast Alaska streams in 1986 and 1987.
Using that preliminary data, we examined the genetic
relationships among the populations to test for distinctive
stream specific differences or regional differences near the
U.S.-Canada boundary that would be useful for multi-stock
separation. Here we report those results.
MATERIALS AND METHODS
Samples
Tissues were sampled from approximately 100 adult salmon
returning to each of the streams in the study. In 1986, chum
salmon tissue samples were collected from 28 streams. Four new
streams and 3 of the original 28 streams were sampled in 1987
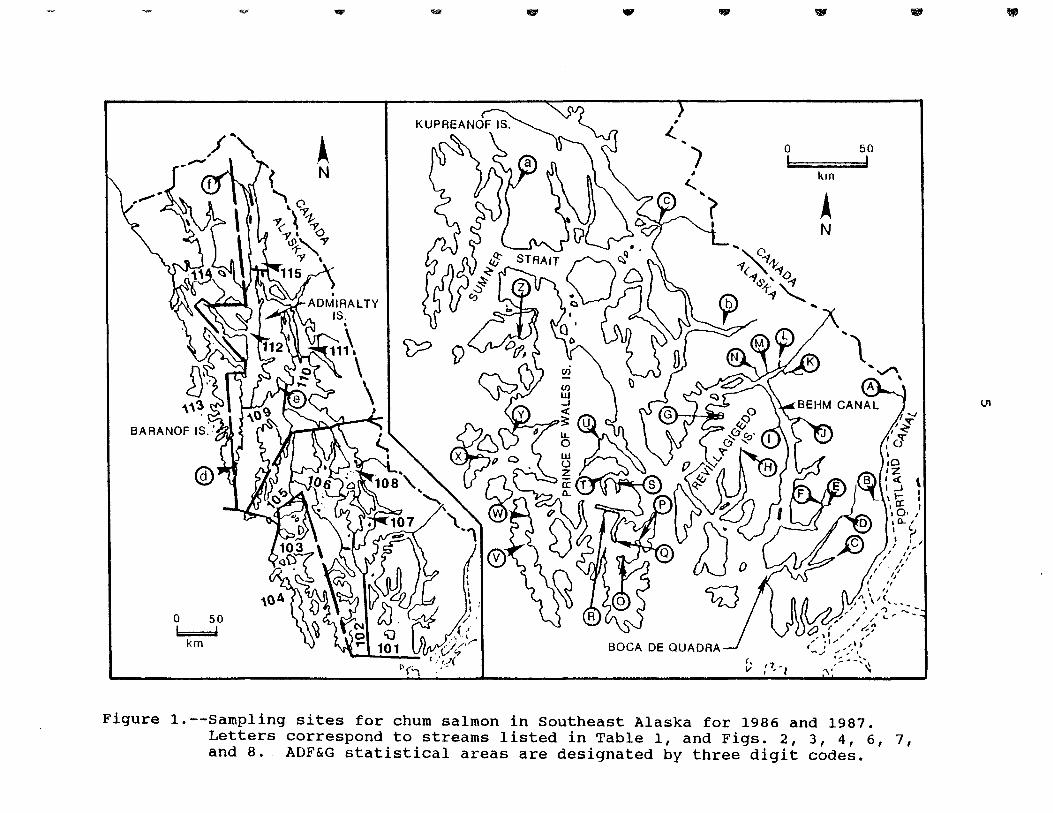
(Table 1: Fig. 1). Samples were collected from July to
October, primarily from streams on Prince of Wales Island and
nearby islands to the west, and from streams to the east of
Revillagigedo Island and the mainland that drain into Portland
Canal, Boca de Quadra, and Behm Canal (Table 1; Fig. 1).
Letters in parenthesis after stream names are used throughout
this report for ease of reference to Figure 1.
An eye and samples of liver, skeletal muscle, and heart
from a single fish were packaged in Whirl-pak1 bags and put on
ice or gel-ice immediately. Subsequently, they were frozen at
1Reference to trade names does not imply endorsement by the National Marine Fisheries Service, NOAA.
3
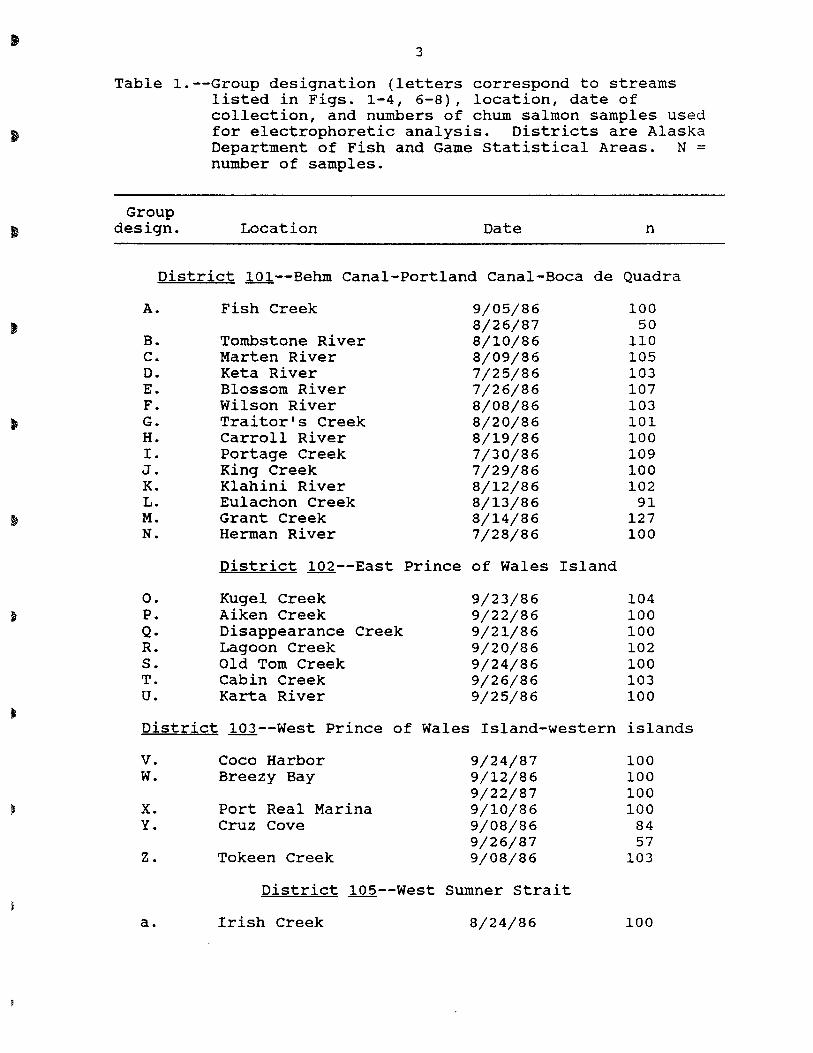
Table 1.--Group designation (letters correspond to streams listed in Figs. 1-4, 6-8), location, date of collection, and numbers of chum salmon samples used for electrophoretic analysis. Districts are Alaska Department of Fish and Game statistical Areas. N = number of samples.
Group design. Location Date n
District 101--Behm Canal-Portland Canal-Boca de Quadra
A. Fish Creek 9/05/86 100 8/26/87 50
B. Tombstone River 8/10/86 110 C. Marten River 8/09/86 105 D. Keta River 7/25/86 103 E. Blossom River 7/26/86 107 F. Wilson River 8/08/86 103 G. Traitor's Creek 8/20/86 101 H. Carroll River 8/19/86 100 I. Portage Creek 7/30/86 109 J. King Creek 7/29/86 100 K. Klahini River 8/12/86 102 L. Eulachon Creek 8/13/86 91 M. Grant Creek 8/14/86 127 N. Herman River 7/28/86 100
District 102--East Prince of Wales Island
o. Kugel Creek 9/23/86 104 P. Aiken Creek 9/22/86 100 Q. Disappearance Creek 9/21/86 100 R. Lagoon Creek 9/20/86 102 s. Old Tom Creek 9/24/86 100 T. Cabin Creek 9/26/86 103 U. Karta River 9/25/86 100
District 103--West Prince of Wales Island-western islands
v. Coco Harbor 9/24/87 100 W. Breezy Bay 9/12/86 100
9/22/87 100 x. Port Real Marina 9/10/86 100 Y. Cruz Cove 9/08/86 84
9/26/87 57 z. Tokeen Creek 9/08/86 103
District 105--West Sumner strait
a. Irish Creek 8/24/86 100
4
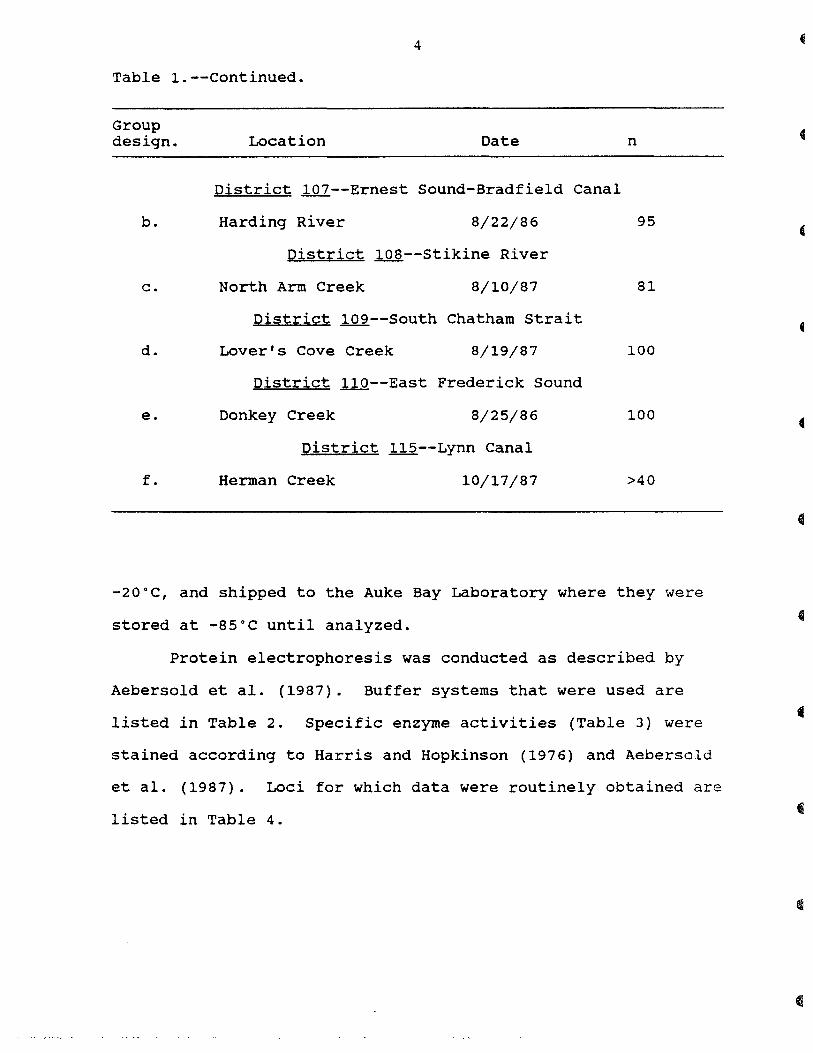
Table 1.--continued.
Group design.
b.
c.
d.
e.
f.
Location Date
District 107--Ernest Sound-Bradfield Canal
Harding River 8/22/86
District lQa--Stikine River
North Arm Creek 8/10/87
District 109--South Chatham strait
Lover's Cove Creek 8/19/87
DistJ::ict 110--East Frederick Sound
Donkey Creek 8/25/86
District 115--Lynn Canal
Herman Creek 10/17/87
n
95
81
100
100
>40
-20°C, and shipped to the Auke Bay Laboratory where they were
stored at -85°C until analyzed.
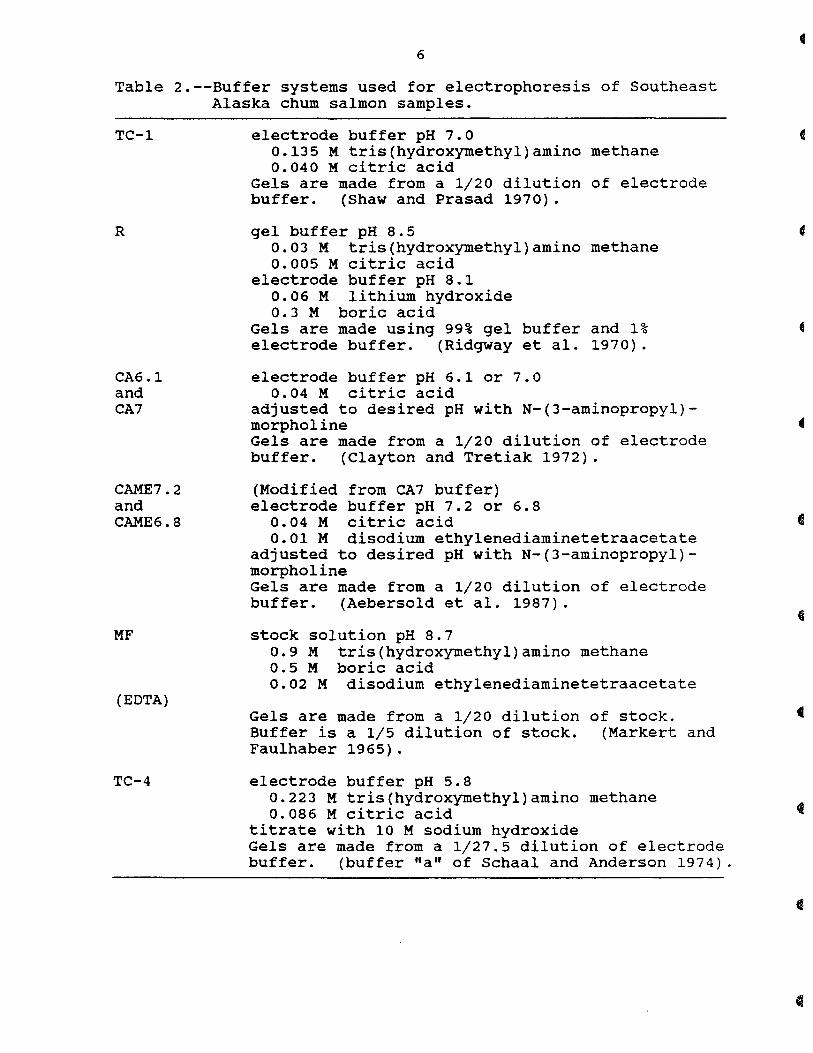
Protein electrophoresis was conducted as described by
Aebersold et al. (1987). Buffer systems that were used are
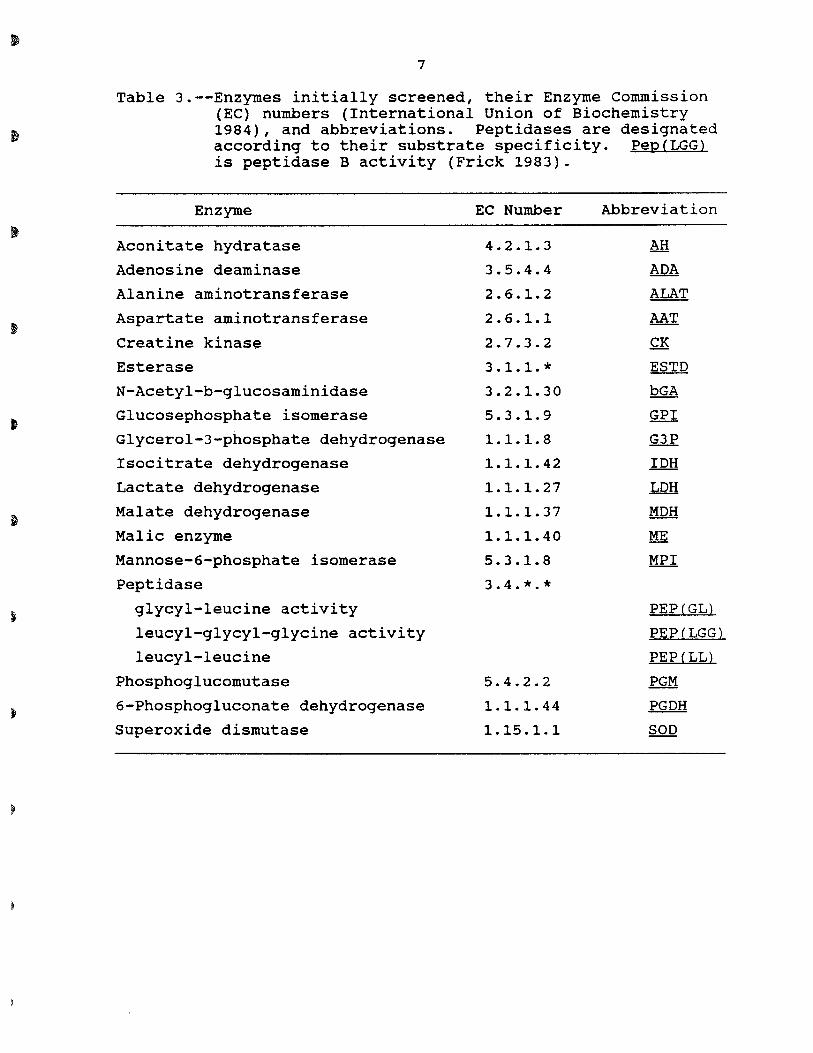
listed in Table 2. Specific enzyme activities (Table 3) were
stained according to Harris and Hopkinson (1976) and Aebersold
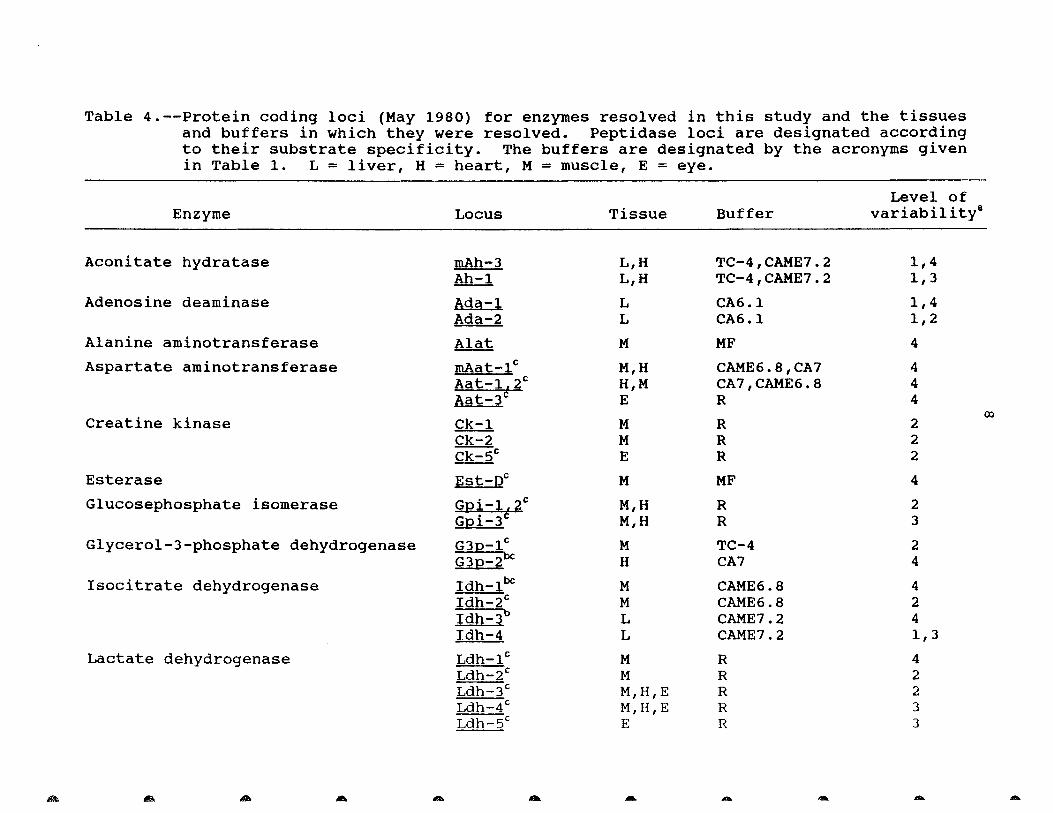
et al. (1987). Loci for which data were routinely obtained are
listed in Table 4.
- - - .. .. ."
#
~ N
J... ...
/
'" ..
o 50 I I
km
A N
~'-.J 'I ~
'I <-'I ~ ,0 \ 10 1% Ie{ \ '.J I \ l- I ,a: , ,0· I 10-, \ ~ \ I /
/ / ~ I ('
I /' ,I , 1/
, I, I 'I I 'I
',. I I ( I ,\ ........
o 50 ~I' , ...,
;0" , ,' .... '
!
km
Ph
~;r ~~~ ~7 /' :1/ ,l)
..... v' "" "',1' I
(, 17... ':;--~\. v,_1 :\' "
Figure 1.--Sampling sites for chum salmon in southeast Alaska for 1986 and 1987. Letters correspond to streams listed in Table 1, and Figs. 2, 3, 4, 6, 7, and 8. ADF&G statistical areas are designated by three digit codes.
..
U1
6
Table 2.--Buffer systems used for electrophoresis of Southeast Alaska chum salmon samples.
TC-1
R
CA6.1 and CA7
CAME7.2 and CAME6.8
MF
(EDTA)
TC-4
electrode buffer pH 7.0 0.135 M tris(hydroxymethyl)amino methane 0.040 M citric acid
Gels are made from a 1/20 dilution of electrode buffer. (Shaw and Prasad 1970).
gel buffer pH 8.5 0.03 M tris(hydroxymethyl)amino methane 0.005 M citric acid
electrode buffer pH 8.1 0.06 M lithium hydroxide 0.3 M boric acid
Gels are made using 99% gel buffer and 1% electrode buffer. (Ridgway et al. 1970).
electrode buffer pH 6.1 or 7.0 0.04 M citric acid
adjusted to desired pH with N-(3-aminopropyl)morpholine Gels are made from a 1/20 dilution of electrode buffer. (Clayton and Tretiak 1972).
(Modified from CA7 buffer) electrode buffer pH 7.2 or 6.8
0.04 M citric acid 0.01 M disodium ethylenediaminetetraacetate
adjusted to desired pH with N-(3-aminopropyl)morpholine Gels are made from a 1/20 dilution of electrode buffer. (Aebersold et al. 1987).
stock solution pH 8.7 0.9 M tris(hydroxymethyl)amino methane 0.5 M boric acid 0.02 M disodium ethylenediaminetetraacetate
Gels are made from a 1/20 dilution of stock. Buffer is a 1/5 dilution of stock. (Markert and Faulhaber 1965).
electrode buffer pH 5.8 0.223 M tris(hydroxymethyl)amino methane 0.086 M citric acid
titrate with 10 M sodium hydroxide Gels are made from a 1/27.5 dilution of electrode buffer. (buffer "an of Schaal and Anderson 1974).
7
Table 3.--Enzymes initially screened, their Enzyme Commission (EC) numbers (International Union of Biochemistry 1984), and abbreviations. Peptidases are designated according to their substrate specificity. Pep (LGG) is peptidase B activity (Frick 1983).
Enzyme
Aconitate hydratase
Adenosine deaminase
Alanine aminotransferase
Aspartate aminotransferase
creatine kinase
Esterase
N-Acetyl-b-glucosaminidase
Glucosephosphate isomerase
Glycerol-3-phosphate dehydrogenase
Isocitrate dehydrogenase
Lactate dehydrogenase
Malate dehydrogenase
Malic enzyme
Mannose-6-phosphate isomerase
Peptidase
glycyl-leucine activity
leucyl-glycyl-glycine activity
leucyl-leucine
Phosphoglucomutase
6-Phosphogluconate dehydrogenase
superoxide dismutase
EC Number
4.2.1.3
3.5.4.4
2.6.1.2
2.6.1.1
2.7.3.2
3.1.1.* 3.2.1.30
5.3.1.9
1.1.1.8
1.1.1.42
1.1.1.27
1.1.1.37
1.1.1.40
5.3.1.8
3.4.*.*
5.4.2.2
1.1.1.44
1.15.1.1
Abbreviation
AH
ADA
ALAT
AAT
CK
ESTD
bGA
GPI
G3P
IDH
LDH
MDH
ME
MPI
PEP (GL)
PEP(LGG)
PEP (LL)
PGM
PGDH
SOD
...
Table 4.--Protein coding loci (May 1980) for enzymes resolved in this study and the tissues and buffers in which they were resolved. Peptidase loci are designated according to their substrate specificity. The buffers are designated by the acronyms given in Table 1. L = liver, H = heart, M = muscle, E = eye.
Enzyme
Aconitate hydratase
Adenosine deaminase
Alanine aminotransferase
Aspartate aminotransferase
creatine kinase
Esterase
Glucosephosphate isomerase
Glycerol-3-phosphate dehydrogenase
Isocitrate dehydrogenase
Lactate dehydrogenase
... A ... ..
Locus
mAh-3 Ah-l
Ada-l Ada-2
Alat
mAat-1C
Aat-1t 2c
Aat-3
Ck-l Ck-2 Ck-5c
Est-pC
Gpi-lt 2c
Gpi-3
G3p-1c
G3p-2 bc
Idh-lbc
Idh-2c
Idh-3b
Idh-4
Ldh-1c
Ldh-2 c
Ldh-3 c
Ldh-4 c
Ldh-5c
...
Tissue
L,H L,H
L L
M
M,H H,M E
M M E
M
M,H M,H
M H
M M L L
M M M,H,E M,H,E E
-
Buffer
TC-4,CAME7.2 TC-4,CAME7.2
CA6.1 CA6.1
MF
CAME6.8,CA7 CA7,CAME6.8 R
R R R
MF
R R
TC-4 CA7
CAME6.8 CAME6.8 CAME7.2 CAME7.2
R R R R R
-. -
Level of variability 8
1,4 1,3
1,4 1,2
4
4 4 4
2 2 2
4
2 3
2 4
4 2 4 1,3
4 2 2 3 3
...
00
..
""'" ....
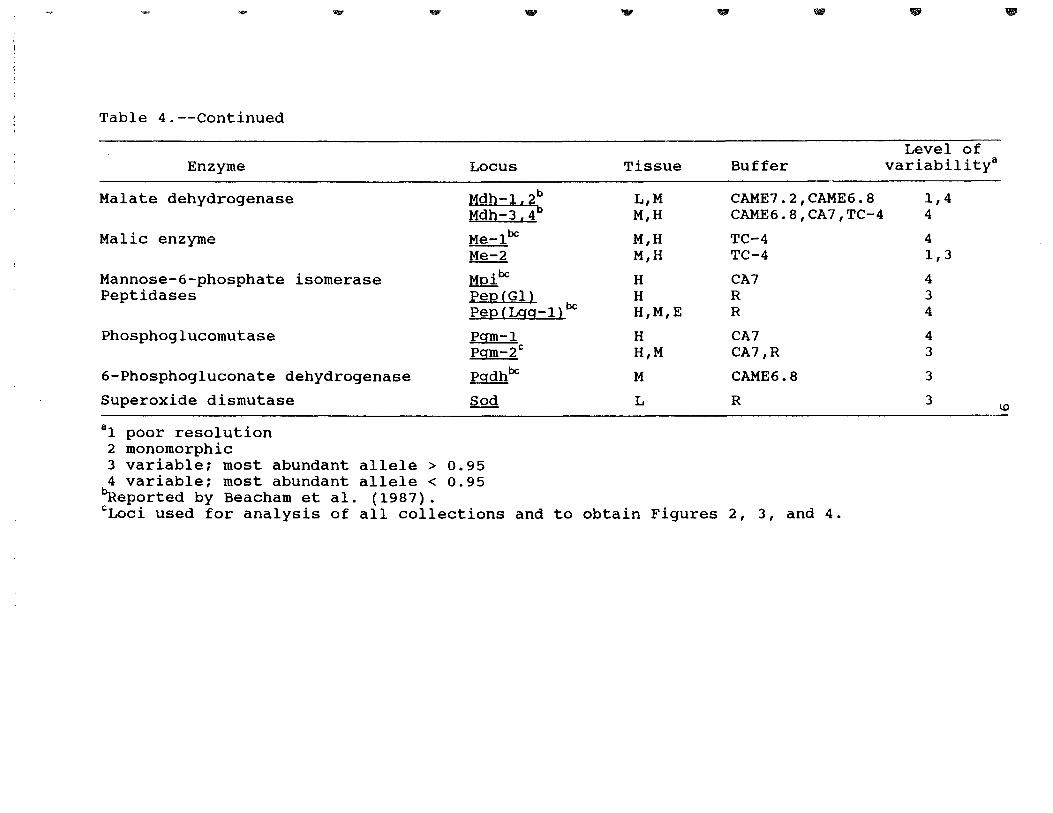
Table 4.--continued
Enzyme
Malate dehydrogenase
Malic enzyme
Mannose-6-phosphate isomerase Peptidases
Phosphoglucomutase
6-Phosphogluconate dehydrogenase
Superoxide dismutase
8 1 poor resolution 2 monomorphic
... ...
Locus
Mdh-1 « 2b Mdh-3 « 4b
Me-1bc
Me-2
Mpibc
Pep(Gl} pep(Igg-1l bc
Pgm-1 Pgm_2 C
Pgdhbc
Sod
3 variable; most abundant allele> 0.95 4 variable; most abundant allele < 0.95
., .. w
Tissue Buffer
L,M CAME7.2,CAME6.8 M,H CAME6.8,CA7,TC-4
M,H TC-4 M,H TC-4
H CA7 H R H,M,E R
H CA7 H,M CA7,R
M CAME6.8
L R
~eported by Beacham et al. (1987). cLoci used for analysis of all collections and to obtain Figures 2, 3, and 4.
.., '"
Level of variability 8
1,4 4
4 1,3
4 3 4
4 3
3
3 \0
10
Analysis
Departure from Hardy-Weinberg expectations was examined
with chi-square goodness-of-fit tests. Homogeneity of allelic
frequencies among collections was examined using log-likelihood
ratio analysis (g-test, Sokal and Rohlf 1981). Pooling of
genotypic or allelic frequencies, respectively, eliminated
classes with expected values less than four. Genetic variation
at Pgm-l involved a "null" allele. Unlike a normal allele, a
"null" allele does not produce a gene product that stains;
consequently, only two phenotypes (banding patterns) are
detectable, a single band that reflects the presence of the
normal allele (either as a homozygote or heterozygote) or the
absence of a band (a homozygote for the "null" allele). For
most loci all genotypes are distinguishable. For the g-test
involving Pgm-1, phenotypic frequencies were used rather than
allelic frequencies.
Variation at co-migrating duplicated loci (isoloci,
Allendorf and Thorgaard 1984) was treated as if one-half of the
variation were at each locus.
Relationships among the collections were examined in three
ways: 1) principal component analysis of allelic frequencies
which were arcsine-square root transformed (Wilkinson 1986), 2)
maximum-likelihood evolutionary trees (Felsenstein 1973, 1984),
and 3) unweighted pair-group arithmetic average clustering
(UPGMA, Sneath and Sokal 1973) of Rogers' (1972) and of Neils
(1972, 1978) genetic distances.
Relationships based on geographical proximity were also
examined using hierachical log-likelihood ratio analysis (Sakal
11
and Rohlf 1981). The first step in the process involved
computing heterogeneity among collections within each Alaska
Department of Fish and Game statistical area (Fishing
District). If there was none, the collections were pooled.
Subsequently, geographically adjacent districts were compared.
When heterogeneity was observed among collections within a
district, the source(s) of the heterogeneity was identified.
RESULTS
Electrophoretic data were obtained for the chum salmon
subsamples for 26 loci and 3 isoloci (Appendix Table A). Of
these, 7 loci and 1 isolocus were monomorphic for all
populations examined. Twelve of the remaining 19 loci and 2 of
the isoloci had sUbstantial variability with the common allele
present at a frequency of less than 0.95 in at least one
population (Table 4). Tests for conformity of phenotypic
frequencies to those predicted for Hardy-Weinberg equilibrium
failed in only 5 of the 101 possible tests, the rate of failure
to expect using a g = 0.05 test criterion.
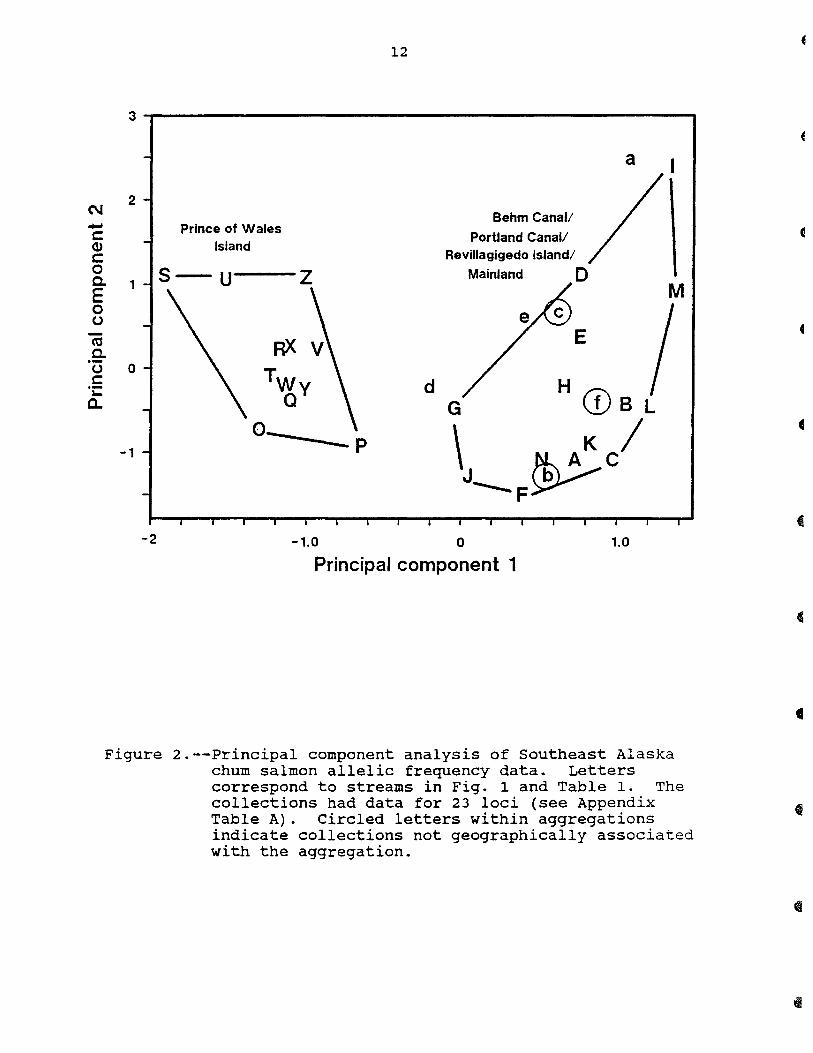
Allele frequency data of 23 loci which had been obtained
for all collections, were used to examine genetic relationships
among the collections. These loci are designated in Table 4.
Principal component analysis clearly separated Prince of Wales
Island collections from the mainland and Revillagigedo Island
collections to the east (Fig. 2). Collections from other
Southeast Alaska locations were not as well resolved by
principal component analysis. For example, Donkey Creek (e) on
Admiralty Island, Herman Creek (f) in the Chilkat River system,
12
3
a
('IJ 2
Behm Canal/ ...., Prince of Wales C Portland Canal/
(1) Island Revillagigedo Island/ C
0 S-u Z Mainland D a. 1 M E 0 u - E m .9-u c:: .-J..
0..
0 TWy d H CD B L a G
0_
\ ~c/ -1 -P J___ b
F
-2 -1.0 0 1.0
Principal component 1
Figure 2.--Principal component analysis of Southeast Alaska chum salmon allelic frequency data. Letters correspond to streams in Fig. 1 and Table 1. The collections had data for 23 loci (see Appendix Table A). Circled letters within aggregations indicate collections not geographically associated with the aggregation.
13
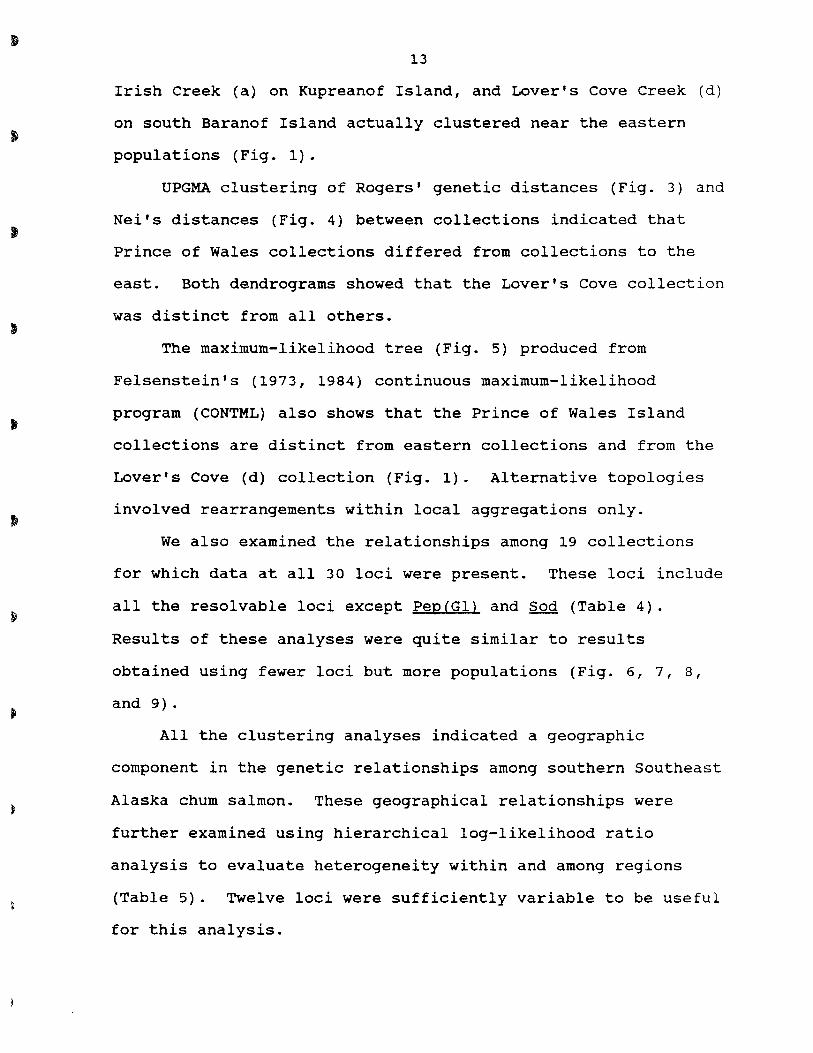
Irish Creek (a) on Kupreanof Island, and Lover's Cove Creek (d)
on south Baranof Island actually clustered near the eastern
populations (Fig. 1).
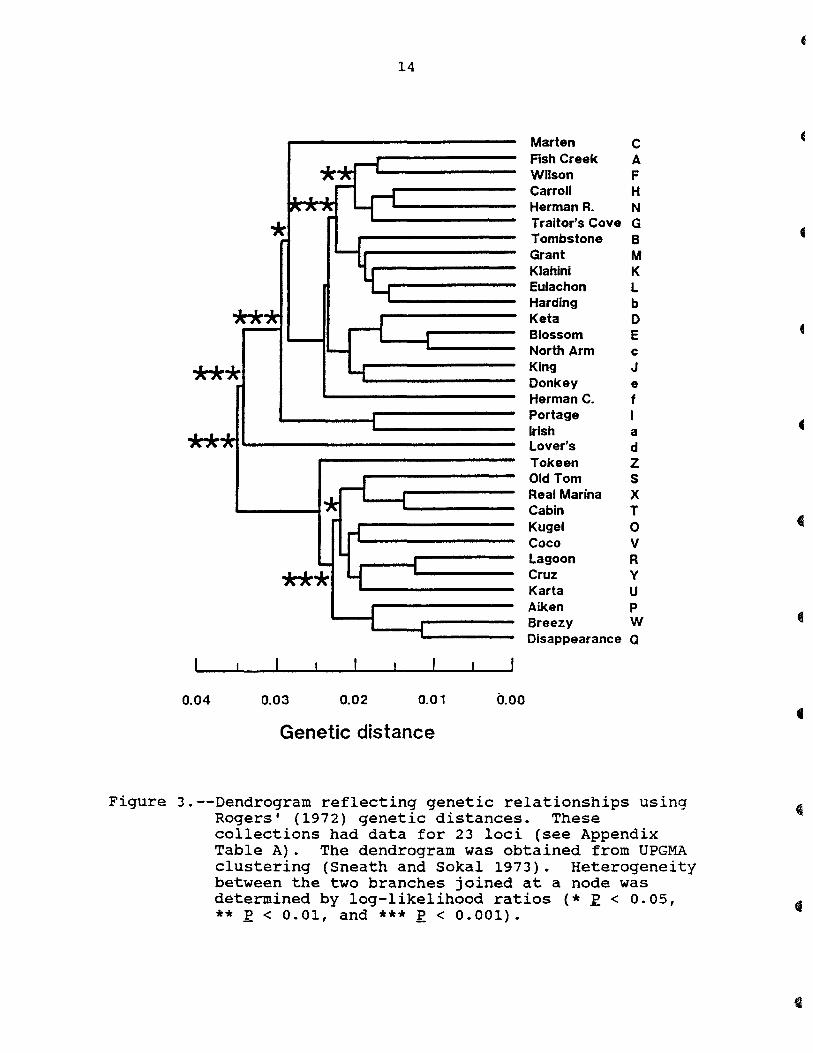
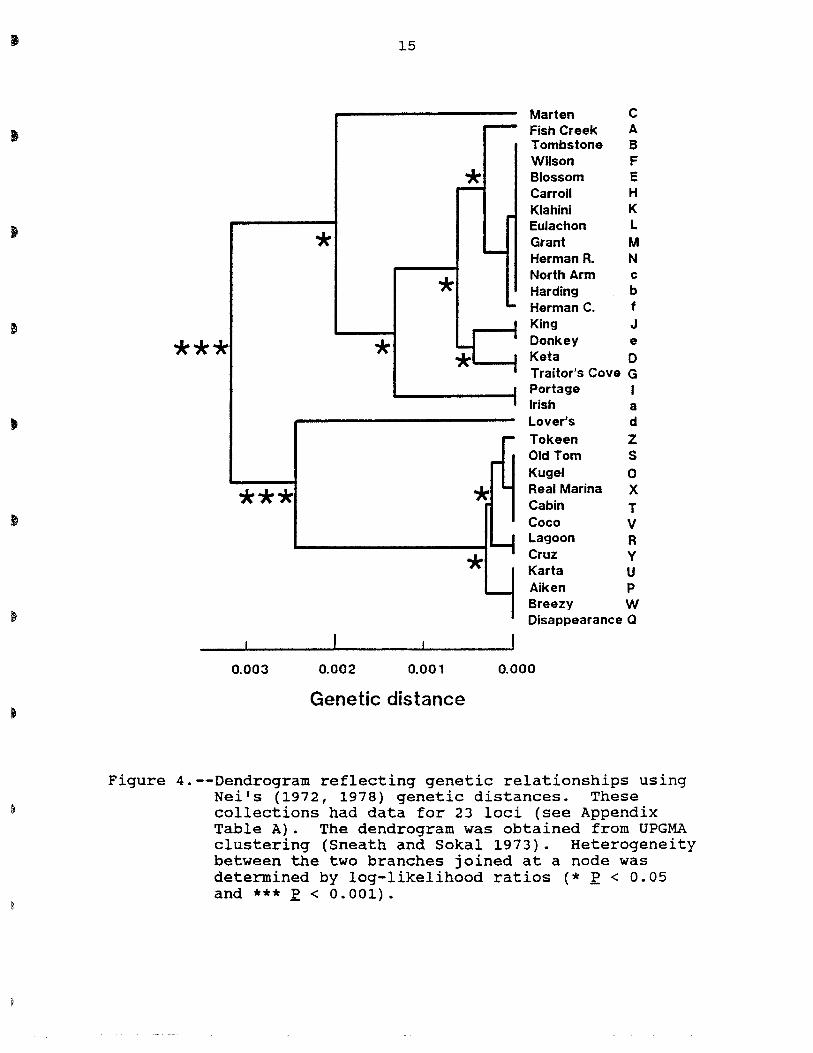
UPGMA clustering of Rogers' genetic distances (Fig. 3) and
Nei's distances (Fig. 4) between collections indicated that
Prince of Wales collections differed from collections to the
east. Both dendrograms showed that the Lover's Cove collection
was distinct from all others.
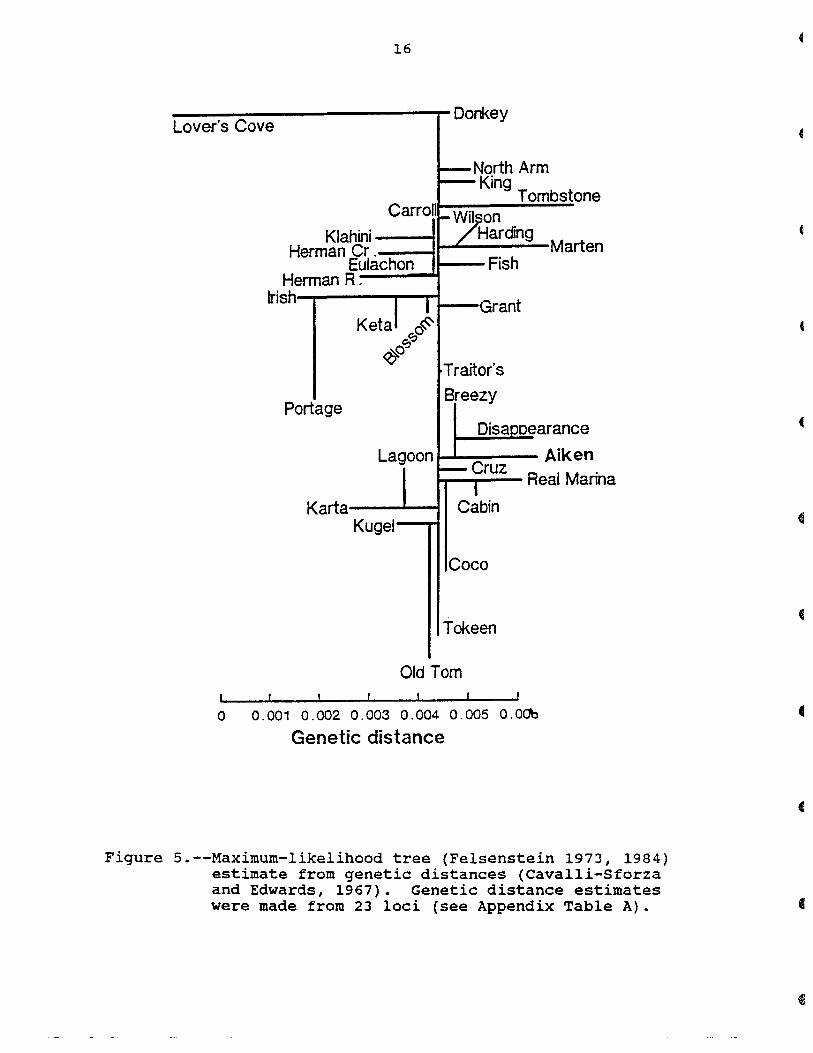
The maximum-likelihood tree (Fig. 5) produced from
Felsenstein's (1973, 1984) continuous maximum-likelihood
program (CONTML) also shows that the Prince of Wales Island
collections are distinct from eastern collections and from the
Lover's Cove (d) collection (Fig. 1). Alternative topologies
involved rearrangements within local aggregations only.
We also examined the relationships among 19 collections
for which data at all 30 loci were present. These loci include
all the resolvable loci except Pep(GI) and Sod (Table 4).
Results of these analyses were quite similar to results
obtained using fewer loci but more populations (Fig. 6, 7, 8,
and 9).
All the clustering analyses indicated a geographic
component in the genetic relationships among southern Southeast
Alaska chum salmon. These geographical relationships were
further examined using hierarchical log-likelihood ratio
analysis to evaluate heterogeneity within and among regions
(Table 5). Twelve loci were sufficiently variable to be useful
for this analysis.
14
Marten C
**r--'t Fish Creek A Wilson F -
I "I _I Lf1. ~~~
*
1G .L.J..L "A~ ri
Carroll H Herman R. N Traitor's Cove G Tombstone B Grant M Klahlni K Eulachon L Harding b Keta D Blossom E -- North Arm c
*** "'-I King J Donkey e Herman C. f Portage I
** ~* Irish a Lover's d Tokeen Z
*-1 Old Tom S Real Marina X Cabin T
r-f Kugel 0 Coco V
- Lagoon R
*** ~ Cruz Y Karta U
I I
Aiken P Breezy W Disappearance a
0.04 0.03 0.02 0.01 0.00
Genetic distance
Figure 3.--Dendrogram reflecting genetic relationships using Rogers' (1972) genetic distances. These collections had data for 23 loci (see Appendix Table A). The dendrogram was obtained from UPGMA clustering (Sneath and Sokal 1973). Heterogeneity between the two branches joined at a node was determined by log-likelihood ratios (* E < 0.05, ** E < 0.01, and *** E < 0.001).
15
Marten C - Fish Creek A Tombstone B Wilson F
* Blossom E - Carroll H Klahini K Eulachon L
* Grant M - Herman R. N
* North Arm c Harding b - Herman C. f
I King J
*** * ~ I
I I
Donkey e Keta D Traitor's Cove G
I Portage I I Irish a
Lover's d r- Tokeen Z
Old Tom S ,.. Kugel 0
*** * .. Real Marina X
Cabin T Coco V
Lf *
Lagoon R Cruz y Karta U
- Aiken P Breezy W Disappearance Q
0.003 0.002 0.001 0.000
Genetic distance
Figure 4.--Dendrogram reflecting genetic relationships using Nei's (1972, 1978) genetic distances. These collections had data for 23 loci (see Appendix Table A). The dendrogram was obtained from UPGMA clustering (Sneath and Sokal 1973). Heterogeneity between the two branches joined at a node was determined by log-likelihood ratios (* E < 0.05 and *** E < 0.001).
16
----------------------~~Dorney Lover's Cove
-North Arm -King
Tombstone Carrol _ Wi~on
Klahini __ --IJ....oo'/--. t-H_a_r_din_g_Marten Herman Cr.
Eulachon Fish Herman R.
Irish I l....--Grant Ketal o~
~~
~o Tit' ra ors
Portage Breezy
Disappearance
Lagoon C Aik en - ruz
I Real Marina
Karta Cabin Kugel---ri
Coco
Tokeen
Old Tom
o 0.001 0.002 0.003 0.004 0.005 O.O~
Genetic distance
Figure 5.--Maximum-likelihood tree (Felsenstein 1973, 1984) estimate from genetic distances (Cavalli-Sforza and Edwards, 1967). Genetic distance estimates were made from 23 loci (see Appendix Table A).
17
2
Portland Canal/ C\I Revillagigedo Island/ ..... c: 1 Mainland e Q) c: 0 Co M E 0 ceC (J
Q) 0 d /V\ - y- -W Co B .-(J
.S
L"-... <it) Western ...
0.. b Prince of Wales -1 K
Island A F
-2 -1 o 1
Principle component 1
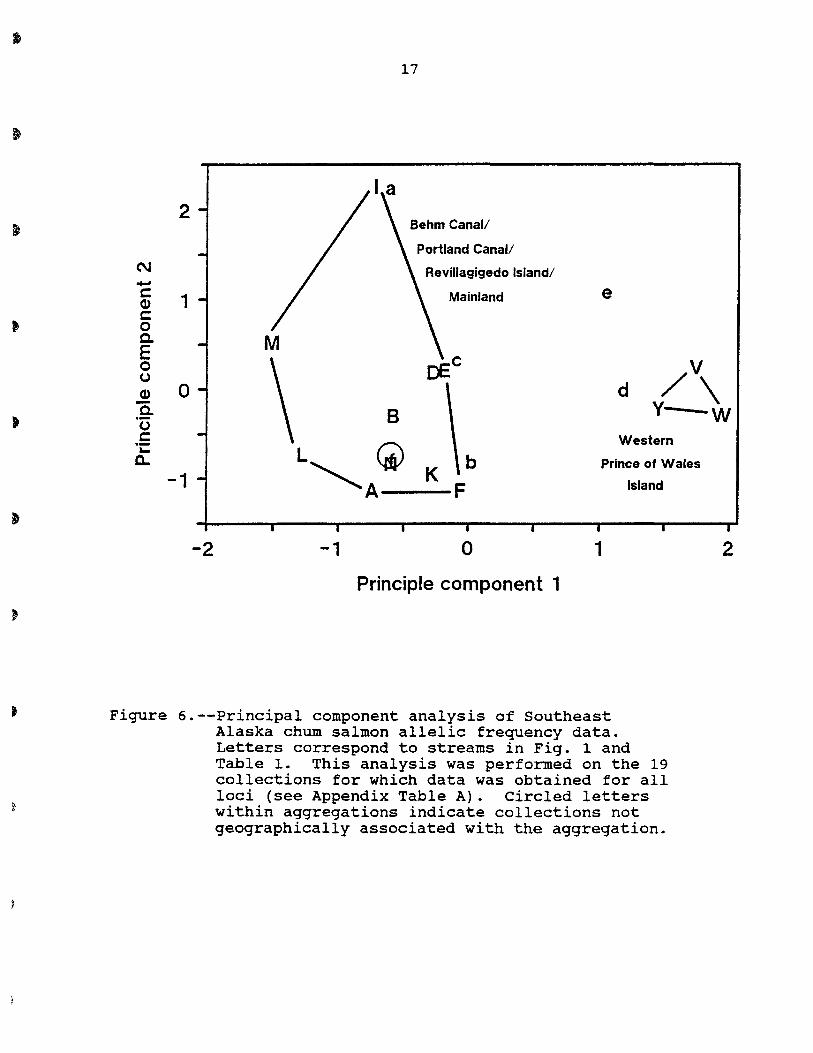
Figure 6.--Principal component analysis of Southeast Alaska chum salmon allelic frequency data. Letters correspond to streams in Fig. 1 and Table 1. This analysis was performed on the 19 collections for which data was obtained for all loci (see Appendix Table A). Circled letters within aggregations indicate collections not geographically associated with the aggregation.
2
18
Fish Creek A
r-- WUson F
- Harding b
Klahini K
~ Tombstone B
~ Keta D
-- Blossom E
Ji.Ji. '-- Y Grant M
North Arm c
---f Eulachon L
Herman C. (Chilkat) f
Herman R. (Behm) N
I Portage
I Irish a
I Donkey e
I Lovers d
"--
Ji.JI. Coco Harbor V
L.....f Cruz Y
Breezy W
0.04 0.03 0.02 0.01 0
Genetic distance
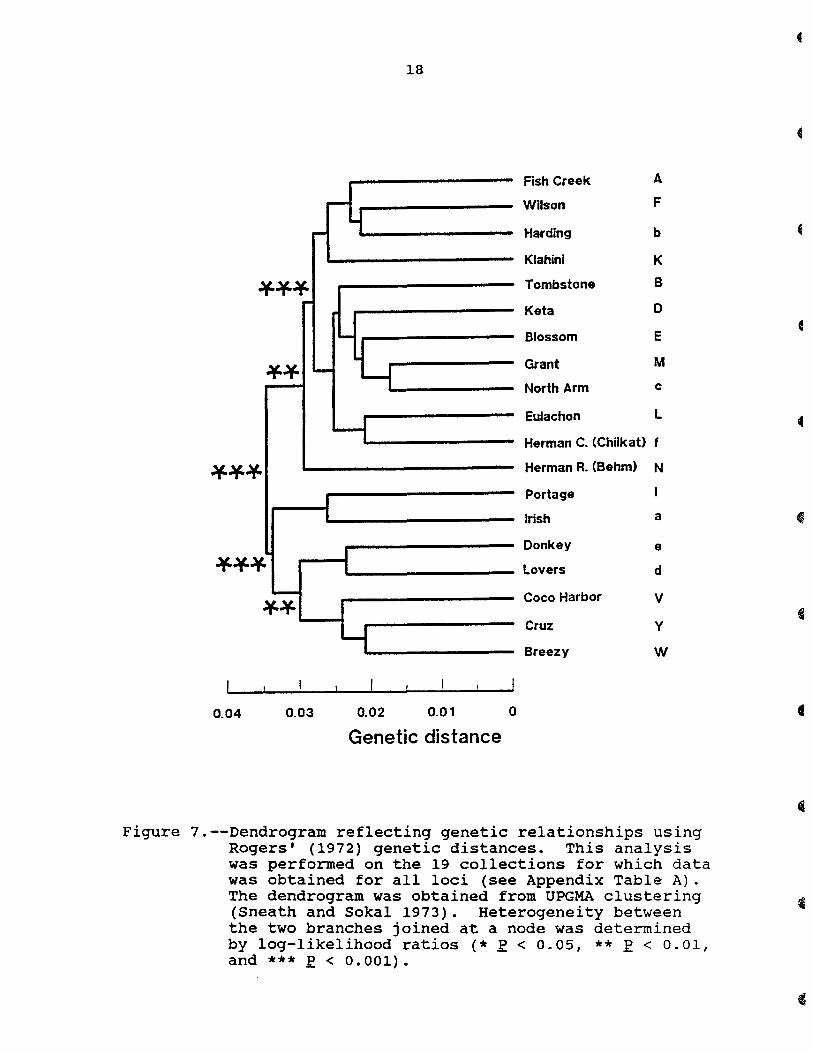
Figure 7.--Dendrogram reflecting genetic relationships using Rogers' (1972) genetic distances. This analysis was performed on the 19 collections for which data was obtained for all loci (see Appendix Table A). The dendrogram was obtained from UPGMA clustering (Sneath and Sokal 1973). Heterogeneity between the two branches joined at a node was determined by log-likelihood ratios (* E < 0.05, ** E < 0.01, and *** E < 0.001).
19
Wilson F
Harding b
Klahini K
Fish A
~JI. Keta D
Grant M
North Arm c
Tombstone B
Eulachon L Jl.JI.JI. Jl.JI. Herman C. (Chilkat) f
Herman R. (Behm) N
Irish a
Portage
Blossom E
Jl.JI. Donkey e
JI.JI.JI. Lover's Cove d
Coco Harbor V
Cruz Cove y
Breezy Bay W
0.003 0.002 0.001 o
Genetic distance
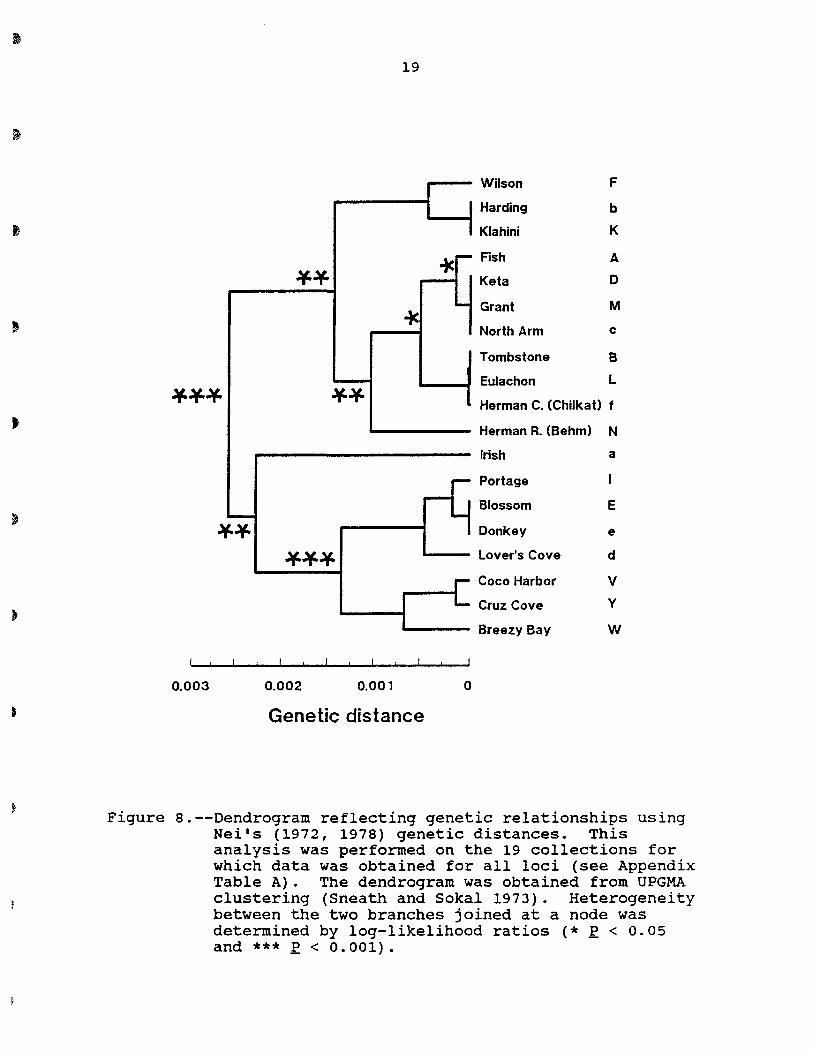
Figure 8.--Dendrogram reflecting genetic relationships using Neils (1972, 1978) genetic distances. This analysis was performed on the 19 collections for which data was obtained for all loci (see Appendix Table A). The dendrogram was obtained from UPGMA clustering (Sneath and Sokal 1973). Heterogeneity between the two branches joined at a node was determined by log-likelihood ratios (* ~ < 0.05 and *** ~ < 0.001).
20
Tombstone
Herman R.
Eulachon -----I HenmanC. _____ ~
Keta ---...... ~
Harding
.c en u:
1-___ Wilson
~ Blossom
North Arm ~ Grant
Klahini
Irish
Cruz Cove --...,-,....---1 1---- Donkey Portage
Coco Harbor
Breezy Bay
Lover's Cove
o 0.001 0.002 0.003 0.004 0.005
Genetic distance
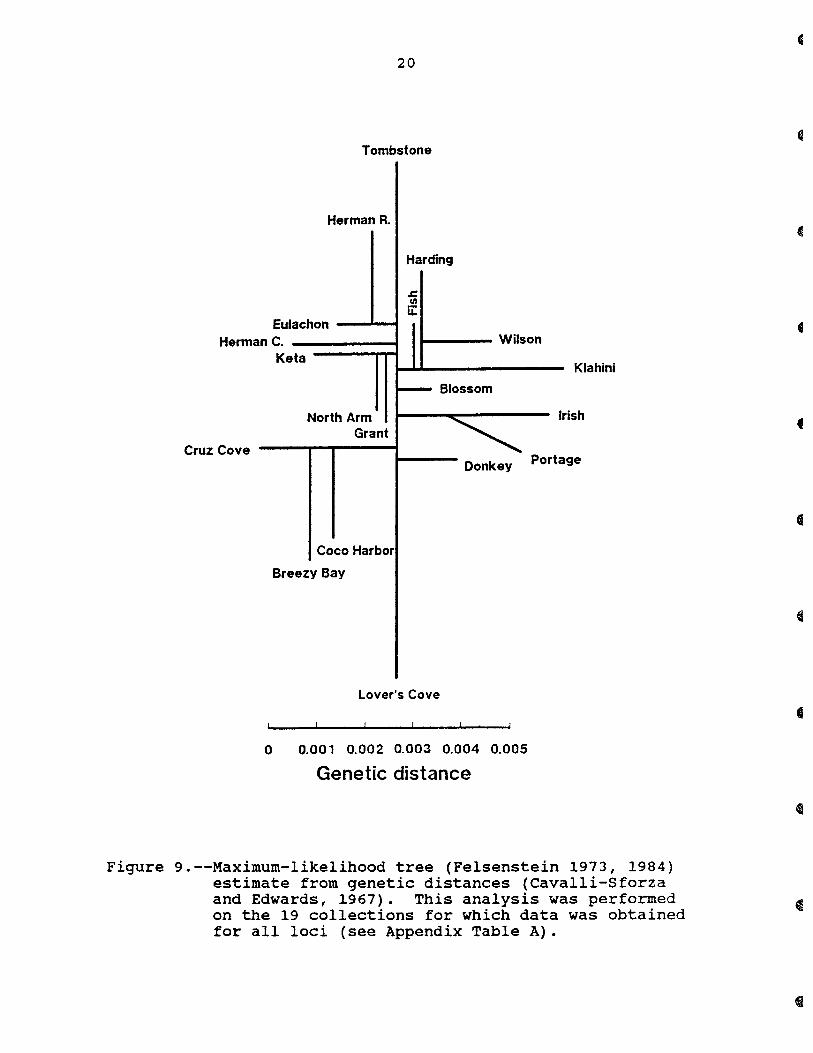
Figure 9.--Maximum-likelihood tree (Felsenstein 1973, 1984) estimate from genetic distances (Cavalli-Sforza and Edwards, 1967). This analysis was performed on the 19 collections for which data was obtained for all loci (see Appendix Table A).
,..,. - - .. .., .. 11\9 ., .,
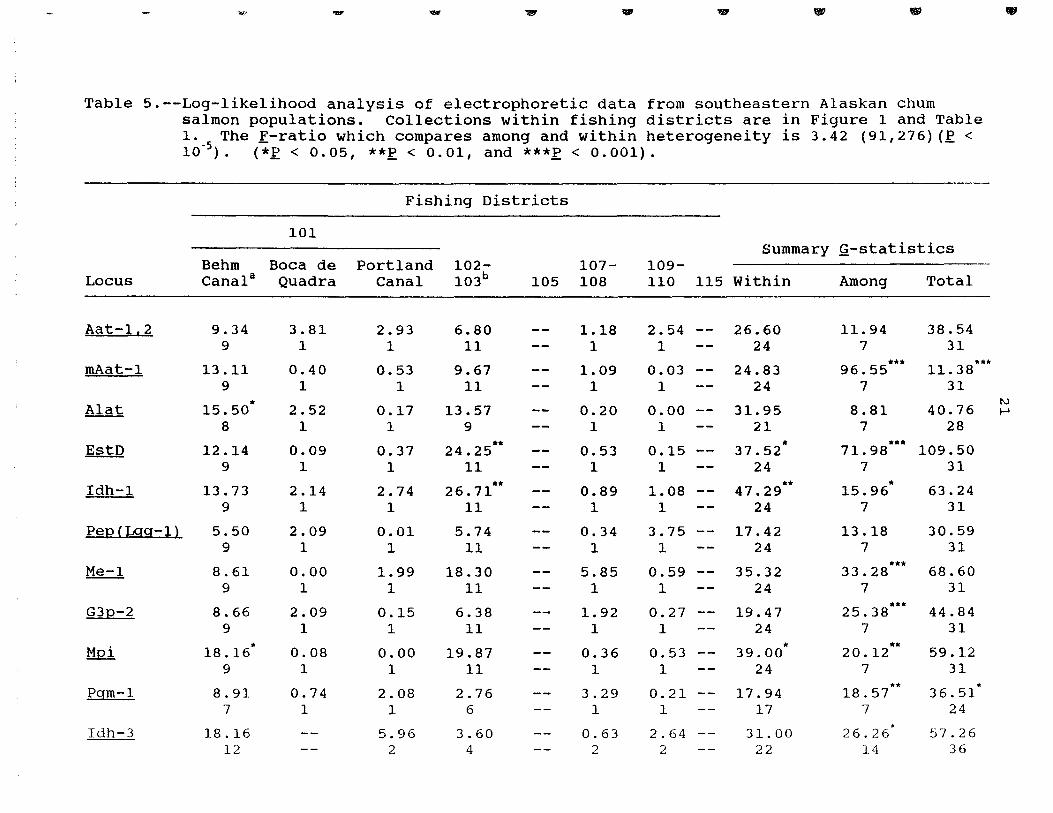
Table 5.--Log-likelihood analysis of electrophoretic data from southeastern Alaskan chum salmon populations. Collections within fishing districts are in Figure 1 and Table 1. The E-ratio which compares among and within heterogeneity is 3.42 10-5
). (*£ < 0.05, **£ < 0.01, and ***£ < 0.001). (91,276) (£ <
Fishing Districts
101 Summary Q-statistics
Behm Boca de Portland 102- 107- 109-Locus Canal a Quadra Canal 103b 105 108 110 115 within Among Total
Aat-1.2 9.34 3.81 2.93 6.80 1.18 2.54 26.60 11. 94 38.54 9 1 1 11 1 1 24 7 31
••• .* • mAat-1 13.11 0.40 0.53 9.67 1. 09 0.03 24.83 96.55 11. 38 9 1 1 11 1 1 24 7 31
Alat • tv 15.50 2.52 0.17 13.57 0.20 0.00 31.95 8.81 40.76 .....
8 1 1 9 1 1 21 7 28 •• • ••• EstD 12.14 0.09 0.37 24.25 0.53 0.15 37.52 71. 98 109.50
9 1 1 11 1 1 24 7 31
Idh-1 13.73 2.14 2.74 •• 26.71 0.89 * • • 1.08 47.29 15.96 63.24 9 1 1 11 1 1 24 7 31
PeQ(Lgg-l) 5.50 2.09 0.01 5.74 0.34 3.75 17.42 13.18 30.59 9 1 1 11 1 1 24 7 31
••• Me-1 8.61 0.00 1. 99 18.30 5.85 0.59 35.32 33.28 68.60 9 1 1 11 1 1 24 7 31
G3p-2 8.66 2.09 0.15 6.38 1. 92 0.27 19.47 25.38 ••• 44.84 9 1 1 11 1 1 24 7 31
Mpi • • ** 18.16 0.08 0.00 19.87 0.36 0.53 39.00 20.12 59.12 9 1 1 11 1 1 24 7 31
.* * Pgm-1 8.91 0.74 2.08 2.76 3.29 0.21 17.94 18.57 36.51 7 1 1 6 1 1 17 7 24
* Idh-3 18.16 5.96 3.60 0.63 2.64 31. 00 26.26 57.26 12 2 4 2 2 22 14 36
..,
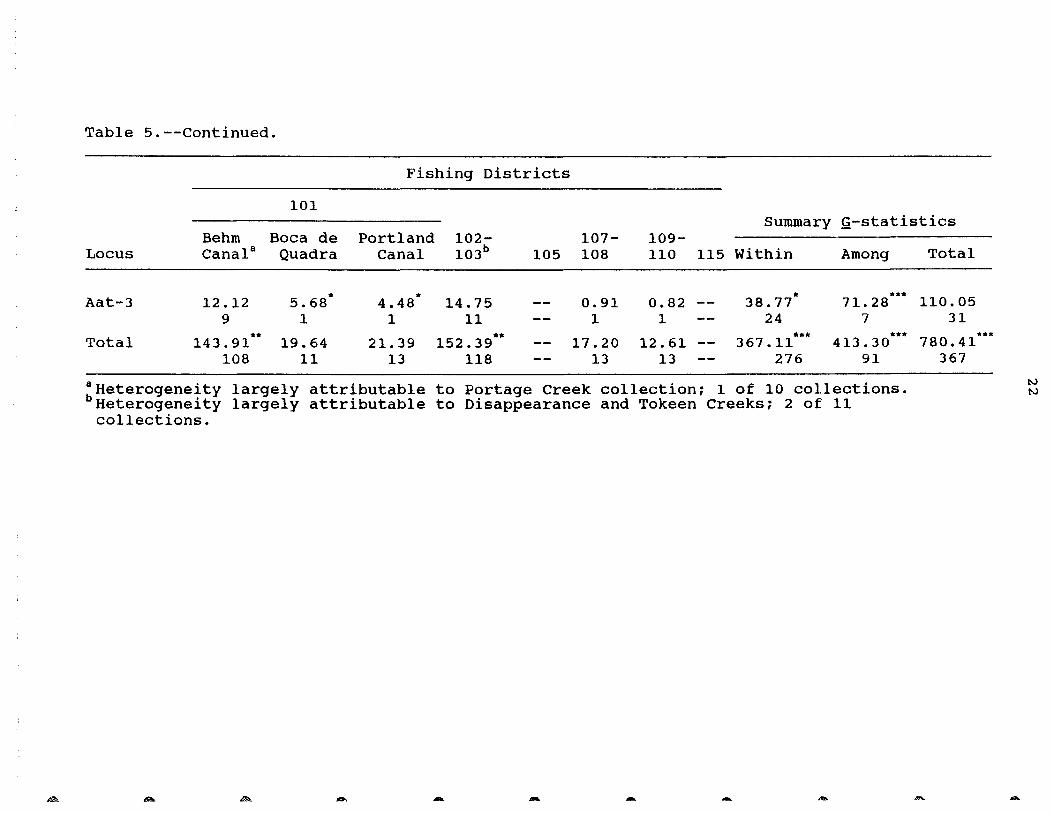
Table 5.--Continued.
Fishing Districts
101 Summary Q-statistics
Behrn Boca de Portland 102- 107- 109-Locus Canal a Quadra Canal 103b 105 108 110 115 Within Among
* * * *** Aat-3 12.12 5.68 4.48 14.75 0.91 0.82 38.77 71. 28 9 1 1 11 1 1 24 7
** ** *** *** Total 143.91 19.64 21. 39 152.39 17.20 12.61 367.11 413.30 108 11 13 118 13 13 276 91
~Heterogeneity largely attributable to Portage Creek collection; 1 of 10 collections. Heterogeneity largely attributable to Disappearance and Tokeen Creeks; 2 of 11 collections.
... .1& - .- - .- .....
Total
110.05 31
780.41 367
-.
***
.....
tv tv
•
23
Heterogeneity among streams within District 101 was
attributable to small differences between three subareas: Boca
de Quadra, Portland Canal, and the collections on Revillagigedo
Island and in Behm Canal (Fig. 1). Heterogeneity within the
latter subgroup is due largely to Portage Creek (I), 1 of 10
collections in that group. Among Prince of Wales Island
collections, Districts 102 and 103, heterogeneity was largely
attributable to 2 of the 12 collections, those from
Disappearance (Q) and Tokeen (Z) creeks. Data from Portage
(I), Disappearance (Q), and Tokeen (Z) Creeks were included in
the analysis presented. An approximate ~-ratio comparing the
among- and within-heterogeneity indicates that far more
heterogeneity exists among regions than within the regions
(~ = 3.42 (91,276); £ < 10-5).
A study of British Columbia stocks, using fewer variable
loci than we report herein, indicated a strong geographical
structure to western Canadian chum salmon populations (Beacham
et al. 1987). Their work reports variability for seven loci
and two isoloci. While we observed variability at all the loci
reported by Beacham et al. (1987), these loci represent only
six of the most variable loci we observed: Idh-1, Idh-3, Me-1,
Mpi, G3p-2, Pep(Lgg-1). We observed potentially useful
variability at seven additional loci: Alat, mAat-1, Aat-1,2,
Aat-3, Est-D, Ldh-1, and Pgm-1 and less SUbstantial variability
at another five loci (Appendix Table A).
To get an idea of the increased resolution that could be
obtained by using the additional loci, we conducted principal
24
component and then log-likelihood ratio analyses to examine the
divergence between Southeast Alaska regions, between which we
had already identified genetic divergence. We had data for all
12 variable loci for 3 collections from islands west of Prince
of Wales Island (District 103) and 10 of the collections taken
from waters included in District 101 (Table 6).
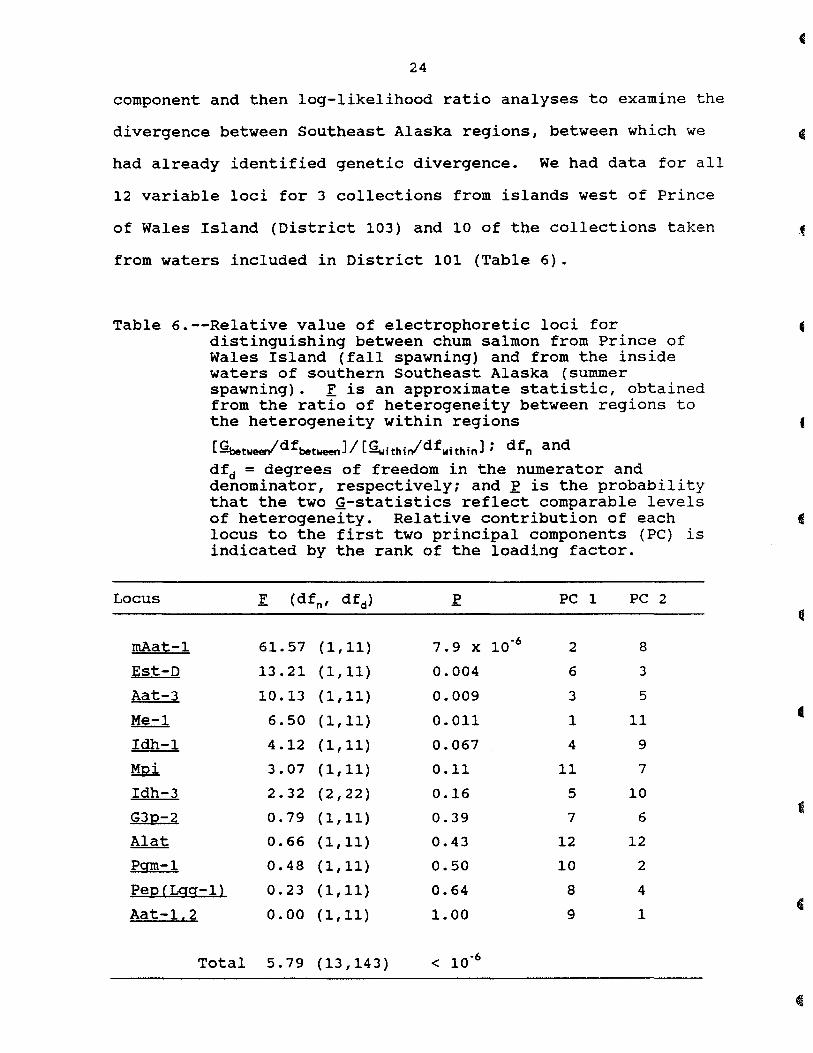
Table 6.--Relative value of electrophoretic loci for distinguishing between chum salmon from Prince of Wales Island (fall spawning) and from the inside waters of southern Southeast Alaska (summer spawning). ~ is an approximate statistic, obtained from the ratio of heterogeneity between regions to the heterogeneity within regions
Locus
mAat-1
Est-D
Aat-3
Me-1
Idh-1
MQi
Idh-3
G3p-2
Alat Pgm-1
(~tweerldfbetween]/ (~ithirldfwithin] i dfn and dfd = degrees of freedom in the numerator and denominator, respectively; and ~ is the probability that the two ~-statistics reflect comparable levels of heterogeneity. Relative contribution of each locus to the first two principal components (PC) is indicated by the rank of the loading factor.
~ (dfn, dfd) PC 1 PC 2
61.57 (1,11) 7.9 x 10⁻⁶ 2 8
13.21 (1,11) 0.004 6 3
10.13 (1,11) 0.009 3 5
6.50 (1,11) 0.011 1 11
4.12 (1,11) 0.067 4 9
3.07 (1,11) 0.11 11 7
2.32 (2,22) 0.16 5 10
0.79 (1,11) 0.39 7 6
0.66 (1,11) 0.43 12 12
0.48 (1,11) 0.50 10 2
Pep (Lag-1} 0.23 (1,11) 0.64 8 4
Aat-1,2 0.00 (1,11) 1. 00 9 1
Total 5.79 (13,143) < 10-6
•
•
I
25
The first principal component is the linear combination of
data from loci that accounts for the most variance among
collections; the second principal component is the axis
perpendicular to the first that accounts for the next greatest
variance. These components reflect divergence between regions
as well as intra-regional variation. The rank order of the
absolute value of the contribution by locus is in part an
indication of the discrimination value of that locus.
Comparison of heterogeneity within the regions to
heterogeneity between regions (an approximate E-ratio) for each
locus provides a second indicator of discrimination value.
Loci are arranged in Table 6 in descending order of E value.
Statistically, five loci show discrimination ability
between eastern and western populations in southern Southeast
Alaska: mAat-1, Est-O, Aat-3, Me-1, and Idh-1. Three of these
were not included in the survey reported by Beacham et al.
(1987). In addition to these loci, Ldh-4 is generally variable
(frequency of variant allele approximately 0.03) in collections
from Prince of Wales Island, but not from collections from the
inside waters. Similarly, Gpi-3 also shows small regional
differences in genetic composition. These differences show up
in ~-tests when regions (pooled collections) are compared and
in principal component analysis.
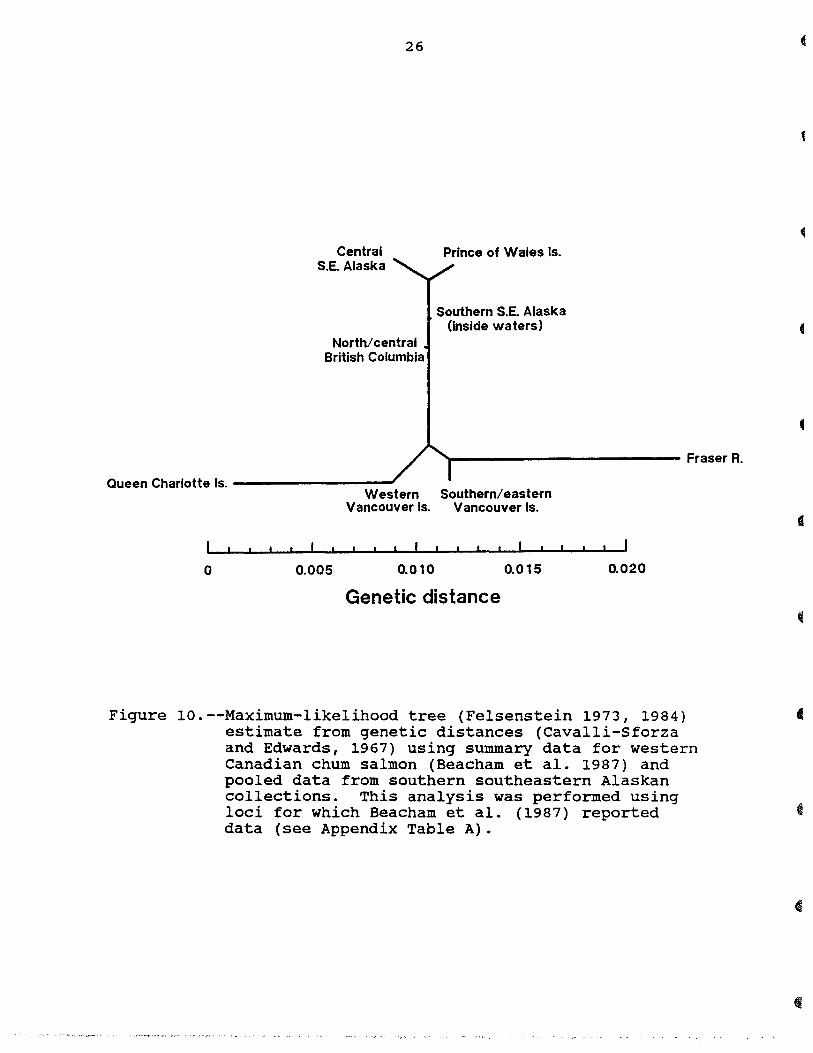
From data common to both studies pooled by region, we
determined Felsenstein's (1973, 1984) maximum-likelihood tree
(Fig. 10). This tree indicates that Queen Charlotte Island and
Fraser River chum salmon differ substantially from other
Central S.E. Alaska
26
North/ central British Columbia
Prince of Wales Is.
Southern S.E. Alaska (Inside waters)
~------------ Fraser R.
Queen Charlotte Is. ---------Western Southern/ eastern
Vancouver Is. Vancouver Is.
o 0.005 0.010 0.015 0.020
Genetic distance
Figure 10.--Maximum-likelihood tree (Felsenstein 1973, 1984) estimate from genetic distances (Cavalli-Sforza and Edwards, 1967) using summary data for western Canadian chum salmon (Beacham et ale 1987) and pooled data from southern southeastern Alaskan collections. This analysis was performed using loci for which Beacham et ale (1987) reported data (see Appendix Table A).
,
•
27
British Columbia and Southeast Alaska populations. The
difference between northern British Columbia populations and
populations from inside waters of southern Southeast Alaska is
not large, but significant.
DISCUSSION
The objective of this work was to examine the potential
for starch-gel electrophoresis as a tool to identify or
separate stocks of chum salmon originating near the boundary
between Southeast Alaska and northern British Columbia. In
this preliminary look at subsamples from the collections taken
from Southeast Alaska chum salmon populations, it is apparent
that genetic differentiation in chum salmon has a geographical
basis, and that at least in southern Southeast Alaska,
populations within a region are relatively' similar. The
practical result of the log-likelihood ratio analysis was the
realization that far more heterogeneity exists among regions
than within the regions. The genetic difference between
collections from Prince of Wales Island and collections from
inside waters encompassed by District 101, was highly
significant statistically (Figs. 3, 4). In addition, it
appears from data reported by Beacham et ale (1987), that
populations from the Queen Charlotte Islands are distinct from
Prince of Wales Island populations. These differences are
quite encouraging, especially considering that the data include
only a subsample of the fish in each collection. Even more
28
discrimination may be possible when all the samples have been
analyzed.
To date, banding patterns of 12 to 15 loci and isoloci
have been resolved in the northern boundary area that have
sufficient variability to be useful for stock separation.
These preliminary results are sufficiently encouraging to
warrant 1) analysis of the remainder of the tissues and 2)
continued development of a genetic baseline for chum salmon,
which includes stocks of northern B.C. and uses all the
variable loci so far identified. In 1988, samples were
collected (but are not yet analyzed) from eight northern
British Columbia systems, all representing resamples of
populations studied by Beacham and his colleagues (Appendix
Table B). with the addition of discriminating loci such as
mAat-1, Aat-3, and Est-Of the small difference observed between
some Canadian and Southeast Alaska populations may be
amplified.
•
29
ACKNOWLEDGEMENTS
We appreciate the cooperation and assistance of S. Phelps
and colleagues of the Washington Department of Fisheries.
Their initial efforts at identifying variable loci helped us
considerably .
31
REFERENCES
Aebersold, P. B., G. A. Winans, D. J. Teel, G. B. Milner, and
F. M. utter. 1987. Manual for starch gel
electrophoresis: a method for the detection of genetic
variation. u.S. Dep. Commer., NOAA Tech. Rep. NMFS 61.
Allendorf, F. W., and G. A. Thorgaard. 1984. Tetraploidyand
the evolution of salmonid fishes. Pages 1-53 in B. J.
Turner, (editor). Evolutionary genetics of fishes.
Plenum Press, New York.
Beacham, T. D., A. P. Gould, R. E. Withler, C. B. Murray, and
L. W. Barner. 1987. Biochemical genetic survey and stock
identification of chum salmon (Oncorhynchus keta) in
British Columbia. Can. J. Fish. Aquat. Sci. 44:1702-1713.
Cavalli-Sforza, L. L., and A. W. F. Edwards. 1967.
Phylogenetic analysis: models and estimation procedures.
Evolution 21:550-570.
Clayton, J. W., and D. N. Tretiak. 1972. Amino citrate buffer
for pH control of starch gel electrophoresis. J. Fish.
Res. Board Can. 29:1169-1172.
Felsenstein, J. 1973. Maximum-likelihood estimation of
evolutionary trees from continuous data. Am. J. Hum.
Genet. 25:471-492.
32
Felsenstein, J. 1984. The statistical approach to inferring
evolutionary trees and what it tells us about parsimony
and compatibility. Pages 169-191 in T. Duncan and T. F.
Stuessy, (editors), Cladistics: Perspectives in the
reconstruction of evolutionary history. Columbia Univer.
Press, New York.
Frick, L. 1983. An electrophoretic investigation of the
cytosolic di- and tripeptidases of fish: molecular
weights, substrate specifities, and tissue and
phylogenetic distributions. Biochem. Genet. 21:309-322.
Harris, H., and D. A. Hopkinson. 1976. Handbook of enzyme
electrophoresis in human genetics. American Elsevier
Publ. Co., New York.
Markert, C. L., and I. Falhauber. 1965. Lactate dehydrogenase
isozyme patterns of fish. J. Exp. Zool. 159:319-332.
May, B. 1980. The salmonid genome: evolutionary restructuring
following a tetraploid event. Ph.D. Thesis, Pennsylvania
State Univer., University Park.
Nei, M. 1972. Genetic distance between populations. Amer.
Nat. 106:283-292.
Nei, M. 1978. Estimation of average heterozygosity and
genetic distance from a small number of individuals.
Genetics 89:583-590.
•
33
Ridgway, G. J., S. W. Sherburne, and R. D. Lewis. 1970.
Polymorphisms in the serum esterases of Atlantic herring.
Trans. Am. Fish. Soc. 99:147-151.
Rogers, J. 1972. Measures of genetic similarity and genetic
distance. Studies in Genetics VII. Univ. Texas Publ.
7213:145-153.
Schaal, B. A., and W. W. Anderson. 1974. An outline of
techniques for starch gel electrophoresis of enzymes from
the American oyster Crassostrea virginica Gmelin. Georgia
Marine Science Center Tech. Rep. 74-3.
Shaw, C. R., and R. Prasad. 1970. Starch gel electrophoresis
of enzymes - a compilation of recipes. Biochem. Genet.
4:297-320.
Sneath, P. S., and R. R. Sokal. 1973. Numerical taxonomy. W.
H. Freeman and Company, San Francisco.
Sokal, R. R., and F. J. Rohlf. 1981. Biometry. W. H. Freeman
and Company, San Francisco.
Wilkinson, L. 1986. SYSTAT: the system for statistics.
SYSTAT, Inc., Evanston, IL.
4
APPENDIX
I
,
37
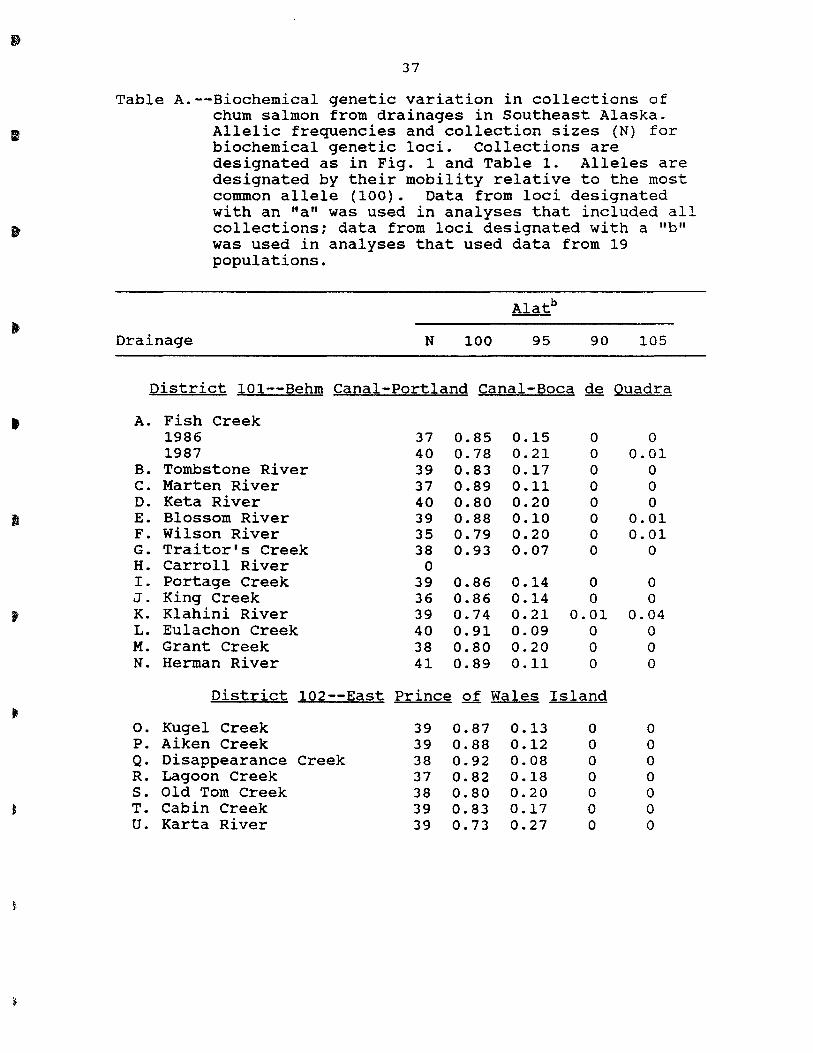
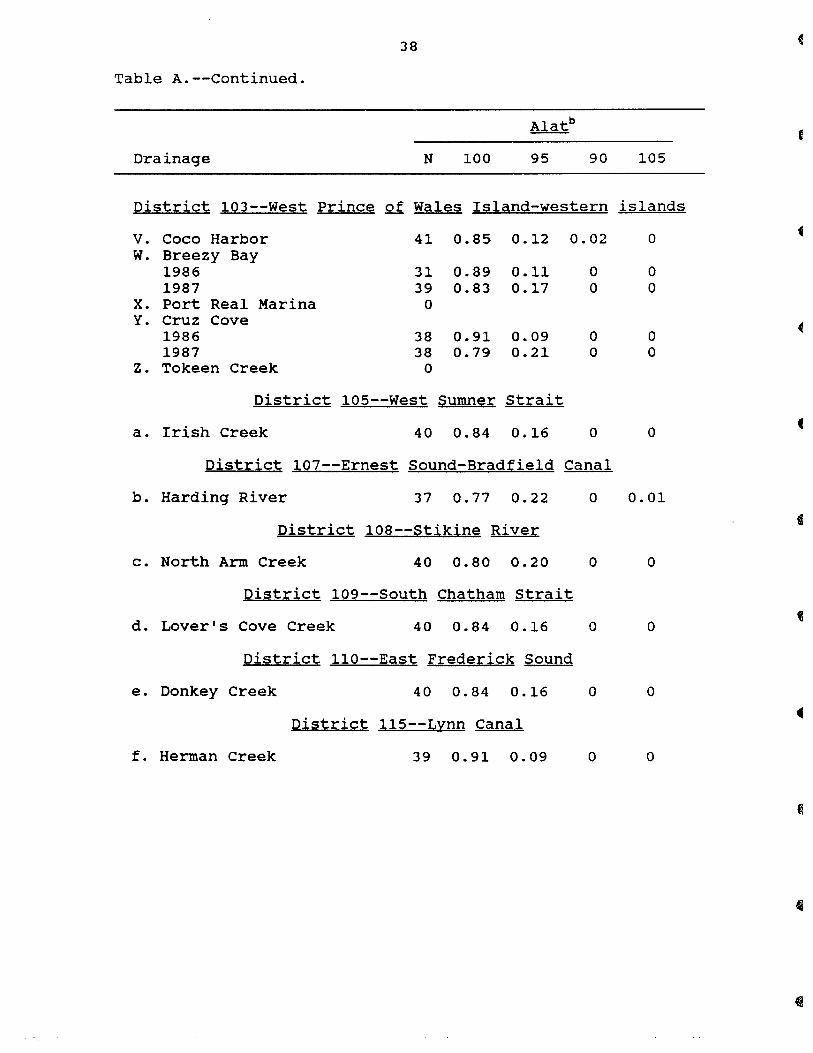
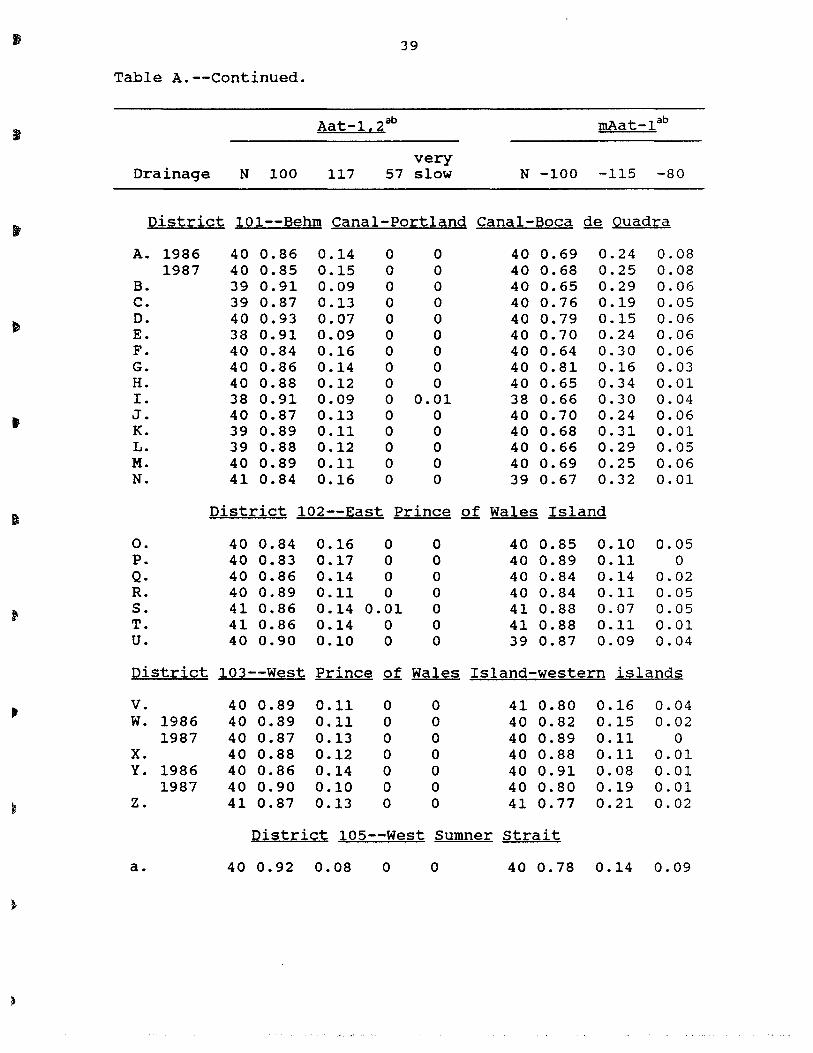
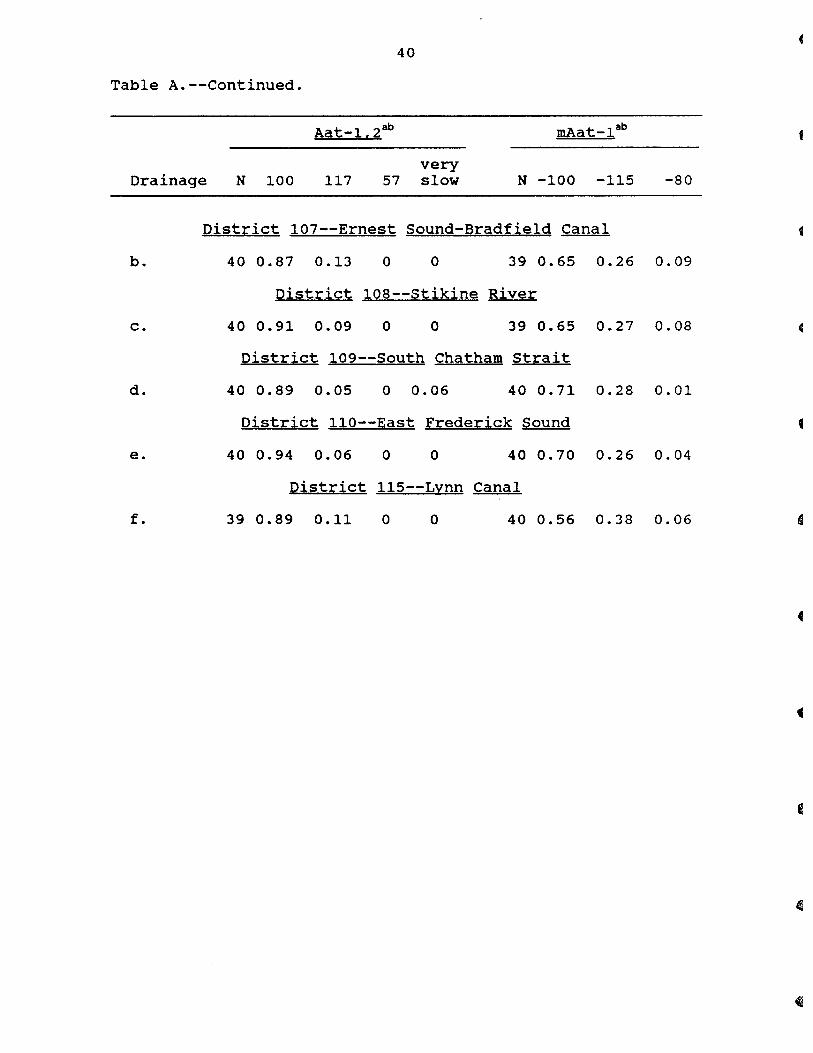
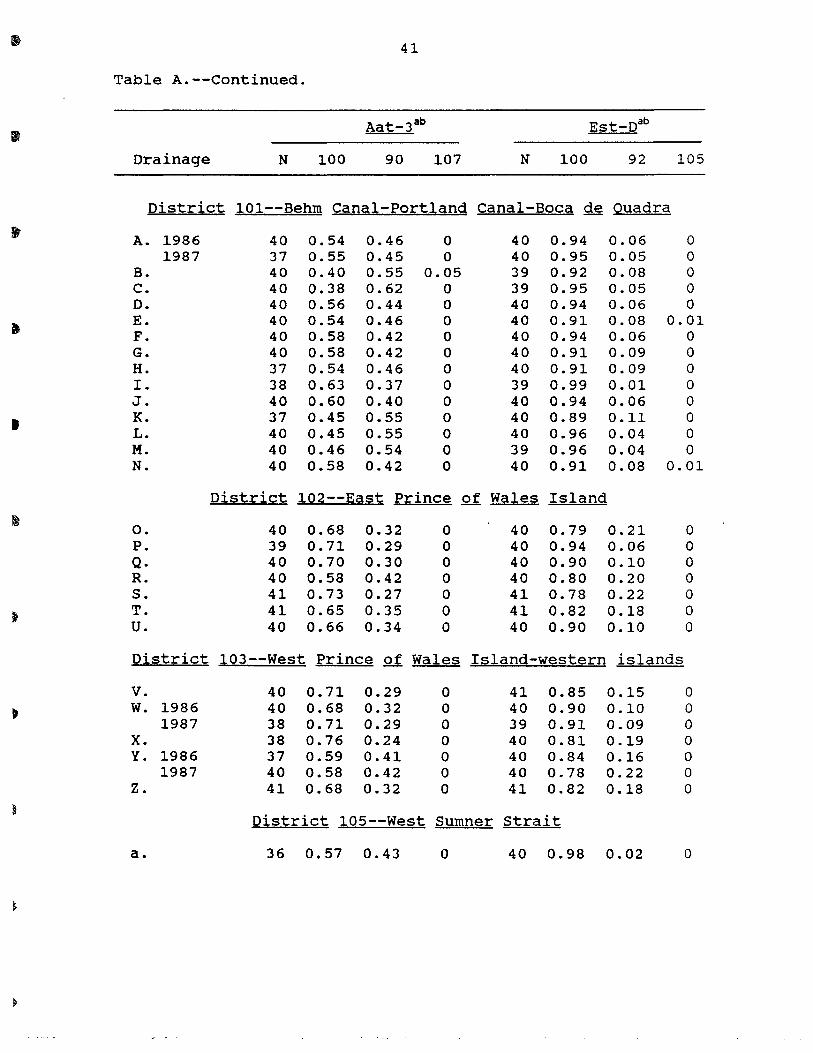
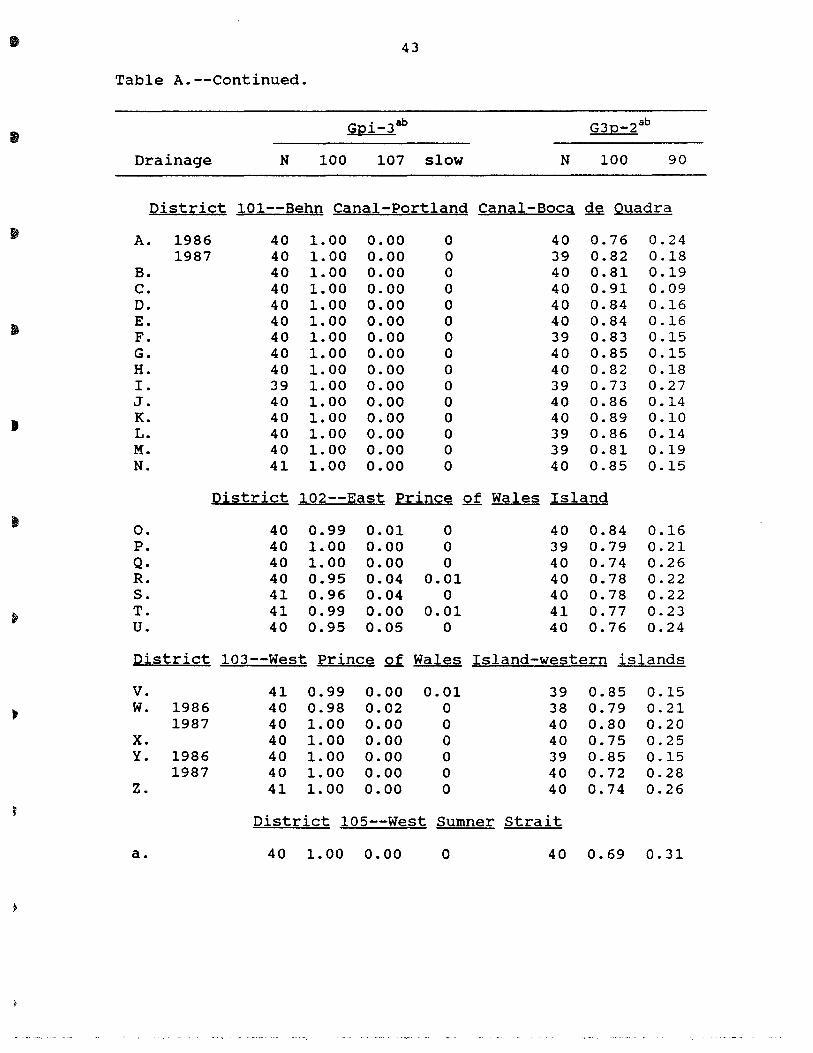
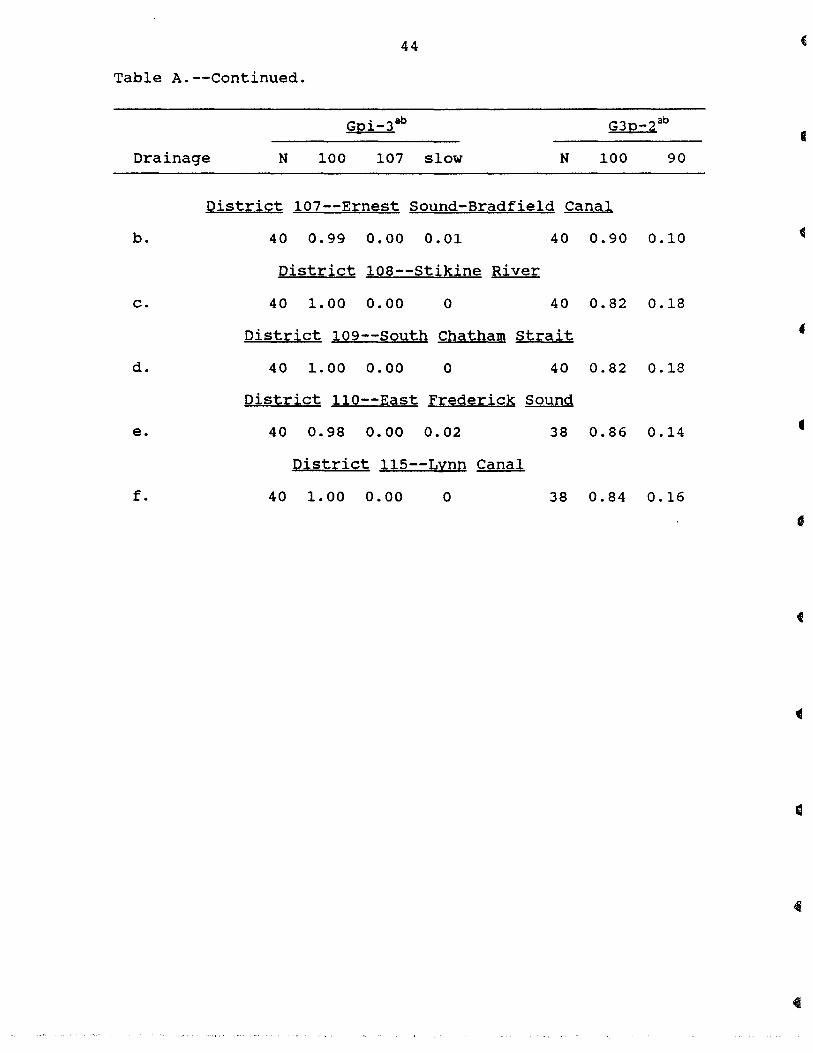
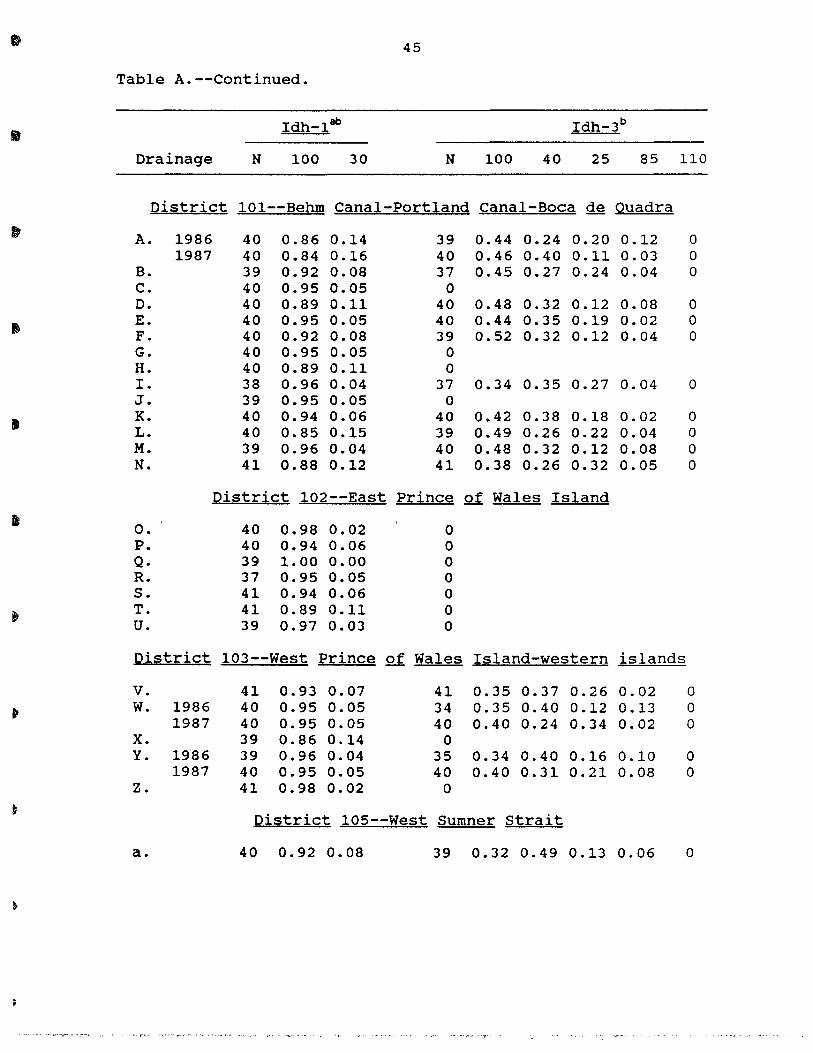
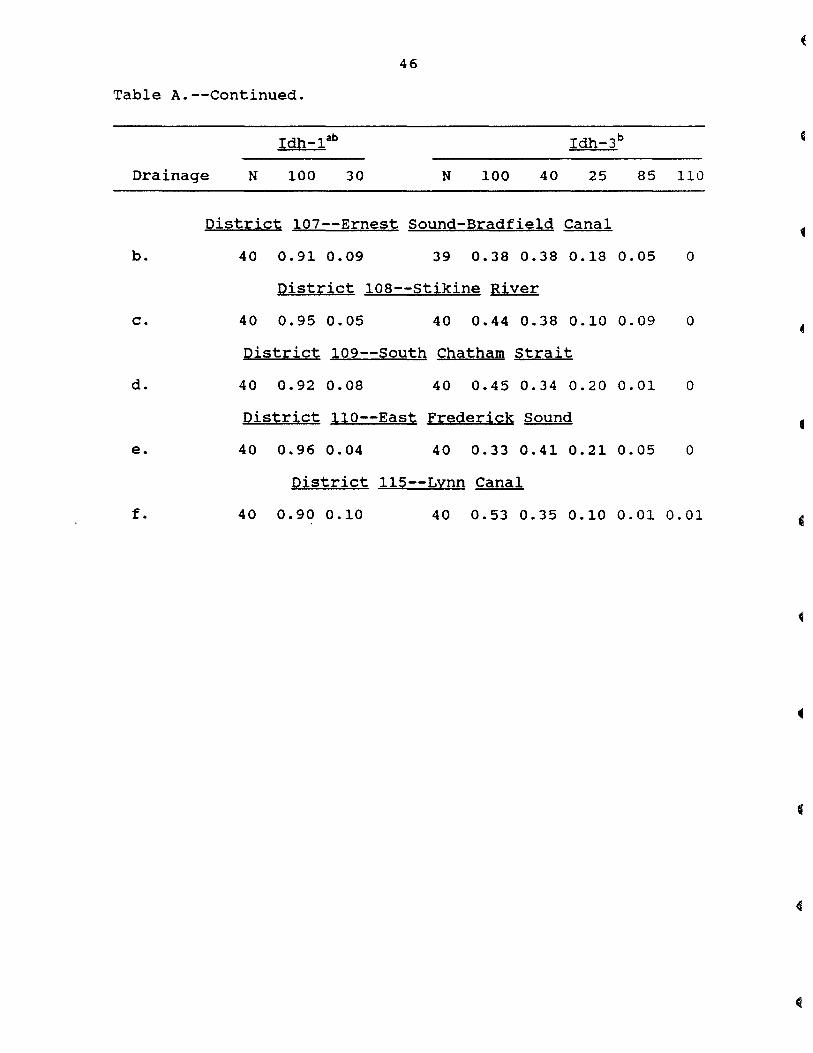
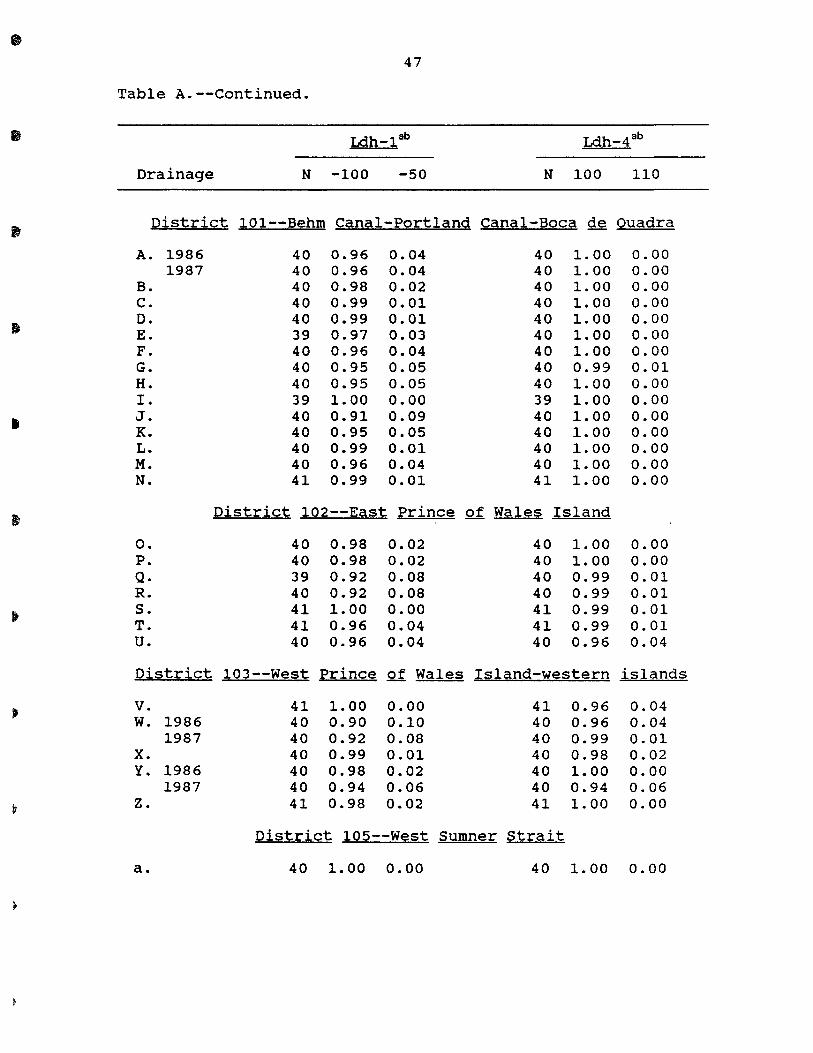
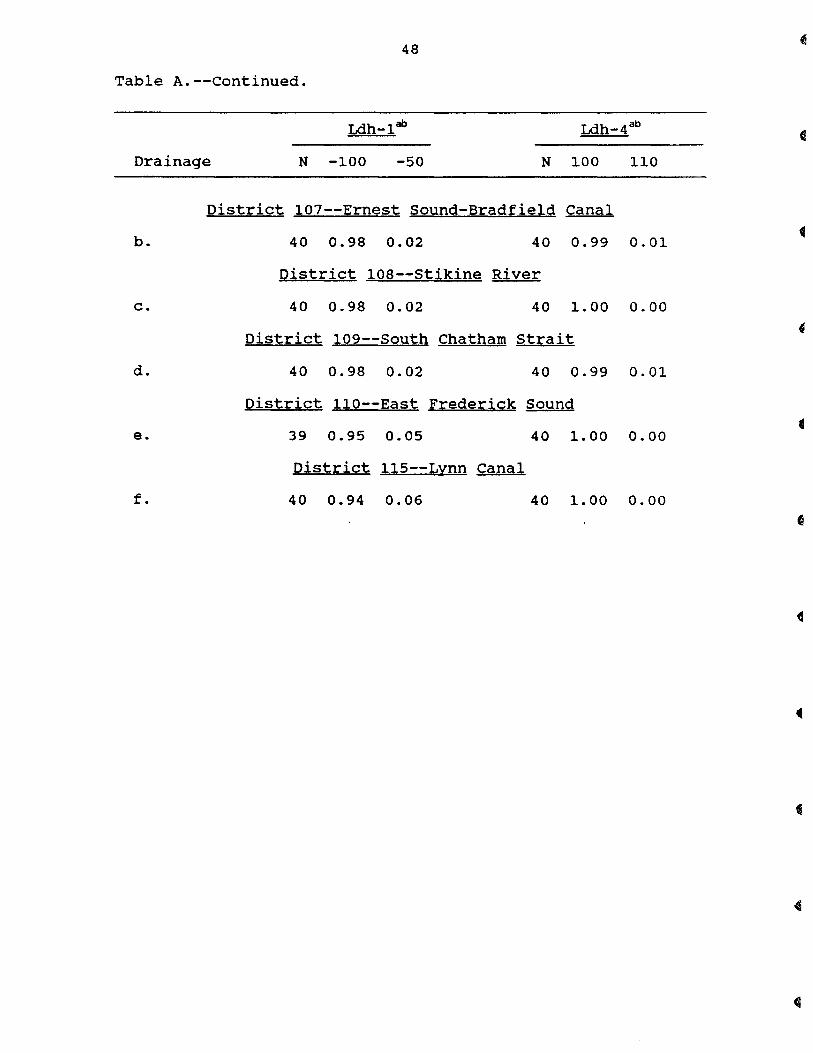
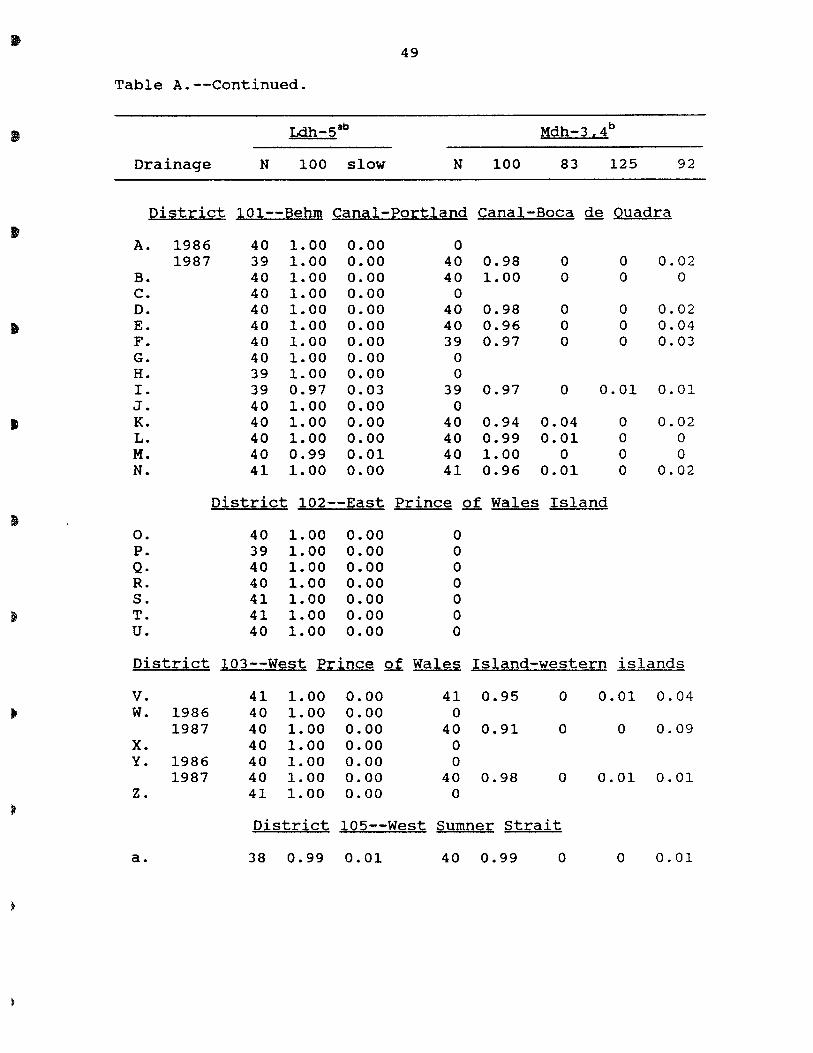
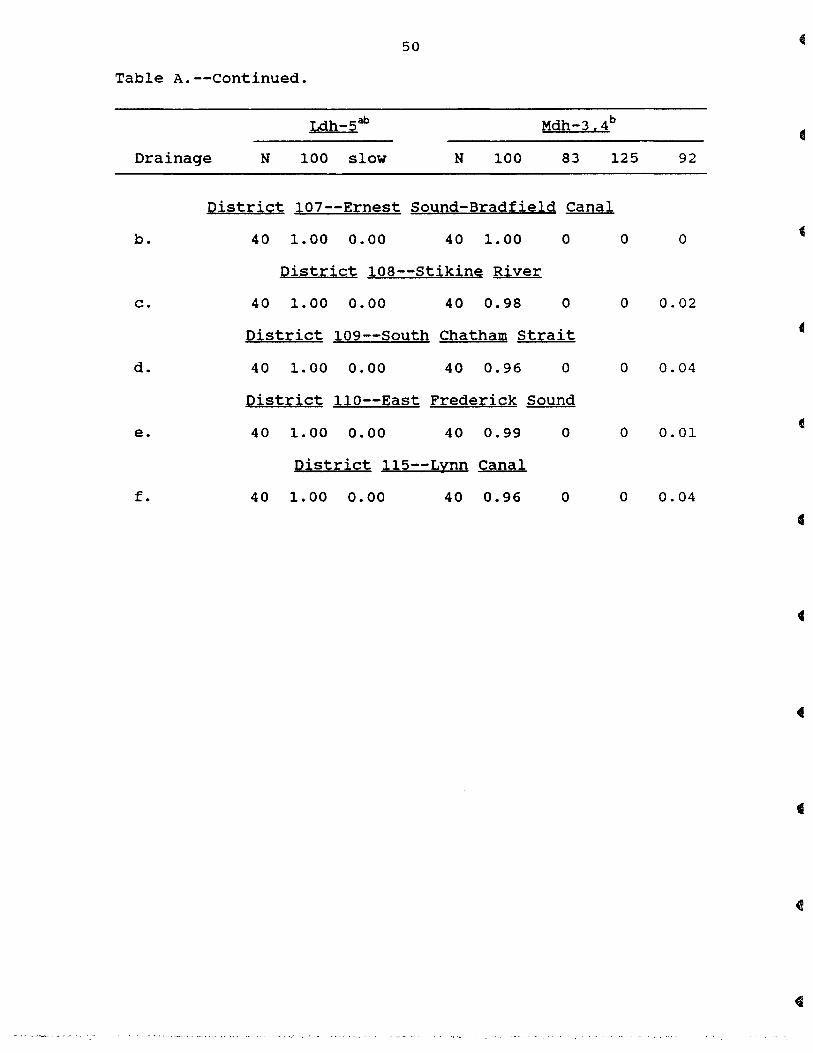
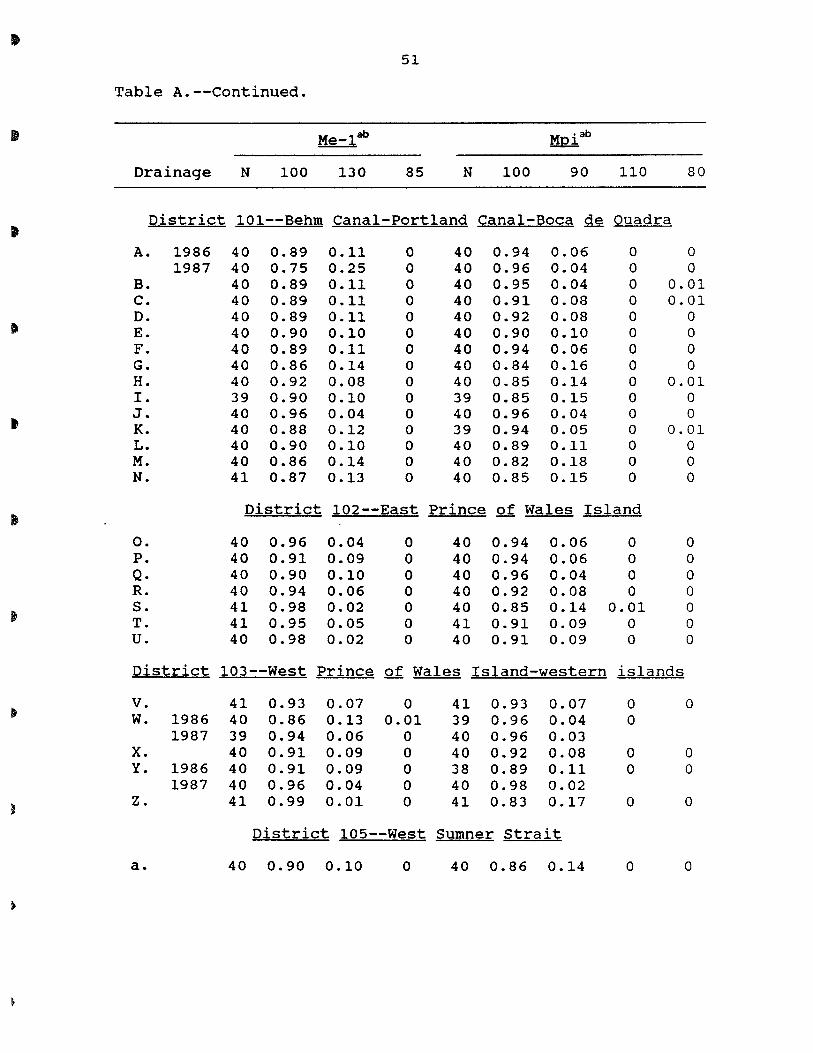
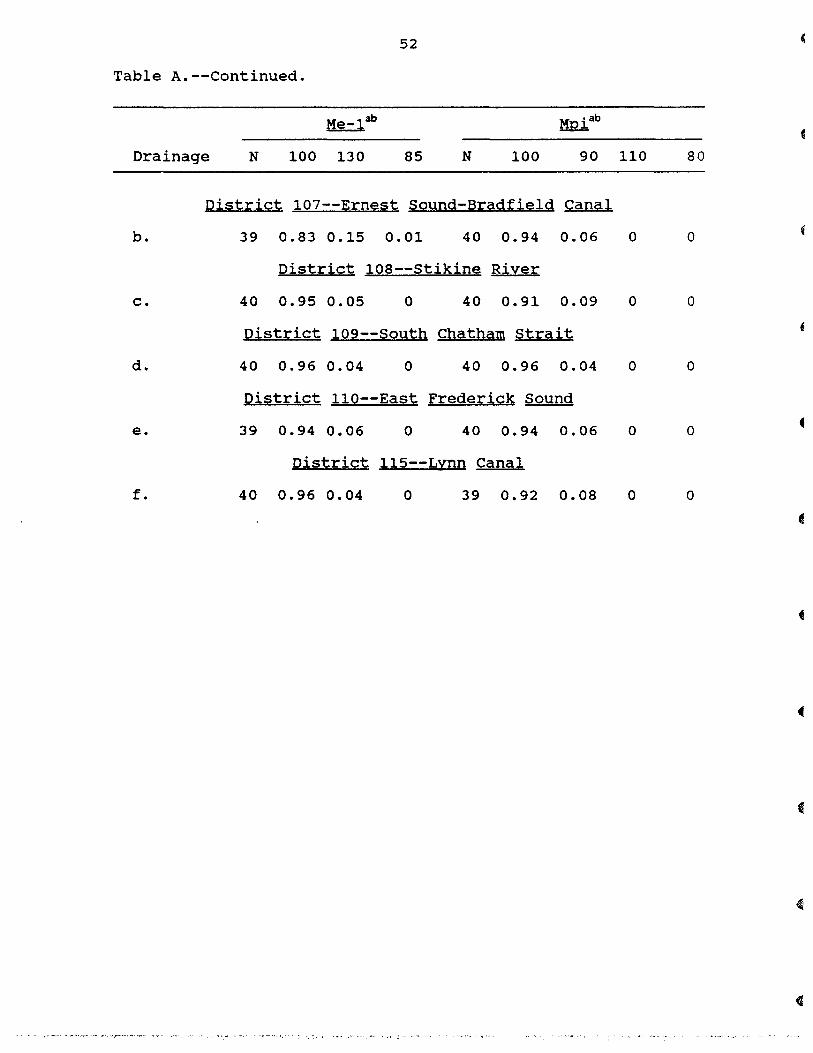
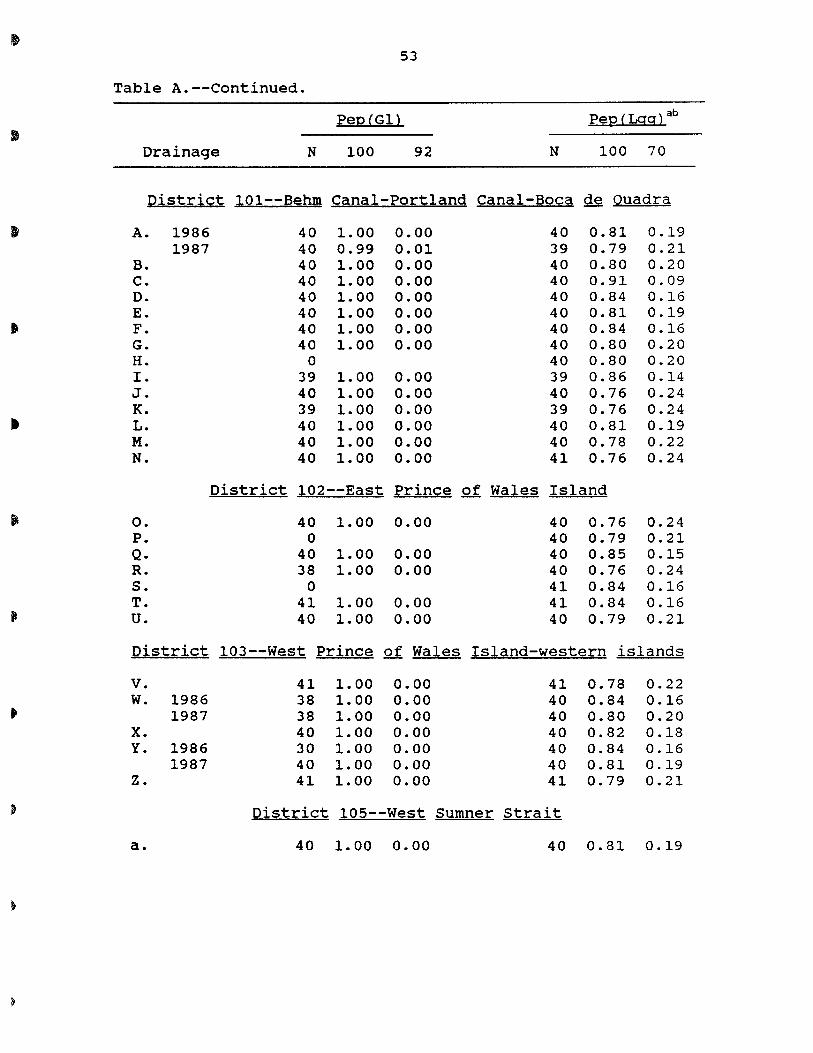
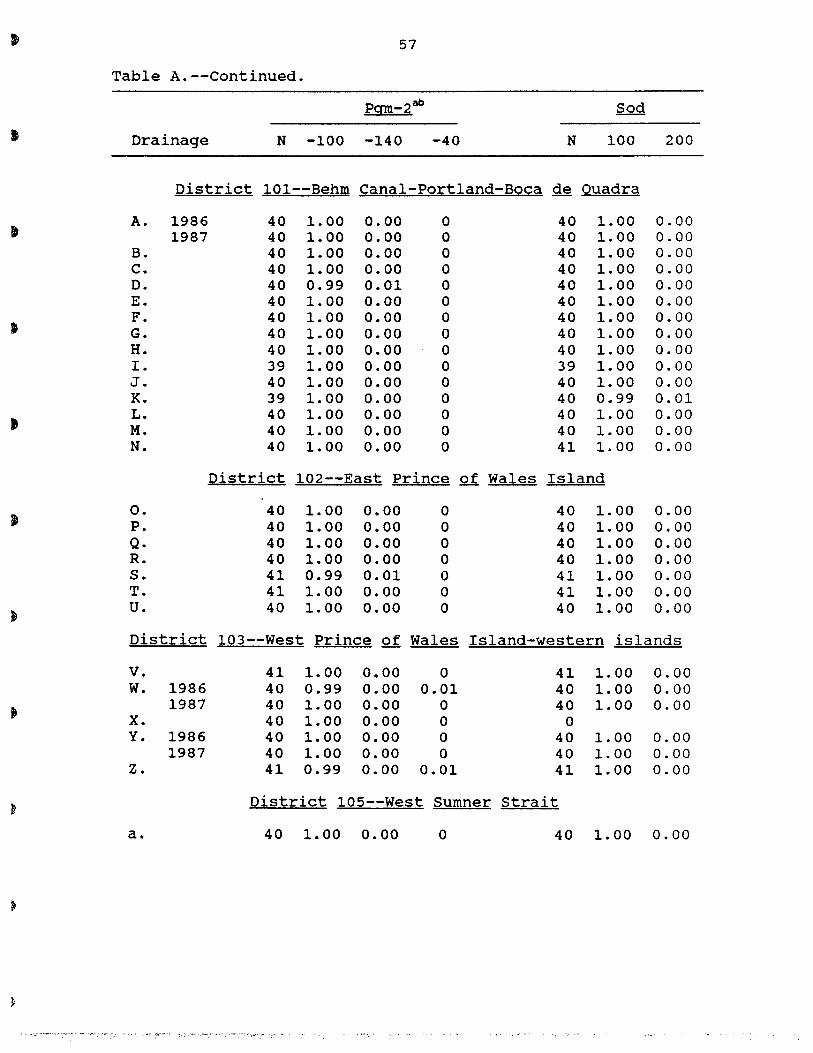
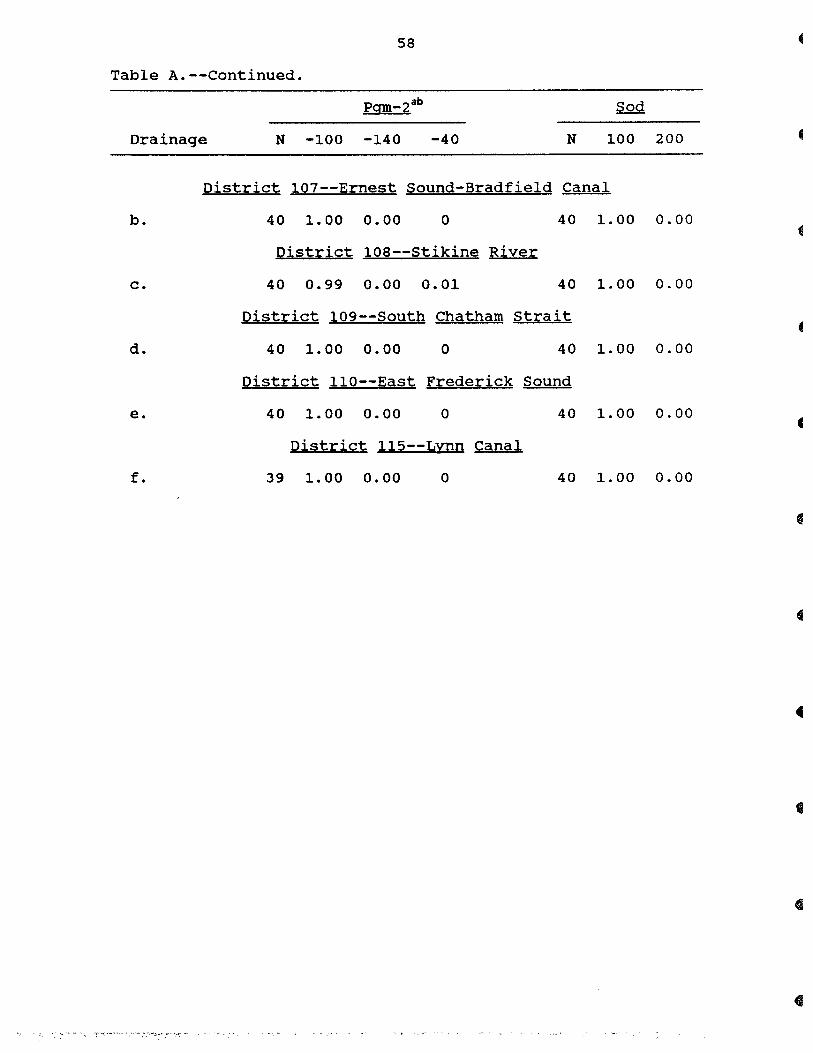
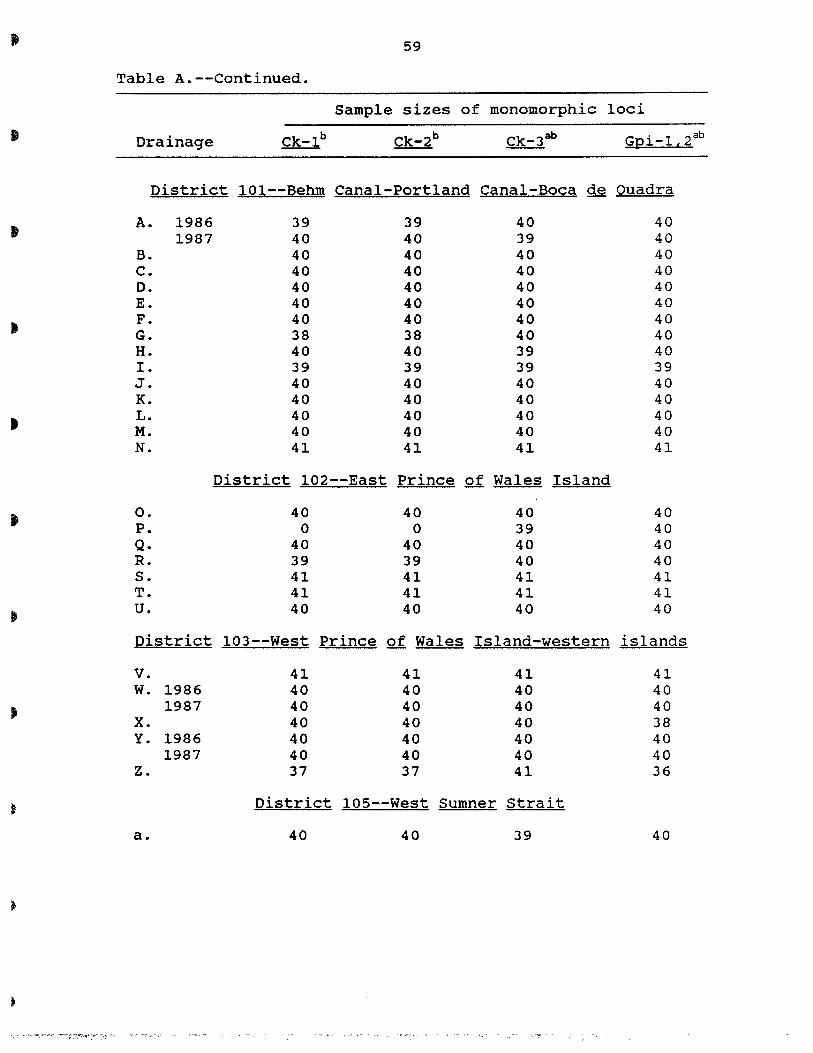
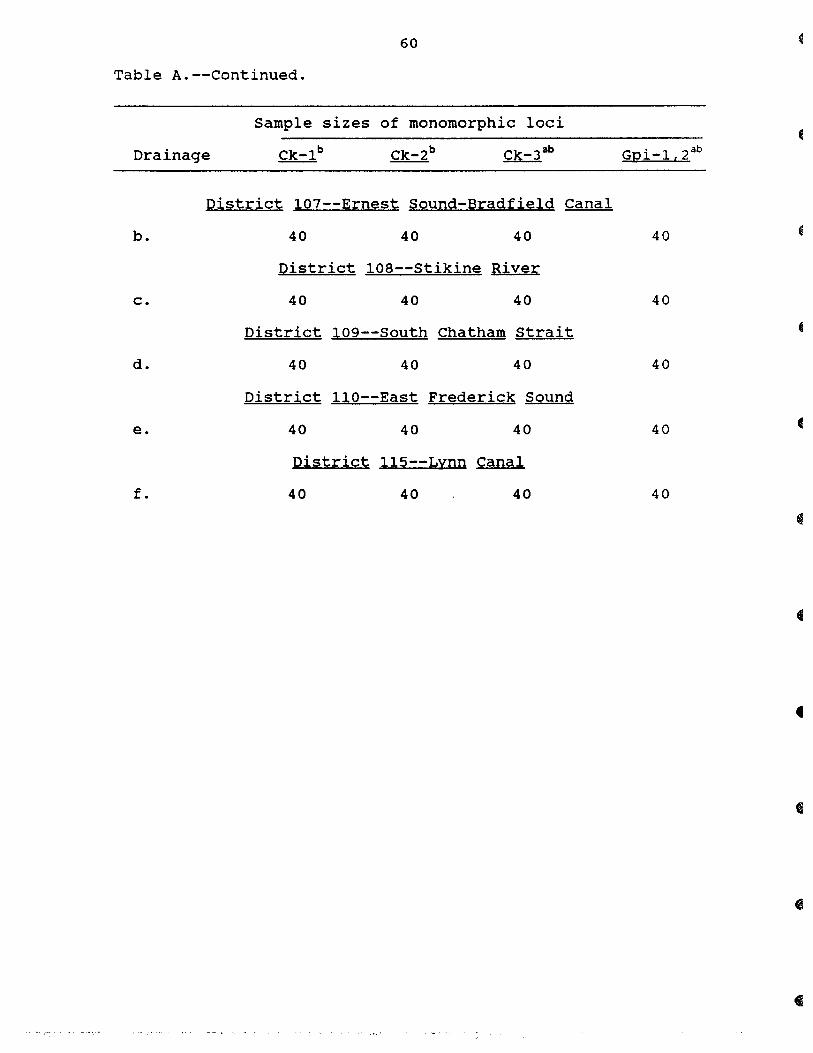
Table A.--Biochemical genetic variation in collections of chum salmon from drainages in Southeast Alaska. Allelic frequencies and collection sizes (N) for biochemical genetic loci. Collections are designated as in Fig. 1 and Table 1. Alleles are designated by their mobility relative to the most common allele (100). Data from loci designated with an "a" was used in analyses that included all collections; data from loci designated with a "b" was used in analyses that used data from 19 populations.
Alatb
Drainage N 100 95 90 105
District 101--Behm Canal-Portland Canal-Boca de Quadra
A. Fish Creek 1986 37 0.85 0.15 0 0 1987 40 0.78 0.21 0 0.01
B. Tombstone River 39 0.83 0.17 0 0 C. Marten River 37 0.89 0.11 0 0 D. Keta River 40 0.80 0.20 0 0 E. Blossom River 39 0.88 0.10 0 0.01 F. Wilson River 35 0.79 0.20 0 0.01 G. Traitor's Creek 38 0.93 0.07 0 0 H. Carroll River 0 I. Portage Creek 39 0.86 0.14 0 0 J. King Creek 36 0.86 0.14 0 0 K. Klahini River 39 0.74 0.21 0.01 0.04 L. Eulachon Creek 40 0.91 0.09 0 0 M. Grant Creek 38 0.80 0.20 0 0 N. Herman River 41 0.89 0.11 0 0
District 102--East Prince of Wales Island
O. Kugel Creek 39 0.87 0.13 0 0 P. Aiken Creek 39 0.88 0.12 0 0 Q. Disappearance Creek 38 0.92 0.08 0 0 R. Lagoon Creek 37 0.82 0.18 0 0 S. Old Tom Creek 38 0.80 0.20 0 0 T. Cabin Creek 39 0.83 0.17 0 0 U. Karta River 39 0.73 0.27 0 0
38
Table A.--continued.
Alatb
Drainage N 100 95 90 105
District 103--West Prince Qf Wales Island-western islands
v. Coco Harbor 41 0.85 0.12 0.02 0 W. Breezy Bay
1986 31 0.89 0.11 0 0 1987 39 0.83 0.17 0 0
x. Port Real Marina 0 Y. Cruz Cove
1986 38 0.91 0.09 0 0 1987 38 0.79 0.21 0 0
z. Tokeen Creek 0
District 105--West Sumner strait
a. Irish Creek 40 0.84 0.16 o o
District 107--Ernest Sound-Bradfield Canal
b. Harding River 37 0.77 0.22 o 0.01
District 108--Stikine River
c. North Arm Creek 40 0.80 0.20 o o
District 109--South Chatham strait
d. Lover's Cove Creek 40 0.84 0.16 o o
District 110--East Frederick Sound
e. Donkey Creek 40 0.84 0.16 o o
District 115--Lynn Canal
f. Herman Creek 39 0.91 0.09 o o
39
Table A.--continued.
Aat-l, ~ab mAat-1ab
very Drainage N 100 117 57 slow N -100 -115 -80
District 101--Behm Canal-Portland Canal-Boca de Quadra
A. 1986 40 0.86 0.14 0 0 40 0.69 0.24 0.08 1987 40 0.85 0.15 0 0 40 0.68 0.25 0.08
B. 39 0.91 0.09 0 0 40 0.65 0.29 0.06 C. 39 0.87 0.13 0 0 40 0.76 0.19 0.05 D. 40 0.93 0.07 0 0 40 0.79 0.15 0.06 E. 38 0.91 0.09 0 0 40 0.70 0.24 0.06 F. 40 0.84 0.16 0 0 40 0.64 0.30 0.06 G. 40 0.86 0.14 0 0 40 0.81 0.16 0.03 H. 40 0.88 0.12 0 0 40 0.65 0.34 0.01 I. 38 0.91 0.09 0 0.01 38 0.66 0.30 0.04 J. 40 0.87 0.13 0 0 40 0.70 0.24 0.06 K. 39 0.89 0.11 0 0 40 0.68 0.31 0.01 L. 39 0.88 0.12 0 0 40 0.66 0.29 0.05 M. 40 0.89 0.11 0 0 40 0.69 0.25 0.06 N. 41 0.84 0.16 0 0 39 0.67 0.32 0.01
District 102--East Prince of Wales Island
O. 40 0.84 0.16 0 0 40 0.85 0.10 0.05 P. 40 0.83 0.17 0 0 40 0.89 0.11 0 Q. 40 0.86 0.14 0 0 40 0.84 0.14 0.02 R. 40 0.89 0.11 0 0 40 0.84 0.11 0.05 S. 41 0.86 0.14 0.01 0 41 0.88 0.07 0.05 T. 41 0.86 0.14 0 0 41 0.88 0.11 0.01 U. 40 0.90 0.10 0 0 39 0.87 0.09 0.04
District 103--West Prince of Wales Island-western islands
V. 40 0.89 0.11 0 0 41 0.80 0.16 0.04 W. 1986 40 0.89 0.11 0 0 40 0.82 0.15 0.02
1987 40 0.87 0.13 0 0 40 0.89 0.11 0 X. 40 0.88 0.12 0 0 40 0.88 0.11 0.01 Y. 1986 40 0.86 0.14 0 0 40 0.91 0.08 0.01
1987 40 0.90 0.10 0 0 40 0.80 0.19 0.01 Z. 41 0.87 0.13 0 0 41 0.77 0.21 0.02
District 105--West Sumner strait
a. 40 0.92 0.08 0 0 40 0.78 0.14 0.09
40
Table A.--Continued.
Drainage N 100
Aat-1« 2ab
117 very
57 slow
mAat-1ab
N -100 -115 -80
District 107--Ernest Sound-Bradfield Canal
b. 40 0.87 0.13 o o 39 0.65 0.26 0.09
District 108--Stikine River
c. 40 0.91 0.09 o o 39 0.65 0.27 0.08
District 109--South Chatham strait
d. 40 0.89 0.05 0 0.06 40 0.71 0.28 0.01
District 110--East Frederick Sound
e. 40 0.94 0.06 0 0 40 0.70 0.26 0.04
District 115--Lynn Canal
f. 39 0.89 0.11 0 0 40 0.56 0.38 0.06
41
Table A.--Continued.
Aat-3 ab Est-Dab
Drainage N 100 90 107 N 100 92 105
District 101--Behm Canal-Portland Canal-Boca de Quadra
A. 1986 40 0.54 0.46 0 40 0.94 0.06 0 1987 37 0.55 0.45 0 40 0.95 0.05 0
B. 40 0.40 0.55 0.05 39 0.92 0.08 0 C. 40 0.38 0.62 0 39 0.95 0.05 0 D. 40 0.56 0.44 0 40 0.94 0.06 0 E. 40 0.54 0.46 0 40 0.91 0.08 0.01 F. 40 0.58 0.42 0 40 0.94 0.06 0 G. 40 0.58 0.42 0 40 0.91 0.09 0 H. 37 0.54 0.46 0 40 0.91 0.09 0 I. 38 0.63 0.37 0 39 0.99 0.01 0 J. 40 0.60 0.40 0 40 0.94 0.06 0
• K. 37 0.45 0.55 0 40 0.89 0.11 0 L. 40 0.45 0.55 0 40 0.96 0.04 0 M. 40 0.46 0.54 0 39 0.96 0.04 0 N. 40 0.58 0.42 0 40 0.91 0.08 0.01
District 102--East Prince Q.{ Wales Island
o. 40 0.68 0.32 0 40 0.79 0.21 0 P. 39 0.71 0.29 0 40 0.94 0.06 0 Q. 40 0.70 0.30 0 40 0.90 0.10 0 R. 40 0.58 0.42 0 40 0.80 0.20 0 S. 41 0.73 0.27 0 41 0.78 0.22 0 T. 41 0.65 0.35 0 41 0.82 0.18 0 U. 40 0.66 0.34 0 40 0.90 0.10 0
District 103--West Prince Q.{ Wales Island-western islands
V. 40 0.71 0.29 0 41 0.85 0.15 0 W. 1986 40 0.68 0.32 0 40 0.90 0.10 0
1987 38 0.71 0.29 0 39 0.91 0.09 0 x. 38 0.76 0.24 0 40 0.81 0.19 0 Y. 1986 37 0.59 0.41 0 40 0.84 0.16 0
1987 40 0.58 0.42 0 40 0.78 0.22 0 z. 41 0.68 0.32 0 41 0.82 0.18 0
District 105--West Sumner strait
a. 36 0.57 0.43 0 40 0.98 0.02 0
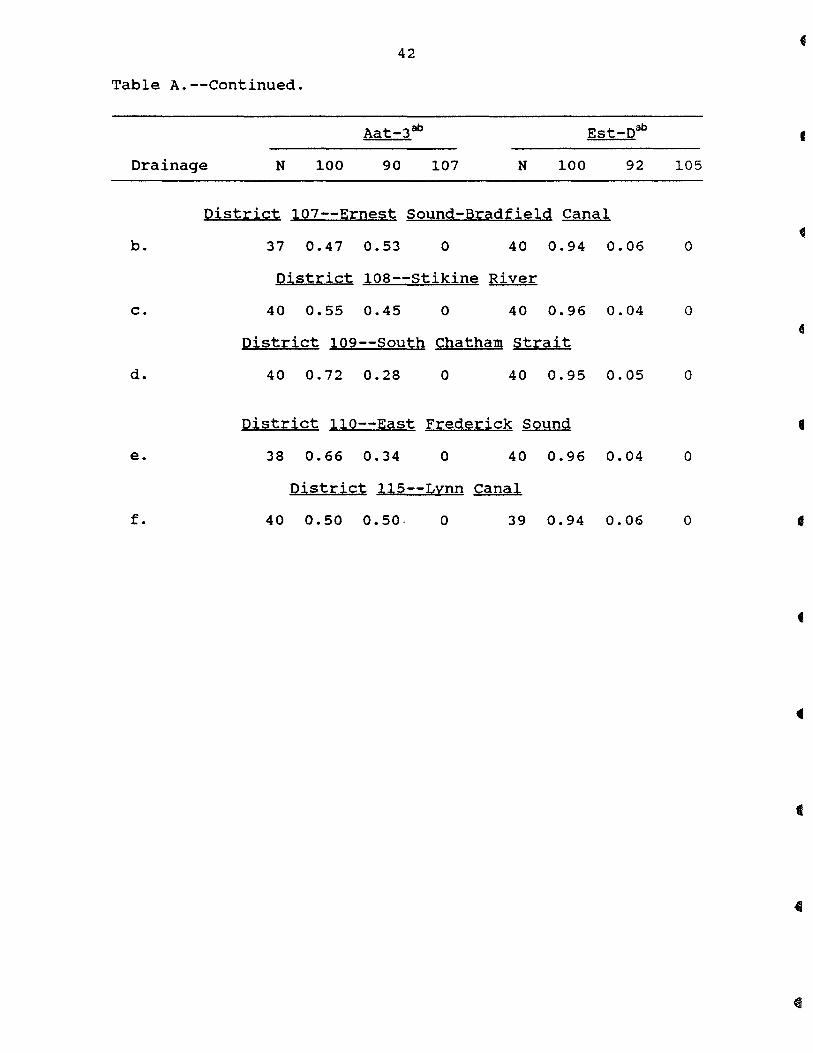
42
Table A.--Continued.
Aat-3 ab Est-Dab • Drainage N 100 90 107 N 100 92 105
District 107--Ernest Sound-Bradfield Canal
b. 37 0.47 0.53 0 40 0.94 0.06 o
District 108--stikine River
c. 40 0.55 0.45 o 40 0.96 0.04 a
District 109--South Chatham strait
d. 40 0.72 0.28 0 40 0.95 0.05 a
District 110--East Frederick Sound • e. 38 0.66 0.34 0 40 0.96 0.04 a
District 115--Lynn Canal
f. 40 0.50 0.50· 0 39 0.94 0.06 a
43
Table A.--continued.
GQi-3ab G3Q-2 ab
Drainage N 100 107 slow N 100 90
District 101--Behn Canal-Portland Canal-Boca de Quadra
A. 1986 40 1. 00 0.00 0 40 0.76 0.24 1987 40 1.00 0.00 0 39 0.82 0.18
B. 40 1.00 0.00 0 40 0.81 0.19 C. 40 1.00 0.00 0 40 0.91 0.09 D. 40 1.00 0.00 0 40 0.84 0.16 E. 40 1. 00 0.00 0 40 0.84 0.16 F. 40 1. 00 0.00 0 39 0.83 0.15 G. 40 1.00 0.00 0 40 0.85 0.15 H. 40 1. 00 0.00 0 40 0.82 0.18 I. 39 1.00 0.00 0 39 0.73 0.27 J. 40 1. 00 0.00 0 40 0.86 0.14
• K. 40 1.00 0.00 0 40 0.89 0.10 L. 40 1.00 0.00 0 39 0.86 0.14 M. 40 1.00 0.00 0 39 0.81 0.19 N. 41 1.00 0.00 0 40 0.85 0.15
District 102--East Prince of Wales Island
O. 40 0.99 0.01 0 40 0.84 0.16 P. 40 1.00 0.00 0 39 0.79 0.21 Q. 40 1.00 0.00 0 40 0.74 0.26 R. 40 0.95 0.04 0.01 40 0.78 0.22 S. 41 0.96 0.04 0 40 0.78 0.22 T. 41 0.99 0.00 0.01 41 0.77 0.23 U. 40 0.95 0.05 0 40 0.76 0.24
District 103--West Prince Qf Wales Island-western islands
V. 41 0.99 0.00 0.01 39 0.85 0.15 W. 1986 40 0.98 0.02 0 38 0.79 0.21
1987 40 1.00 0.00 0 40 0.80 0.20 X. 40 1.00 0.00 0 40 0.75 0.25 Y. 1986 40 1.00 0.00 0 39 0.85 0.15
1987 40 1. 00 0.00 0 40 0.72 0.28 Z. 41 1. 00 0.00 0 40 0.74 0.26
District 105--West Sumner Strait
a. 40 1.00 0.00 0 40 0.69 0.31
44
Table A.--continued.
Gpi-3ab G3p-2 3b
• Drainage N 100 107 slow N 100 90
District 107--Ernest Sound-Bradfield Canal
b. 40 0.99 0.00 0.01 40 0.90 0.10
District 108--Stikine River
c. 40 1. 00 0.00 0 40 0.82 0.18
District 109--South Chatham strait 4
d. 40 1.00 0.00 0 40 0.82 0.18
Qist;;;:j,ct 110--East F;:~de;;;:icK Sound
e. 40 0.98 0.00 0.02 38 0.86 0.14 • District 115--Lynn Canal
f. 40 1. 00 0.00 0 38 0.84 0.16
45
Table A.--Continued.
Idh-lab Idh-3b
Drainage N 100 30 N 100 40 25 85 110
District 101--Behm Canal-Portland Canal-Boca de Quadra
A. 1986 40 0.86 0.14 39 0.44 0.24 0.20 0.12 0 1987 40 0.84 0.16 40 0.46 0.40 0.11 0.03 0
B. 39 0.92 0.08 37 0.45 0.27 0.24 0.04 0 C. 40 0.95 0.05 0 D. 40 0.89 0.11 40 0.48 0.32 0.12 0.08 0 E. 40 0.95 0.05 40 0.44 0.35 0.19 0.02 0 F. 40 0.92 0.08 39 0.52 0.32 0.12 0.04 0 G. 40 0.95 0.05 0 H. 40 0.89 0.11 0 I. 38 0.96 0.04 37 0.34 0.35 0.27 0.04 0 J. 39 0.95 0.05 0
• K. 40 0.94 0.06 40 0.42 0.38 0.18 0.02 0 L. 40 0.85 0.15 39 0.49 0.26 0.22 0.04 0 M. 39 0.96 0.04 40 0.48 0.32 0.12 0.08 0 N. 41 0.88 0.12 41 0.38 0.26 0.32 0.05 0
District 102--East Prince .Q.f Wales Island
o. 40 0.98 0.02 0 P. 40 0.94 0.06 0 Q. 39 1.00 0.00 0 R. 37 0.95 0.05 0 S. 41 0.94 0.06 0 T. 41 0.89 0.11 0 U. 39 0.97 0.03 0
District 103--West Prince of Wales Island-western islands
v. 41 0.93 0.07 41 0.35 0.37 0.26 0.02 0 W. 1986 40 0.95 0.05 34 0.35 0.40 0.12 0.13 0
1987 40 0.95 0.05 40 0.40 0.24 0.34 0.02 0 x. 39 0.86 0.14 0 Y. 1986 39 0.96 0.04 35 0.34 0.40 0.16 0.10 0
1987 40 0.95 0.05 40 0.40 0.31 0.21 0.08 0 z. 41 0.98 0.02 0
District 105--West Sumner strait
a. 40 0.92 0.08 39 0.32 0.49 0.13 0.06 0
46
Table A.--Continued.
Idh-1~
Drainage N 100 30 N 100 40 25 85 110
District 107--Ernest Sound-Bradfield Canal
b. 40 0.91 0.09 39 0.38 0.38 0.18 0.05 o
District 108--stikine River
c. 40 0.95 0.05 40 0.44 0.38 0.10 0.09 o
District 109--South Chatham strait
d. 40 0.92 0.08 40 0.45 0.34 0.20 0.01 o
District 110--East Frederick Sound • e. 40 0.96 0.04 40 0.33 0.41 0.21 0.05 o
District 115--LYnn Canal
f. 40 0.90 0.10 40 0.53 0.35 0.10 0.01 0.01
47
Table A.--Continued.
Ldh-1ab Ldh-4 ab
Drainage N -100 -50 N 100 110
District 101--Behm Canal-Portland Canal-Boca de Quadra
A. 1986 40 0.96 0.04 40 1.00 0.00 1987 40 0.96 0.04 40 1. 00 0.00
B. 40 0.98 0.02 40 1. 00 0.00 C. 40 0.99 0.01 40 1. 00 0.00 D. 40 0.99 0.01 40 1.00 0.00 E. 39 0.97 0.03 40 1.00 0.00 F. 40 0.96 0.04 40 1. 00 0.00 G. 40 0.95 0.05 40 0.99 0.01 H. 40 0.95 0.05 40 1. 00 0.00 I. 39 1.00 0.00 39 1. 00 0.00
• J. 40 0.91 0.09 40 1.00 0.00 K. 40 0.95 0.05 40 1.00 0.00 L. 40 0.99 0.01 40 1. 00 0.00 M. 40 0.96 0.04 40 1.00 0.00 N. 41 0.99 0.01 41 1.00 0.00
District 102--East Prince of Wales Island
o. 40 0.98 0.02 40 1.00 0.00 P. 40 0.98 0.02 40 1. 00 0.00 Q. 39 0.92 0.08 40 0.99 0.01 R. 40 0.92 0.08 40 0.99 0.01 S. 41 1. 00 0.00 41 0.99 0.01 T. 41 0.96 0.04 41 0.99 0.01 U. 40 0.96 0.04 40 0.96 0.04
District 103--West Prince 2i Wales Island-western islands
V. 41 1. 00 0.00 41 0.96 0.04 W. 1986 40 0.90 0.10 40 0.96 0.04
1987 40 0.92 0.08 40 0.99 0.01 X. 40 0.99 0.01 40 0.98 0.02 Y. 1986 40 0.98 0.02 40 1. 00 0.00
1987 40 0.94 0.06 40 0.94 0.06 Z. 41 0.98 0.02 41 1. 00 0.00
District 105--West Sumner Strait
a. 40 1. 00 0.00 40 1.00 0.00
48
Table A.--Continued.
Ldh-lab Ldh-4 ab
Drainage N -100 -50 N 100 110
District 107--Ernest Sound-Bradfield Canal
b. 40 0.98 0.02 40 0.99 0.01
District 108--Stikine River
c. 40 0.98 0.02 40 1.00 0.00
District 109--South Chatham Strait
d. 40 0.98 0.02 40 0.99 0.01
District 110--East Frederick Sound
• e. 39 0.95 0.05 40 1.00 0.00
District 115--Lynn Canal
f. 40 0.94 0.06 40 1.00 0.00
49
Table A.--Continued.
Ldh-5ab Mdh-3,4b
Drainage N 100 slow N 100 83 125 92
District 101--Behm Canal-Portland Canal-Boca de Quadra
A. 1986 40 1.00 0.00 0 1987 39 1.00 0.00 40 0.98 0 0 0.02
B. 40 1.00 0.00 40 1. 00 0 0 0 C. 40 1. 00 0.00 0 D. 40 1.00 0.00 40 0.98 0 0 0.02 E. 40 1. 00 0.00 40 0.96 0 0 0.04 F. 40 1. 00 0.00 39 0.97 0 0 0.03 G. 40 1.00 0.00 0 H. 39 1.00 0.00 0 I. 39 0.97 0.03 39 0.97 0 0.01 0.01 J. 40 1.00 0.00 0
• K. 40 1. 00 0.00 40 0.94 0.04 0 0.02 L. 40 1.00 0.00 40 0.99 0.01 0 0 M. 40 0.99 0.01 40 1. 00 0 0 0 N. 41 1.00 0.00 41 0.96 0.01 0 0.02
District 102--East Prince of Wales Island
O. 40 1.00 0.00 0 P. 39 1.00 0.00 0 Q. 40 1.00 0.00 0 R. 40 1. 00 0.00 0 S. 41 1. 00 0.00 0 T. 41 1. 00 0.00 0 U. 40 1.00 0.00 0
District 103--West Prince of Wales Island-western islands
V. 41 1.00 0.00 41 0.95 0 0.01 0.04 W. 1986 40 1.00 0.00 0
1987 40 1.00 0.00 40 0.91 0 0 0.09 X. 40 1. 00 0.00 0 Y. 1986 40 1. 00 0.00 0
1987 40 1. 00 0.00 40 0.98 0 0.01 0.01 Z. 41 1. 00 0.00 0
District 105--West Sumner Strait
a. 38 0.99 0.01 40 0.99 0 0 0.01
50
Table A.--continued.
Ldh-5ab Mdh-3,4b
Drainage N 100 slow N 100 83 125 92
District 107--Ernest Sound-Bradfield Canal
b. 40 1.00 0.00 40 1.00 0 0 0
pistrict 108--Stikine River
c. 40 1.00 0.00 40 0.98 0 0 0.02
District 109--South Chatham strait
d. 40 1. 00 0.00 40 0.96 0 0 0.04
District 110--East Frederick Sound
e. 40 1.00 0.00 40 0.99 0 0 0.01
pistrict 115--Lynn Canal
f. 40 1.00 0.00 40 0.96 0 0 0.04
c
51
Table A.--Continued.
Me-lab Mpiab
Drainage N 100 130 85 N 100 90 110 80
District 101--Behm Canal-Portland Canal-Boca de Quadra
A. 1986 40 0.89 0.11 0 40 0.94 0.06 0 0 1987 40 0.75 0.25 0 40 0.96 0.04 0 0
B. 40 0.89 0.11 0 40 0.95 0.04 0 0.01 C. 40 0.89 0.11 0 40 0.91 0.08 0 0.01 D. 40 0.89 0.11 0 40 0.92 0.08 0 0 E. 40 0.90 0.10 0 40 0.90 0.10 0 0 F. 40 0.89 0.11 0 40 0.94 0.06 0 0 G. 40 0.86 0.14 0 40 0.84 0.16 0 0 H. 40 0.92 0.08 0 40 0.85 0.14 0 0.01 I. 39 0.90 0.10 0 39 0.85 0.15 0 0 J. 40 0.96 0.04 0 40 0.96 0.04 0 0 K. 40 0.88 0.12 0 39 0.94 0.05 0 0.01 L. 40 0.90 0.10 0 40 0.89 0.11 0 0 M. 40 0.86 0.14 0 40 0.82 0.18 0 0 N. 41 0.87 0.13 0 40 0.85 0.15 0 0
District 102--East Prince of Wales Island
O. 40 0.96 0.04 0 40 0.94 0.06 0 0 P. 40 0.91 0.09 0 40 0.94 0.06 0 0 Q. 40 0.90 0.10 0 40 0.96 0.04 0 0 R. 40 0.94 0.06 0 40 0.92 0.08 0 0 S. 41 0.98 0.02 0 40 0.85 0.14 0.01 0 T. 41 0.95 0.05 0 41 0.91 0.09 0 0 U. 40 0.98 0.02 0 40 0.91 0.09 0 0
District 103--West Prince of Wales Island-western islands
V. 41 0.93 0.07 0 41 0.93 0.07 0 0 W. 1986 40 0.86 0.13 0.01 39 0.96 0.04 0
1987 39 0.94 0.06 0 40 0.96 0.03 X. 40 0.91 0.09 0 40 0.92 0.08 0 0 Y. 1986 40 0.91 0.09 0 38 0.89 0.11 0 0
1987 40 0.96 0.04 0 40 0.98 0.02 Z. 41 0.99 0.01 0 41 0.83 0.17 0 0
District 105--West Sumner strait
a. 40 0.90 0.10 0 40 0.86 0.14 0 0
52
Table A.--continued.
Drainage N 100 130 S5 N 100 90 110 so
District 107--Ernest Sound-Bradfield Canal
b. 39 0.S3 0.15 0.01 40 0.94 0.06 0 o
District 10S--Stikine River
c. 40 0.95 0.05 0 40 0.91 0.09 o o
District 109--South Chatham strait
d. 40 0.96 0.04 0 40 0.96 0.04 o o
District 110--East Frederick Sound
e. 39 0.94 0.06 0 40 0.94 0.06 o o
District 115--Lynn Canal
f. 40 0.96 0.04 0 39 0.92 O.OS o o
53
Table A.--continued.
feR(Gl) PeR (Lgg) ab
Drainage N 100 92 N 100 70
District 101--Behm Canal-fortland Canal-Boca de Quadra
A. 1986 40 1. 00 0.00 40 0.81 0.19 1987 40 0.99 0.01 39 0.79 0.21
B. 40 1. 00 0.00 40 0.80 0.20 C. 40 1.00 0.00 40 0.91 0.09 D. 40 1. 00 0.00 40 0.84 0.16 E. 40 1.00 0.00 40 0.81 0.19 F. 40 1.00 0.00 40 0.84 0.16 G. 40 1.00 0.00 40 0.80 0.20 H. 0 40 0.80 0.20 I. 39 1.00 0.00 39 0.86 0.14 J. 40 1.00 0.00 40 0.76 0.24 K. 39 1. 00 0.00 39 0.76 0.24 L. 40 1. 00 0.00 40 0.81 0.19 M. 40 1.00 0.00 40 0.78 0.22 N. 40 1. 00 0.00 41 0.76 0.24
District 102--East frince of Wales Island
O. 40 1.00 0.00 40 0.76 0.24 P. 0 40 0.79 0.21 Q. 40 1.00 0.00 40 0.85 0.15 R. 38 1.00 0.00 40 0.76 0.24 S. 0 41 0.84 0.16 T. 41 1. 00 0.00 41 0.84 0.16 U. 40 1.00 0.00 40 0.79 0.21
District 103--West Prince of Wales Island-western islands
V. 41 1.00 0.00 41 0.78 0.22 W. 1986 38 1.00 0.00 40 0.84 0.16
1987 38 1. 00 0.00 40 0.80 0.20 X. 40 1.00 0.00 40 0.82 0.18 Y. 1986 30 1.00 0.00 40 0.84 0.16
1987 40 1. 00 0.00 40 0.81 0.19 Z. 41 1.00 0.00 41 0.79 0.21
District 105--West Sumner strait
a. 40 1.00 0.00 40 0.81 0.19
54
Table A.--Continued.
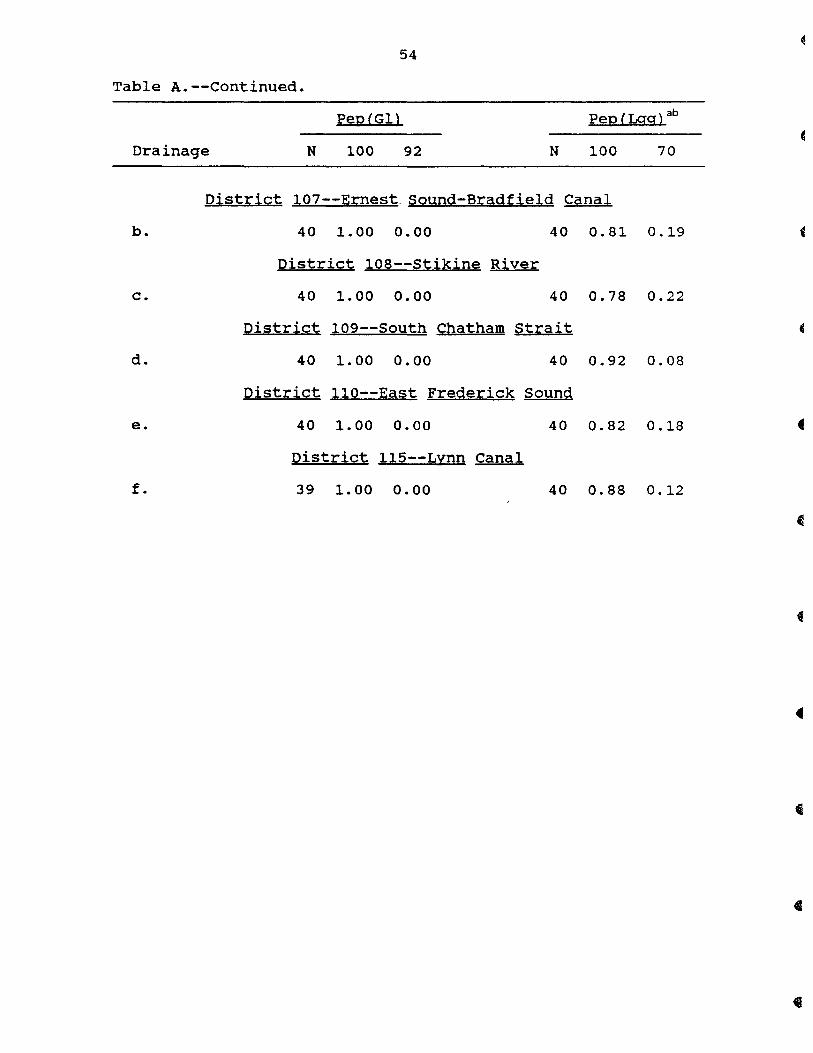
Pep(Gl) Pep (Lgg) ab
Drainage N 100 92 N 100 70
District 107--Ernest Sound-Bradfield Canal
b.
c.
d.
e.
f.
40 1. 00 0.00 40 0.81 0.19
District 108--stikine River
40 1. 00 0.00 40 0.78 0.22
District 109--South Chatham strait
40 1.00 0.00
Qist;r;:ict llO--East Fredex.:ick
40 1. 00 0.00
District ll5--Lynn Canal
39 1.00 0.00
40 0.92 0.08
Sound
40 0.82 0.18
40 0.88 0.12
55
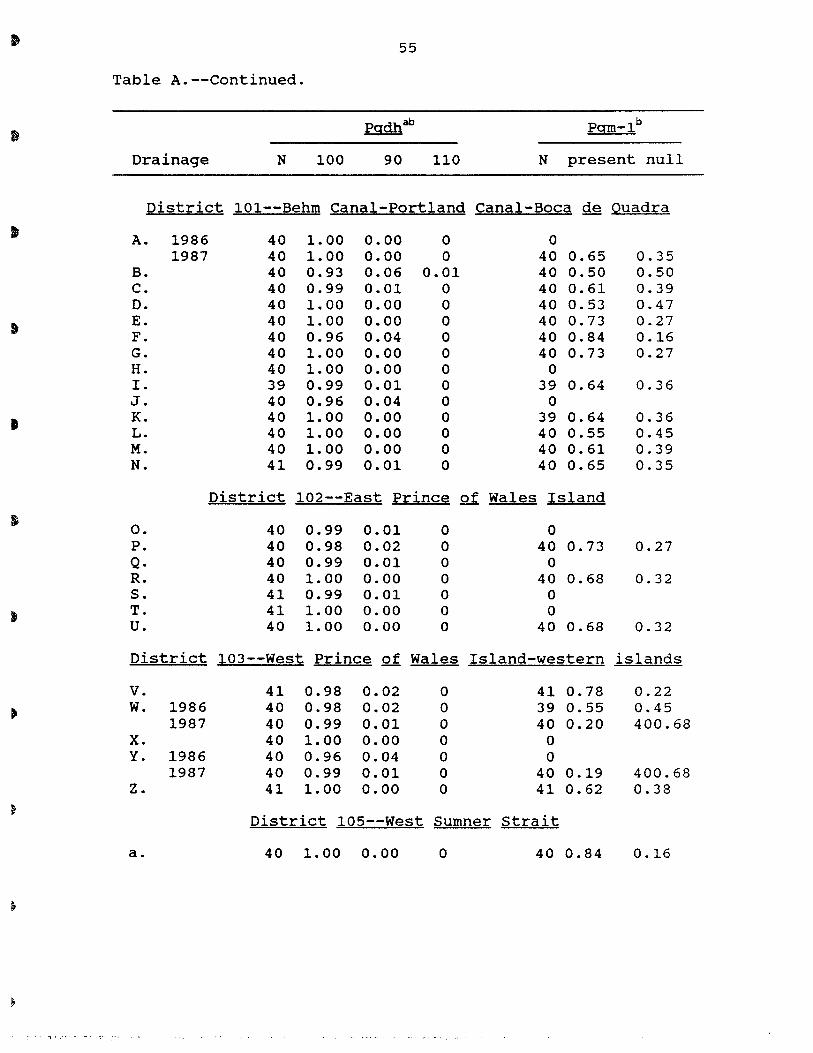
Table A.--continued.
Egghab Pgm_1b
Drainage N 100 90 110 N present null
District 101--Behm Canal-Portland Canal-Boca de Quadra
A. 1986 40 1. 00 0.00 0 0 1987 40 1. 00 0.00 0 40 0.65 0.35
B. 40 0.93 0.06 0.01 40 0.50 0.50 C. 40 0.99 0.01 0 40 0.61 0.39 D. 40 1. 00 0.00 0 40 0.53 0.47 E. 40 1. 00 0.00 0 40 0.73 0.27 F. 40 0.96 0.04 0 40 0.84 0.16 G. 40 1. 00 0.00 0 40 0.73 0.27 H. 40 1. 00 0.00 0 0 I. 39 0.99 0.01 0 39 0.64 0.36 J. 40 0.96 0.04 0 0
• K. 40 1. 00 0.00 0 39 0.64 0.36 L. 40 1. 00 0.00 0 40 0.55 0.45 M. 40 1.00 0.00 0 40 0.61 0.39 N. 41 0.99 0.01 0 40 0.65 0.35
District 102--East Prince of Wales Island
O. 40 0.99 0.01 0 0 P. 40 0.98 0.02 0 40 0.73 0.27 Q. 40 0.99 0.01 0 0 R. 40 1. 00 0.00 0 40 0.68 0.32 S. 41 0.99 0.01 0 0 T. 41 1. 00 0.00 0 0 U. 40 1.00 0.00 0 40 0.68 0.32
District 103--West Prince of Wales Island-western islands
V. 41 0.98 0.02 0 41 0.78 0.22 W. 1986 40 0.98 0.02 0 39 0.55 0.45
1987 40 0.99 0.01 0 40 0.20 400.68 X. 40 1. 00 0.00 0 0 Y. 1986 40 0.96 0.04 0 0
1987 40 0.99 0.01 0 40 0.19 400.68 Z. 41 1. 00 0.00 0 41 0.62 0.38
District 105--West Sumner strait
a. 40 1.00 0.00 0 40 0.84 0.16
56
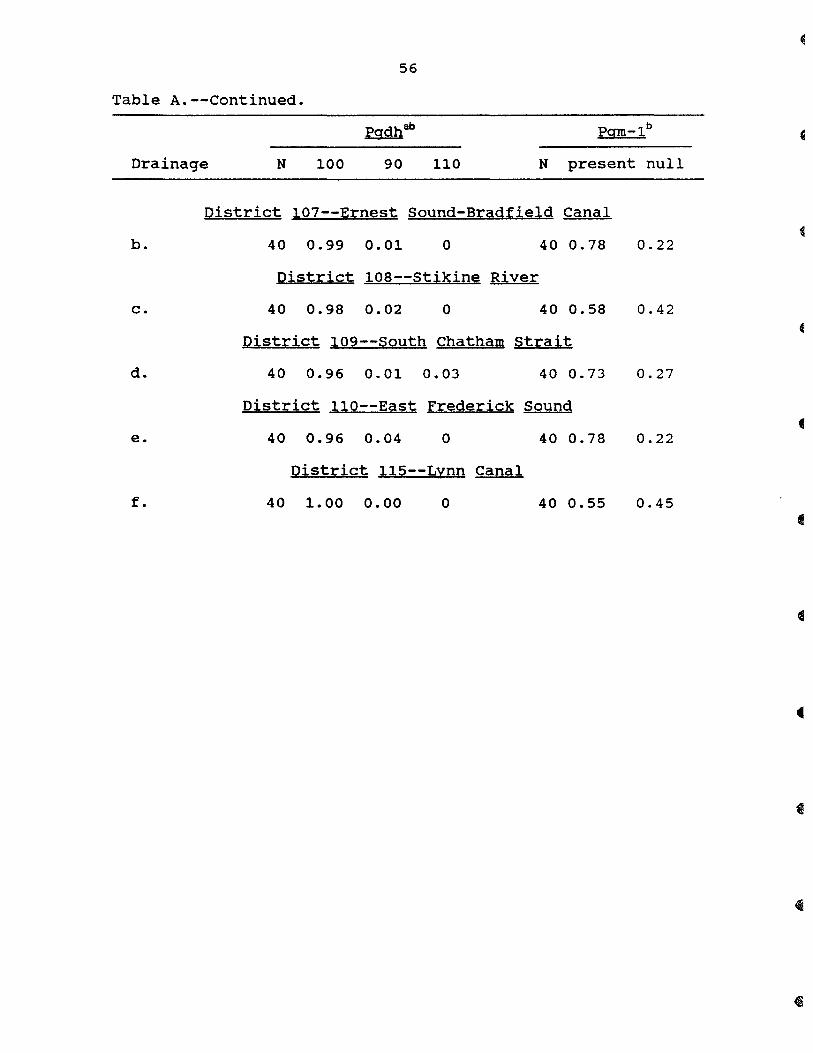
Table A.--Continued.
Drainage N 100 90 110 N present null
District 107--Ernest Sound-Bradfield Canal
b. 40 0.99 0.01 0 40 0.78 0.22
District 108--stikine River
c. 40 0.98 0.02 0 40 0.58 0.42
District 109--South Chatham Strait
d. 40 0.96 0.01 0.03 40 0.73 0.27
District 110--East Frederick Sound
e. 40 0.96 0.04 0 40 0.78 0.22
District 115--Lynn Canal
f. 40 1.00 0.00 0 40 0.55 0.45 e
57
Table A.--continued.
Egm-~ab Sod
Drainage N -100 -140 -40 N 100 200
District 101--Behm Canal-Eortland-Boca de Quadra
A. 1986 40 1.00 0.00 0 40 1.00 0.00 1987 40 1. 00 0.00 0 40 1.00 0.00
B. 40 1.00 0.00 0 40 1.00 0.00 C. 40 1.00 0.00 0 40 1.00 0.00 D. 40 0.99 0.01 0 40 1.00 0.00 E. 40 1. 00 0.00 0 40 1.00 0.00 F. 40 1. 00 0.00 0 40 1. 00 0.00 G. 40 1.00 0.00 0 40 1. 00 0.00 H. 40 1.00 0.00 0 40 1. 00 0.00 I. 39 1.00 0.00 0 39 1.00 0.00 J. 40 1.00 0.00 0 40 1.00 0.00 K. 39 1.00 0.00 0 40 0.99 0.01 L. 40 1. 00 0.00 0 40 1. 00 0.00 M. 40 1.00 0.00 0 40 1.00 0.00 N. 40 1.00 0.00 0 41 1.00 0.00
District 102--East Prince QL Wales Island
O. 40 1.00 0.00 0 40 1.00 0.00 P. 40 1.00 0.00 0 40 1.00 0.00 Q. 40 1. 00 0.00 0 40 1.00 0.00 R. 40 1.00 0.00 0 40 1.00 0.00 S. 41 0.99 0.01 0 41 1.00 0.00 T. 41 1. 00 0.00 0 41 1.00 0.00 U. 40 1.00 0.00 0 40 1.00 0.00
District 103--West Prince of Wales Island-western islands
V. 41 1.00 0.00 0 41 1. 00 0.00 W. 1986 40 0.99 0.00 0.01 40 1.00 0.00
1987 40 1. 00 0.00 0 40 1.00 0.00 X. 40 1.00 0.00 0 0 Y. 1986 40 1.00 0.00 0 40 1. 00 0.00
1987 40 1. 00 0.00 0 40 1.00 0.00 Z. 41 0.99 0.00 0.01 41 1.00 0.00
District 105--West Sumner strait
a. 40 1.00 0.00 0 40 1. 00 0.00
58
Table A.--continued.
Pgm_2 ab
Drainage N -100 -140 -40 N 100 200
District 107--Ernest Sound-Bradfield Canal
b. 40 1. 00 0.00 o 40 1.00 0.00
District 108--stikine River
c. 40 0.99 0.00 0.01 40 1. 00 0.00
District 109--South Chatham strait
d. 40 1. 00 0.00 0 40 1.00 0.00
District ll0--East Frederick Sound
e. 40 1. 00 0.00 0 40 1. 00 0.00 C
District l15--Lynn Canal
f. 39 1.00 0.00 0 40 1.00 0.00
59
Table A.--Continued.
Sample sizes of monomorphic loci
Drainage Ck-1b ~b Ck-3ab G12 i - 1 ,2 ab
District 101--Behm Canal-Portland Canal-Boca de Quadra
A. 1986 39 39 40 40 1987 40 40 39 40
B. 40 40 40 40 C. 40 40 40 40 D. 40 40 40 40 E. 40 40 40 40 F. 40 40 40 40 G. 38 38 40 40 H. 40 40 39 40 I. 39 39 39 39 J. 40 40 40 40 K. 40 40 40 40 L. 40 40 40 40 M. 40 40 40 40 N. 41 41 41 41
District 102--East Prince Qi Wales Island
O. 40 40 40 40 P. 0 0 39 40 Q. 40 40 40 40 R. 39 39 40 40 S. 41 41 41 41 T. 41 41 41 41 U. 40 40 40 40
District 103--West Prince of Wales Island-western islands
V. 41 41 41 41 W. 1986 40 40 40 40
1987 40 40 40 40 X. 40 40 40 38 Y. 1986 40 40 40 40
1987 40 40 40 40 Z. 37 37 41 36
District 105--West Sumner strait
a. 40 40 39 40
60
Table A.--continued.
Sample sizes of monomorphic loci
Drainage Gpi-l (2 ab
District 107--Ernest Sound-Bradfield Canal
b. 40 40 40 40
District 108--Stikine River
c. 40 40 40 40
District 109--South Chatham strait
d. 40 40 40 40
District 110--East Frederick Sound
e. 40 40 40 40
District 115--Lynn Canal
f. 40 40 40 40
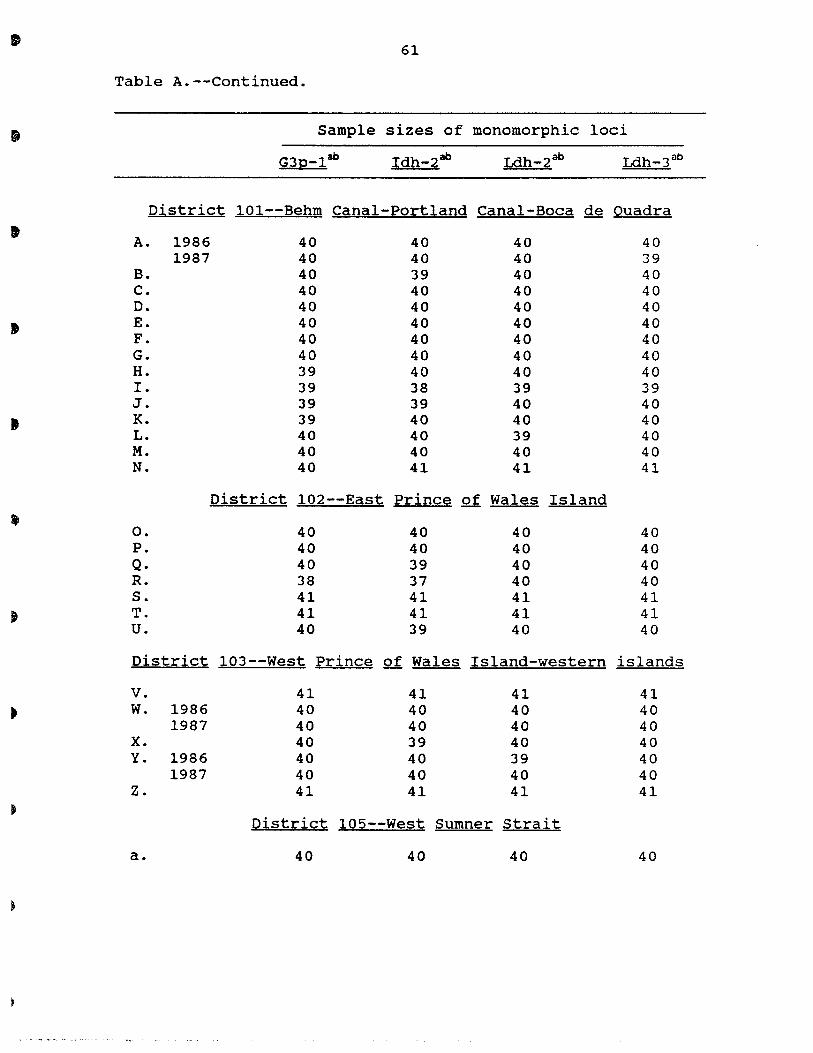
61
Table A.--Continued.
Sample sizes of monomorphic loci
G3p-1ab Idh-2ab Ldh-2ab Ldh_3 ab
District 101--Behm Canal-Portland Canal-Boca ~ Quadra
A. 1986 40 40 40 40 1987 40 40 40 39
B. 40 39 40 40 C. 40 40 40 40 D. 40 40 40 40 E. 40 40 40 40 F. 40 40 40 40 G. 40 40 40 40 H. 39 40 40 40 I. 39 38 39 39 J. 39 39 40 40
It K. 39 40 40 40 L. 40 40 39 40 M. 40 40 40 40 N. 40 41 41 41
District 102--East Prince of Wales Island
O. 40 40 40 40 P. 40 40 40 40 Q. 40 39 40 40 R. 38 37 40 40 S. 41 41 41 41 T. 41 41 41 41 U. 40 39 40 40
District 103--West Prince of Wales Island-western islands
V. 41 41 41 41 W. 1986 40 40 40 40
1987 40 40 40 40 X. 40 39 40 40 Y. 1986 40 40 39 40
1987 40 40 40 40 Z. 41 41 41 41
Q;i.strict 105--West Sumner strait
a. 40 40 40 40
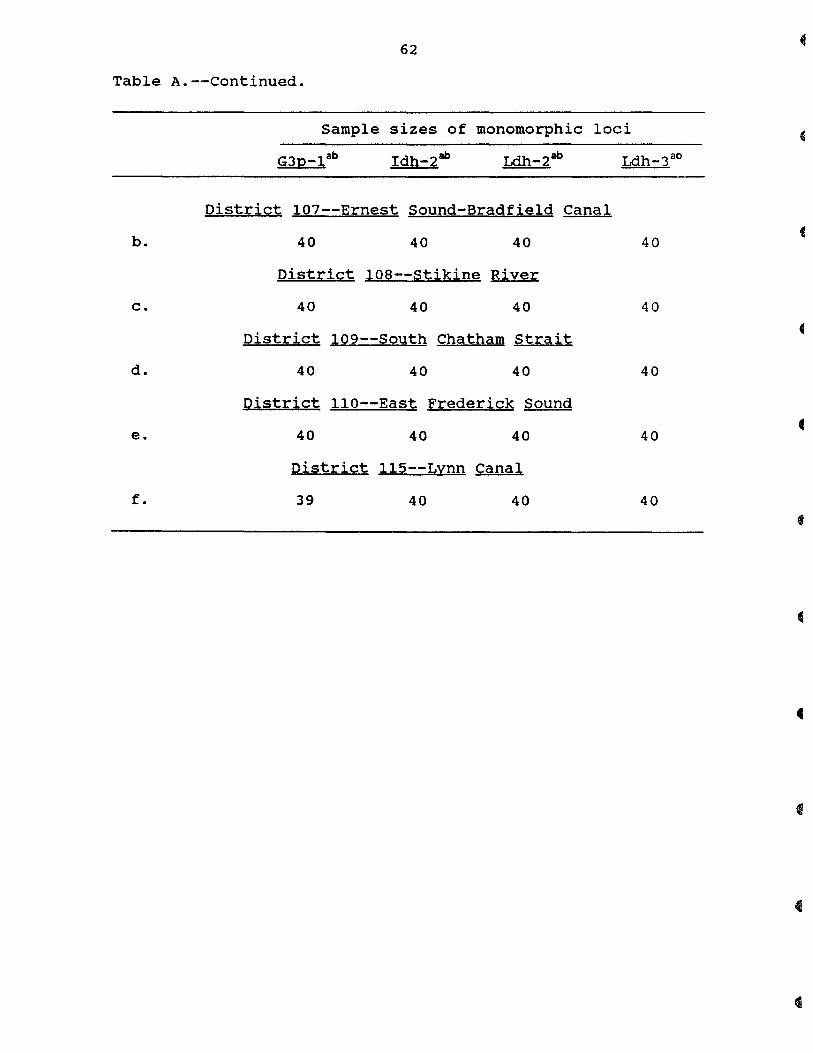
62
Table A.--Continued.
Sample sizes of monomorphic loci
G3p-l ab Idh-2ab Ldh-2ab Ldh-3 ab
District 107--Ernest Sound-Bradfield Canal
b. 40 40 40 40
District loa--stikine River
c. 40 40 40 40
District 109--South Chatham strait
d. 40 40 40 40
District 110--East Frederick Sound
e. 40 40 40 40
District 115--Lynn Canal
f. 39 40 40 40
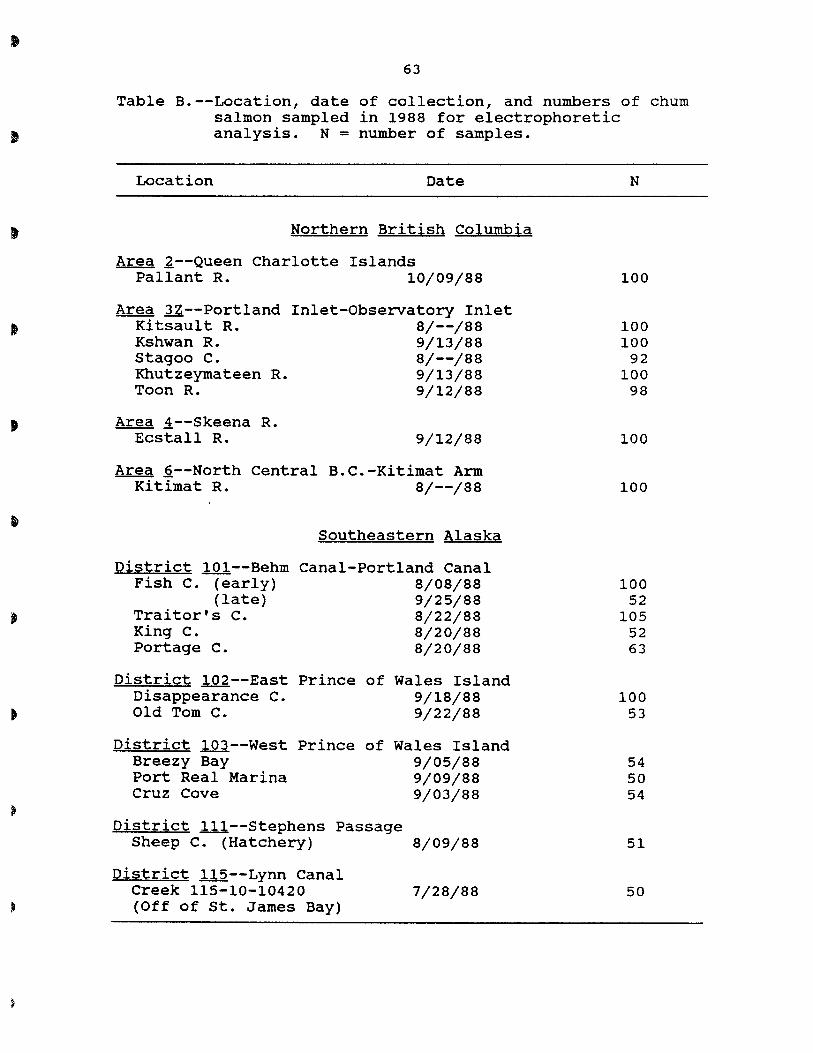
63
Table B.--Location, date of collection, and numbers of chum salmon sampled in 1988 for electrophoretic analysis. N = number of samples.
Location Date
Northern British Columbia
Area ~--Queen Charlotte Islands Pallant R. 10/09/88
Area lZ--Portland Kitsault R. Kshwan R. Stagoo C. Khutzeymateen R. Toon R.
Area ~--Skeena R. Ecstall R.
Inlet-Observatory Inlet 8/--/88 9/13/88 8/--/88 9/13/88 9/12/88
9/12/88
Area ~--North Central B.C.-Kitimat Arm Kitimat R. 8/--/88
District lQ1--Behm Fish C. (early)
(late) Traitor's C. King C. Portage C.
southeastern Alaska
Canal-Portland Canal 8/08/88 9/25/88 8/22/88 8/20/88 8/20/88
District 102--East Prince of Wales Island Disappearance C. 9/18/88 Old Tom C. 9/22/88
District 1Q1--West Breezy Bay Port Real Marina Cruz Cove
Prince of Wales Island 9/05/88 9/09/88 9/03/88
District 1ll--Stephens Passage Sheep C. (Hatchery) 8/09/88
District 1l2--Lynn Canal Creek 115-10-10420 7/28/88 (Off of st. James Bay)
N
100
100 100
92 100
98
100
100
100 52
105 52 63
100 53
54 50 54
51
50