Embed Size (px)
Citation preview
Preoperative Electroretinogram and PostoperativeVisual Outcome in Patients with Diabetic Vitreous Hemorrhage
Takashi Hiraiwa*, Naoichi Horio*, Hiroko Terasaki*,Toshimitsu Suzuki*, Etsuko Yamamoto*, Masayuki Horiguchi*,† and Yozo Miyake*
*Department of Ophthalmology, Nagoya University School of Medicine, Nagoya;†Department of Ophthalmology, Fujita Health University School of Medicine, Toyoake, Japan
Purpose: To determine whether the single-flash electroretinogram (ERG) can predict thepostoperative outcome in diabetic cases where massive vitreous hemorrhage precludes fundusobservation.
Methods: Eighty-five diabetic patients (105 eyes) who underwent vitrectomy due to dense vitreoushemorrhage were studied retrospectively. Eyes with postoperative complications were excluded.Preoperative ERGs (mixed cone-rod ERG with maximum flash intensity) were classified as: GroupA, the b-wave/a-wave ratio (b/a ratio) was �1.0 and the oscillatory potentials (OPs) were clearlyrecordable (22 eyes); Group B, the b/a ratio was �1.0 and the OPs were markedly reduced (33eyes); and Group C, the b/a ratio was �1.0 (50 eyes).
Results: The postoperative visual acuity in Group C (hand motion to 1.5) was significantly worse thanin Group A (0.4–.2) (P � .01) or Group B (0.08–1.0) (P � .01). Thick preretinal membrane causingretinal traction around the optic disc was found intraoperatively in 1 eye (4.5%) in Group A, 9eyes (27.3%) in Group B, and 28 eyes (56.0%) in Group C (P � .0132).
Conclusion: Our findings suggested that the configuration of the single-flash ERG can provideimportant preoperative information for a functional prognosis following vitrectomy in diabeticpatients with vitreous hemorrhage. Jpn J Ophthalmol 2003;47:307–311 � 2003 JapaneseOphthalmological Society
Key Words: Diabetic retinopathy, electroretinogram, vitrectomy, vitreous hemorrhage.
IntroductionWhen massive vitreous hemorrhage prevents inspec-
tion of the ocular fundus in patients with proliferativediabetic retinopathy, it is difficult to predict visual out-come after vitrectomy. Although ultrasonography can beused to demonstrate retinal detachment,1 it provides noindication of the functional status of the attached retina.Standard clinical tests including color perception, two-point discrimination, and Maddox rod orientation havelimited value in evaluating such patients.2 It has beenreported that the electroretinogram (ERG)1,3,4 and visualevoked potentials (VEP)1,5 are useful in predicting
Received: August 28, 2002Correspondence and reprint requests to: Naoichi HORIO, MD,
Nagoya University School of Medicine, 65 Tsuruma-cho, Showa-ku,Nagoya 466-8550, Japan
Jpn J Ophthalmol 47, 307–311 (2003)
� 2003 Japanese Ophthalmological Society 0021-5155/03/$–see front matterPublished by Elsevier Science Inc. doi:10.1016/S0021-5155(03)00015-7
visual outcome following vitrectomy, however, these re-sults are of limited value because vitreous hemorrhageor photocoagulation could influence the amplitudes ofthe ERG or the stimulus intensity in proliferative diabeticretinopathy.6
The amplitudes of a- and b-waves in a single flashERG have been markedly reduced after panretinal photo-coagulation (PRP).7,8 Because most patients with vitreoushemorrhage have undergone PRP, it is difficult to evaluatethe prognosis of vitrectomy by using only the a- or b-wave amplitude. Hirose3 has recommended using the ratioof b- to a-wave amplitudes (b/a ratio) and has reportedthat eyes showing a ratio �1.0 had a better chance ofimproved vision after surgery. Summanen4 also has re-ported that a nonrecordable b-wave in the flash ERG wasassociated with a poor visual outcome. The b/a ratio of thepreoperative ERG appears to be important in predicting
308 Jpn J OphthalmolVol 47: 307–311, 2003
the visual outcome in patients with diabetic vitreous hem-orrhage. It has also been known that the peak time of thefirst wavelet of the oscillatory potentials (OPs) in theERG is delayed and that the sum of the OP ampli-tudes decreases progressively with the advancement ofthe retinopathy.6,9–12 Thus, the preoperative OPs are anadditional consideration in visual prognosis followingvitrectomy.
In this study, we used single-flash ERG preoperativelyand classified patients based on the b/a ratio and theOP amplitudes. Thereafter, we evaluated the relationshipbetween the preoperative ERG and the postoperativevisual acuity to study the predictability of single-flashERGs for postoperative visual outcome in diabetic pa-tients in whom massive vitreous hemorrhage obstructsfundus observation.
Materials and MethodsOne hundred and two consecutive patients (129 eyes)
who underwent vitrectomy for vitreous hemorrhage dueto proliferative diabetic retinopathy and were followed-up for at least 3 months were studied retrospectively.Eyes with preoperative neovascularization of the iris(n � 7), and eyes with postoperative complications thatcould independently reduce the postoperative visualacuity (n � 17), such as corneal opacity and rubeoticglaucoma, were excluded from this study. Therefore, 85patients (105 eyes), 48 men and 37 women, with densevitreous hemorrhage that prevented inspection of thefundus were included. The preoperative visual acuityranged from light perception to 0.6. The age of the pa-tients ranged from 30 to 80 years (mean � SD �55.1 � 10.3 years).
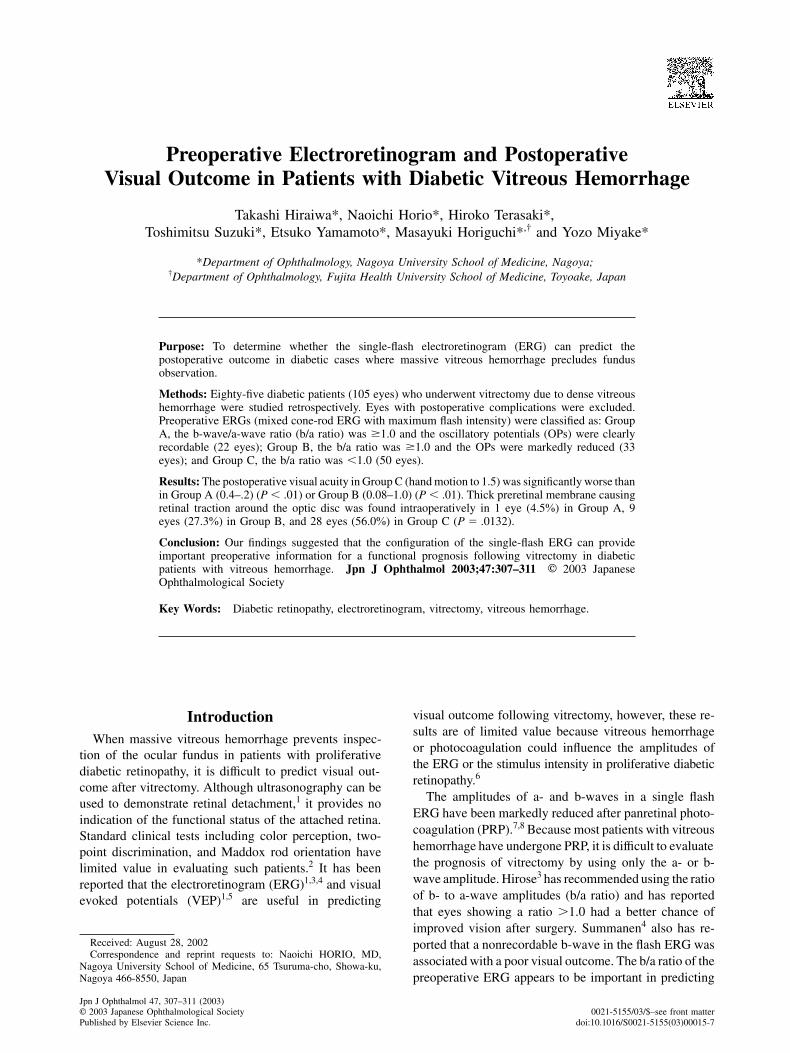
To conduct the ERGs, the patient’s pupil was dilatedwith 0.5% tropicamide and 0.5% phenylephrine. The pre-operative ERGs were recorded by using a 20-J single-flashlight (PE-3000; Tomey, Nagoya) after 30 minutes of darkadaptation. Responses were bandpass-filtered between0.7 Hz and 1000 Hz. Preoperative ERGs (mixed cone-rod ERG with maximum flash) were classified (Figure1) as: Group A, the b-wave/a-wave ratio (b/a ratio)was �1.0 and the OPs were clearly recordable; GroupB, the b/a ratio was �1.0 and the OPs were markedlyreduced; and Group C, the b/a ratio was �1.0. The ERGswith reduced amplitudes of OP1 and OP2, and nonre-cordable OP3 were assumed to have markedly reducedOPs. Interestingly, all eyes classified into Group C hadnonrecordable OPs. The ERGs were classified manuallyby a masked observer (one of the authors, TS).
All patients had undergone ophthalmic evaluation inour department, including the measurement of best-
Figure 1. Classification of preoperative electroretinograms(ERGs) in three groups of diabetic patients with vitreous hemor-rhage, and comparison with normal values. Group A: the b-wave to a-wave peak (b/a) ratio was �1.0 and the oscillatorypotentials (OPs) were clearly recordable. Group B: the b/a ratiowas �1.0 with markedly reduced OPs. Group C: the b/a ratiowas �1.0 and the OPs were nonrecordable. Arrowhead indicatesstimulus onset.
corrected visual acuity by decimal chart, slit-lamp biomi-croscopy, and ophthalmoscopy. Pars plana vitrectomywas performed with endophotocoagulation. Phacoemulsi-fication (sclerocorneal incision or pars plana phacoemul-sification leaving the anterior capsule), membrane peeling,fluid–gas exchange, and temporal gas or silicone oiltamponade had been performed, when necessary (Table1). The retinal pathologic changes were evaluated duringthe surgery by examining for proliferative membranesat the disc, retinal folds on the macula, and tractional retinaldetachment (TRD). The best postoperative visual acuityhad been obtained during the follow-up period from 3 to44 months (15.3 � 10.7 months) after surgery.
The visual acuity in each group was compared usingthe Kruskal–Wallis one-way factorial analysis of varianceon ranks and the Dunn test for multiple comparison. Toanalyze the existence of proliferative membrane at thedisc, the Fisher exact probability test was used to deter-mine the significance between Groups B and C. Valuesof P � .05 were considered statistically significant.
309T. HIRAIWA ET AL.ERG IN DIABETIC VITREOUS HEMORRHAGE
Table 1. Data on Patients and Results
Number of Eyes by Group
A B C
Surgical procedurePPV, lens surgery
No tamponade 13 15 12Tamponade 2 9 22
PPVNo tamponade 6 7 9Tamponade 1 2 7
Age (mean, years) 31–69 30–80 36–80(58.8) (56.4) (53.9)
Preoperative visual acuity HM–0.6 HM–0.4 LP–0.4(median) (0.055) (0.01) (CF)Postoperative visual acuity 0.4–1.2 0.08–1.0 HM–1.5(median) (0.75) (0.5) (0.2)Proliferative membrane – 14 11 5
� 7 13 17�� 1 9* 28*
Total (no of eyes) 22 33 50
PPV: pars plana vitrectomy, LP: light perception, HM: hand motion,CF: counting fingers, �: proliferative membrane at the optic discwithout traction, ��: retinal folds on the macula or tractional retinaldetachment around the optic disc. The ratio of tractional membrane(�� to � and �) in Group C is higher than that in Group B usingthe Fisher exact probability test (*P � .0132).
ResultsThe postoperative visual acuity in Group C (hand
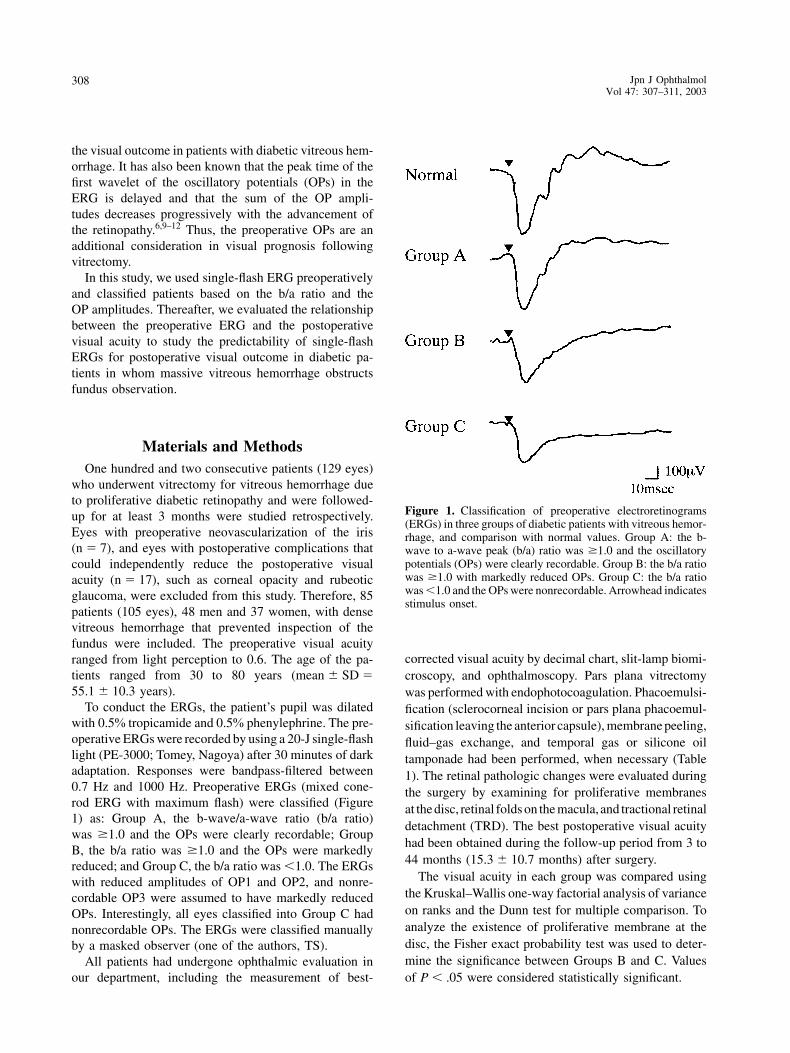
motion to 1.5, median � 0.2) was significantly worsethan in Group A (0.4–1.2, median � 0.75) (P � .01) orGroup B (0.08–1.0, median � 0.5) (P � .01) (Figure 2).There was no difference in postoperative visual acuitybetween Group A and Group B. On the other hand, thepreoperative visual acuity in Group A (hand motion to0.6, median � 0.055) was better than that in Group C(light perception to 0.4, median � counting fingers)(P � .01), although there was no difference betweenGroups A and B (hand motion to 0.4, median � 0.01) orbetween Groups B and C (Table 1). In 8 of the 22 eyes(36.4%) in Group A, in 19 of the 33 eyes (57.6%) inGroup B, and in 33 of the 50 eyes (66.0%) in Group C,the fundus was not visible preoperatively. The other eyesin these three groups had a partially visible fundus or avisible disc with diffuse vitreous hemorrhage. There wasno difference in the view of the preoperative fundus in thethree groups using the chi-square test for independence.
A thick preretinal membrane at the disc was foundintraoperatively in 8 of the 22 eyes (36.4%) in Group A, in22 of the 33 eyes (66.7%) in Group B, and in 45 of the50 eyes (90.0%) in Group C. TRD or retinal folds onthe macula were found in 1 eye (4.5%) in Group A, 9eyes (27.3%) in Group B, and 28 eyes (56.0%) in GroupC. The ratio of tractional membrane with TRD or retinal
Figure 2. Postoperative visual acuity in each group. *P � .01.HM: hand motion.
folds on the macula was significantly higher in Group Cthan in Group B (P � .0132) (Table 1).
DiscussionPrevious reports1,4 have indicated that a decreased
b-wave amplitude correlated with poor outcome after vit-rectomy, although they could not safely predict visualoutcome. In the present study, we classified the eyes basedon the b/a ratio and the OPs of the preoperative ERGs.Our data showed that eyes with a b/a ratio �1.0 (GroupC) had worse postoperative visual acuity than eyes witha b/a ratio �1.0 (Group A and Group B). In evaluatingpreoperative ERGs, the influence of PRP on the ERGhas been important because the amplitudes of a- and b-waves are markedly reduced after PRP. Previous reports7,8
have demonstrated that both a- and b-wave amplitudeswere significantly reduced following PRP, and that boththe a-wave and the b-wave were reduced proportionally.These findings suggest that the outcome of vitrectomycould not be predicted accurately based only on the ERGamplitude,1 and that the b/a ratio is probably a betterprognostic index.
310 Jpn J OphthalmolVol 47: 307–311, 2003
Proliferative diabetic retinopathy has been associatedwith decreased amplitudes of both a- and b-waves. Froma previous study,3 a disproportionate decrease in the b-wave amplitude with little change in the a-wave, leadingto a b/a ratio �1.0 would suggest fibrous proliferation atthe disc, which may restrict circulation by compressing thecentral retinal artery. In this study, we did find thicktractional membranes at the disc in more eyes in GroupC than in Group B. When the thick membranes causedretinal folds or TRD at the macula, the visual outcomewas even worse. This preoperative retinal finding mayexplain the poor visual outcome in Group C. In addition,it has also been shown that the b/a ratio becomes �1.0in central artery occlusion13 and severe central vein oc-clusion.14,15 A b/a ratio of �1.0 indicated the presence ofsevere ischemic changes in the retina. Therefore, the eyesin Group C probably had ischemic changes due to diabeticretinopathy, which also may have caused reduced retinalfunction and poor visual outcome following vitrectomy.Moreover, a recent study16 has described the mechanismsof visual loss due to vitreopapillary traction on the nasaloptic disc, suggesting damage to the anterior optic nervevia decreased axoplasmatic flow in the optic nerve fibersor mechanical reduction of perfusion in the posteriorciliary arteries. This study indicated that poor visualoutcome with tractional membrane on the disc suggestsischemic damage to the optic disc as well as the retina.
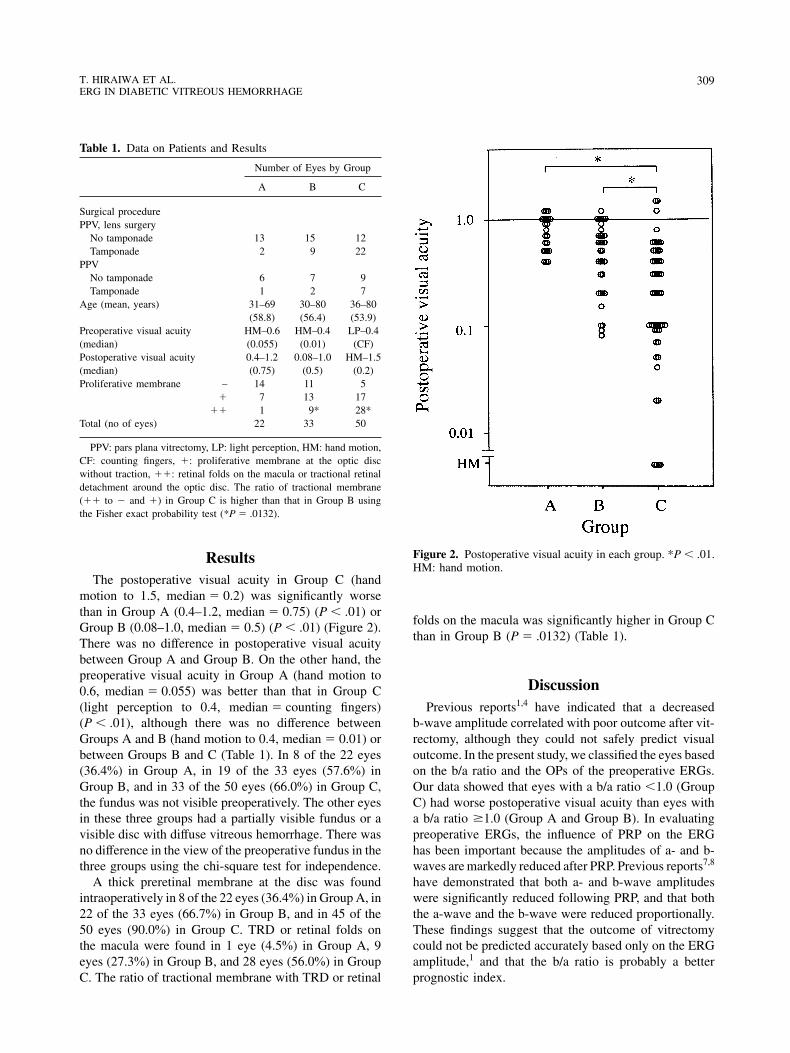
The light-filtering effect of dense vitreous hemorrhagealso should be considered in evaluating preoperative ERGin diabetic patients. Severe vitreous hemorrhage reducesthe intensity of the stimulus light. As the stimulus inten-sity increases in a normal subject, both a- and b-wavesbecome larger, but the b/a ratio becomes smaller, althoughit never was �1.0 even at the maximum intensity (Figure3). Because the opaque media had the effect of reducingthe stimulus intensity, the b/a ratio should increase ineyes with opaque vitreous. Therefore, a decreased b/aratio in patients with opaque vitreous indicated extremelyabnormal retinal function.17 In addition, Group B may in-clude eyes with recordable OPs which could be detectedif there were no vitreous hemorrhage; the light-filteringeffect of dense vitreous hemorrhage can reduce the OPs.In contrast, the eyes in Group A definitely had OPs inspite of dense hemorrhage.
The summed amplitude of the OPs was reported tobe a predictor of progression to severe proliferativeretinopathy.11,18 We found that the postoperative visualacuity of eyes in Group A tended to be better than thatof eyes in Group B, and the existence of proliferativemembrane at the optic disc was greater in Group B thanin Group A. These data suggested that patients in GroupA have the possibility of a good visual outcome, which
Figure 3. The influence of stimulus intensity on the electroreti-nogram (ERG). Single flash ERG was elicited from a normalsubject by different stimulus intensities of the 20-J stimulus.Numbers at left indicate the density of neutral density filter inlog units. Lowest tracing (0.0) is ERG recorded with maximumstimulus intensity. Because the opaque media has the effect ofreducing the stimulus intensity, the b/a ratio should increase; adecreased b/a ratio in patients with opaque vitreous indicatesextremely abnormal retinal function.
is very important information for patients with recordableOPs before vitrectomy.
As single-flash ERG reflects the function from theentire retina, the configuration of the ERG does notalways correlate to postoperative visual acuity. However,diffuse ischemic change, including thick proliferativemembrane on the disc in diabetic retina indicated byERG, may affect the visual acuity as is shown in this study.
In conclusion, our data showed that the single-flashERG can provide a noninvasive assessment of retinalfunction before vitrectomy. Although it does not providethe indication for vitrectomy, single-flash ERG also helpsto anticipate findings that will be encountered duringsurgery. The configuration of the ERG may be a usefulindex to predict visual outcome following vitrectomy forpatients with diabetic vitreous hemorrhage.
References1. Algvere P, Persson HE, Wanger P. Preoperative electroretinograms
and visual evoked cortical potentials for predicting outcome ofvitrectomy in diabetics. Retina 1985;5:179–183.
311T. HIRAIWA ET AL.ERG IN DIABETIC VITREOUS HEMORRHAGE
2. Mandelcorn MS, Blankenship G, Machemar R. Pars plana vitrec-tomy in severe diabetic retinopathy. Am J Ophthalmol 1976;81:561–570.
3. Hirose T. Evaluation of retinal function in the presence of vitreousopacities. In: Vitreous surgery and advances in fundus diagnosis andtreatment. New York: Appleton-Century-Crofts, 1977:79–97.
4. Summanen P. Vitrectomy for diabetic eye disease: the prognosticvalue of pre-operative electroretinography and visual evoked corti-cal potentials. Ophthalmologica 1989;199:60–71.
5. Schonfeld CL, Schneider T, Korner U, Heidenkummer HP, KampikA. Prognostic factors in vitreous surgery for proliferative diabeticretinopathy. Ger J Ophthalmol 1994;3:137–143.
6. Tzekov R, Arden GB. The electroretinogram in diabetic retino-pathy. Surv Ophthalmol 1999;44:53–60.
7. Liang JC, Fishman GA, Huamote FU, Anderson RJ. Comparativeelectroretinograms in argon laser and xenon arc panretinal photoco-agulation. Br J Ophthalmol 1983;67:520–525.
8. Perlman I, Gdal-On M, Miller B, Zonis S. Retinal function of thediabetic retina after argon laser photocoagulation assessed electro-retinographically. Br J Ophthalmol 1985;69:240–246.
9. Yonemura D, Aoki T, Tsuzuki K. Electroretinogram in diabeticretinopathy. Arch Ophthalmol 1962;68:19–24.
10. Shirao Y, Okumura T, Ohta T, Kawasaki K. Clinical importanceof electroretinographic oscillatory potentials in early detection and
objective evaluation for diabetic retinopathy. Clin Vis Sci 1991;6:445–450.
11. Bresnick GH, Palta M. Predicting progression to severe proliferativediabetic retinopathy. Arch Ophthalmol 1987;105:810–814.
12. Bresnick GH. Diabetic retinopathy. In: Principles and practice ofclinical electrophysiology of vision. St. Louis: Mosby Year Book,1991:619–635.
13. Karpe G. The basis of clinical electroretinography. Acta Ophthalmol1945;24(Suppl):1–118.
14. Sabates R, Hirose T, McMeel JW. Electroretinography in the prog-nosis and classification of central retinal vein occlusion. Arch Oph-thalmol 1983;101:232–235.
15. Breton ME, Quinn GE, Keene SS, Dahmen JC, Brucker AJ. Elec-troretinogram parameters at presentation as predictor of rubeosisin central retinal vein occlusion patients. Ophthalmology 1989;96:1343–1352.
16. Kroll P, Wiegand W, Schmidt J. Vitreopapillary traction in prolifera-tive diabetic vitreoretinopathy. Br J Ophthalmol 1999;83:261–264.
17. Miyake Y, Hirose T, Hara A. Electrophysiologic testing of visualfunctions for vitrectomy candidates: results in eyes with unknownfundus diseases. Retina 1983;3:86–94.
18. Simonsen SE. Prognostic value of ERG (oscillatory potential) injuvenile diabetics. Acta Ophthalmol 1974;123(Suppl):223–224.