Embed Size (px)
Citation preview
PREPAREDNESS MAP FOR COMMUNITY RESILIENCE:
EARTHQUAKES
Experience of Japan
© 2016 International Bank for Reconstruction and
Development / International Development Association or
The World Bank
1818 H Street NW
Washington DC 20433
Telephone: 202-473-1000
Internet: www.worldbank.org
This work is a product of the staff of The World Bank with external contributions. The findings,
interpretations, and conclusions expressed in this work do not necessarily reflect the views of The
World Bank, its Board of Executive Directors, or the governments they represent.
The World Bank does not guarantee the accuracy of the data included in this work. The boundaries,
colors, denomi- nations, and other information shown on any map in this work do not imply
any judgment on the part of The World Bank concerning the legal status of any territory or the
endorsement or acceptance of such boundaries.
Rights and PermissionsThe material in this work is subject to copyright. Because The World Bank encourages dissemination
of its knowledge, this work may be reproduced, in whole or in part, for noncommercial purposes as
long as full a ribution to this work is given. Any queries on rights and licenses, including subsidiary
rights, should be addressed to the Disaster Risk Management Hub, Tokyo, Fukoku Seimei Building 10th
Floor, Uchisaiwaicho 2-2-2, Chiyoda-ku, Tokyo, JAPAN 100-0011; e-mail: [email protected].
TABLE OF CONTENTS
Acknowledgments ...................................................................................................................................... vii
Objectives of this Technical Handbook ................................................................................................... ix
01 Introduction to Seismic Preparedness Maps ................................................................................ 01
What Are Seismic Preparedness Maps? ............................................................................................. 01
What Does a Seismic Preparedness Map Look Like? ........................................................................02
What Are Seismic Preparedness Maps Used for? ..............................................................................08
Who Is Responsible for Producing the Seismic Preparedness Maps? .............................................09
What Type of Information Is Included in Seismic Preparedness Maps? ...........................................09
02 Standard Process for Creating a Seismic Preparedness Map ................................................... 11
Step 1: Stock Take Hazard and Risk Information Available for the Target Area and Define the
Contents to Include in the Seismic Preparedness Map ......................................................... 11
Step 2: Collate Data ...............................................................................................................................15
Step 3: Add Information on Evacuation Sites......................................................................................16
Step 4: Add Information on How to Reduce the Detrimental Impacts from Earthquakes at the
Household Level........................................................................................................................21
Step 5: Determine Map Design, Layout, and Format Based on Intended Usage ..............................21
Step 6: Distribute and Leverage Seismic Preparedness Maps for Community Disaster Risk
Reduction ................................................................................................................................. 22
Annex 1: Definition of the JMA Seismic Intensity Scale ..................................................................... 27
Annex 2: List of Hazard and Risk Modeling References .....................................................................29
iii
Preparedness Map for Community Resilience: Earthquakes – Experience of Japan
List of Tables
Table 1. Comparison of the probabilistic and deterministic approaches .............................................13
Table 2. Recommended color pattern for JMA Seismic Intensity Scale .............................................. 22
List of Figures
Figure 1. Anjo City Seismic Preparedness Map (front) ..........................................................................02
Figure 2. Anjo City Seismic Preparedness Map (back) ...........................................................................03
Figure 3. Estimated seismic intensity from the maximum likely scenario earthquake
and evacuation areas .................................................................................................................04
Figure 4. Information on historical earthquakes experienced by Anjo City ..........................................05
Figure 5. Damage estimates based on the largest known historical earthquake in the Anjo area
(Mw 8.7) ......................................................................................................................................06
Figure 6. How to prepare for an earthquake ............................................................................................06
Figure 7. Likely effects from a major earthquake .................................................................................... 07
Figure 8. Building damage ratio under a scenario ..................................................................................08
Figure 9. Tsunami inundation risk map under a scenario ......................................................................08
Figure 10. Liquefaction risk map ...............................................................................................................09
Figure 11. Actions to take during a major earthquake event....................................................................09
Figure 12. General work flow to create a Seismic Preparedness Map ...................................................... 11
Figure 13. Output of a scenario based deterministic hazard assessment ...............................................12
Figure 14. Output from a probabilistic hazard assessment ......................................................................12
Figure 15. Topographical map from Geospatial Information Authority of Japan .....................................13
Figure 16. Cause of death from major earthquakes in Japan in the last 100 years .................................14
Figure 17. Examples of temporary emergency evacuation sites ..............................................................17
Figure 18. An example of an evacuation center .........................................................................................17
Figure 19. Example of a map showing evacuation sites and centers
(Kawagoe City, Saitama Prefecture) ..........................................................................................18
Figure 20. Example of a welfare evacuation center used in the 2016 Kumamoto earthquake ...............18
Figure 21. Example of tsunami evacuation towers.....................................................................................19
Figure 22. Preparedness tips from the Anjo City Seismic Preparedness Map .........................................21
Figure 23. Color scheme used to show tsunami inundation depths ........................................................ 23
Figure 24. Example of pictograms to indicate tsunami evacuation sites and centers ........................... 23
Figure 25. Example of multi-language Seismic Preparedness Map (Anjo City) ...................................... 24
Figure 26. Risk map of Funabashi City, Chiba Prefecture, on smartphone ............................................. 24
Figure 27. An event hosted by a local government to promote the use of
Seismic Preparedness Maps ..................................................................................................... 24
Figure 28. Lecture on local hazard risks by experts .................................................................................. 25
Figure 29. Tsunami evacuation training (Kochi City) ................................................................................ 25
Figure 30. Workshop to develop tsunami evacuation plan by the local community/
resident association. Tomakomai City, Hokkaido, July 2013. .................................................. 25
Figure 31. Illustrations of earthquake situations, from the
“Disaster Preparedness Tokyo” handbook ............................................................................... 26
iv

Table of Contents
List of Boxes
Box 1. Two approaches to seismic hazard assessment.............................................................................12
Box 2. Cause of fatalities from earthquakes ...............................................................................................14
Box 3. Tsunami evacuation towers ..............................................................................................................19
Box 4. Sample pictograms .......................................................................................................................... 23
Box 5. Example of disaster prevention information .................................................................................. 26
v

The development of this manual was led by
Keiko Saito and Keiko Sakoda Kaneda, Disaster
Risk Management Specialists at the Global
Facility for Disaster Reduction and Recovery
(GFDRR), the World Bank, with support from
the Disaster Risk Management Hub, Tokyo.
Significant input was provided by OYO
International, with support from the Urban
Bureau of the Ministry of Land, Infrastructure,
Transport and Tourism (MLIT); the
governments of Anjo City (Aichi Prefecture),
Saitama City (Saitama Prefecture), Tomakomai
City (Hokkaido), Kawagoe City (Saitama
Prefecture), Funabashi City (Chiba Prefecture),
and Tobishima Village (Aichi Prefecture); the
Nagoya City Waterworks & Sewerage Bureau
(Aichi Prefecture); and the Tokyo Metropolitan
Government. The team also appreciates the
support provided by the Institute of Scientific
Approaches for Fire and Disaster, as well as
valuable comments and feedback provided by
Dr. Fumio Yamazaki, Professor, Chiba University,
and Dr. Kazuo Fujimoto, Professor, Chiba
Institute of Science.
vii
ACKNOWLEDGMENTS

Preparedness Map for Community Resilience: Earthquakes – Experience of Japan
OBJECTIVES OF THIS TECHNICAL HANDBOOKPerched on the edge of the intersection of three
tectonic plates, Japan has been repeatedly hit
and devastated by earthquakes. However, Japan
has revitalized itself as a nation and a society
every time, and its accumulated knowledge has
served to advance its resilience and minimize
future risks and losses.
This manual focuses on Japanese Seismic
Preparedness Maps, one of the tools used in
Japan to communicate earthquake risks for
better preparedness at the community level.
Produced by local governments, these maps
aim to help communities prepare for future
potential seismic events with information on
hazard and risk levels, estimated damages, and
evacuation routes and sites. Information on
key contacts at government agencies where
support can be provided and tips to reduce the
impact from earthquakes at the community and
household levels.
The intended audience of this handbook is
government officials and practitioners working
in seismic risk management, community-
based disaster risk management, risk
communications, and related areas who are
responsible for preparing communities for
the next big seismic event. The hope is that
Japan’s approach to risk communication at
the community level can be leveraged in other
countries with high seismic risk.
ix

Preparedness Map for Community Resilience: Earthquakes – Experience of Japan
CHAPTER
01
What Are Seismic Preparedness Maps?
Throughout Japan, the risk of earthquake is
high. As part of the government’s effort to
communicate the risk from earthquakes and
related hazards induced by ground shaking,
Seismic Preparedness Maps are produced and
distributed to every household. The aim of the
Seismic Preparedness Maps is to communicate
the risk from earthquakes and encourage
preparedness at the household level.
This manual provides an overview of Seismic
Preparedness Maps. It offers a step-by-step
overview of how they are made, including
the scientific data sets that are needed, and
it explains how Seismic Preparedness Maps
are used in Japan to promote awareness
of the risks from earthquakes. The goal is
to allow other countries with high seismic
risks to adopt a similar approach in order to
communicate these risks to local communities
and protect lives.
The use of the term “Seismic Preparedness Map” in this document
Globally, the term “hazard map” is used to
describe a map that shows the parameters
of a likely natural hazard in a given location.
However, in Japan, the term “hazard map”
is applied to a particular type of map—one
produced and distributed to households by
local governments that shows the location
of evacuation sites and includes other types
of useful information designed to save lives
and promote disaster preparedness. To avoid
confusion, this document uses the term
“Seismic Preparedness Map” to refer to this
type of map, and uses the term “hazard map” in
its more conventional sense.
INTRODUCTION TO SEISMIC PREPAREDNESS MAPS
Summary: Seismic Preparedness Maps are produced to inform local communities about the risk from earthquakes and their secondary hazards. As Japan is situated in an area where tectonic activity is very high, earthquake risk is high throughout the country. It is important that communities are aware of the risks they are exposed to and know how to prepare for and react to earthquakes. The so-called Seismic Preparedness Maps visualize and communicate the spatial distribution of the expected earthquake hazards and risks, the location of evacuation centers, and the types of damage expected to occur.
The main objective of this manual is to describe the components of and steps for producing Seismic Preparedness Maps, so that similar maps can be produced in other parts of the world that are vulnerable to earthquakes. By increasing awareness and knowledge of potential hazards and risks faced by communities, the maps prepare communities for the next big event and help to reduce fatalities and loss of assets.
01
Preparedness Map for Community Resilience: Earthquakes – Experience of Japan
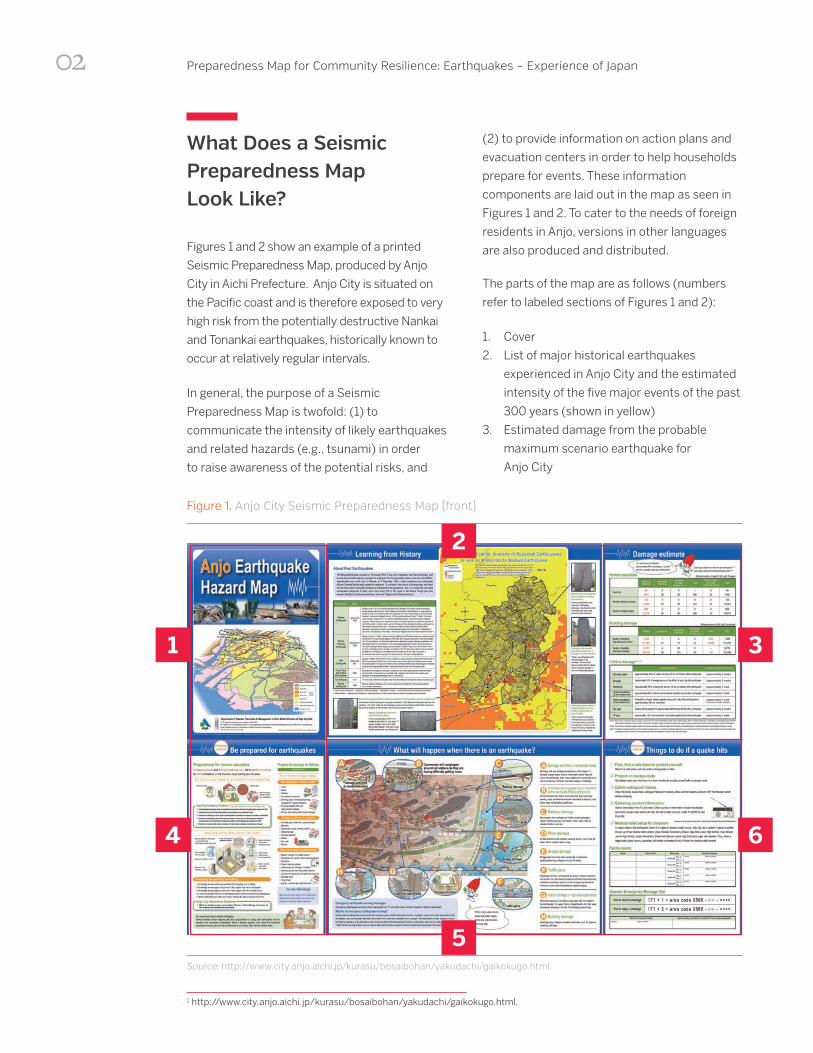
What Does a Seismic Preparedness Map Look Like?
Figures 1 and 2 show an example of a printed
Seismic Preparedness Map, produced by Anjo
City in Aichi Prefecture. Anjo City is situated on
the Pacific coast and is therefore exposed to very
high risk from the potentially destructive Nankai
and Tonankai earthquakes, historically known to
occur at relatively regular intervals.
In general, the purpose of a Seismic
Preparedness Map is twofold: (1) to
communicate the intensity of likely earthquakes
and related hazards (e.g., tsunami) in order
to raise awareness of the potential risks, and
(2) to provide information on action plans and
evacuation centers in order to help households
prepare for events. These information
components are laid out in the map as seen in
Figures 1 and 2. To cater to the needs of foreign
residents in Anjo, versions in other languages
are also produced and distributed.
The parts of the map are as follows (numbers
refer to labeled sections of Figures 1 and 2):
1. Cover
2. List of major historical earthquakes
experienced in Anjo City and the estimated
intensity of the five major events of the past
300 years (shown in yellow)
3. Estimated damage from the probable
maximum scenario earthquake for
Anjo City
Figure 1. Anjo City Seismic Preparedness Map (front)
Source: http://www.city.anjo.aichi.jp/kurasu/bosaibohan/yakudachi/gaikokugo.html.
1 http://www.city.anjo.aichi.jp/kurasu/bosaibohan/yakudachi/gaikokugo.html.
02
2
5
3
6
1
4
Introduction to Seismic Preparedness Maps
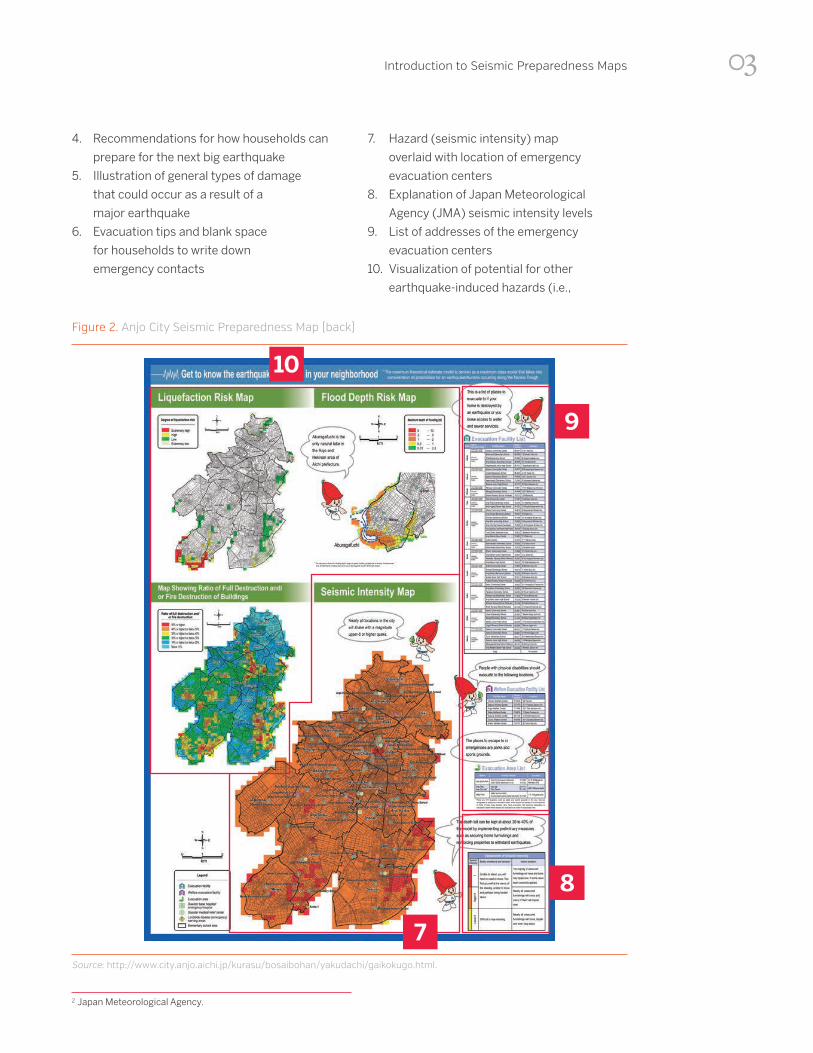
4. Recommendations for how households can
prepare for the next big earthquake
5. Illustration of general types of damage
that could occur as a result of a
major earthquake
6. Evacuation tips and blank space
for households to write down
emergency contacts
7. Hazard (seismic intensity) map
overlaid with location of emergency
evacuation centers
8. Explanation of Japan Meteorological
Agency (JMA) seismic intensity levels
9. List of addresses of the emergency
evacuation centers
10. Visualization of potential for other
earthquake-induced hazards (i.e.,
Figure 2. Anjo City Seismic Preparedness Map (back)
Source: http://www.city.anjo.aichi.jp/kurasu/bosaibohan/yakudachi/gaikokugo.html.
2 Japan Meteorological Agency.
10
8
9
03
7
Preparedness Map for Community Resilience: Earthquakes – Experience of Japan
liquefaction, inundation) and map showing
share of buildings destroyed or burned
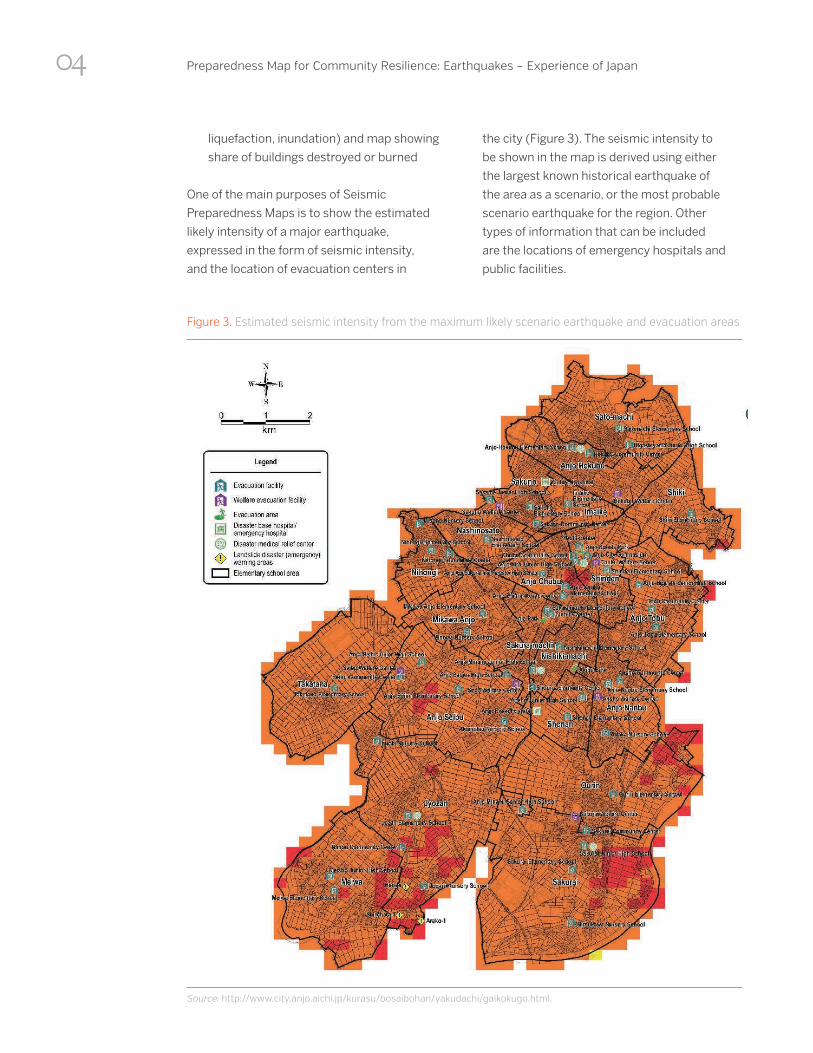
One of the main purposes of Seismic
Preparedness Maps is to show the estimated
likely intensity of a major earthquake,
expressed in the form of seismic intensity,
and the location of evacuation centers in
the city (Figure 3). The seismic intensity to
be shown in the map is derived using either
the largest known historical earthquake of
the area as a scenario, or the most probable
scenario earthquake for the region. Other
types of information that can be included
are the locations of emergency hospitals and
public facilities.
Figure 3. Estimated seismic intensity from the maximum likely scenario earthquake and evacuation areas
Source: http://www.city.anjo.aichi.jp/kurasu/bosaibohan/yakudachi/gaikokugo.html.
04
Introduction to Seismic Preparedness Maps
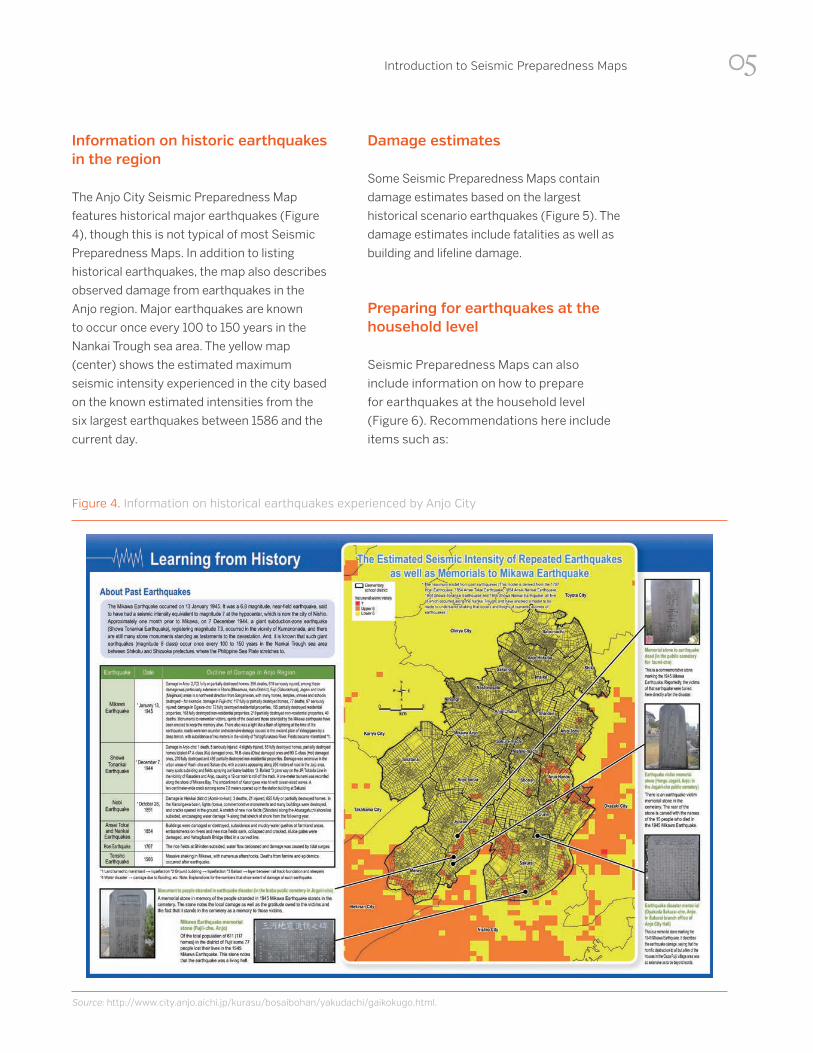
Information on historic earthquakes in the region
The Anjo City Seismic Preparedness Map
features historical major earthquakes (Figure
4), though this is not typical of most Seismic
Preparedness Maps. In addition to listing
historical earthquakes, the map also describes
observed damage from earthquakes in the
Anjo region. Major earthquakes are known
to occur once every 100 to 150 years in the
Nankai Trough sea area. The yellow map
(center) shows the estimated maximum
seismic intensity experienced in the city based
on the known estimated intensities from the
six largest earthquakes between 1586 and the
current day.
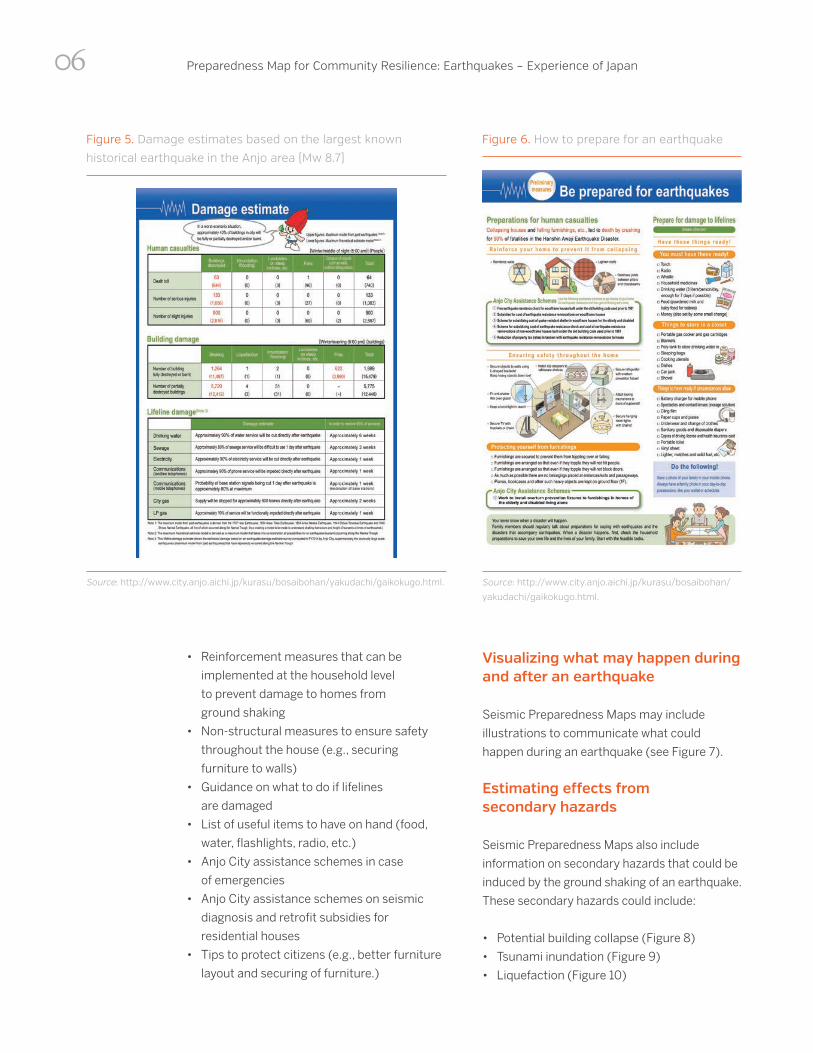
Damage estimates
Some Seismic Preparedness Maps contain
damage estimates based on the largest
historical scenario earthquakes (Figure 5). The
damage estimates include fatalities as well as
building and lifeline damage.
Preparing for earthquakes at the household level
Seismic Preparedness Maps can also
include information on how to prepare
for earthquakes at the household level
(Figure 6). Recommendations here include
items such as:
Figure 4. Information on historical earthquakes experienced by Anjo City
Source: http://www.city.anjo.aichi.jp/kurasu/bosaibohan/yakudachi/gaikokugo.html.
05
Preparedness Map for Community Resilience: Earthquakes – Experience of Japan
• Reinforcement measures that can be
implemented at the household level
to prevent damage to homes from
ground shaking
• Non-structural measures to ensure safety
throughout the house (e.g., securing
furniture to walls)
• Guidance on what to do if lifelines
are damaged
• List of useful items to have on hand (food,
water, flashlights, radio, etc.)
• Anjo City assistance schemes in case
of emergencies
• Anjo City assistance schemes on seismic
diagnosis and retrofit subsidies for
residential houses
• Tips to protect citizens (e.g., better furniture
layout and securing of furniture.)
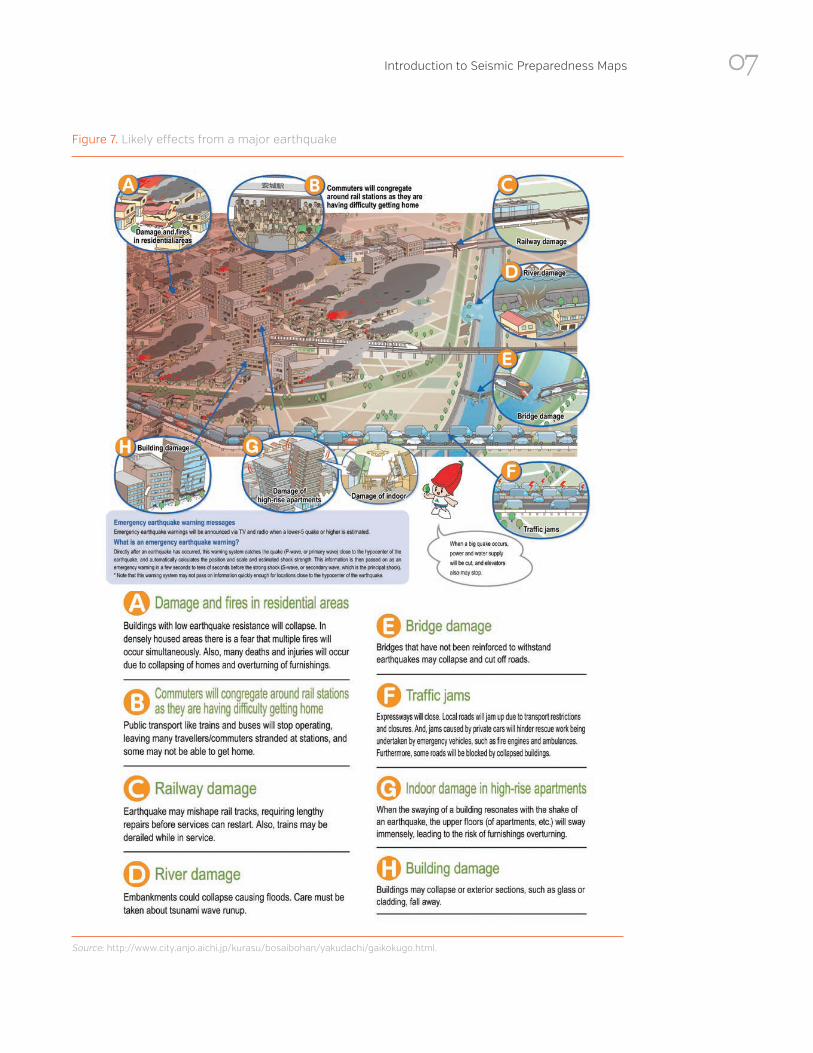
Visualizing what may happen during and after an earthquake
Seismic Preparedness Maps may include
illustrations to communicate what could
happen during an earthquake (see Figure 7).
Estimating effects from secondary hazards
Seismic Preparedness Maps also include
information on secondary hazards that could be
induced by the ground shaking of an earthquake.
These secondary hazards could include:
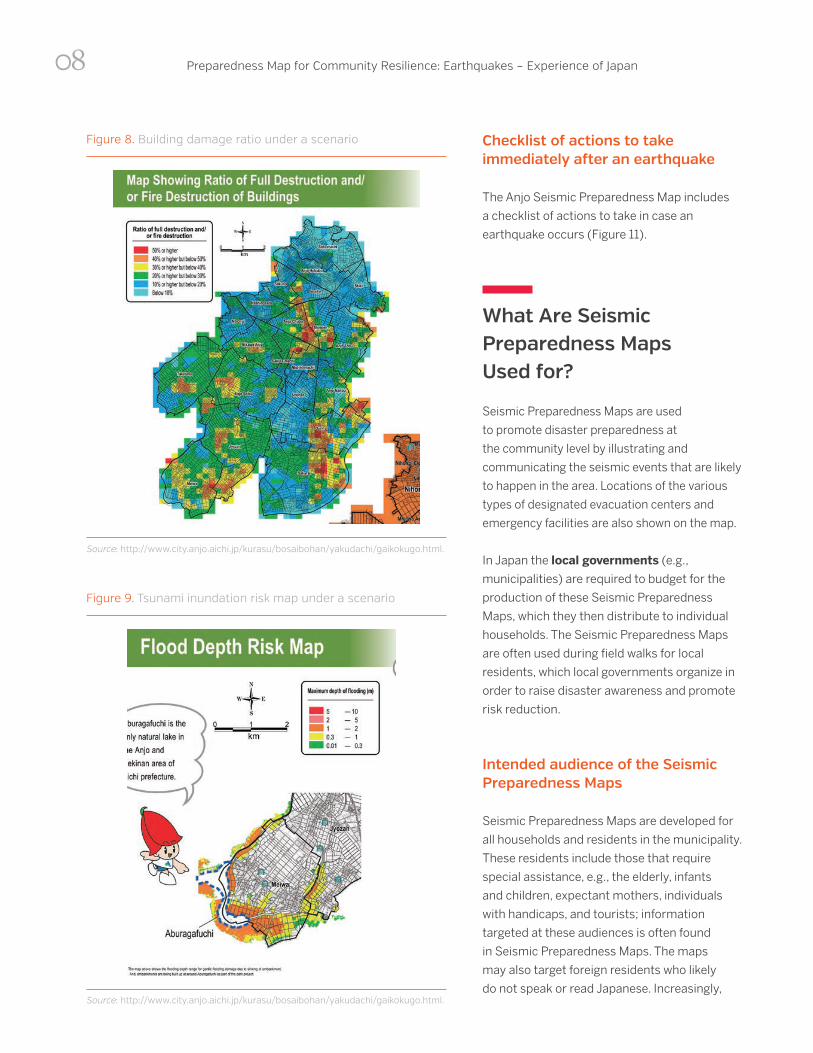
• Potential building collapse (Figure 8)
• Tsunami inundation (Figure 9)
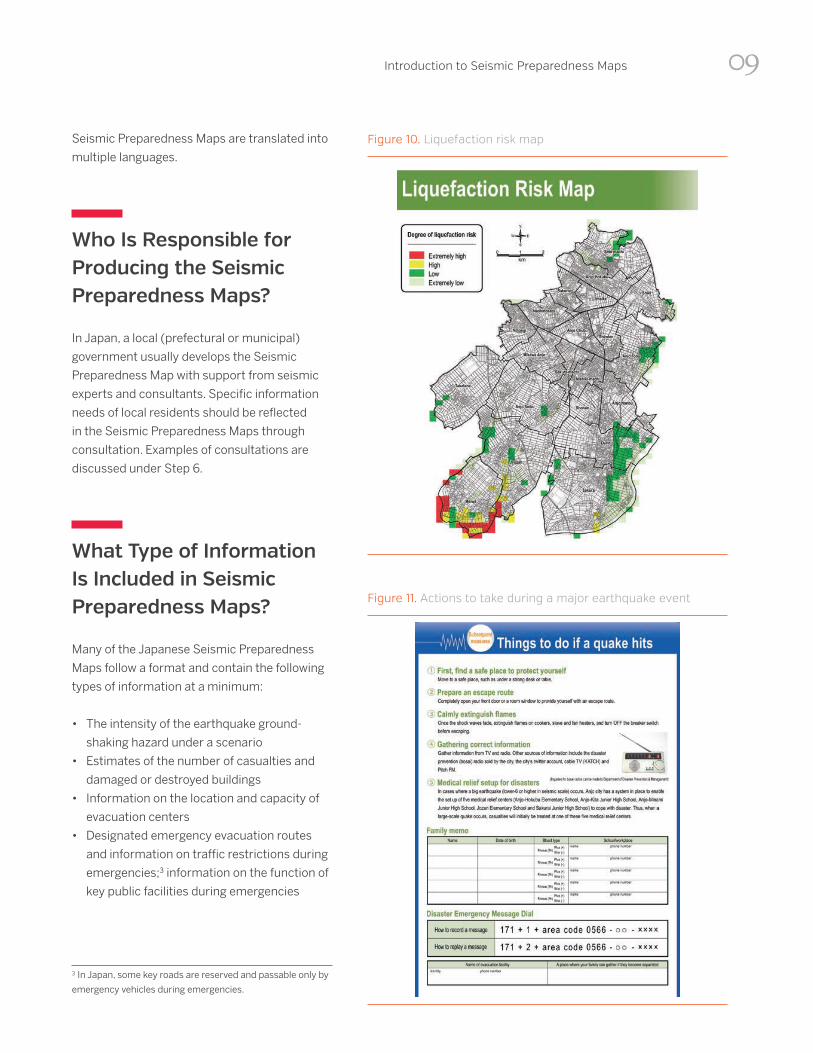
• Liquefaction (Figure 10)
Figure 5. Damage estimates based on the largest known
historical earthquake in the Anjo area (Mw 8.7)
Source: http://www.city.anjo.aichi.jp/kurasu/bosaibohan/yakudachi/gaikokugo.html.
Figure 6. How to prepare for an earthquake
Source: http://www.city.anjo.aichi.jp/kurasu/bosaibohan/
yakudachi/gaikokugo.html.
06
Introduction to Seismic Preparedness Maps
Figure 7. Likely effects from a major earthquake
Source: http://www.city.anjo.aichi.jp/kurasu/bosaibohan/yakudachi/gaikokugo.html.
07
Preparedness Map for Community Resilience: Earthquakes – Experience of Japan
Checklist of actions to take immediately after an earthquake
The Anjo Seismic Preparedness Map includes
a checklist of actions to take in case an
earthquake occurs (Figure 11).
What Are Seismic Preparedness Maps Used for?
Seismic Preparedness Maps are used
to promote disaster preparedness at
the community level by illustrating and
communicating the seismic events that are likely
to happen in the area. Locations of the various
types of designated evacuation centers and
emergency facilities are also shown on the map.
In Japan the local governments (e.g.,
municipalities) are required to budget for the
production of these Seismic Preparedness
Maps, which they then distribute to individual
households. The Seismic Preparedness Maps
are often used during field walks for local
residents, which local governments organize in
order to raise disaster awareness and promote
risk reduction.
Intended audience of the Seismic Preparedness Maps
Seismic Preparedness Maps are developed for
all households and residents in the municipality.
These residents include those that require
special assistance, e.g., the elderly, infants
and children, expectant mothers, individuals
with handicaps, and tourists; information
targeted at these audiences is often found
in Seismic Preparedness Maps. The maps
may also target foreign residents who likely
do not speak or read Japanese. Increasingly,
Figure 8. Building damage ratio under a scenario
Source: http://www.city.anjo.aichi.jp/kurasu/bosaibohan/yakudachi/gaikokugo.html.
Figure 9. Tsunami inundation risk map under a scenario
Source: http://www.city.anjo.aichi.jp/kurasu/bosaibohan/yakudachi/gaikokugo.html.
08
Introduction to Seismic Preparedness Maps
Seismic Preparedness Maps are translated into
multiple languages.
Who Is Responsible for Producing the Seismic Preparedness Maps?
In Japan, a local (prefectural or municipal)
government usually develops the Seismic
Preparedness Map with support from seismic
experts and consultants. Specific information
needs of local residents should be reflected
in the Seismic Preparedness Maps through
consultation. Examples of consultations are
discussed under Step 6.
What Type of Information Is Included in Seismic Preparedness Maps?
Many of the Japanese Seismic Preparedness
Maps follow a format and contain the following
types of information at a minimum:
• The intensity of the earthquake ground-
shaking hazard under a scenario
• Estimates of the number of casualties and
damaged or destroyed buildings
• Information on the location and capacity of
evacuation centers
• Designated emergency evacuation routes
and information on traffic restrictions during
emergencies;3 information on the function of
key public facilities during emergencies
Figure 10. Liquefaction risk map
Figure 11. Actions to take during a major earthquake event
3 In Japan, some key roads are reserved and passable only by
emergency vehicles during emergencies.
09
Preparedness Map for Community Resilience: Earthquakes – Experience of Japan
• Simple interventions that can improve
the resilience of a residential structure
against earthquakes
• Useful items to stock for emergency
situations (food, water, flashlights, radios,
etc.)
• Recommended actions to take during
an earthquake
• Support available from national and local
governments to improve the earthquake
resilience of residential structures and to aid
households following an earthquake
• Free dial service for disaster emergency
message hotline4
These aspects will be described in more detail
in the following sections.
Multi-Hazard Preparedness Maps are available
from the local governments’ websites as
well as from the Disaster Preparedness
Map portal (called “Hazard Map Portal” in
Japan) operated by the Ministry of Land,
Infrastructure, Transport and Tourism (MLIT).
4 In Japan, phone companies have set up a free dial number that is activated during emergencies. Anyone affected by the natural
disaster can leave a message for family members to convey where they have evacuated to, etc.
10
CHAPTER
02
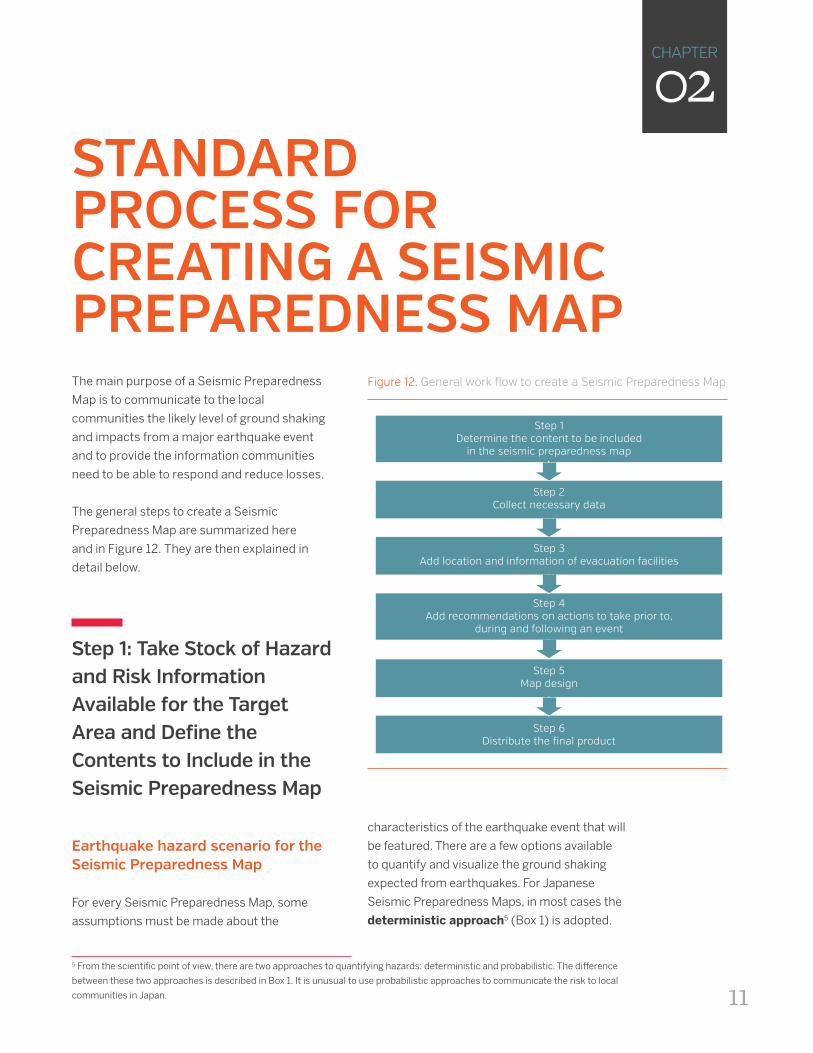
The main purpose of a Seismic Preparedness
Map is to communicate to the local
communities the likely level of ground shaking
and impacts from a major earthquake event
and to provide the information communities
need to be able to respond and reduce losses.
The general steps to create a Seismic
Preparedness Map are summarized here
and in Figure 12. They are then explained in
detail below.
Step 1: Take Stock of Hazard and Risk Information Available for the Target Area and Define the Contents to Include in the Seismic Preparedness Map
Earthquake hazard scenario for the Seismic Preparedness Map
For every Seismic Preparedness Map, some
assumptions must be made about the
characteristics of the earthquake event that will
be featured. There are a few options available
to quantify and visualize the ground shaking
expected from earthquakes. For Japanese
Seismic Preparedness Maps, in most cases the
deterministic approach5 (Box 1) is adopted.
STANDARD PROCESS FOR CREATING A SEISMIC PREPAREDNESS MAP
5 From the scientific point of view, there are two approaches to quantifying hazards: deterministic and probabilistic. The difference
between these two approaches is described in Box 1. It is unusual to use probabilistic approaches to communicate the risk to local
communities in Japan.
Figure 12. General work flow to create a Seismic Preparedness Map
Step 1Determine the content to be included
in the seismic preparedness map
Step 2Collect necessary data
Step 3Add location and information of evacuation facilities
Step 5Map design
Step 6Distribute the final product
Step 4Add recommendations on actions to take prior to,
during and following an event
11
Preparedness Map for Community Resilience: Earthquakes – Experience of Japan
Deterministic approaches select and use a
single earthquake scenario from the many
scenarios that could potentially happen, and
illustrate the level of ground shaking it produces
and its effects on the structures and assets
on the ground.6 There are several possible
earthquake scenarios that can be used in a
Seismic Preparedness Map:
• A scenario from a known historical event in
the past
• The most likely scenario identified using
scientific models
• The maximum probable event scenario
identified using scientific models
The decision on what type of scenario to use
will depend on factors such as data availability
and recommendations from seismic experts.
To determine the scenario to use for the Seismic
Preparedness Map being planned, the project
team should first gain an understanding of the
different hazard types that are likely to occur
in the region, along with their intensity and
frequency. From this bigger picture, the project
team should then start to narrow down the focus
of the Seismic Preparedness Map by prioritizing
hazards based on the severity of the impact
they are likely to have and other factors that are
deemed important in the local context, while at
the same time acknowledging that the next major
event will likely not exactly follow the scenario
selected. Lessons learned from past Japanese
events suggest that local residents may not
necessarily understand this shortcoming of the
Seismic Preparedness Map, which makes them
unprepared for different event scenarios.
Sources of hazard information
To understand the range and likelihood
of hazard(s) occurring in the area, hazard
assessments can be carried out using scientific
6 These are expressed as earthquake “intensity.”
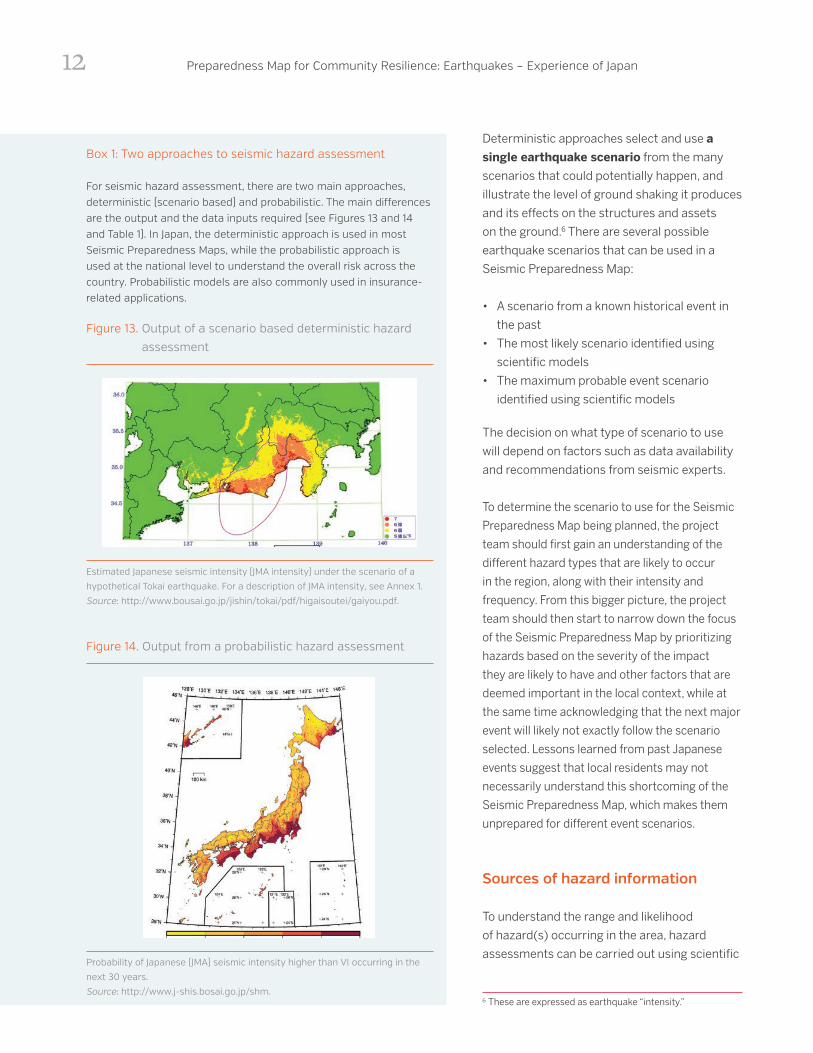
Box 1: Two approaches to seismic hazard assessment
For seismic hazard assessment, there are two main approaches, deterministic (scenario based) and probabilistic. The main differences are the output and the data inputs required (see Figures 13 and 14 and Table 1). In Japan, the deterministic approach is used in most Seismic Preparedness Maps, while the probabilistic approach is used at the national level to understand the overall risk across the country. Probabilistic models are also commonly used in insurance-related applications.
Figure 13. Output of a scenario based deterministic hazard
assessment
Estimated Japanese seismic intensity (JMA intensity) under the scenario of a
hypothetical Tokai earthquake. For a description of JMA intensity, see Annex 1.
Source: http://www.bousai.go.jp/jishin/tokai/pdf/higaisoutei/gaiyou.pdf.
Figure 14. Output from a probabilistic hazard assessment
Probability of Japanese (JMA) seismic intensity higher than VI occurring in the
next 30 years.
Source: http://www.j-shis.bosai.go.jp/shm.
12
Standard Process for Creating a Seismic Preparedness Map
models. However, it is rare for a full scientific
study to be conducted for the sole purpose of
creating a Seismic Preparedness Map, as these
studies can be costly. In Japan there are several
data sources where hazard information may be
readily available. These include:
• Historical hazard information maintained
by organizations such as meteorological
agencies7 and local governments
• Earthquake risk assessment studies
based on scientific models carried
out by national government agencies,
prefectural governments, and earthquake
research institutes
In the absence of information from these sources,
it may become necessary to conduct hazard
assessments using scientific models, though
doing so is costly. The more feasible option in the
absence of a scientific model is to use historical
scenarios and data for the scenario.
Secondary hazards induced by earthquake ground shaking
To capture the full range of the possible hazards,
the physical geographical context of the region
should also be considered. This is because
earthquakes can cause secondary hazards
such as liquefaction, tsunami, and landslides;
thus if the region is mountainous, for example,
landslide risk should also be communicated to
the communities and included in the Seismic
Preparedness Map. Liquefaction can occur
where there are abandoned river channels or
landfills; if the area has a coastline, the risk
from tsunami should also be considered. If the
building stock has a high proportion of timber
buildings, risk from fire should be considered.
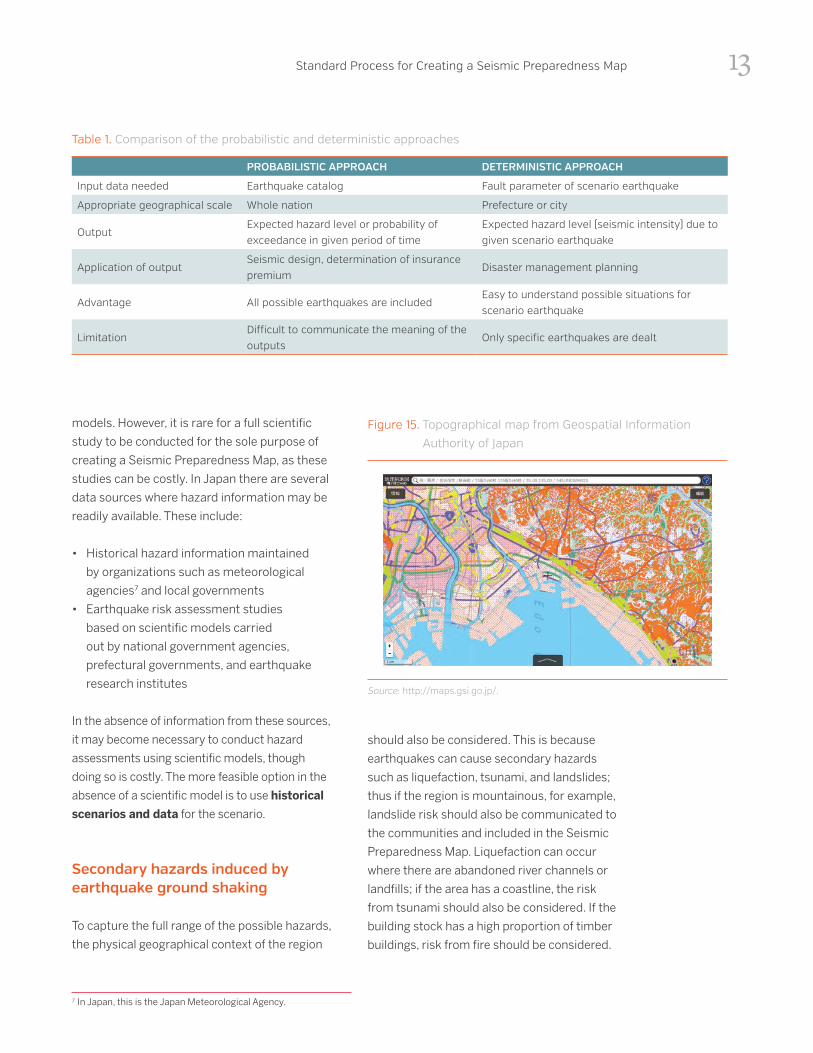
Table 1. Comparison of the probabilistic and deterministic approaches
PROBABILISTIC APPROACH DETERMINISTIC APPROACH
Input data needed Earthquake catalog Fault parameter of scenario earthquake
Appropriate geographical scale Whole nation Prefecture or city
OutputExpected hazard level or probability of exceedance in given period of time
Expected hazard level (seismic intensity) due to given scenario earthquake
Application of outputSeismic design, determination of insurance premium
Disaster management planning
Advantage All possible earthquakes are includedEasy to understand possible situations for scenario earthquake
LimitationDifficult to communicate the meaning of the outputs
Only specific earthquakes are dealt
7 In Japan, this is the Japan Meteorological Agency.
Figure 15. Topographical map from Geospatial Information
Authority of Japan
Source: http://maps.gsi.go.jp/.
13
Preparedness Map for Community Resilience: Earthquakes – Experience of Japan
Where the physical profile of the region warrants
it, the availability of data/information on these
hazards (from past projects or risk assessments
done by national government agencies) should
be investigated.
Other types of information to consider including in a Seismic Preparedness Map
Once the range of hazards likely to occur in
the region is screened, and stock taking of
the available off-the-shelf hazard data from
the various ministries and organizations is
completed, consider other types of information
to include in the Seismic Preparedness Map.
The goal is to assist in the understanding of
the potential impacts from the earthquake and
its secondary hazards. This other information
may include:
• Building damage estimates (Figure 8) giving
the likely number of buildings that will be
destroyed or damaged from the earthquake
scenario being used in the Seismic
Preparedness Map
• Casualty estimates from building collapse
(in regions where buildings are known to be
vulnerable); casualty estimates based on risk
models (Box 2)
• The likely impact on utilities (e.g., water
supply infrastructure, electricity grid)
• The likely impact on key facilities such
as hospitals
• Potential traffic problems (due to blocked
roads and railway networks) and shortages
of goods
This type of information is usually derived
from a scientific risk model. Carry out
stock taking of existing information on
these items, so that information gaps can
be identified. If needed information is not
readily available, it may be necessary to
generate it, provided that the cost of doing
so is not prohibitive.
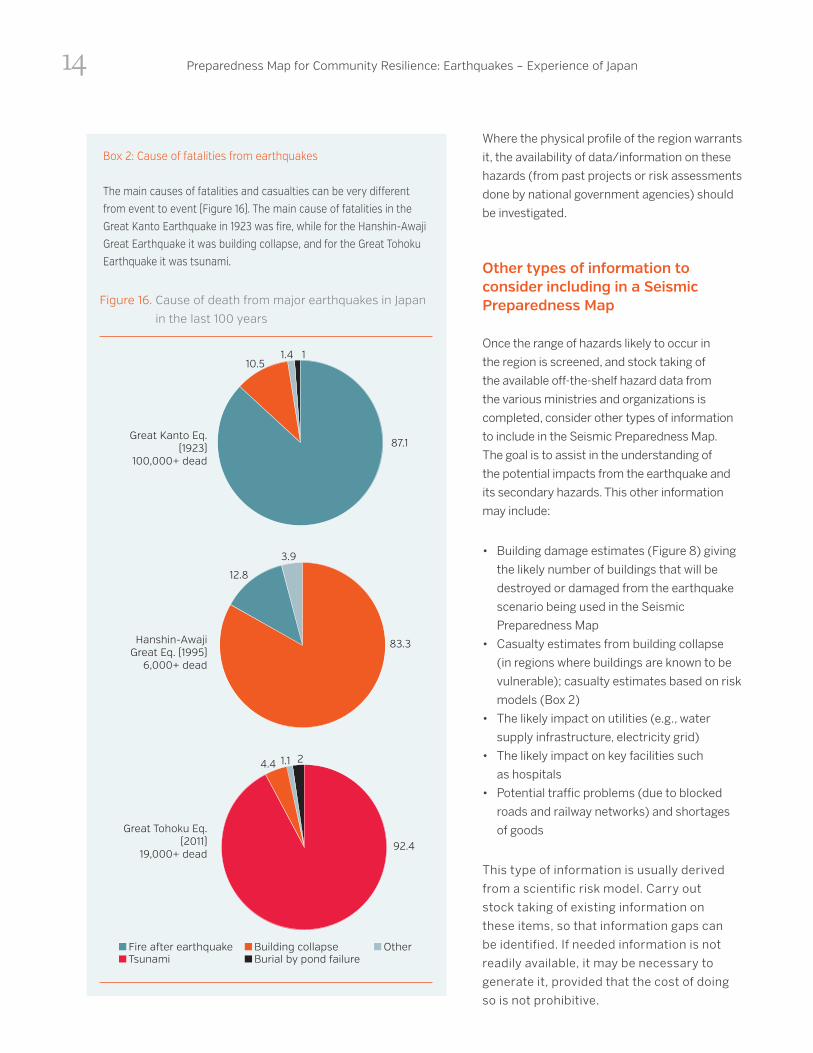
Box 2: Cause of fatalities from earthquakes
The main causes of fatalities and casualties can be very different from event to event (Figure 16). The main cause of fatalities in the Great Kanto Earthquake in 1923 was fire, while for the Hanshin-Awaji Great Earthquake it was building collapse, and for the Great Tohoku Earthquake it was tsunami.
Figure 16. Cause of death from major earthquakes in Japan
in the last 100 years
10.5
12.8
4.4 1.1 2
3.9
83.3
92.4
1.4 1
87.1
Fire a�er earthquake
Great Kanto Eq.(1923)
100,000+ dead
Hanshin-AwajiGreat Eq. (1995)
6,000+ dead
Great Tohoku Eq.(2011)
19,000+ dead
Building collapseTsunami Burial by pond failure
Other
14
Standard Process for Creating a Seismic Preparedness Map
Finalizing the hazard scenario
Following the stock taking of the available data
for the earthquake and secondary hazards,
narrow down and make a decision on the
scenario to use in the Seismic Preparedness
Map based on data availability and significance
of the scenario impacts. If risk models are
available to run for the purpose of creating the
Seismic Preparedness Map, it may be possible
to estimate more complicated scenarios such
as “what would happen if a levee breaks.”
Step 2: Collate Data
Data sources for hazard information
For the Seismic Preparedness Maps, hazard
estimates in most cases are obtained from the
following sources:
• Hazard assessments done for the same
region for past projects
• Risk assessments (damage
estimates) undertaken by national or
prefectural governments
If the hazard-triggering environment has not
changed from the time these past estimates
were made, the assumptions and hazard
assessment outputs can be adopted for the
Seismic Preparedness Map.
Data sources for other input data sets
Other types of data sets to be collected for use in
the Seismic Preparedness Maps include baseline
data for the background map, such as Municipal
boundaries, building footprints, location
of government facilities, key infrastructure
(roads, bridges, railways, hospitals, designated
evacuation centers, etc.), topographical maps,
satellite imagery, and land use.
In Japan basic geospatial information is open
and available from the Geospatial Information
Authority of Japan, downloadable as digital
GIS (Geographical Information System) data.
Private firms have also developed detailed
data sets, particularly of buildings, which are
available at cost. Road network data in Japan
are also available at cost.8
Data sets needed for building damage and casualty estimates
Buildings can sustain damage from ground
shaking, liquefaction, landslides, tsunami, and fire.
• Building damage from ground shaking
is generally calculated based on a damage
curve considering the following risk factors:
old buildings, wooden or other weak
structures, high-rise buildings
• Building damage from fire should be
considered in regions where wooden
buildings are concentrated. Moreover,
because fire occurs simultaneously in
many places during the earthquake, the
operation of fire preventive functions may
be insufficient. Calculate the damage
amount through a simulation that considers
these points.
• The risk of building damage from tsunami
has a risk which increases depending on
inundation depths and building structure
type. Calculate the damage amount from the
inundation depth through a simulation that
considers these points.
Information on casualties and building damage
estimates will only be available if risk models
8 From the Japan Digital Road Map Association.
15
Preparedness Map for Community Resilience: Earthquakes – Experience of Japan
that are designated as evacuation centers also
function as temporary evacuation sites if they
are considered to be in an easily accessible
and safe location. Whatever the facility, the key
criterion is that the location provides safety
from the unfolding event. Once the event
is over, survivors of the event are moved to
evacuation centers, where there are facilities for
water and sanitation and electricity, and where
survivors can stay for a longer, sustained period
during a major disaster. The site itself should
also be safe during the disaster.
The following criteria are used for selecting
temporary evacuation sites:
• Sufficient space for expected number
of evacuees
• Night lighting
• Information equipment for communication
• Where possible, essential goods for an
overnight stay (e.g., blankets) as well as food
and water
An evacuation center (Figure 18) has the
necessary facilities to accommodate affected
residents when homes have been rendered
uninhabitable by the event. These centers
• should have adequate space to
accommodate evacuees
• should be able to provide food and water to
the evacuees until assistance arrives from
outside the affected area
• should be accessible by vehicles
• should be able to house survivors for a
sustained length of time
• should be seismically and fire resistant
• should, where possible, ensure accessibility
for the elderly and disabled
Welfare evacuation sites are special
evacuation sites for people who require
have been developed for the area. The potential
sources for these data sets are national and
local governments, research institutes, and in
some cases international organizations. When
data are not available, it may be necessary to
carry out additional surveys.
Basic data necessary for casualty and building
damage estimates as inputs into risk models are:
• Ground motion data for the scenario being
adopted for the Seismic Preparedness Map,
along with tsunami inundation depth
• Data on buildings, including structure type,
age, number of floors, and location
Step 3: Add Information on Evacuation Sites
Once the hazard scenario is chosen and
data collated, the next step is to overlay on
the Seismic Preparedness Map information
on the location of evacuation sites and
centers (Figure 19). In Japan, there are three
different types of evacuation centers. These
are temporary emergency evacuation
sites, evacuation centers, and welfare
evacuation centers.9 The general conditions
that must be met by the evacuation sites
are as follows, defined in the Disaster
Countermeasures Basic Act.
A temporary emergency evacuation site is
a facility or site, in many cases an open space
(e.g., a park or a parking lot), that satisfies
safety criteria for the different types of hazard
as a temporary evacuation site where residents
can escape from the unfolding event (Figure
17). In many cases existing public buildings
9 In the White Paper on Disaster Risk Management, published annually by the Cabinet Office of the Government of Japan, the three
types of evacuation centers are translated into English as designated emergency evacuation sites, designated evacuation shelters,
and welfare evacuation shelters. Here, different terminology is used that describes the nature of each facility in a more intuitive way.
16
Standard Process for Creating a Seismic Preparedness Map
additional care (e.g., the elderly, disabled
people, people who require special medical
attention). They provide a secure place to stay
until the risk lessens and the necessary care is
again available (Figure 20).
Data required for selecting evacuation centers,
routes, and sites are as follows:
• To select locations of evacuation centers:
Topographic data, elevation data, road
network data, location and width of bridges
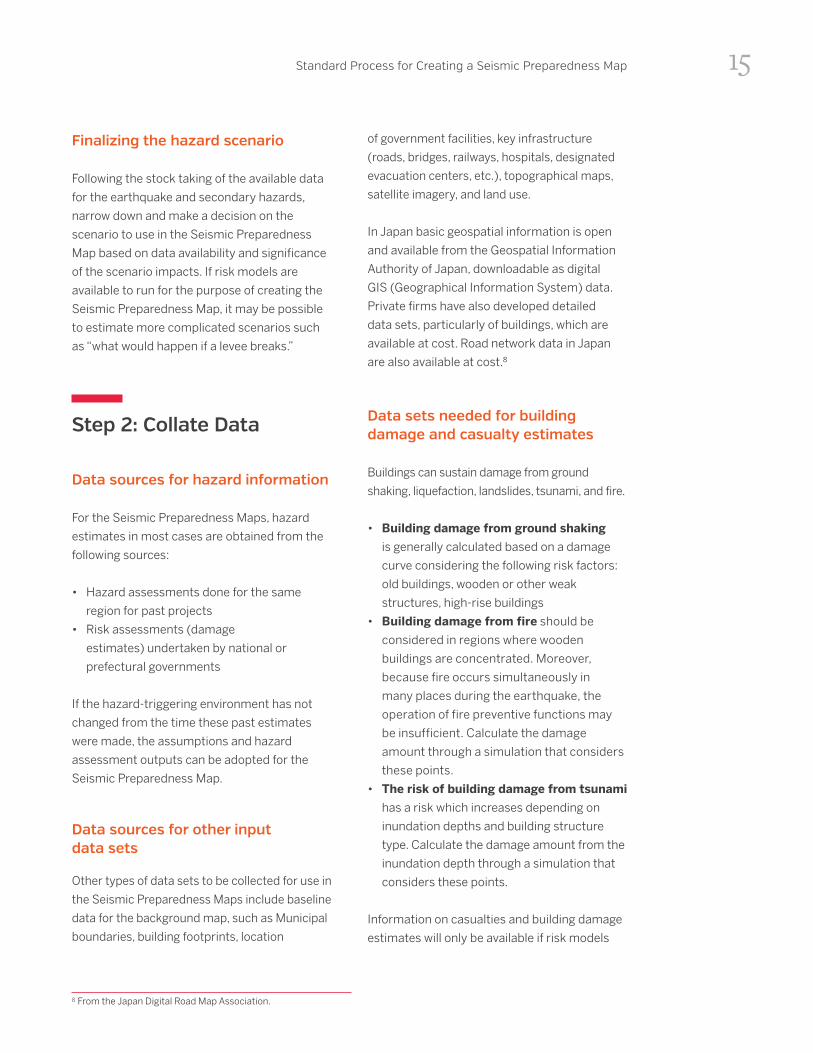
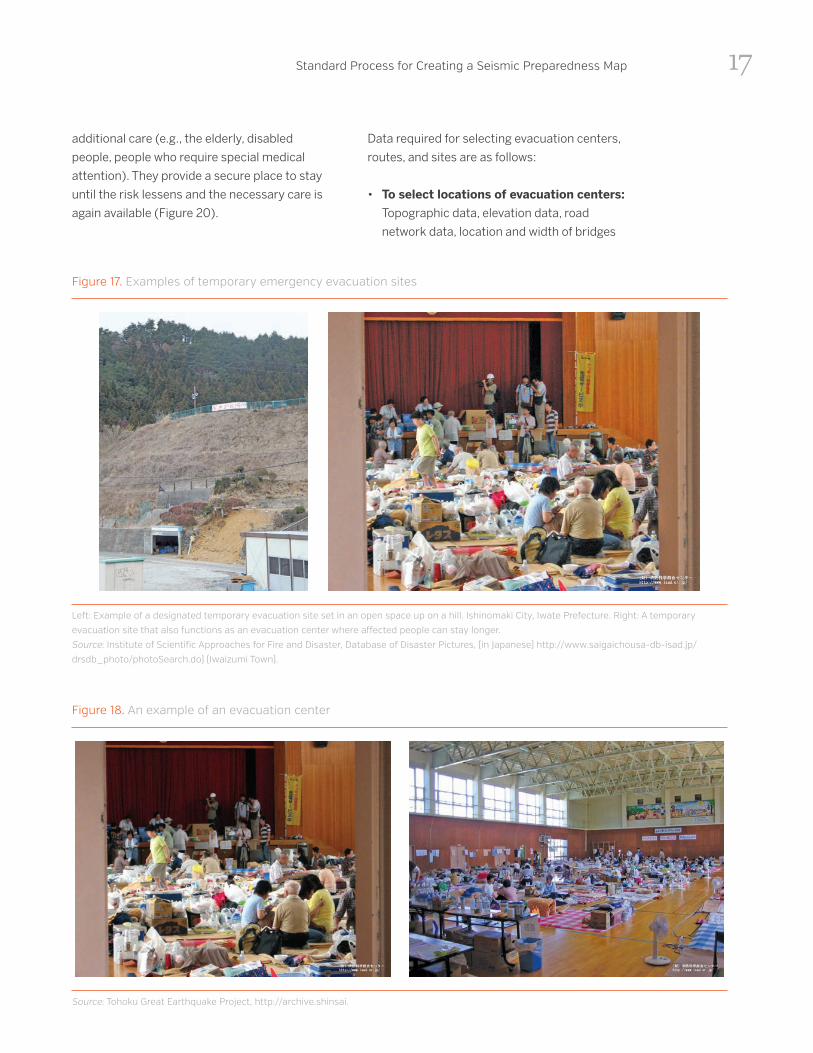
Figure 17. Examples of temporary emergency evacuation sites
Left: Example of a designated temporary evacuation site set in an open space up on a hill. Ishinomaki City, Iwate Prefecture. Right: A temporary
evacuation site that also functions as an evacuation center where affected people can stay longer.
Source: Institute of Scientific Approaches for Fire and Disaster, Database of Disaster Pictures, (in Japanese) http://www.saigaichousa-db-isad.jp/
drsdb_photo/photoSearch.do) (Iwaizumi Town).
Figure 18. An example of an evacuation center
Source: Tohoku Great Earthquake Project, http://archive.shinsai.
17
Preparedness Map for Community Resilience: Earthquakes – Experience of Japan
• For the evacuation centers: Maps showing
building footprints, ground heights, and
structure type
• For evacuation routes: Data on road
network and location and width of bridges
• Tsunami evacuation sites, temporary
shelters: Maps showing building footprints,
heights, and structure type
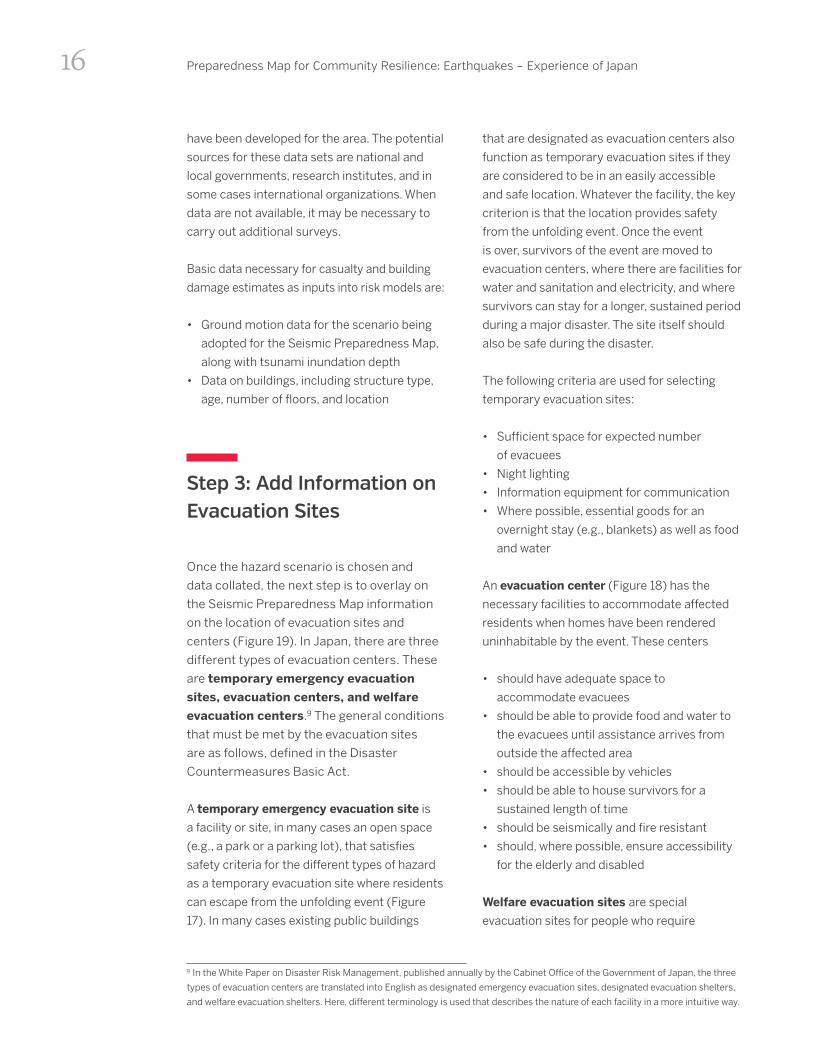
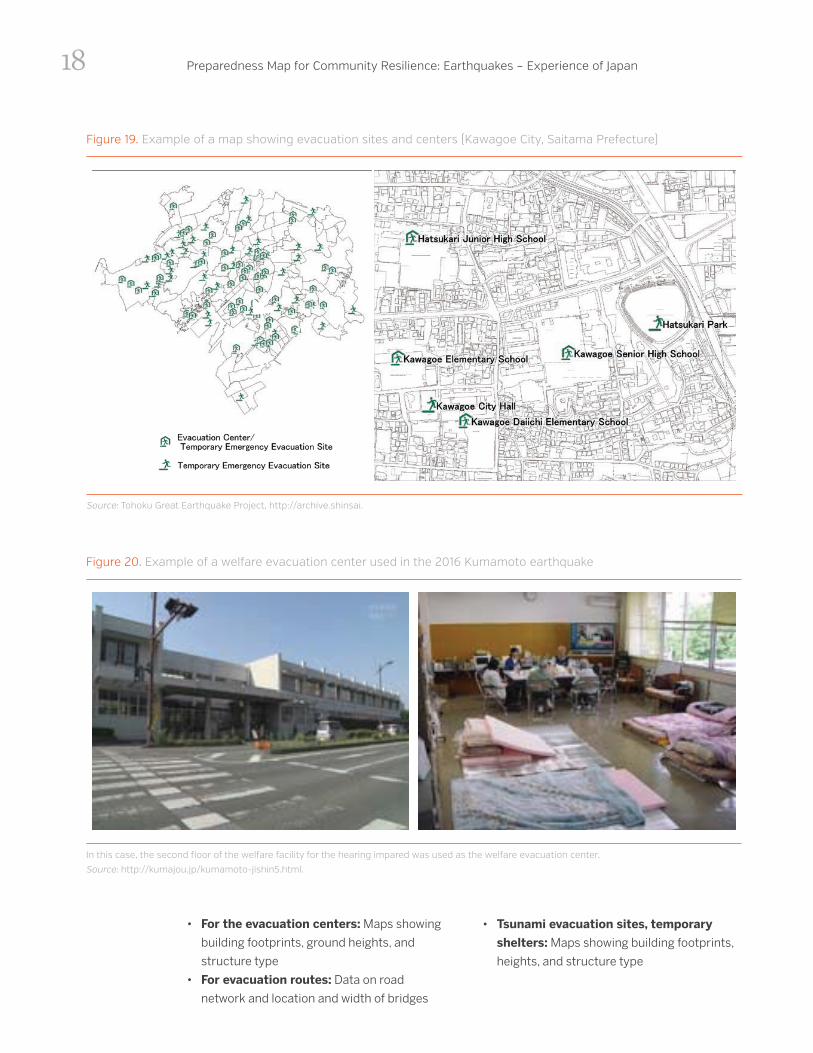
Figure 20. Example of a welfare evacuation center used in the 2016 Kumamoto earthquake
In this case, the second floor of the welfare facility for the hearing impared was used as the welfare evacuation center.
Source: http://kumajou.jp/kumamoto-jishin5.html.
Figure 19. Example of a map showing evacuation sites and centers (Kawagoe City, Saitama Prefecture)
Source: Tohoku Great Earthquake Project, http://archive.shinsai.
18
Standard Process for Creating a Seismic Preparedness Map
Example: Processes to select tsunami evacuation centers
The requirements for evacuation centers
and sites differ depending on the type of
hazard. For earthquakes, the structures must
be quake-resistant. For tsunami evacuation
centers, structures must be tsunami-resistant
and located at a position higher than the
estimated tsunami height plus the height of the
increase in depth due to the presence of the
building. When designating existing buildings
as evacuation centers, these characteristics
should be taken into account for the selection
and upgrading of the buildings to meet the
standards required for a building to be used
as an evacuation center. Consultation with
managers and owners of the candidate (public
or private) buildings should be carried out. If
enough evacuation sites that meet the specific
criteria for the hazard cannot be found among
the existing building stock, consider building
new facilities to meet the capacity needs (e.g., a
tsunami tower; see Box 3).
Detailed criteria to select evacuation centers
are different for different hazards. Annex 2 lists
two documents that describe these criteria in
the Japanese context (the evacuation center
guidelines and the welfare evacuation center
guidelines). As an example, the process to
select evacuation centers for tsunami is
described below.10
1. Perform tsunami simulation to designate
evacuation zones:
10 Fire and Disaster Management Agency, “Report on the development of a tsunami evacuation manual by the Committee for the
promotion of tsunami evacuation,” Japan, 2013.
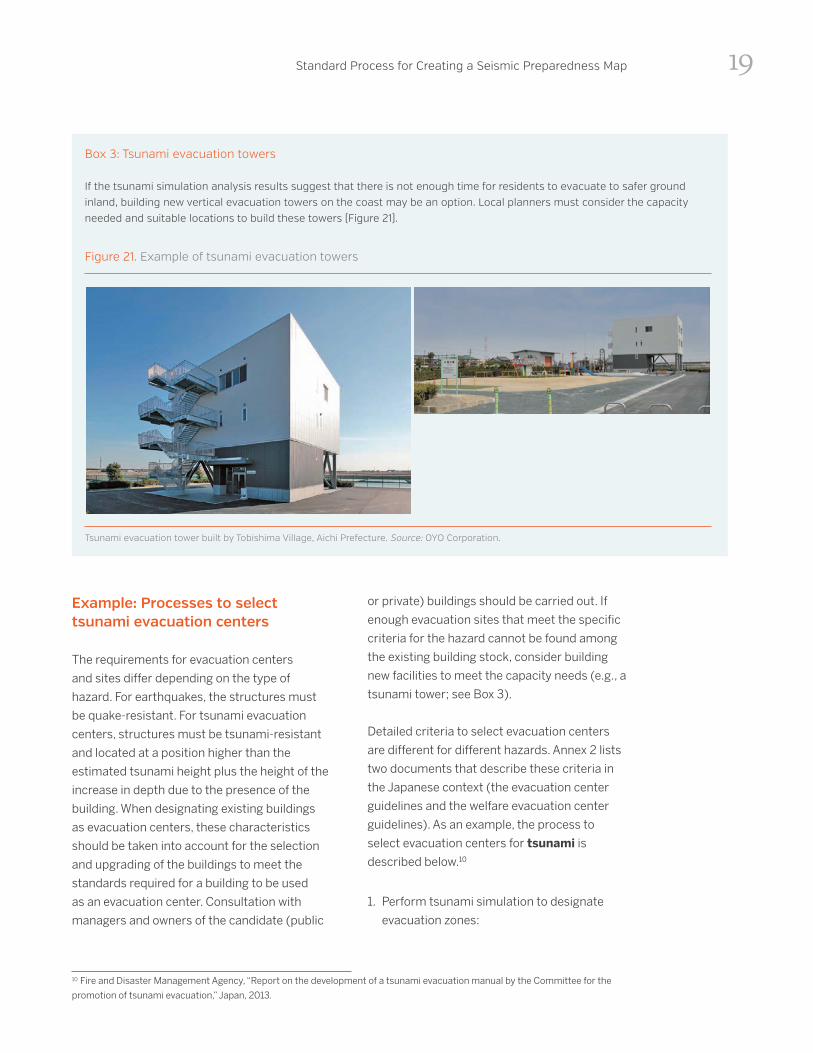
Box 3: Tsunami evacuation towers
If the tsunami simulation analysis results suggest that there is not enough time for residents to evacuate to safer ground inland, building new vertical evacuation towers on the coast may be an option. Local planners must consider the capacity needed and suitable locations to build these towers (Figure 21).
Figure 21. Example of tsunami evacuation towers
Tsunami evacuation tower built by Tobishima Village, Aichi Prefecture. Source: OYO Corporation.
19
Preparedness Map for Community Resilience: Earthquakes – Experience of Japan
• Perform tsunami simulation or find
existing tsunami inundation estimates
to estimate tsunami inundation depths
and arrival time, then designate the
evacuation zones using the simulated
inundation area.
2. Further evaluate within these evacuation
zones the tsunami arrival time and distance
to evacuate to the nearest evacuation centers
from all locations along the roads. In detail:
• In the tsunami evacuation zones, use the
estimated tsunami arrival time and location
of evacuation centers to identify areas
that can be evacuated, assuming a person
starts to evacuate 2–5 minutes after
the earthquake.
• Assume a walking speed of 1.0 m/sec;
reduce this to 0.5 m/sec for people with
difficulty walking (e.g., disabled, young
children, and ill people)
• Assume the distance that people can
evacuate is up to approximately 500m
from their location. This distance should
be adjusted for local conditions.
The methodology for these calculations adopted
in Japan is described in a guideline by the Fire
and Disaster Management Agency (FDMA).11
3. From the previous steps, identify areas
that are likely to have difficulty evacuating.
Consider whether there is a need to increase
the number of evacuation centers. If there is
a need, consider the location, capacity, and
layout required by these additional evacuation
facilities. Consider building vertical evacuation
towers near the coast if residents would have
no time to move to higher ground.
4. To ensure the safety of temporary
emergency evacuation sites and evacuation
buildings, consider the following:
• Temporary emergency evacuation sites
can be either an open space or structure
with high seismic resistance.
• In principle evacuation centers should
be located outside of the evacuation
zone; however, temporary emergency
evacuation sites can be located within
high-risk zones as long as the location is
safe and evacuees can survive the event.
• Both temporary emergency evacuation
sites and evacuation centers should
be located away from slopes where
landslides could occur and away from
hazardous material storage sites.
• Temporary emergency evacuation sites
should preferably have an evacuation path
to other areas, due to the possibility of
higher than expected tsunami.
• The site/center should be clearly
identified as an evacuation site at the
entrance and clearly recognizable.
Functions that are required at tsunami
evacuation centers (shown in Box 3)
include:
• Enough space: 1 m2 per evacuee at minimum
• Night lighting, information equipment
(radio, etc.) for communication and data
collection, water and sanitation facilities
• Stocks of goods for overnight stays (e.g.,
blankets)
• Communication facilities so that evacuees
can receive information on the evolving
situation and communicate any specific
needs with the authorities and the
outside world
5. Requirements for tsunami evacuation
centers (buildings) are as follows:
• In terms of their structure, in Japan
the buildings will ideally be reinforced
concrete12 structures built to the
Japanese building code, with more than
11 http://www.fdma.go.jp/neuter/about/shingi_kento/h24/tsunami_hinan/houkokusho/p02.pdf.12 Steel-reinforced concrete is a building type seen commonly in Japan.
20
Standard Process for Creating a Seismic Preparedness Map
two floors that are equal to or higher than
the estimated flood height (inundation
depth) of a likely tsunami, or equal to or
higher than the standard water level. This
water level is defined as the estimated
flood height (inundation depth) derived
from tsunami models assuming no
buildings, and adding the height that
takes into account the increase in water
level as a result of the building pushing
up the water level. For more information
on the formula to derive this water
level, refer to Cabinet office (2005)
(in Japanese).
• The building should not directly face
coastal areas.
• The structure should be quake-resistant
and be on a designated evacuation
path so that evacuees can access the
evacuation centers with ease.
• The evacuation centers should be clearly
identifiable by local people as emergency
evacuation sites.
• It is desirable to have stairs outside of the
building that will enable evacuation.
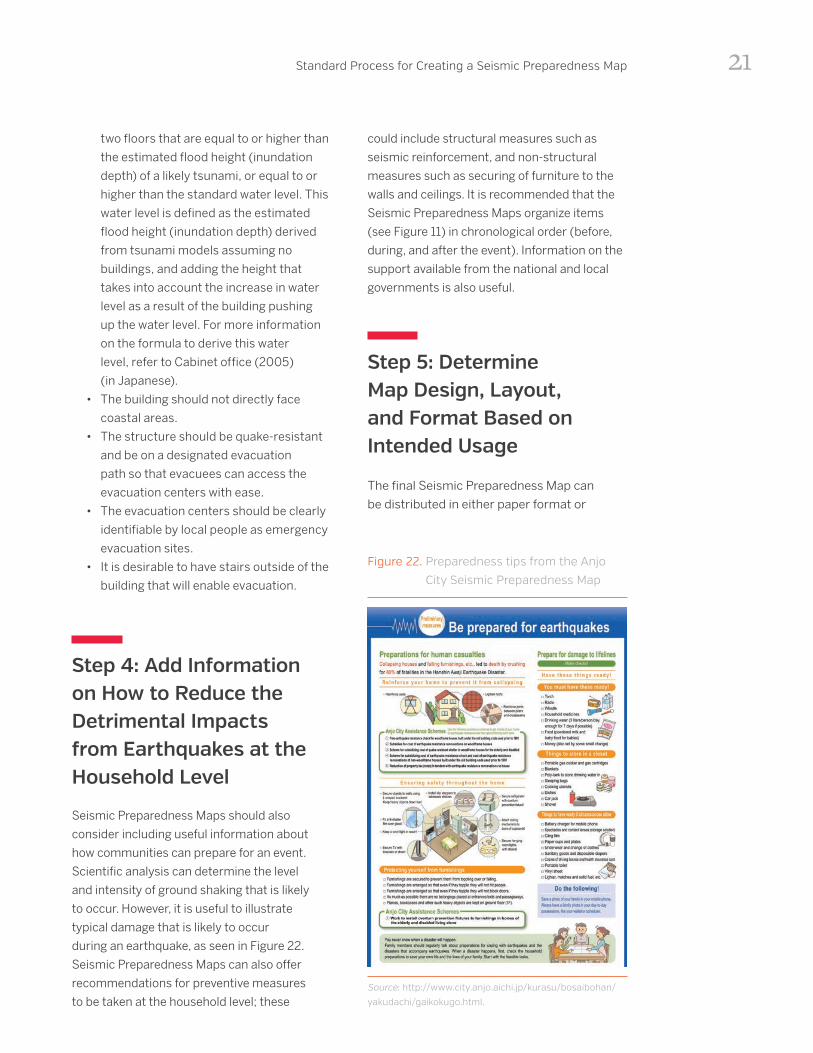
Step 4: Add Information on How to Reduce the Detrimental Impacts from Earthquakes at the Household Level
Seismic Preparedness Maps should also
consider including useful information about
how communities can prepare for an event.
Scientific analysis can determine the level
and intensity of ground shaking that is likely
to occur. However, it is useful to illustrate
typical damage that is likely to occur
during an earthquake, as seen in Figure 22.
Seismic Preparedness Maps can also offer
recommendations for preventive measures
to be taken at the household level; these
could include structural measures such as
seismic reinforcement, and non-structural
measures such as securing of furniture to the
walls and ceilings. It is recommended that the
Seismic Preparedness Maps organize items
(see Figure 11) in chronological order (before,
during, and after the event). Information on the
support available from the national and local
governments is also useful.
Step 5: Determine Map Design, Layout, and Format Based on Intended Usage
The final Seismic Preparedness Map can
be distributed in either paper format or
Figure 22. Preparedness tips from the Anjo
City Seismic Preparedness Map
Source: http://www.city.anjo.aichi.jp/kurasu/bosaibohan/
yakudachi/gaikokugo.html.
21
Preparedness Map for Community Resilience: Earthquakes – Experience of Japan
electronic formats. The Japanese Seismic
Preparedness Maps come in various formats
and modalities and are available via either
local government websites or the MLIT
Hazard Map Portal (Disaster Preparedness
Map portal).13 If the material will be used in
workshops and drills, consider printing a
map that can be folded and distributed to the
participants. For the Seismic Preparedness
Maps to be used at home, consider having
them in a booklet format.
To make the Seismic Preparedness Maps easy
to use for the elderly and color-weak, consider
using large fonts that are easy on the eye, and
use appropriate color schemes. Illustrations
should be visually pleasing for all ages. Follow
cartographic conventions, e.g., for high risk
use red, and for low risk use green or blue.
Make sure to include information items for the
vulnerable population, e.g., tips for evacuation
preparation for pregnant women or elderly.
The color schemes shown in Table 2, Box
4 and Figures 23 and 24 are examples of
recommendations by JMA14 for illustrating
tsunami inundation and seismic intensities.
The Seismic Preparedness Map for Anjo City,
Aichi Prefecture, is available in Japanese, as
well as in English and Portuguese (Figure 25),
reflecting the diversity of the local residents.
Step 6: Distribute and Leverage Seismic Preparedness Maps for Community Disaster Risk Reduction
In Japan, Seismic Preparedness Maps are
distributed to every household to maximize
the communication of earthquake risks.
They are also made available at community
centers and other public facilities, and
are on local government websites. The
Seismic Preparedness Maps are also
used in classrooms to raise awareness of
the potential risk to students. Some local
governments have developed smartphone
apps that can display the risk information
(Figure 26).
Seismic Preparedness Maps are used to
communicate risks to local residents, so
that the residents can take preventative
measures. Figure 28 shows local government
officials in Nagoya City, Japan, delivering
a lecture on the newly developed Seismic
Preparedness Map to help local residents
understand their risk. Many local
governments offer this type of outreach
support upon request of residents. Seismic
Preparedness Maps can also be used to
13 http://disaportal.gsi.go.jp/.14 JMA (2012), Tokyo Metropolitan Government (2015).
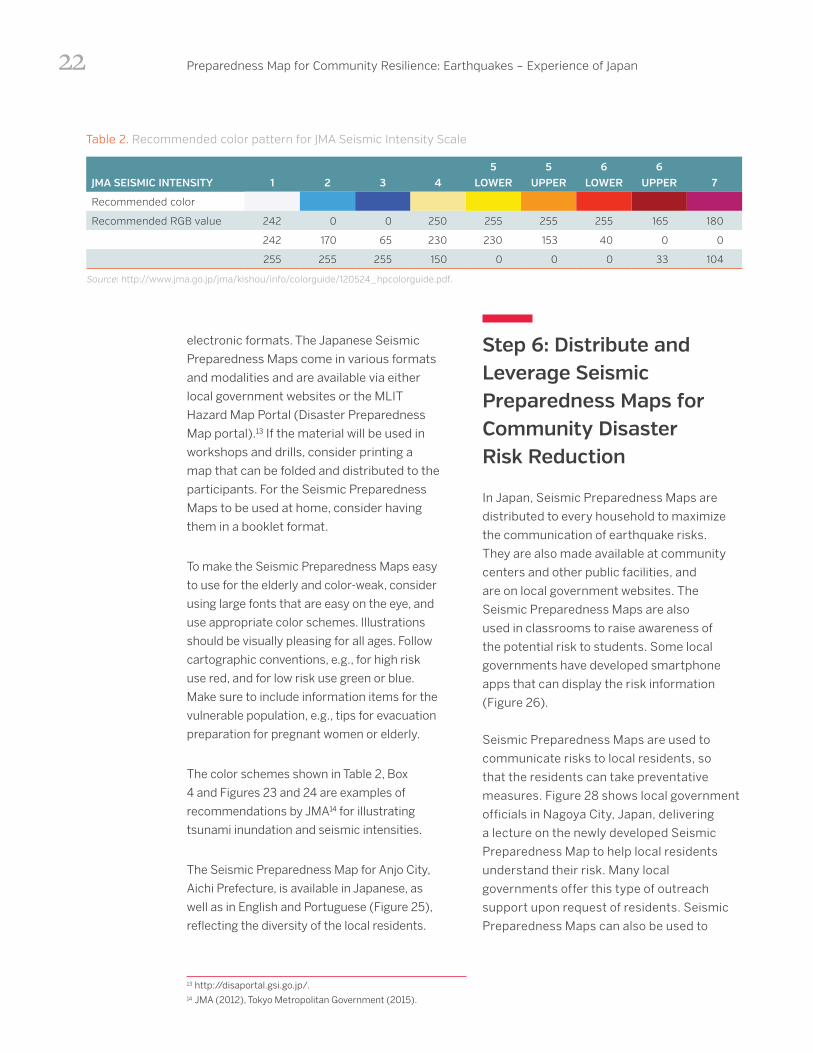
Table 2. Recommended color pattern for JMA Seismic Intensity Scale
JMA SEISMIC INTENSITY 1 2 3 45
LOWER5
UPPER6
LOWER6
UPPER 7
Recommended color
Recommended RGB value 242 0 0 250 255 255 255 165 180
242 170 65 230 230 153 40 0 0
255 255 255 150 0 0 0 33 104
Source: http://www.jma.go.jp/jma/kishou/info/colorguide/120524_hpcolorguide.pdf.
22
Standard Process for Creating a Seismic Preparedness Map
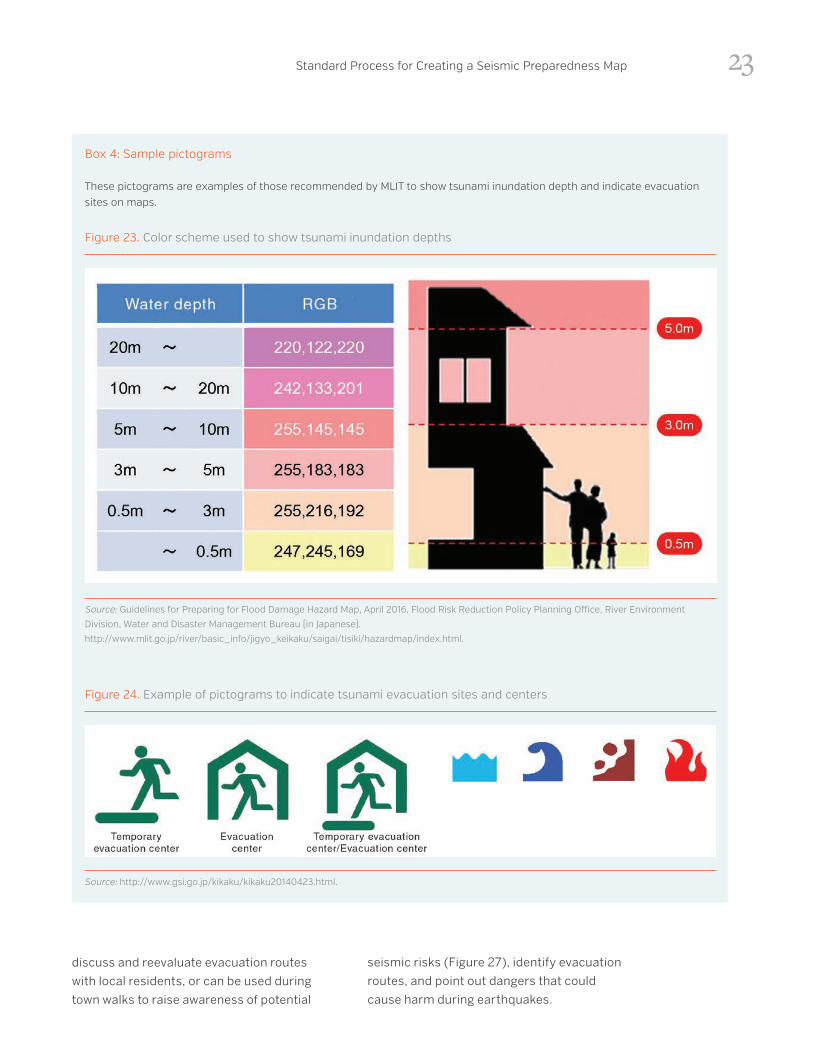
Box 4: Sample pictograms
These pictograms are examples of those recommended by MLIT to show tsunami inundation depth and indicate evacuation sites on maps.
Figure 23. Color scheme used to show tsunami inundation depths
Source: Guidelines for Preparing for Flood Damage Hazard Map, April 2016, Flood Risk Reduction Policy Planning Office, River Environment
Division, Water and Disaster Management Bureau (in Japanese).
http://www.mlit.go.jp/river/basic_info/jigyo_keikaku/saigai/tisiki/hazardmap/index.html.
Figure 24. Example of pictograms to indicate tsunami evacuation sites and centers
Source: http://www.gsi.go.jp/kikaku/kikaku20140423.html.
discuss and reevaluate evacuation routes
with local residents, or can be used during
town walks to raise awareness of potential
seismic risks (Figure 27), identify evacuation
routes, and point out dangers that could
cause harm during earthquakes.
23
Preparedness Map for Community Resilience: Earthquakes – Experience of Japan
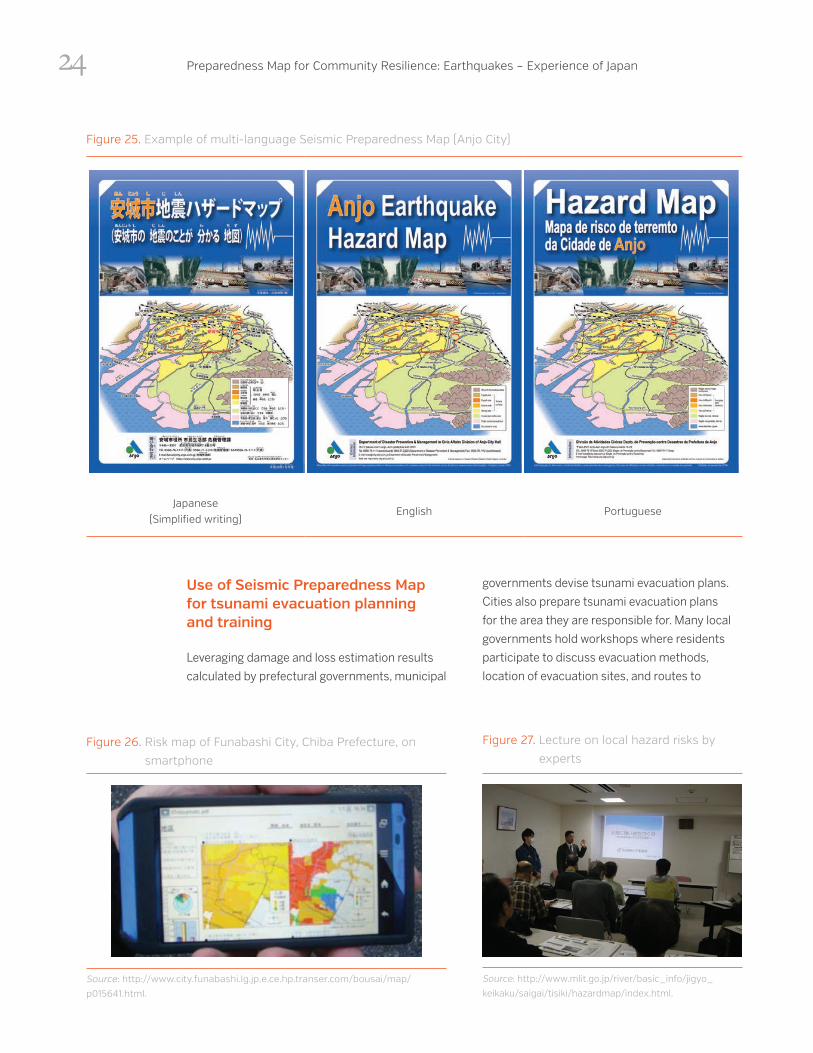
Figure 25. Example of multi-language Seismic Preparedness Map (Anjo City)
Japanese (Simplified writing)
English Portuguese
Use of Seismic Preparedness Map for tsunami evacuation planning and training
Leveraging damage and loss estimation results
calculated by prefectural governments, municipal
governments devise tsunami evacuation plans.
Cities also prepare tsunami evacuation plans
for the area they are responsible for. Many local
governments hold workshops where residents
participate to discuss evacuation methods,
location of evacuation sites, and routes to
Figure 26. Risk map of Funabashi City, Chiba Prefecture, on
smartphone
Source: http://www.city.funabashi.lg.jp.e.ce.hp.transer.com/bousai/map/
p015641.html.
Figure 27. Lecture on local hazard risks by
experts
Source: http://www.mlit.go.jp/river/basic_info/jigyo_
keikaku/saigai/tisiki/hazardmap/index.html.
24
Standard Process for Creating a Seismic Preparedness Map
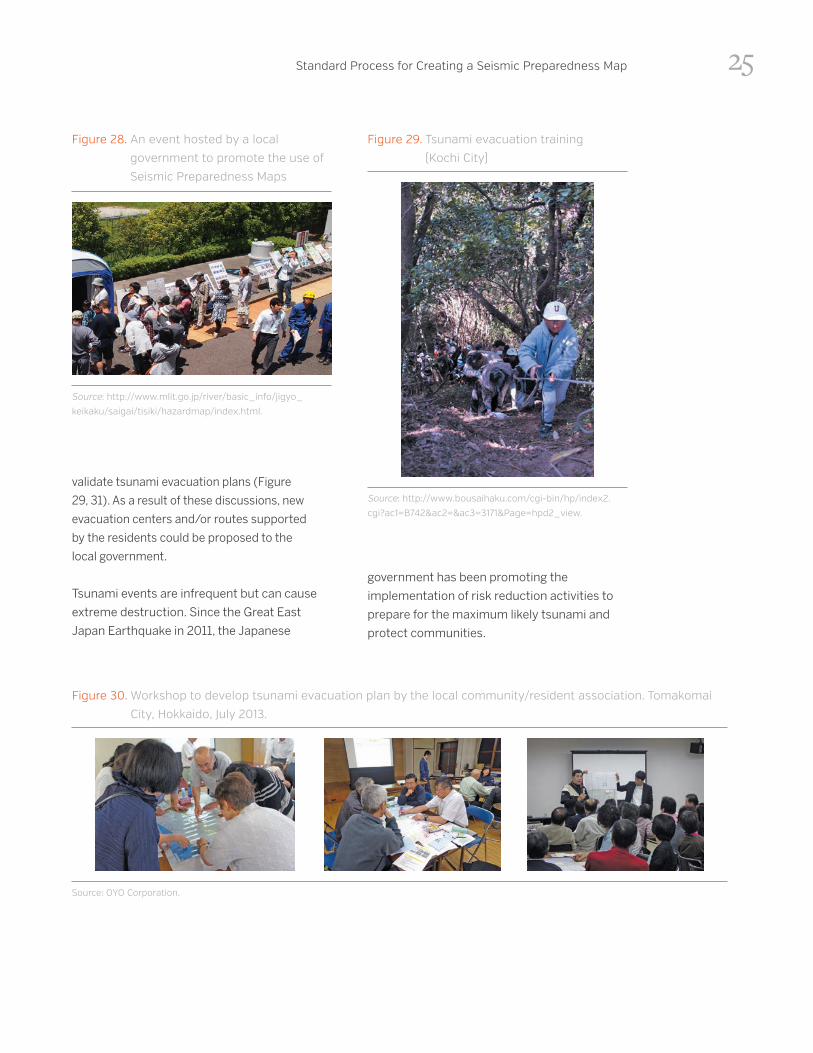
government has been promoting the
implementation of risk reduction activities to
prepare for the maximum likely tsunami and
protect communities.
validate tsunami evacuation plans (Figure
29, 31). As a result of these discussions, new
evacuation centers and/or routes supported
by the residents could be proposed to the
local government.
Tsunami events are infrequent but can cause
extreme destruction. Since the Great East
Japan Earthquake in 2011, the Japanese
Figure 28. An event hosted by a local
government to promote the use of
Seismic Preparedness Maps
Source: http://www.mlit.go.jp/river/basic_info/jigyo_
keikaku/saigai/tisiki/hazardmap/index.html.
Figure 29. Tsunami evacuation training
(Kochi City)
Source: http://www.bousaihaku.com/cgi-bin/hp/index2.
cgi?ac1=B742&ac2=&ac3=3171&Page=hpd2_view.
Figure 30. Workshop to develop tsunami evacuation plan by the local community/resident association. Tomakomai
City, Hokkaido, July 2013.
Source: OYO Corporation.
25
Preparedness Map for Community Resilience: Earthquakes – Experience of Japan
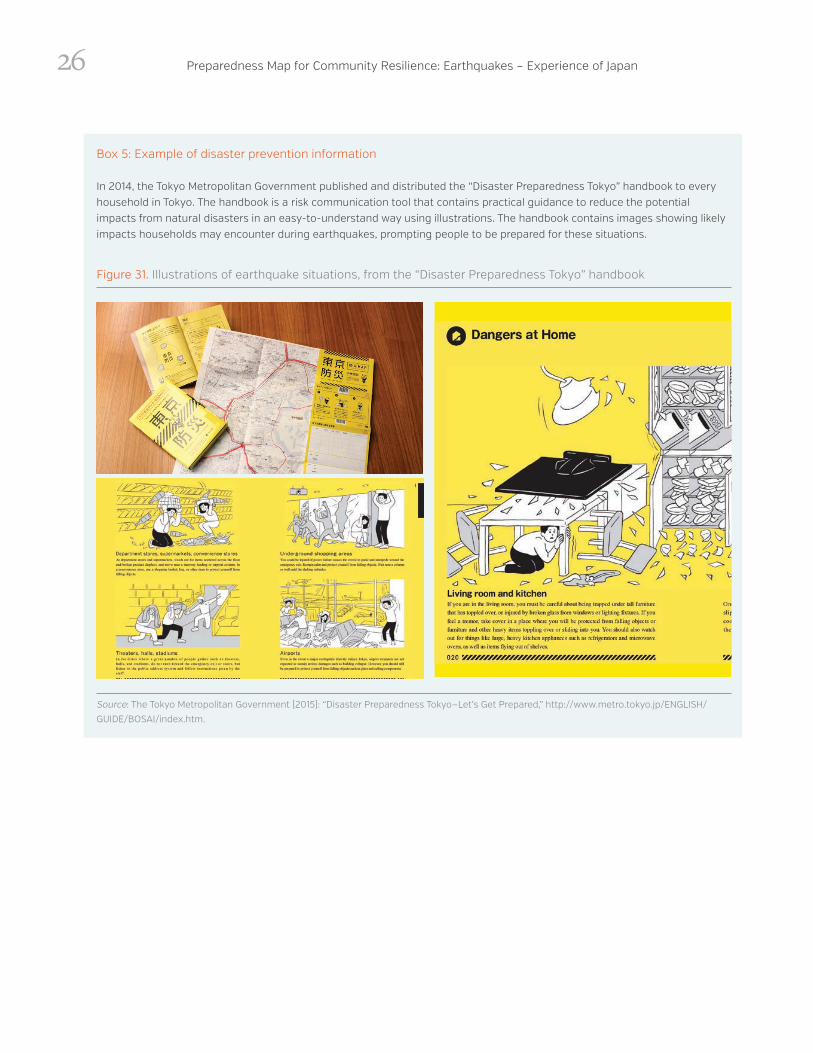
Box 5: Example of disaster prevention information
In 2014, the Tokyo Metropolitan Government published and distributed the “Disaster Preparedness Tokyo” handbook to every household in Tokyo. The handbook is a risk communication tool that contains practical guidance to reduce the potential impacts from natural disasters in an easy-to-understand way using illustrations. The handbook contains images showing likely impacts households may encounter during earthquakes, prompting people to be prepared for these situations.
26
Figure 31. Illustrations of earthquake situations, from the “Disaster Preparedness Tokyo” handbook
Source: The Tokyo Metropolitan Government (2015): “Disaster Preparedness Tokyo—Let’s Get Prepared,” http://www.metro.tokyo.jp/ENGLISH/
GUIDE/BOSAI/index.htm.
27
ANNEX 1DEFINITION OF THE JMA SEISMIC INTENSITY SCALE
Preparedness Map for Community Resilience: Earthquakes – Experience of Japan28
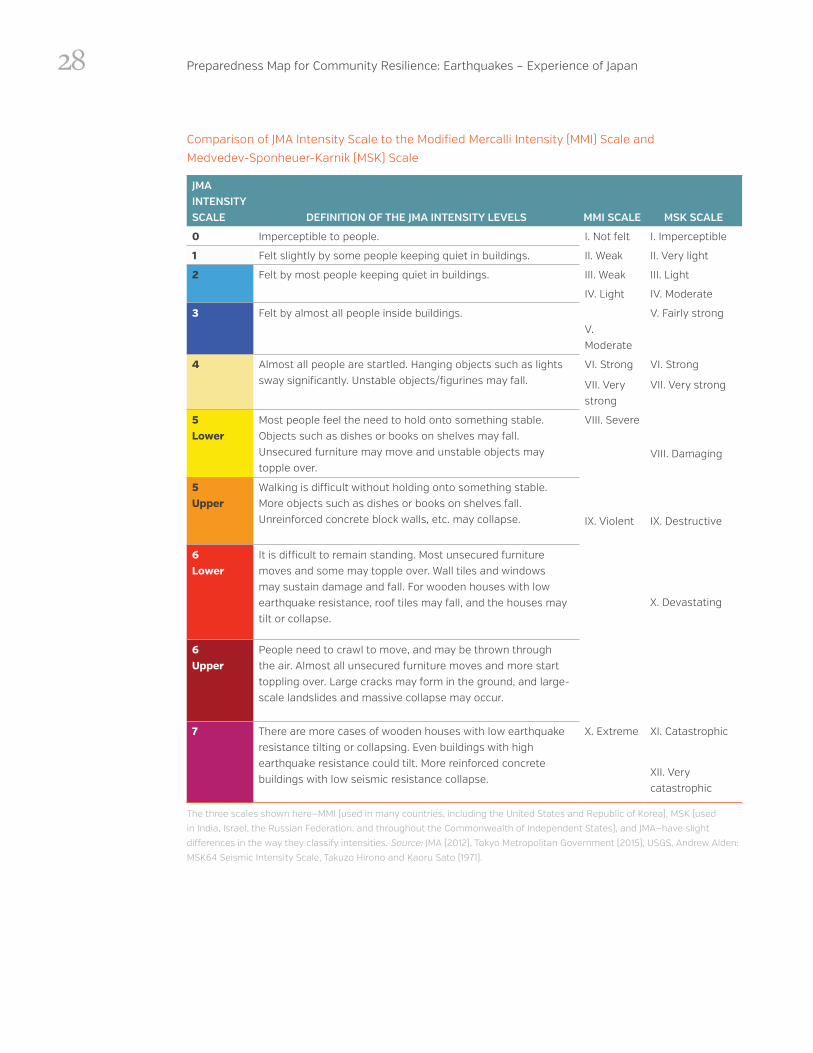
Comparison of JMA Intensity Scale to the Modified Mercalli Intensity (MMI) Scale and
Medvedev-Sponheuer-Karnik (MSK) Scale
JMA INTENSITYSCALE DEFINITION OF THE JMA INTENSITY LEVELS MMI SCALE MSK SCALE
0 Imperceptible to people. I. Not felt I. Imperceptible
1 Felt slightly by some people keeping quiet in buildings. II. Weak II. Very light
2 Felt by most people keeping quiet in buildings. III. Weak III. Light
IV. Light IV. Moderate
3 Felt by almost all people inside buildings. V. Fairly strongV. Moderate
4 Almost all people are startled. Hanging objects such as lights sway significantly. Unstable objects/figurines may fall.
VI. Strong VI. Strong
VII. Very strong
VII. Very strong
5Lower
Most people feel the need to hold onto something stable. Objects such as dishes or books on shelves may fall. Unsecured furniture may move and unstable objects may topple over.
VIII. Severe
VIII. Damaging
5Upper
Walking is difficult without holding onto something stable. More objects such as dishes or books on shelves fall. Unreinforced concrete block walls, etc. may collapse. IX. Violent IX. Destructive
6Lower
It is difficult to remain standing. Most unsecured furniture moves and some may topple over. Wall tiles and windows may sustain damage and fall. For wooden houses with low earthquake resistance, roof tiles may fall, and the houses may tilt or collapse.
X. Devastating
6Upper
People need to crawl to move, and may be thrown through the air. Almost all unsecured furniture moves and more start toppling over. Large cracks may form in the ground, and large-scale landslides and massive collapse may occur.
7 There are more cases of wooden houses with low earthquake resistance tilting or collapsing. Even buildings with high earthquake resistance could tilt. More reinforced concrete buildings with low seismic resistance collapse.
X. Extreme XI. Catastrophic
XII. Very catastrophic
The three scales shown here—MMI (used in many countries, including the United States and Republic of Korea), MSK (used
in India, Israel, the Russian Federation, and throughout the Commonwealth of Independent States), and JMA—have slight
differences in the way they classify intensities. Source: JMA (2012), Tokyo Metropolitan Government (2015), USGS, Andrew Alden:
MSK64 Seismic Intensity Scale, Takuzo Hirono and Kaoru Sato (1971).
29
ANNEX 2LIST OF HAZARD AND RISK MODELING REFERENCESInternational Institute of Seismology and
Earthquake Engineering (IISEE): Methodology of
Microzoning (examples in Japan)
http://iisee.kenken.go.jp/net/yokoi/
methodology/.
Cabinet Office (Disaster Management) et al.
(2004): Tsunami and Storm Surge Hazard Map
Manual
https://www.pwri.go.jp/icharm/publication/
pdf/2004/tsunami_and_storm_surge_hazard_
map_manual.pdf.
Flood Control Division, River Bureau, Ministry
of Land, Infrastructure and Transport (MLIT)
(2005): Flood Hazard Mapping Manual in Japan
https://www.pwri.go.jp/icharm/publication/
pdf/2005/flood_hazard_mapping_manual.pdf.
Cabinet Office (2005): Earthquake Hazard Map
Technical Manual (in Japanese)
http://www.bousai.go.jp/kohou/oshirase/h17/
pdf/050513siryou.pdf.
Catalog of Damaging Earthquakes in the World
(through 2012)
http://iisee.kenken.go.jp/utsu/index_eng.html.
Ministry of Land, Infrastructure, Transport
and Tourism of Japan: Hazard Map Portal Site
(in Japanese)
http://disaportal.gsi.go.jp/index.html.
Disaster Management, Cabinet Office of Japan
http://www.cao.go.jp/en/disaster.html.
Japan Seismic Hazard Information Station
(J-SHIS), NIED
http://www.j-shis.bosai.go.jp/en/.
Japan Meteorological Agency
http://www.jma.go.jp/jma/indexe.html.
Evacuation center selection guidelines being
used in Japan (Iin Japanese)
http://www.mext.go.jp/b_menu/shingi/
chousa/shisetu/013/007/shiryo/icsFiles/
afieldfile/2013/12/26/1342793_1.pdf.
Welfare evacuation center guidelines being used
in Japan (In Japanese)
http://www.bousai.go.jp/taisaku/hinanjo/
pdf/1604hinanjo_hukushi_guideline.pdf.
JMA Guideline for Color schemes to use for
weather related information (2012)
http://www.jma.go.jp/jma/kishou/info/
colorguide/120524_hpcolorguide.pdf

1818 H Street, NW
Washington, DC 20433