Embed Size (px)
Citation preview
Coordinador Científico: Dr. Fernando Rivera Hospital Universitario Marqués de Valdecilla, Santander
Organizado por: Fundación para el progreso de la oncología en Cantabria, FUPOCAN
Eva Muñoz Couselo, MD, PhD
Oncología médica
Hospital Vall d’Hebrón, Barcelona
Anti-CTLA4 más anti-PD1 en melanoma avanzado,
¿un nuevo estándar?
2y
(59%)9
Long-term survival
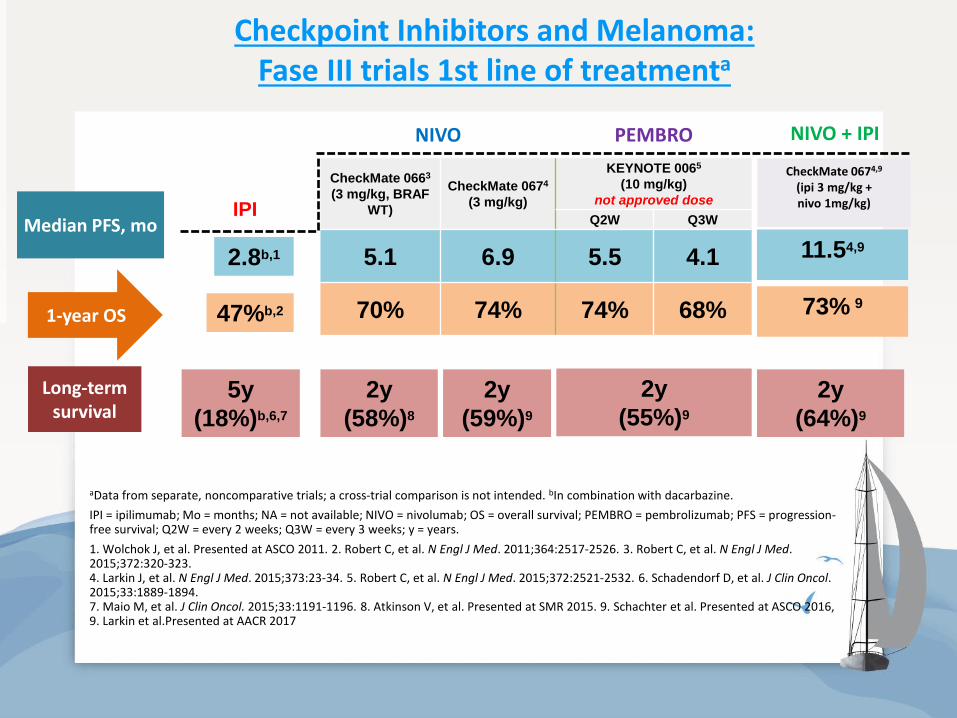
Checkpoint Inhibitors and Melanoma: Fase III trials 1st line of treatmenta
Median PFS, mo
2.8b,1
IPI
11.54,9
NIVO + IPI
1-year OS 47%b,2 73% 9
5y
(18%)b,6,7
2y
(55%)9
2y
(64%)9
NIVO PEMBRO
CheckMate 0663
(3 mg/kg, BRAF
WT)
CheckMate 0674
(3 mg/kg)
KEYNOTE 0065
(10 mg/kg)
not approved dose
Q2W Q3W
5.1 6.9 5.5 4.1
70% 74% 74% 68%
aData from separate, noncomparative trials; a cross-trial comparison is not intended. bIn combination with dacarbazine.
IPI = ipilimumab; Mo = months; NA = not available; NIVO = nivolumab; OS = overall survival; PEMBRO = pembrolizumab; PFS = progression-free survival; Q2W = every 2 weeks; Q3W = every 3 weeks; y = years.
1. Wolchok J, et al. Presented at ASCO 2011. 2. Robert C, et al. N Engl J Med. 2011;364:2517-2526. 3. Robert C, et al. N Engl J Med. 2015;372:320-323. 4. Larkin J, et al. N Engl J Med. 2015;373:23-34. 5. Robert C, et al. N Engl J Med. 2015;372:2521-2532. 6. Schadendorf D, et al. J Clin Oncol. 2015;33:1889-1894. 7. Maio M, et al. J Clin Oncol. 2015;33:1191-1196. 8. Atkinson V, et al. Presented at SMR 2015. 9. Schachter et al. Presented at ASCO 2016, 9. Larkin et al.Presented at AACR 2017
2y
(58%)8
CheckMate 0674,9 (ipi 3 mg/kg + nivo 1mg/kg)
0 1 2 3 4 5 6 7 8 9 10
100
90
80
70
60
0
50
40
30
20
10
Overa
ll S
urv
ival (%
)
Years
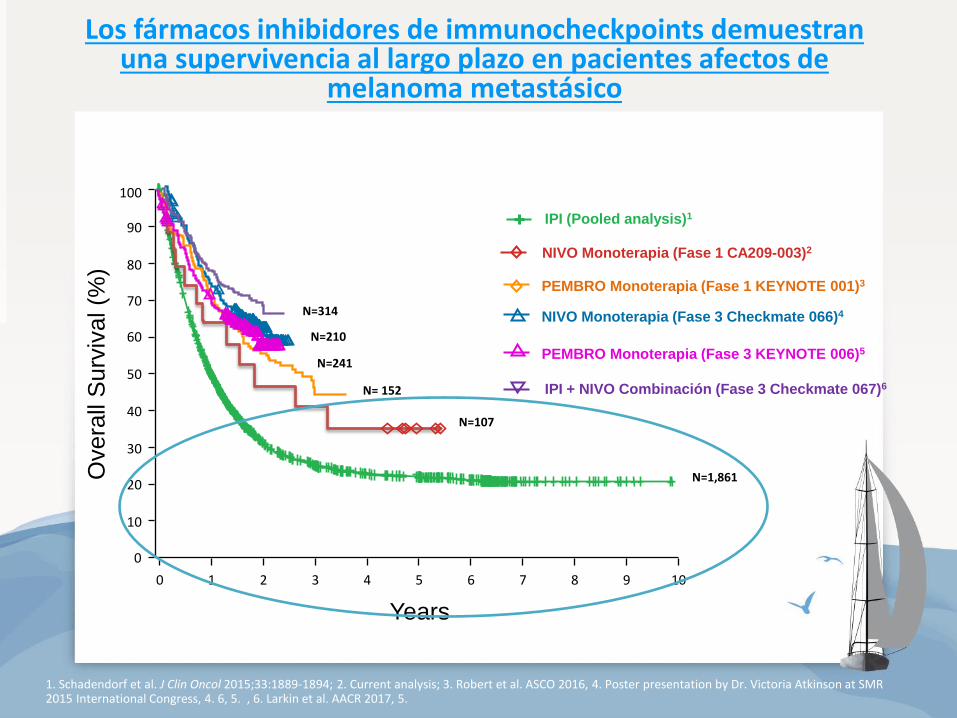
IPI (Pooled analysis)1
NIVO Monoterapia (Fase 3 Checkmate 066)4
N=210
NIVO Monoterapia (Fase 1 CA209-003)2
N=107
N=1,861
Los fármacos inhibidores de immunocheckpoints demuestran una supervivencia al largo plazo en pacientes afectos de
melanoma metastásico
1. Schadendorf et al. J Clin Oncol 2015;33:1889-1894; 2. Current analysis; 3. Robert et al. ASCO 2016, 4. Poster presentation by Dr. Victoria Atkinson at SMR 2015 International Congress, 4. 6, 5. , 6. Larkin et al. AACR 2017, 5.
N=314
IPI + NIVO Combinación (Fase 3 Checkmate 067)6 N= 152
PEMBRO Monoterapia (Fase 1 KEYNOTE 001)3
PEMBRO Monoterapia (Fase 3 KEYNOTE 006)5
N=241
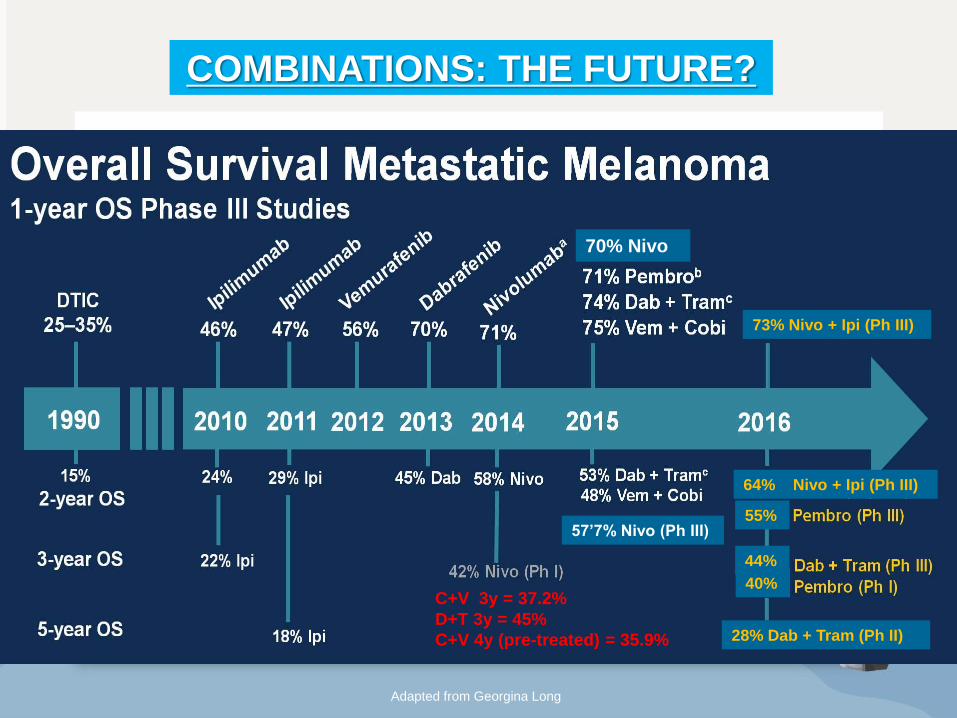
Overall Survival Metastatic Melanoma<br />1-year OS Phase III Studies
Adapted from Georgina Long
40%
55%
44%
70% Nivo
57’7% Nivo (Ph III)
C+V 3y = 37.2%
D+T 3y = 45%
C+V 4y (pre-treated) = 35.9%
COMBINATIONS: THE FUTURE?
64% Nivo + Ipi (Ph III)
73% Nivo + Ipi (Ph III)
28% Dab + Tram (Ph II)
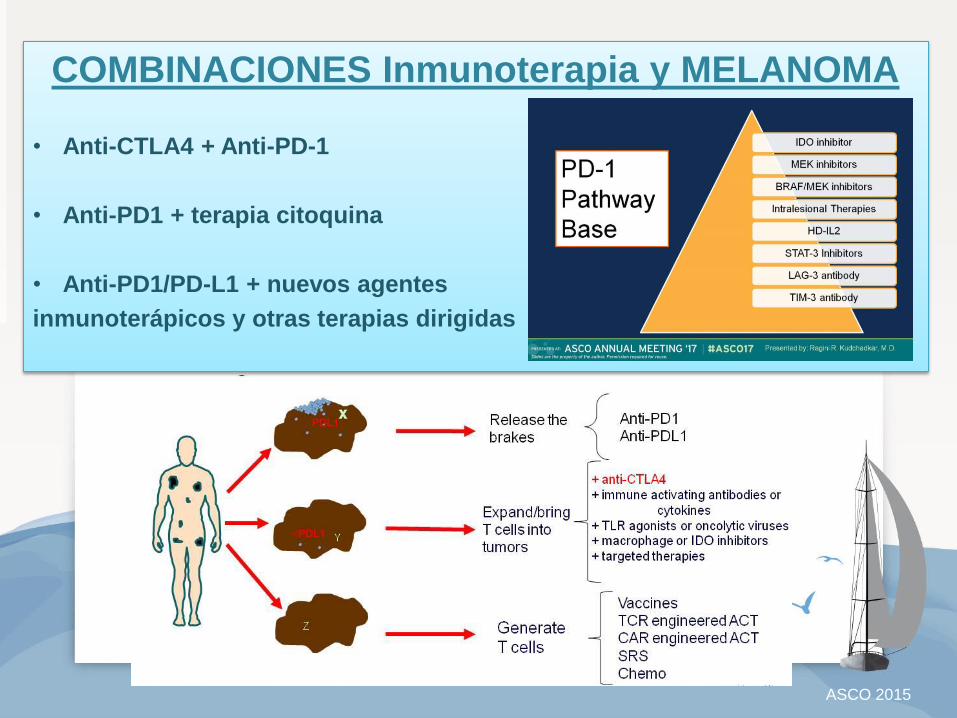
ASCO 2015
COMBINACIONES Inmunoterapia y MELANOMA
• Anti-CTLA4 + Anti-PD-1
• Anti-PD1 + terapia citoquina
• Anti-PD1/PD-L1 + nuevos agentes
inmunoterápicos y otras terapias dirigidas
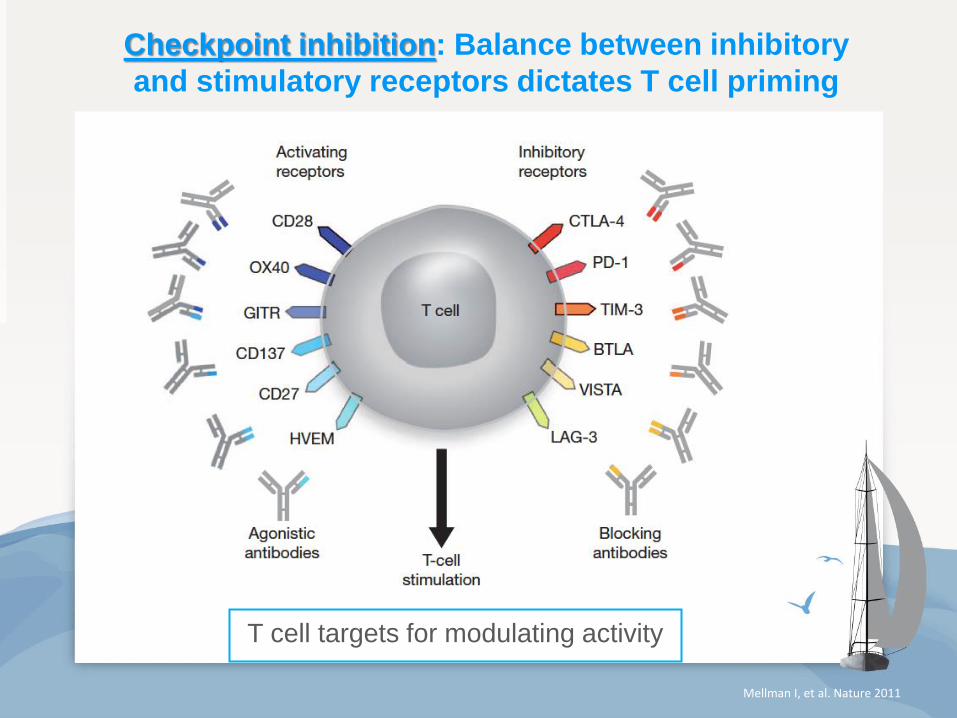
Checkpoint inhibition: Balance between inhibitory
and stimulatory receptors dictates T cell priming
T cell targets for modulating activity
Mellman I, et al. Nature 2011
INMUNOTERAPIA
1. Wolchok JD, et al. Presented at ASCO 2013; abstract 9012. 2. Sharma P, et al. Science. 2015;348:56-61, 3. Postow et al. N Engl. J Med 2015, 4. Larkin et al. AACR 2017
Unresectable or
Metatastic Melanoma
• Previously untreated
• 945 patients
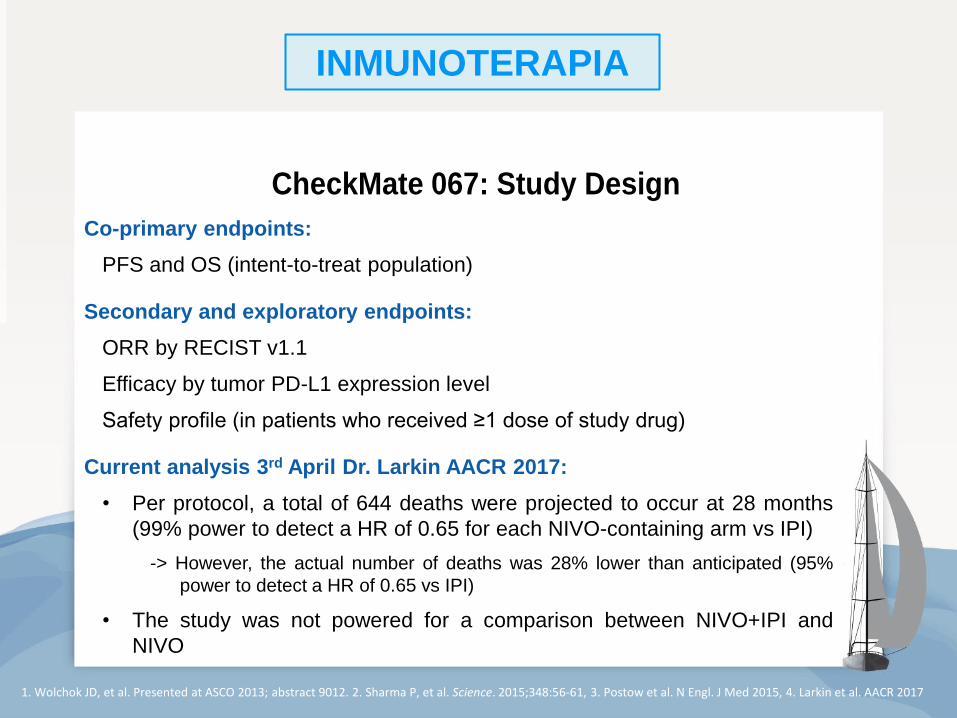
CA209-067: Study Design CheckMate 067: Study Design
Treat until
progression or
unacceptable
toxicity
NIVO 3 mg/kg Q2W +IPI-matched placebo
NIVO 1 mg/kg + IPI 3 mg/kg Q3W for 4 doses then NIVO
3 mg/kg Q2W
IPI 3 mg/kg Q3W for 4 doses +
NIVO-matched placebo
Randomize
1:1:1
Stratify by:
• BRAF status
• AJCC M stage
• Tumor PD-L1 expression <5% vs ≥5%*
N=314
N=316
N=315
Randomized, double-blind,
phase III study to compare NIVO+IPI
or NIVO alone to IPI alone*
*The study was not powered for a comparison between NIVO and NIVO+IPI
Database lock: Sept 13, 2016 (median follow-up ~30 months in both NIVO-containing arms)
3
31’5% BRAF mutados
(1ª línea pura)
36’1% LDH elevada
23’6% PD-L1 alto expresor
Co-primary endpoints:
PFS and OS (intent-to-treat population)
Secondary and exploratory endpoints:
ORR by RECIST v1.1
Efficacy by tumor PD-L1 expression level
Safety profile (in patients who received ≥1 dose of study drug)
Current analysis 3rd April Dr. Larkin AACR 2017:
• Per protocol, a total of 644 deaths were projected to occur at 28 months
(99% power to detect a HR of 0.65 for each NIVO-containing arm vs IPI)
-> However, the actual number of deaths was 28% lower than anticipated (95%
power to detect a HR of 0.65 vs IPI)
• The study was not powered for a comparison between NIVO+IPI and
NIVO
¿Cuáles son los mayores beneficios del COMBO Ipilimumab + Nivolumab
en melanoma metastásico?
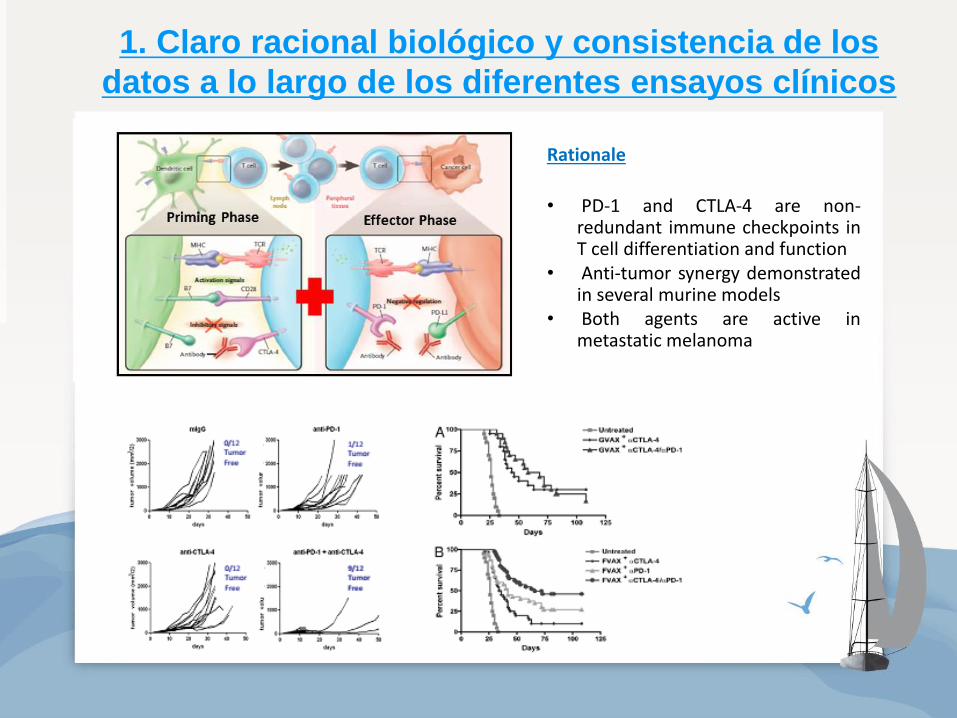
1. Claro racional biológico y consistencia de los
datos a lo largo de los diferentes ensayos clínicos
Rationale
• PD-1 and CTLA-4 are non-redundant immune checkpoints in T cell differentiation and function
• Anti-tumor synergy demonstrated in several murine models
• Both agents are active in metastatic melanoma
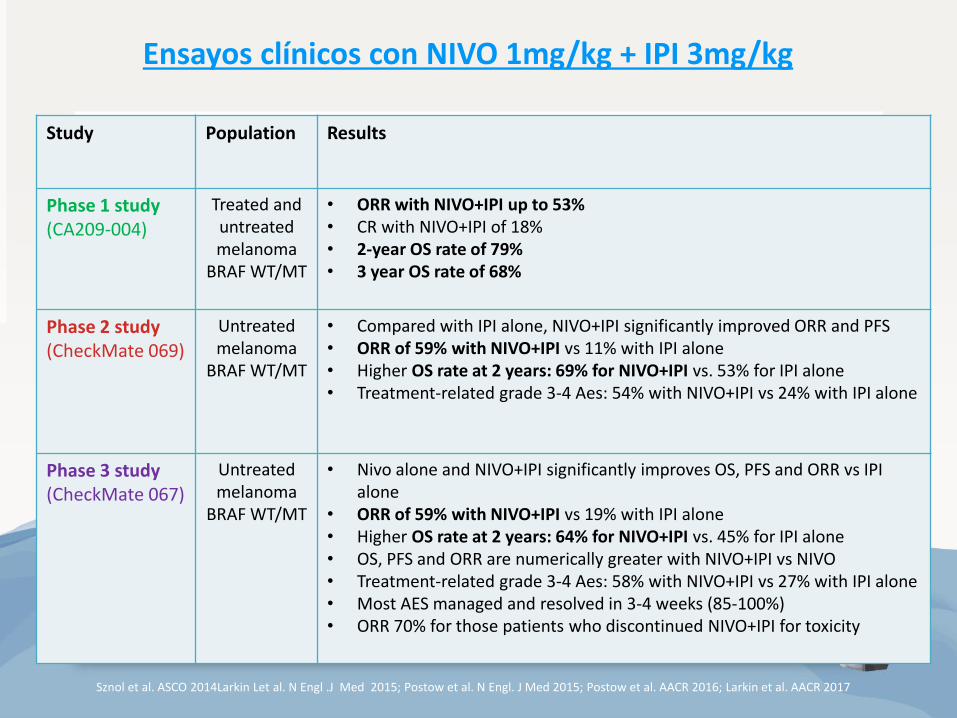
Study Population Results
Phase 1 study (CA209-004)
Treated and untreated melanoma
BRAF WT/MT
• ORR with NIVO+IPI up to 53% • CR with NIVO+IPI of 18% • 2-year OS rate of 79% • 3 year OS rate of 68%
Phase 2 study (CheckMate 069)
Untreated melanoma
BRAF WT/MT
• Compared with IPI alone, NIVO+IPI significantly improved ORR and PFS • ORR of 59% with NIVO+IPI vs 11% with IPI alone • Higher OS rate at 2 years: 69% for NIVO+IPI vs. 53% for IPI alone • Treatment-related grade 3-4 Aes: 54% with NIVO+IPI vs 24% with IPI alone
Phase 3 study (CheckMate 067)
Untreated melanoma
BRAF WT/MT
• Nivo alone and NIVO+IPI significantly improves OS, PFS and ORR vs IPI alone
• ORR of 59% with NIVO+IPI vs 19% with IPI alone • Higher OS rate at 2 years: 64% for NIVO+IPI vs. 45% for IPI alone • OS, PFS and ORR are numerically greater with NIVO+IPI vs NIVO • Treatment-related grade 3-4 Aes: 58% with NIVO+IPI vs 27% with IPI alone • Most AES managed and resolved in 3-4 weeks (85-100%) • ORR 70% for those patients who discontinued NIVO+IPI for toxicity
Sznol et al. ASCO 2014Larkin Let al. N Engl .J Med 2015; Postow et al. N Engl. J Med 2015; Postow et al. AACR 2016; Larkin et al. AACR 2017
Ensayos clínicos con NIVO 1mg/kg + IPI 3mg/kg
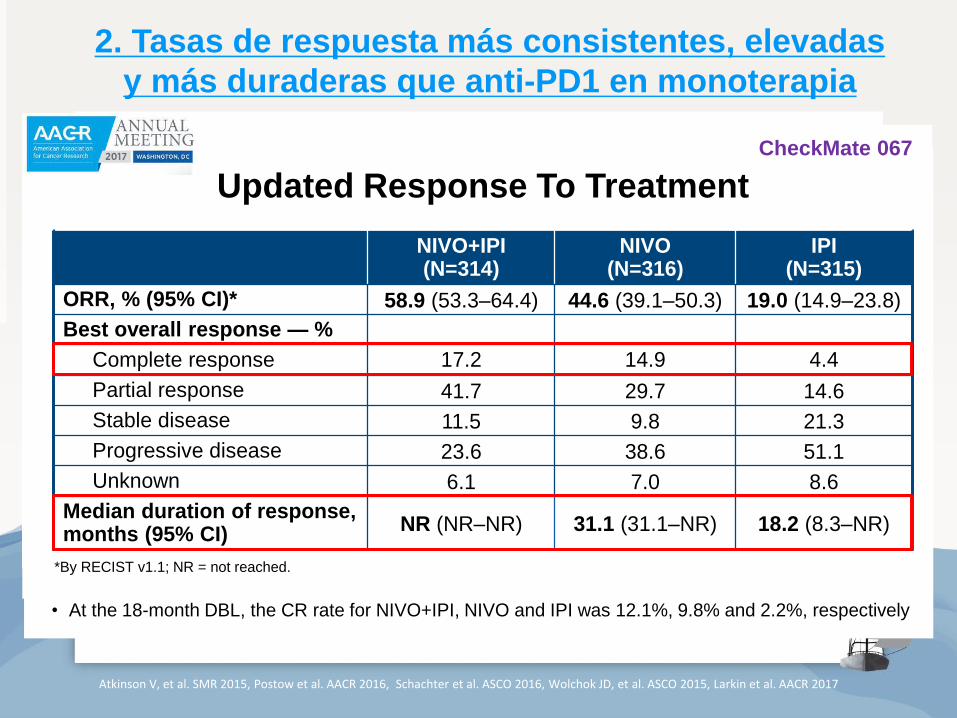
2. Tasas de respuesta más consistentes, elevadas
y más duraderas que anti-PD1 en monoterapia
Nivolumab ORR 40%
Atkinson V, et al. SMR 2015, Postow et al. AACR 2016, Schachter et al. ASCO 2016, Wolchok JD, et al. ASCO 2015, Larkin et al. AACR 2017
NIVO + IPI
Median change: -70%
(ORR 59%)
IPI
Median change: +5%
(ORR 11%)
Patients
100
75
50
25
0
-25
-50
-75
-100 Be
st
Re
du
cti
on
Fro
m B
ase
lin
e in
Ta
rget
Les
ion
(%
)
* = confirmed responder
Response To Treatment
Anti-PD1: tiempo medio de respuesta 2’8 meses
NIVO+IPI(N=314)
NIVO(N=316)
IPI(N=315)
ORR, % (95% CI)* 58.9 (53.3–64.4) 44.6 (39.1–50.3) 19.0 (14.9–23.8)
Best overall response — %
Complete response 17.2 14.9 4.4
Partial response 41.7 29.7 14.6
Stable disease 11.5 9.8 21.3
Progressive disease 23.6 38.6 51.1
Unknown 6.1 7.0 8.6
Median duration of response, months (95% CI)
NR (NR–NR) 31.1 (31.1–NR) 18.2 (8.3–NR)
Updated Response To Treatment
*By RECIST v1.1; NR = not reached.
• At the 18-month DBL, the CR rate for NIVO+IPI, NIVO and IPI was 12.1%, 9.8% and 2.2%, respectively
Database lock: Sept 13, 2016, minimum f/u of 28 months 5
CheckMate 067
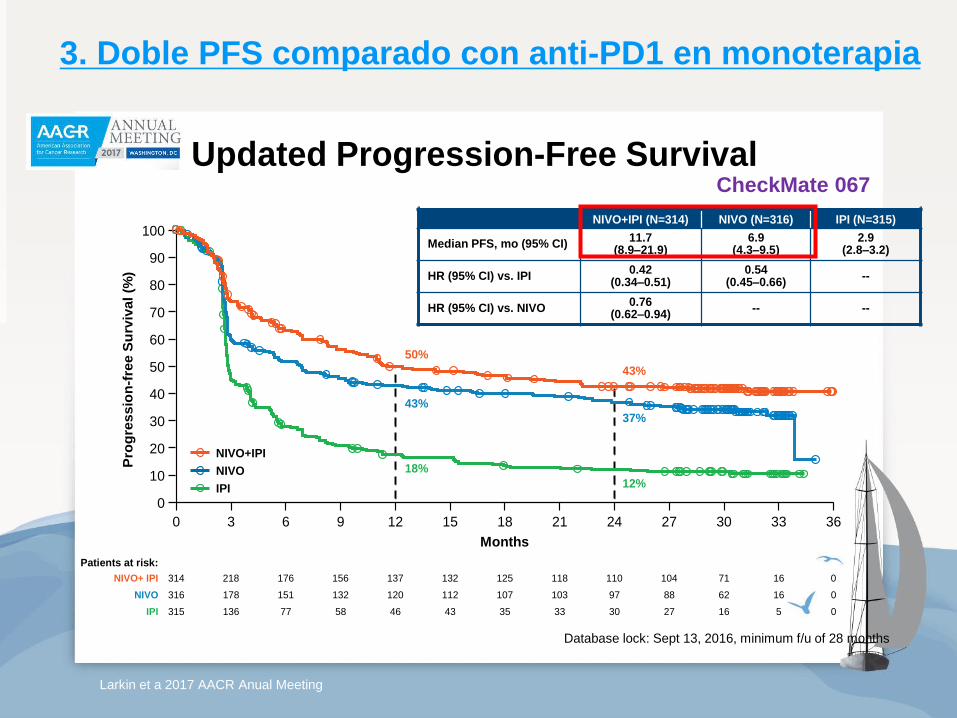
3. Doble PFS comparado con anti-PD1 en monoterapia
Updated Progression-Free Survival
50%
43%
18%
43%
37%
12%
Pe
rcen
tag
e o
f P
FS
Months
0
10
20
30
40
50
60
70
80
90
100
0 3 6 9 12 15 18 363024 332721
0IPI
NIVO+IPI (N=314) NIVO (N=316) IPI (N=315)
Median PFS, mo (95% CI)11.7
(8.9–21.9)6.9
(4.3–9.5)2.9
(2.8–3.2)
HR (95% CI) vs. IPI0.42
(0.34–0.51)0.54
(0.45–0.66)--
HR (95% CI) vs. NIVO0.76
(0.62–0.94)-- --
Pro
gre
ss
ion
-fre
e S
urv
iva
l (%
)
5162730333543465877136315
Patients at risk:
0NIVO 16628897103107112120132151178316
0NIVO+ IPI 1671104110118125132137156176218314
NIVO+IPI
NIVO
IPI
8Database lock: Sept 13, 2016, minimum f/u of 28 months
Larkin et a 2017 AACR Anual Meeting
CheckMate 067
4. OS a 2 y 3 años nunca vistas en melanoma, incluso
en aquellos pacientes que discontinúan por toxicidad
CheckMate 209-004
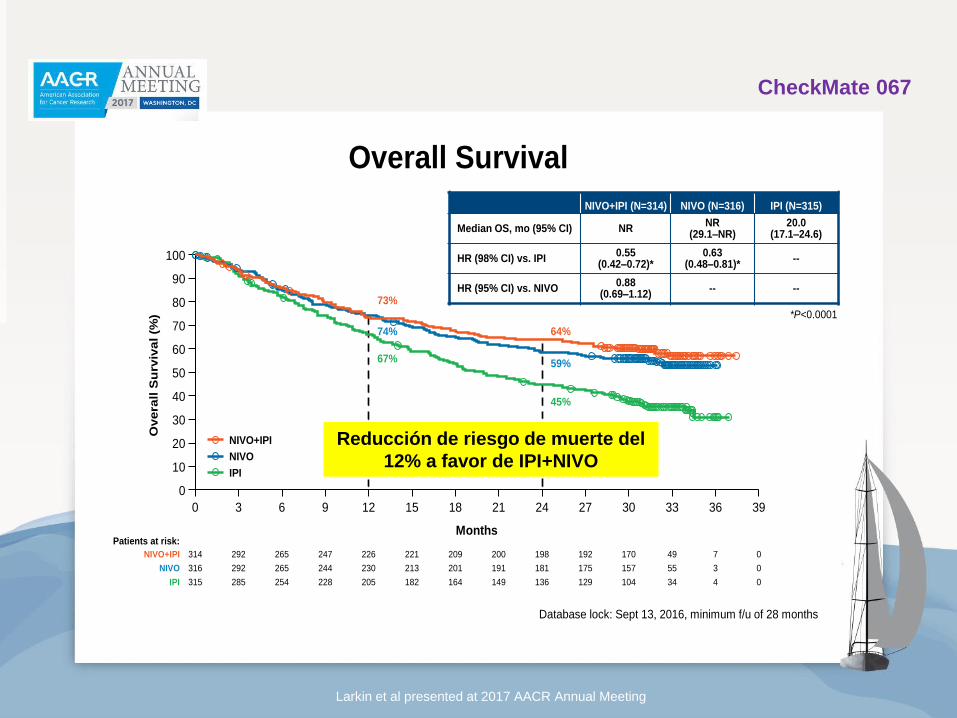
Overall Survival
MonthsPatients at risk:
73%
74%
67%
64%
59%
45%
Pe
rcen
tag
e o
f P
FS
0
10
20
30
40
50
60
70
80
90
100
0 3 6 9 12 15 18 393024 332721
Overa
ll S
urv
iva
l (%
)
36
0IPI 34104129136149164182205228254285315 4
0NIVO 55157175181191201213230244265292316 3
0NIVO+IPI 49170192198200209221226247265292314 7
*P<0.0001
NIVO+IPI (N=314) NIVO (N=316) IPI (N=315)
Median OS, mo (95% CI) NRNR
(29.1–NR)20.0
(17.1–24.6)
HR (98% CI) vs. IPI0.55
(0.42–0.72)*0.63
(0.48–0.81)*--
HR (95% CI) vs. NIVO0.88
(0.69–1.12)-- --
NIVO+IPI
NIVO
IPI
Database lock: Sept 13, 2016, minimum f/u of 28 months 7
Larkin et al presented at 2017 AACR Annual Meeting
Reducción de riesgo de muerte del
12% a favor de IPI+NIVO
CheckMate 067
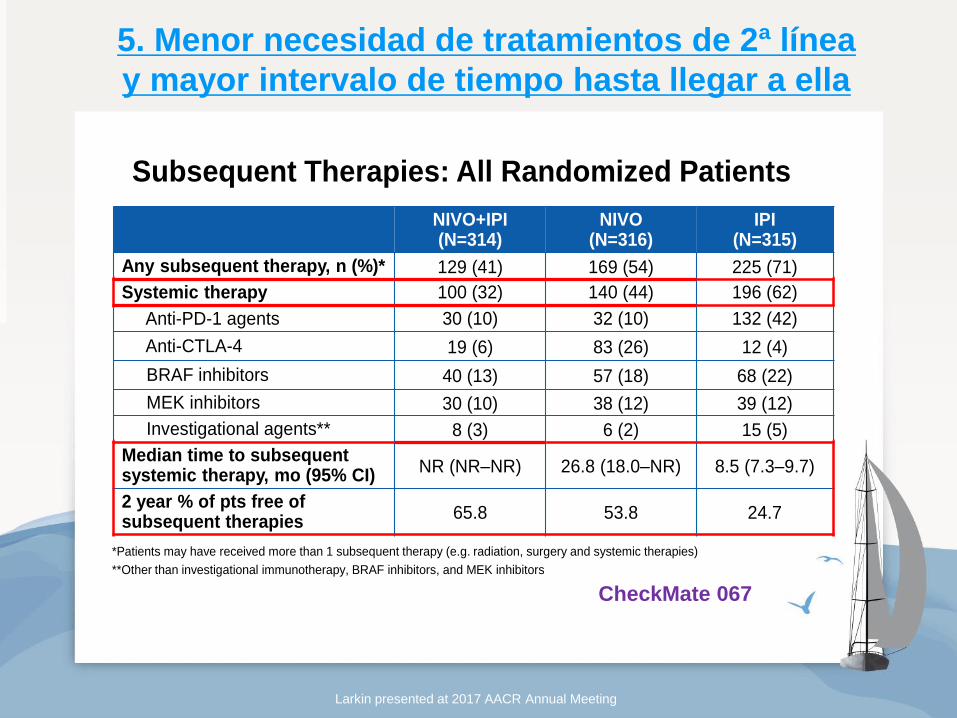
NIVO+IPI(N=314)
NIVO(N=316)
IPI(N=315)
Any subsequent therapy, n (%)* 129 (41) 169 (54) 225 (71)
Systemic therapy 100 (32) 140 (44) 196 (62)
Anti-PD-1 agents 30 (10) 32 (10) 132 (42)
Anti-CTLA-4 19 (6) 83 (26) 12 (4)
BRAF inhibitors 40 (13) 57 (18) 68 (22)
MEK inhibitors 30 (10) 38 (12) 39 (12)
Investigational agents** 8 (3) 6 (2) 15 (5)
Median time to subsequent systemic therapy, mo (95% CI)
NR (NR‒NR) 26.8 (18.0‒NR) 8.5 (7.3‒9.7)
2 year % of pts free of subsequent therapies
65.8 53.8 24.7
Subsequent Therapies: All Randomized Patients
*Patients may have received more than 1 subsequent therapy (e.g. radiation, surgery and systemic therapies)
**Other than investigational immunotherapy, BRAF inhibitors, and MEK inhibitors
8
5. Menor necesidad de tratamientos de 2ª línea
y mayor intervalo de tiempo hasta llegar a ella
Larkin presented at 2017 AACR Annual Meeting
CheckMate 067
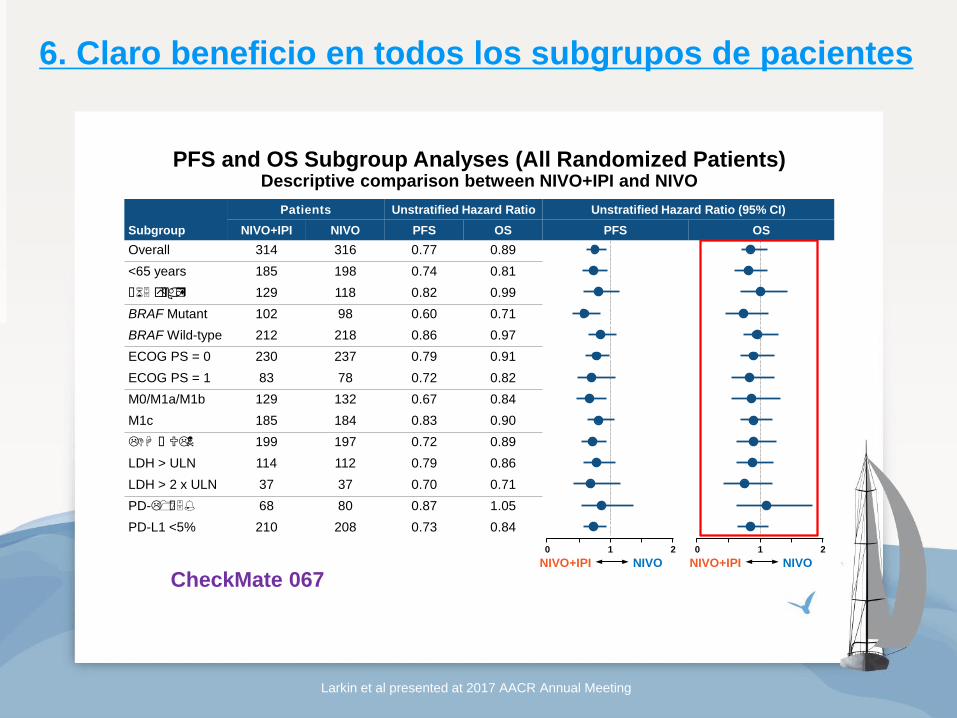
6. Claro beneficio en todos los subgrupos de pacientes
Larkin et al presented at 2017 AACR Annual Meeting
Subgroup
Patients Unstratified Hazard Ratio Unstratified Hazard Ratio (95% CI)
NIVO+IPI NIVO PFS OS PFS OS
Overall 314 316 0.77 0.89
<65 years 185 198 0.74 0.81
≥65 years 129 118 0.82 0.99
BRAF Mutant 102 98 0.60 0.71
BRAF Wild-type 212 218 0.86 0.97
ECOG PS = 0 230 237 0.79 0.91
ECOG PS = 1 83 78 0.72 0.82
M0/M1a/M1b 129 132 0.67 0.84
M1c 185 184 0.83 0.90
LDH ≥ ULN 199 197 0.72 0.89
LDH > ULN 114 112 0.79 0.86
LDH > 2 x ULN 37 37 0.70 0.71
PD-L1 ≥5% 68 80 0.87 1.05
PD-L1 <5% 210 208 0.73 0.84
PFS and OS Subgroup Analyses (All Randomized Patients)Descriptive comparison between NIVO+IPI and NIVO
NIVO+IPI NIVO
20 1
NIVO+IPI NIVO
20 1
9
CheckMate 067
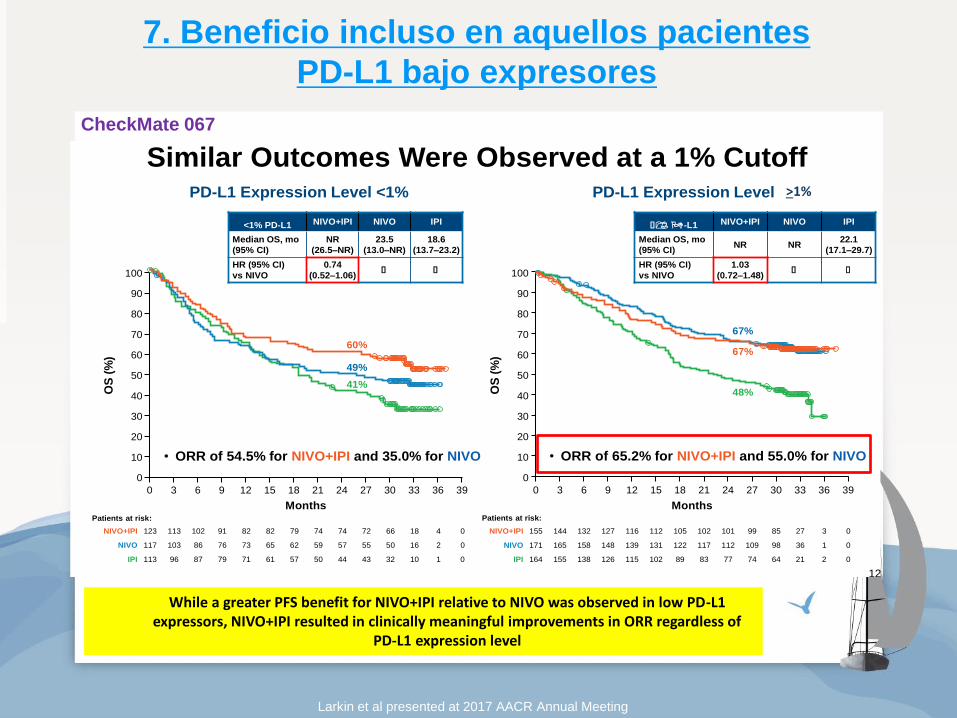
7. Beneficio incluso en aquellos pacientes
PD-L1 bajo expresores
While a greater PFS benefit for NIVO+IPI relative to NIVO was observed in low PD-L1 expressors, NIVO+IPI resulted in clinically meaningful improvements in ORR regardless of
PD-L1 expression level
Larkin et al presented at 2017 AACR Annual Meeting
OS by Tumor PD-L1 Expression, 5% Cutoff
NIVO+IPI NIVO IPI
Median OS, mo
(95% CI)
NR
(31.8–NR)
NR
(23.1–NR)
18.5
(13.7–22.5)
HR (95% CI)
vs NIVO
0.84
(0.63–1.12)≥ ≥
PD-L1 Expression Level <5%
OS
(%
)
Months
0
10
20
30
40
50
60
70
80
90
100
0 39363330272421181512963
Patients at risk:
202 0IPI 21863788190100108125140158179
208 0NIVO 23499110112118123133144151169189
210 0NIVO+IPI 734116127130131139144146163178194
NIVO+IPI NIVO IPI
Median OS, mo
(95% CI)NR NR
28.9
(18.1–NR)
HR (95% CI)
vs NIVO
1.05
(0.61–1.83)≥ ≥
PD-L1 Expression Level ≥5%
OS
(%
)Months
0
10
20
30
40
50
60
70
80
90
100
0 39363330272421181512963
Patients at risk:
75 0IPI 11333394043465561656772
80 0NIVO 11849545758616368737579
68 0NIVO+IPI 01135444545455052555663
55%
63%
41%
72%
68%
54%
• ORR of 73.5% for NIVO+IPI and 58.8% for NIVO • ORR of 56.2% for NIVO+IPI and 42.3% for NIVO
11
Expression Level >5%
<1% PD-L1 NIVO+IPI NIVO IPI
Median OS, mo
(95% CI)
NR
(26.5–NR)
23.5
(13.0–NR)
18.6
(13.7–23.2)
HR (95% CI)
vs NIVO
0.74
(0.52–1.06)≥ ≥
≥1% PD-L1 NIVO+IPI NIVO IPI
Median OS, mo
(95% CI)NR NR
22.1
(17.1–29.7)
HR (95% CI)
vs NIVO
1.03
(0.72–1.48)≥ ≥
OS
(%
)
Months
0
10
20
30
40
50
60
70
80
90
100
0 39363330272421181512963
60%
49%
41%
OS
(%
)Months
0
10
20
30
40
50
60
70
80
90
100
0 39363330272421181512963
113 0IPI 11032434450576171798796
117 0NIVO 216505557596265737686103
123 0NIVO+IPI 4186672747479828291102113
164 0IPI 2216474778389102115126138155
171 0NIVO 13698109112117122131139148158165
155 0NIVO+IPI 3278599101102105112116127132144
67%
67%
48%
Similar Outcomes Were Observed at a 1% CutoffPD-L1 Expression Level <1% PD-L1 Expression Level ≥1%
Patients at risk: Patients at risk:
• ORR of 65.2% for NIVO+IPI and 55.0% for NIVO • ORR of 54.5% for NIVO+IPI and 35.0% for NIVO
12
>1%
CheckMate 067
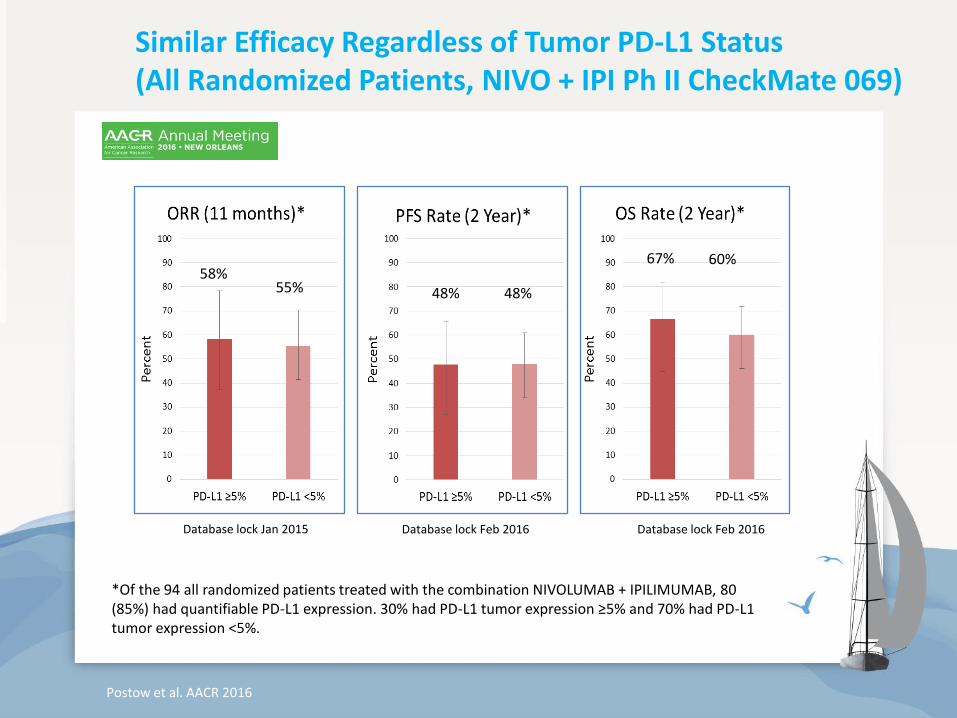
Similar Efficacy Regardless of Tumor PD-L1 Status (All Randomized Patients, NIVO + IPI Ph II CheckMate 069)
Database lock Jan 2015 Database lock Feb 2016 Database lock Feb 2016
58% 55% 48% 48%
67% 60%
*Of the 94 all randomized patients treated with the combination NIVOLUMAB + IPILIMUMAB, 80 (85%) had quantifiable PD-L1 expression. 30% had PD-L1 tumor expression ≥5% and 70% had PD-L1 tumor expression <5%.
Postow et al. AACR 2016
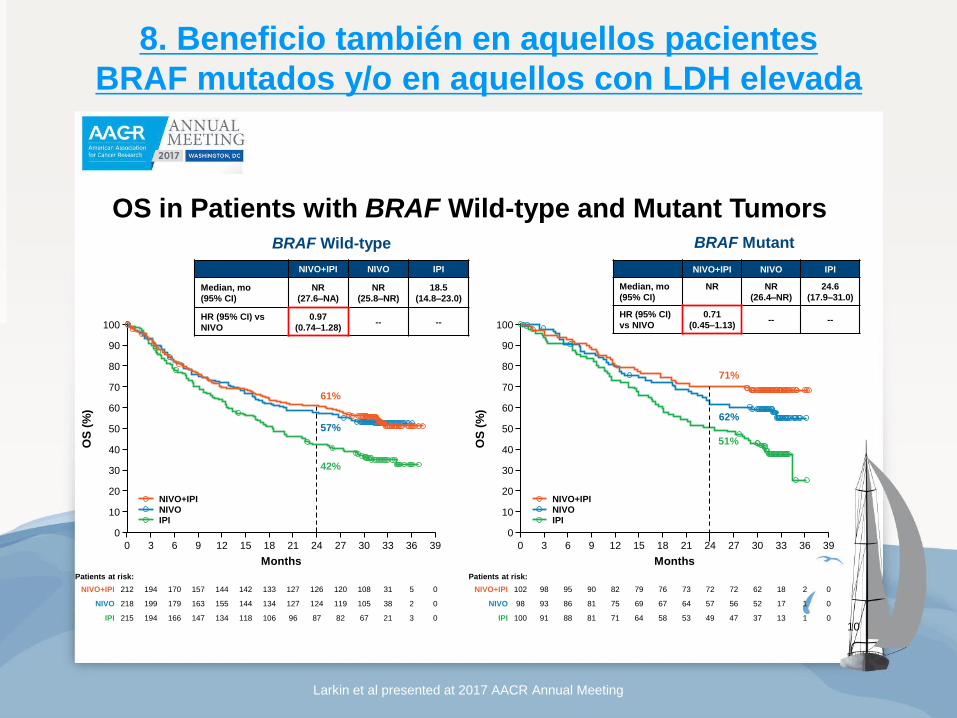
8. Beneficio también en aquellos pacientes
BRAF mutados y/o en aquellos con LDH elevada
Larkin et al presented at 2017 AACR Annual Meeting
OS
(%
)
Months
0
10
20
30
40
50
60
70
80
90
100
0 39363330272421181512963
NIVO+IPI NIVO IPI
0IPI 215 32167828796106118134147166194
0NIVO 218 238105119124127134144155163179199
0NIVO+IPI 212 531108120126127133142144157170194
61%
57%
42%
BRAF Wild-type
OS
(%
)
Months
0
10
20
30
40
50
60
70
80
90
100
0 39363330272421181512963
NIVO+IPI NIVO IPI
0IPI 100 11337474953586471818891
0NIVO 98 11752565764676975818693
0NIVO+IPI 102 21862727273767982909598
71%
62%
OS in Patients with BRAF Wild-type and Mutant Tumors
51%
NIVO+IPI NIVO IPI
Median, mo
(95% CI)
NR NR
(26.4‒NR)
24.6
(17.9‒31.0)
HR (95% CI)
vs NIVO
0.71
(0.45‒1.13)-- --
NIVO+IPI NIVO IPI
Median, mo
(95% CI)
NR
(27.6‒NA)
NR
(25.8‒NR)
18.5
(14.8‒23.0)
HR (95% CI) vs
NIVO
0.97
(0.74‒1.28)-- --
BRAF Mutant
Patients at risk: Patients at risk:
10
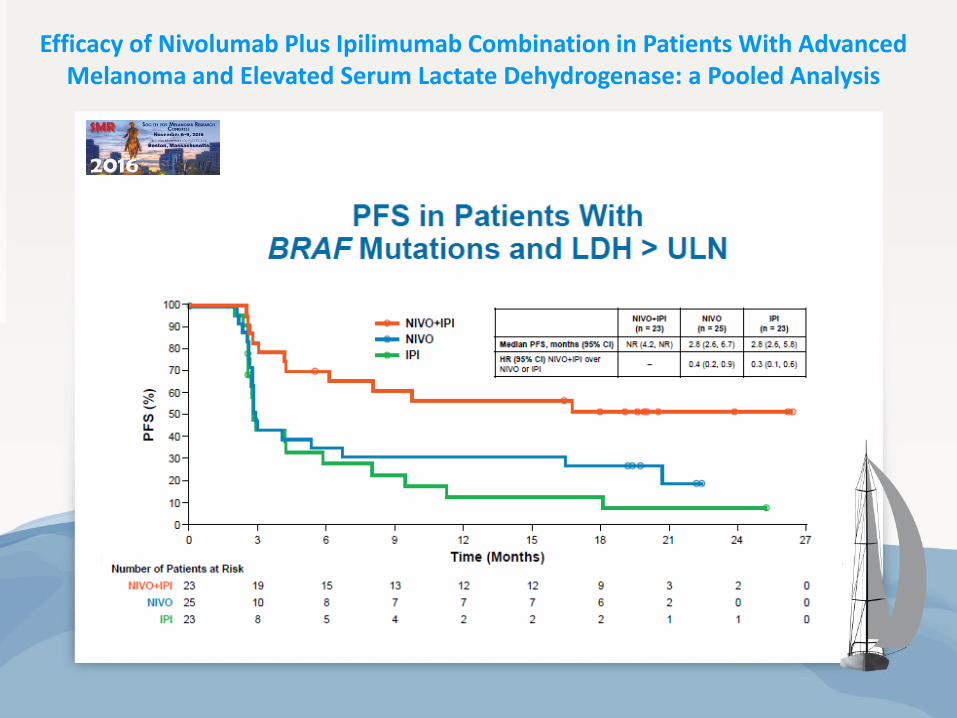
Efficacy of Nivolumab Plus Ipilimumab Combination in Patients With Advanced Melanoma and Elevated Serum Lactate Dehydrogenase: a Pooled Analysis
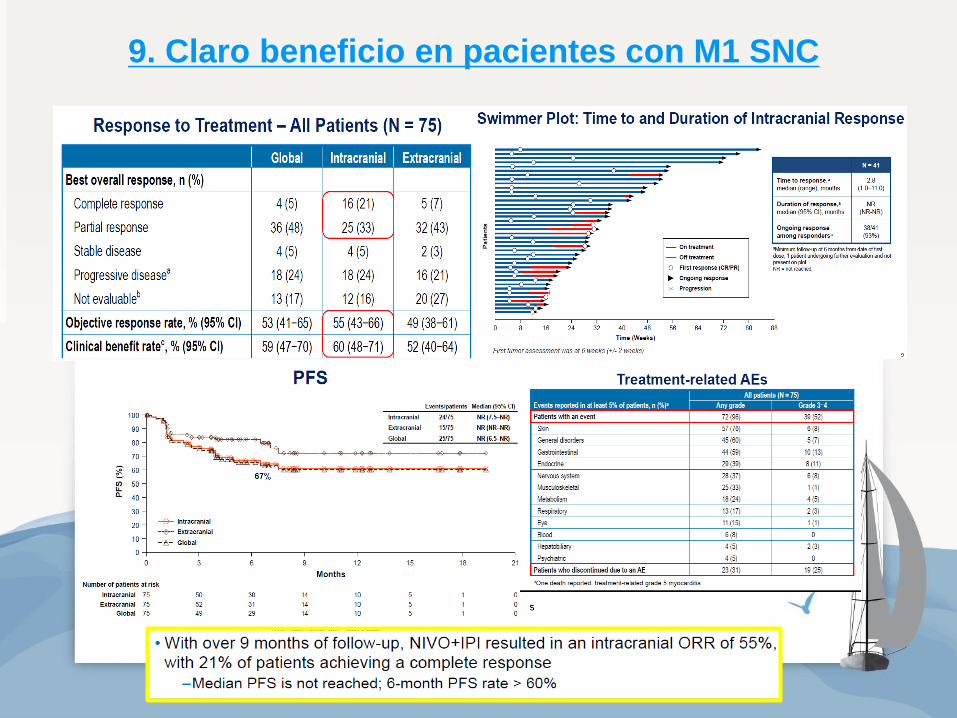
9. Claro beneficio en pacientes con M1 SNC
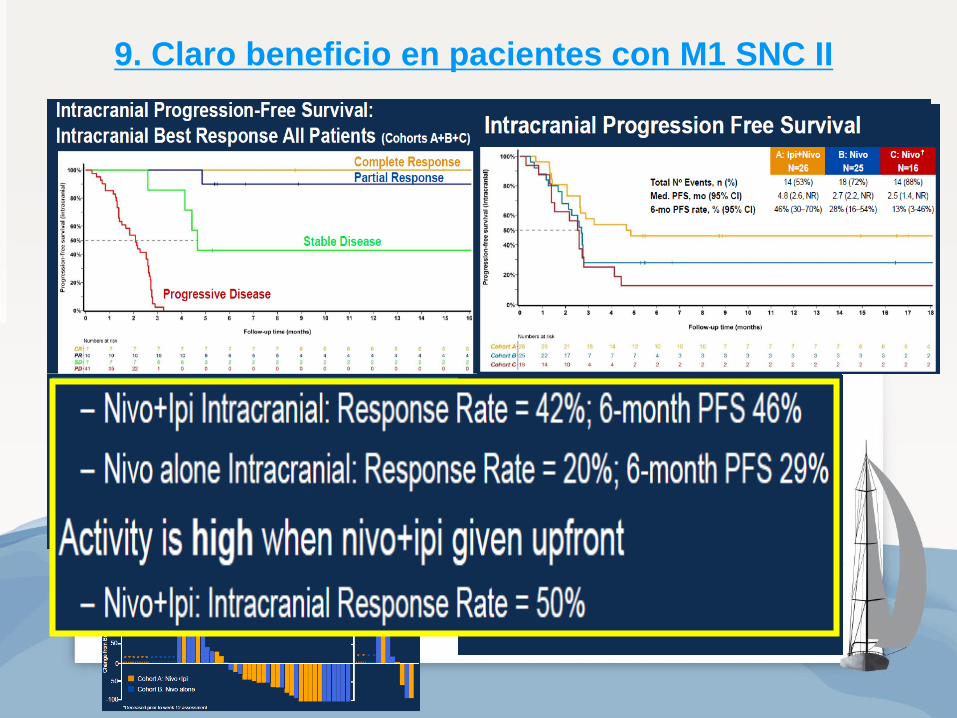
9. Claro beneficio en pacientes con M1 SNC II
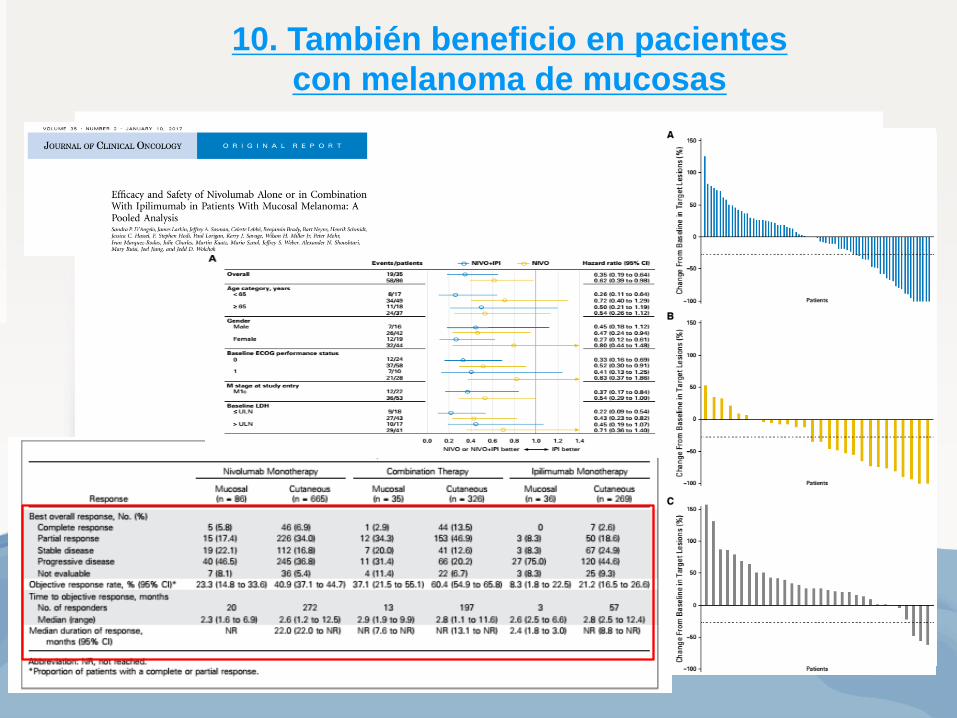
10. También beneficio en pacientes
con melanoma de mucosas
Mucosa mediana PFS:
NIVO: 3.0 meses
IPI + NIVO: 5.9 meses
IPI: 2.7 meses
Cutáneo mediana PFS:
NIVO: 6.2 meses
IPI + NIVO: 11.7 meses
IPI: 3.9 meses
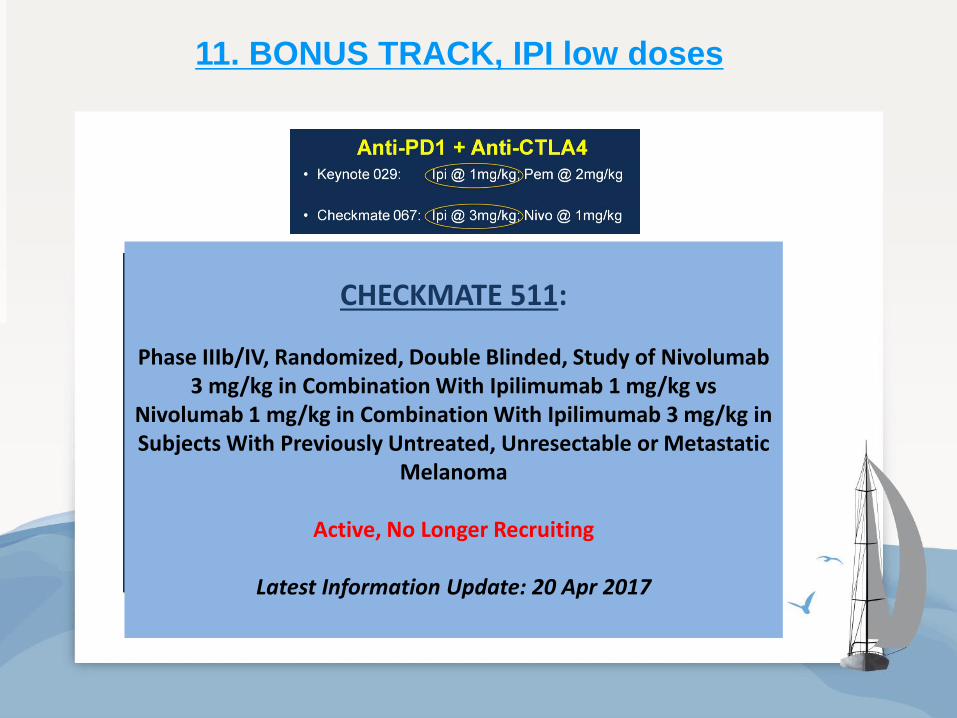
11. BONUS TRACK, IPI low doses
CHECKMATE 511:
Phase IIIb/IV, Randomized, Double Blinded, Study of Nivolumab 3 mg/kg in Combination With Ipilimumab 1 mg/kg vs
Nivolumab 1 mg/kg in Combination With Ipilimumab 3 mg/kg in Subjects With Previously Untreated, Unresectable or Metastatic
Melanoma
Active, No Longer Recruiting
Latest Information Update: 20 Apr 2017
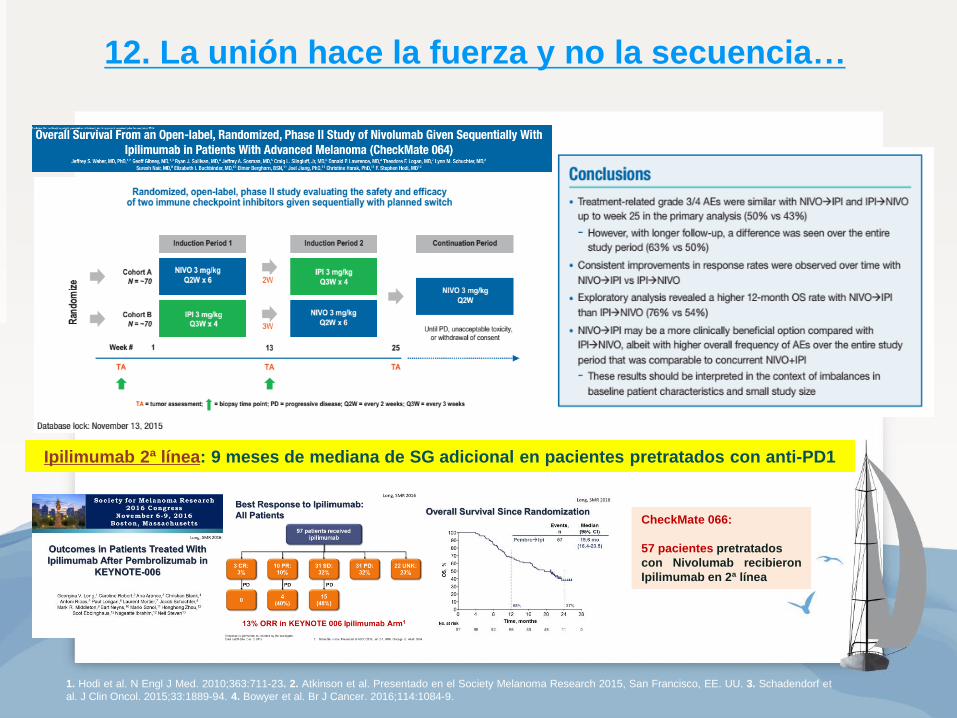
12. La unión hace la fuerza y no la secuencia…
Ipilimumab 2ª línea: 9 meses de mediana de SG adicional en pacientes pretratados con anti-PD1
1. Hodi et al. N Engl J Med. 2010;363:711-23. 2. Atkinson et al. Presentado en el Society Melanoma Research 2015, San Francisco, EE. UU. 3. Schadendorf et
al. J Clin Oncol. 2015;33:1889-94. 4. Bowyer et al. Br J Cancer. 2016;114:1084-9.
CheckMate 066:
57 pacientes pretratados
con Nivolumab recibieron
Ipilimumab en 2ª línea

¿Qué pasa con la toxicidad?
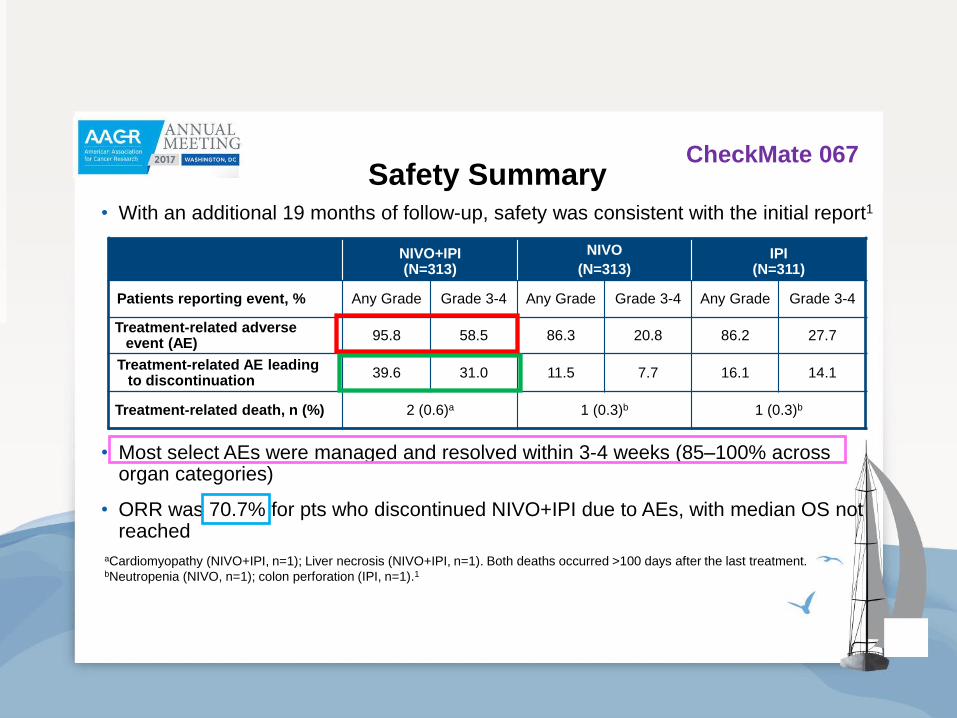
Safety Summary• With an additional 19 months of follow-up, safety was consistent with the initial report1
• Most select AEs were managed and resolved within 3-4 weeks (85–100% across organ categories)
• ORR was 70.7% for pts who discontinued NIVO+IPI due to AEs, with median OS not reached
NIVO+IPI(N=313)
NIVO
(N=313)IPI
(N=311)
Patients reporting event, % Any Grade Grade 3-4 Any Grade Grade 3-4 Any Grade Grade 3-4
Treatment-related adverse event (AE)
95.8 58.5 86.3 20.8 86.2 27.7
Treatment-related AE leading to discontinuation
39.6 31.0 11.5 7.7 16.1 14.1
Treatment-related death, n (%) 2 (0.6)a 1 (0.3)b 1 (0.3)b
aCardiomyopathy (NIVO+IPI, n=1); Liver necrosis (NIVO+IPI, n=1). Both deaths occurred >100 days after the last treatment.bNeutropenia (NIVO, n=1); colon perforation (IPI, n=1).1
1. Larkin J, et al. NEJM 2015;373:23‒34. 13
CheckMate 067
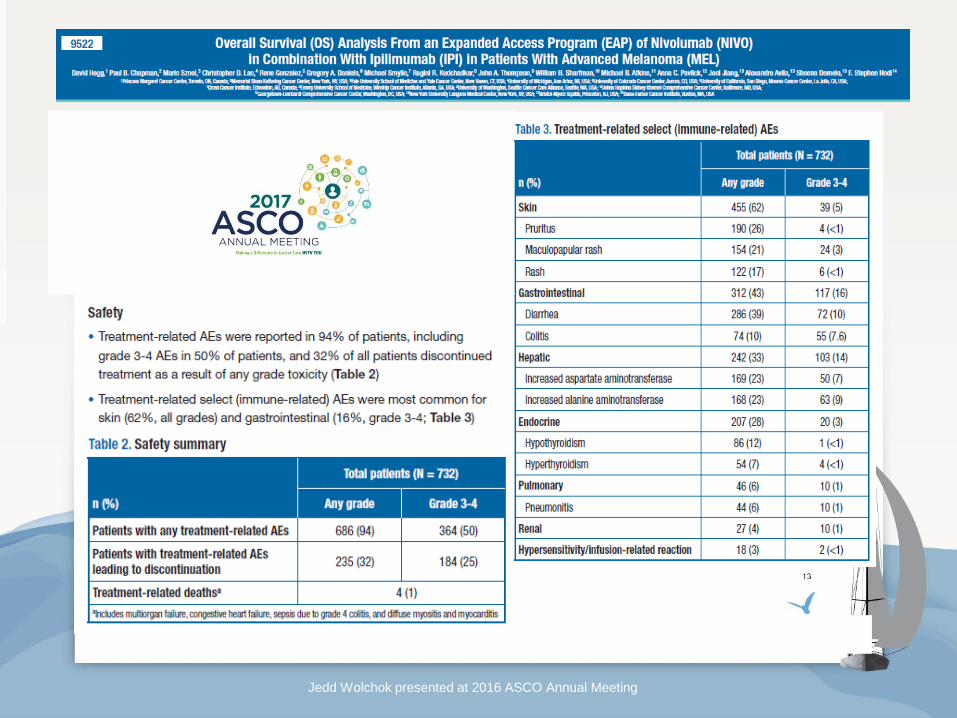
Most Common Treatment-related Select AEs
Jedd Wolchok presented at 2016 ASCO Annual Meeting
CheckMate 067
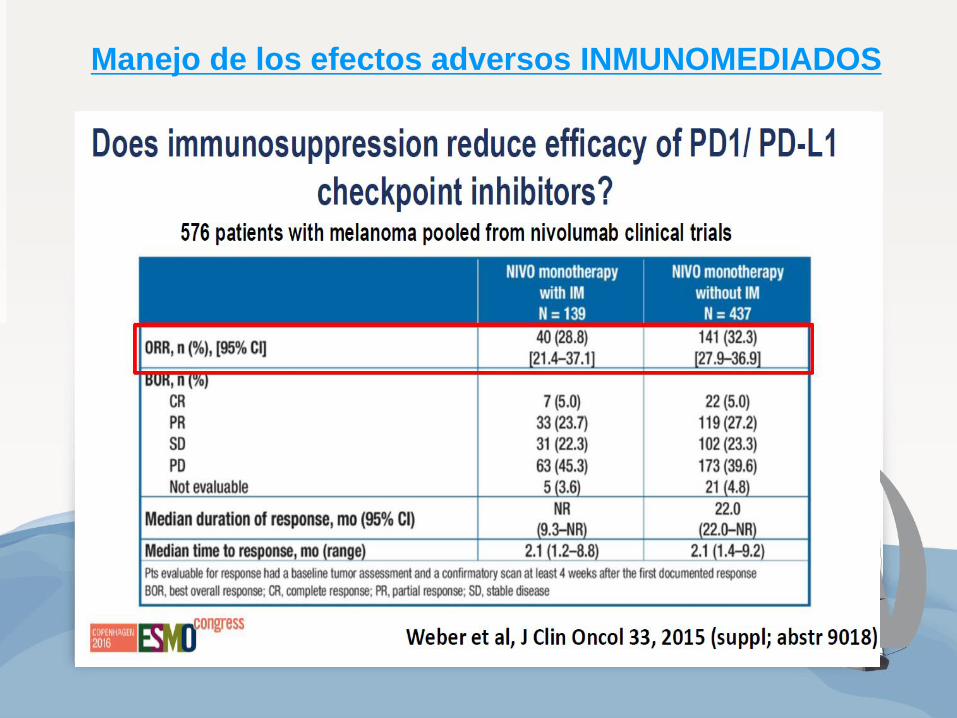
Manejo de los efectos adversos INMUNOMEDIADOS
• Educación del paciente y del personal sanitario que interacciona con él.
• El paciente debe ser evaluado antes de cada dosis de tratamiento.
• Laboratorio: TSH, LDH, bioquímica con perfil hepático
• Repaso de la sintomatología más frecuente.
• Manejo de efectos adversos en función de la gravedad de los mismos y de
los ALGORITMOS establecidos.
• Inicio precoz de del tratamiento de soporte en todos los eventos
adversos y del tratamiento con corticoterapia (en caso de toxicidad
moderada/grave)
• Leve: tratamiento de soporte, monitorización
estrecha
• Moderado: parar el tratamiento, valorar
corticoides
• Grave: discontinuar permanentemente el
tratamiento, inicio de corticoides
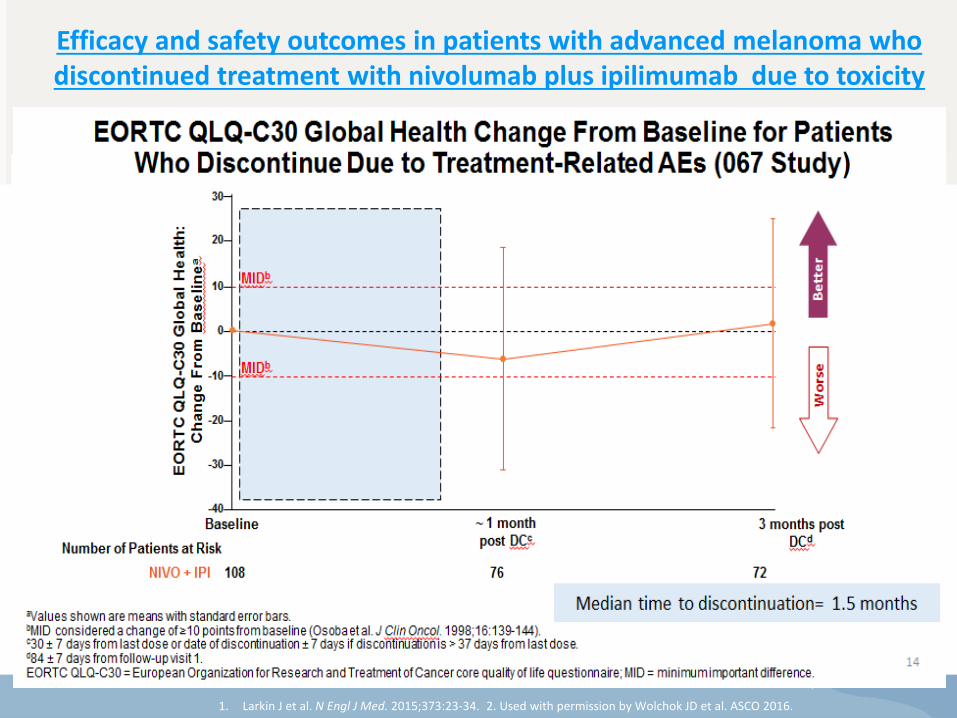
DC = patients who discontinued due to an AE; no DC = patients who did not discontinue due to an AE; NR = not recorded.
Pe
rce
nta
ge
of
PF
S
PFS per Investigator (Months)
0.0
0.1
0.2
0.3
0.4
0.5
0.6
0.7
0.8
0.9
1.0
0 3 6 9 12 15 18 30 24 21 27
176
233
111
121
77
99
60
83
12
20
149
139
94
109
73
96
38
48
0
0
Number of patients at risk:
Discontinued due to an AE
Did not discontinue due to an AE
0
2
Pro
bab
ilit
y o
f P
FS
NIVO+IPI DC (n = 176)
NIVO+IPI no DC (n = 233)
Median PFS, months (95% CI)
16.7 (10.2, NA) 10.8 (5.9, 23.0)
HR (99.5% CI) 0.74 (0.56, 0.98), P < 0.04
49.3%
45.9%
52.2%
48.4%
71.7%
56.5%
• Minimum follow-up of 18 months, median length of follow-up = 21.3 months
DC = patients who discontinued due to an AE; NA = not available; no DC = patients who did not discontinue due to an AE.
Efficacy and safety outcomes in patients with advanced melanoma who discontinued treatment with nivolumab plus ipilimumab due to toxicity
Schadendorf, D et al. EADO 2016
Best Overall Response
NIVO+IPI
Discontinued due to AEs
(n = 176)
Did not discontinue due to AEs (n = 233)
ORR, % (95% CI) 68.2
(60.8, 75.0) 50.2
(43.6, 56.8)
P value for comparison 0.0200
Best overall response, %
Complete response 17.6 12.0
Partial response 50.6 38.2
Stable disease 15.9 10.7
Progressive disease 13.1 27.0
Unable to determine 2.8 12.0
• Median time to subsequent systemic therapy was not reached in either group, with 87% and 71%
of patients, respectively, free of systemic treatments at 12 months
Time to Response and Durability of Response in Patients Who
Discontinued Due to AEs
Pa
tie
nts
0 8 16 24 32 40 48 56 64 72 80 88 96 104 112 120
Time (Weeks)
On treatment
Off treatment
First response
Ongoing response
NIVO + IPI
DC
(n = 176)
No DC
(n = 233)
Median time to
response, months
(range)
2.8
(1.1-15.2)
2.8
(1.4-17.1)
Median duration of
response, months
(range)
NR NR
Ongoing response
among
responders, n/N
(%)
82/120
(68)
94/117
(80)
P value = 0.0213
• Minimum follow-up of 18 months
1. Larkin J et al. N Engl J Med. 2015;373:23-34. 2. Used with permission by Wolchok JD et al. ASCO 2016.
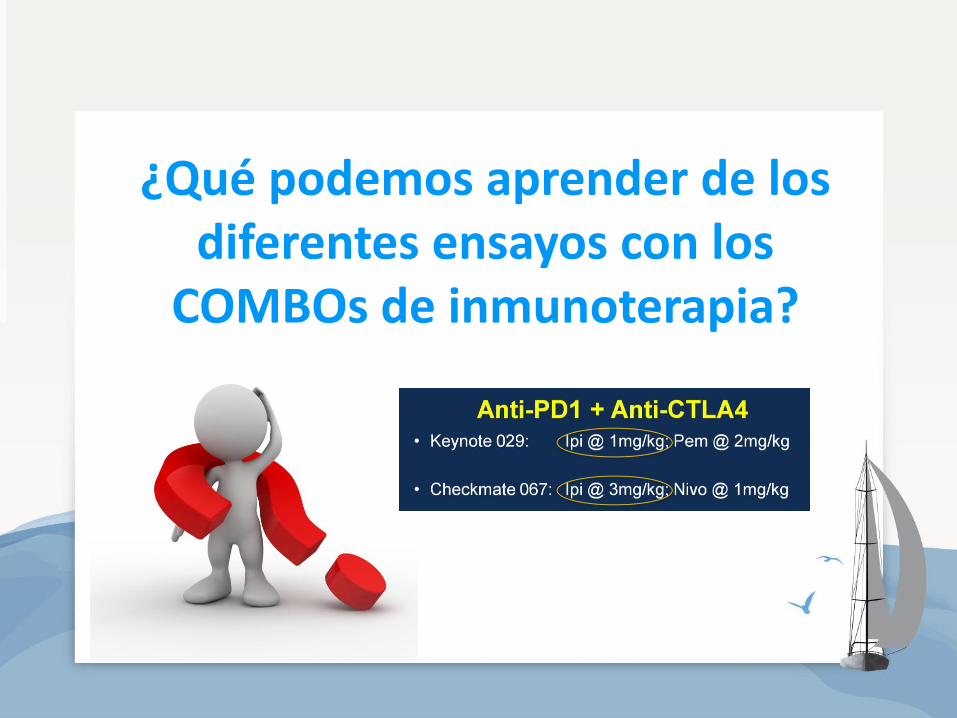
¿Qué podemos aprender de los diferentes ensayos con los
COMBOs de inmunoterapia?
• La combinación IPI+NIVO presenta de manera estadísticamente significativa un
mayor beneficio en cuanto a OS y PFS respecto a IPI en pacientes afectos de
melanoma metastásico.
• En un análisis descriptivo:
• NIVO+IPI obtiene numéricamente un mayor beneficio en cuanto a OS, PFS y
ORR vs NIVO
• Dichos resultados son superiores para IPI+NIVO incluso en aquellos subgrupos
de pacientes más relevantes: BRAF mutados, LDH elevada, M1 SNC (ORR
50%), PD-L1 bajo expresores (<5% o <1%):
• Aunque la curvas de OS son parecidas para la población alta expresora de
PD-L1 (>5% o >1%), IPI+NIVO presentó una mayor tasa de ORR vs NIVO
independientemente del nivel de expresión de PD-L1
• La mediana de duración de respuesta resulta ser mayor para IPI+NIVO
• El tiempo medio a segunda línea de tratamiento no se ha alcanzado para
IPI+NIVO
• El perfil de toxicidad de IPI+NIVO es consistente en todos los estudios, con un 58% de
eventos grado3-4, una tasa de discontinuación del 40% pero un 70% de los
pacientes que discontinúan el tratamiento se siguen beneficiando del mismo.
• El 50-60% precisan tratamiento inmunosupresor, el 85-100% de los efectos
adversos se resuelven en 3-4 semanas con tratamiento médico.
Larkin et al presented at 2017 AACR Annual Meeting
2017
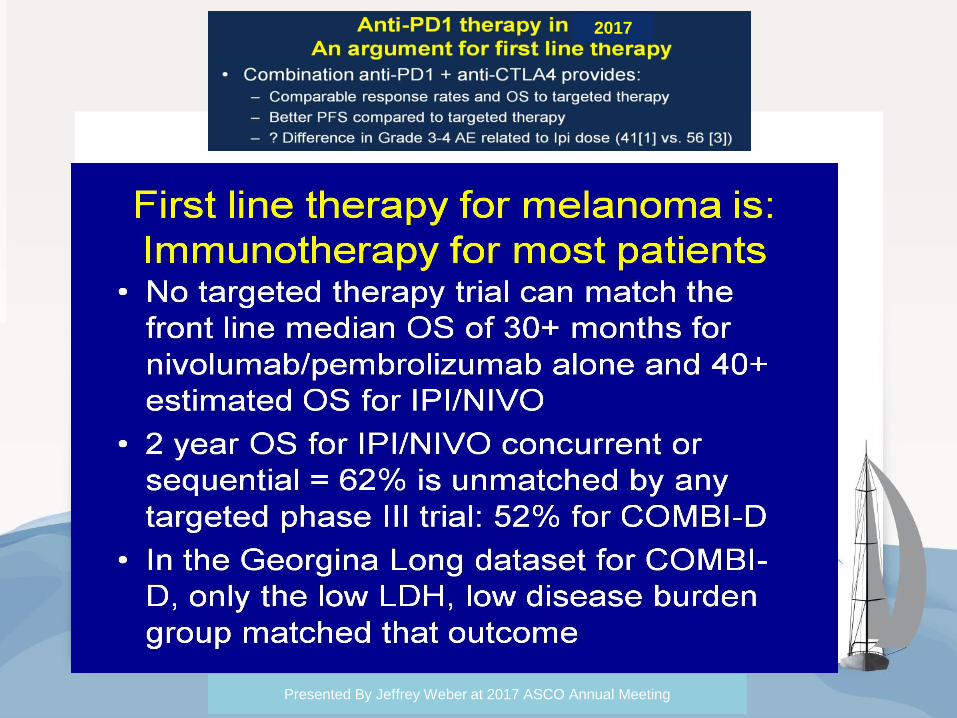
Presented By Jeffrey Weber at 2017 ASCO Annual Meeting
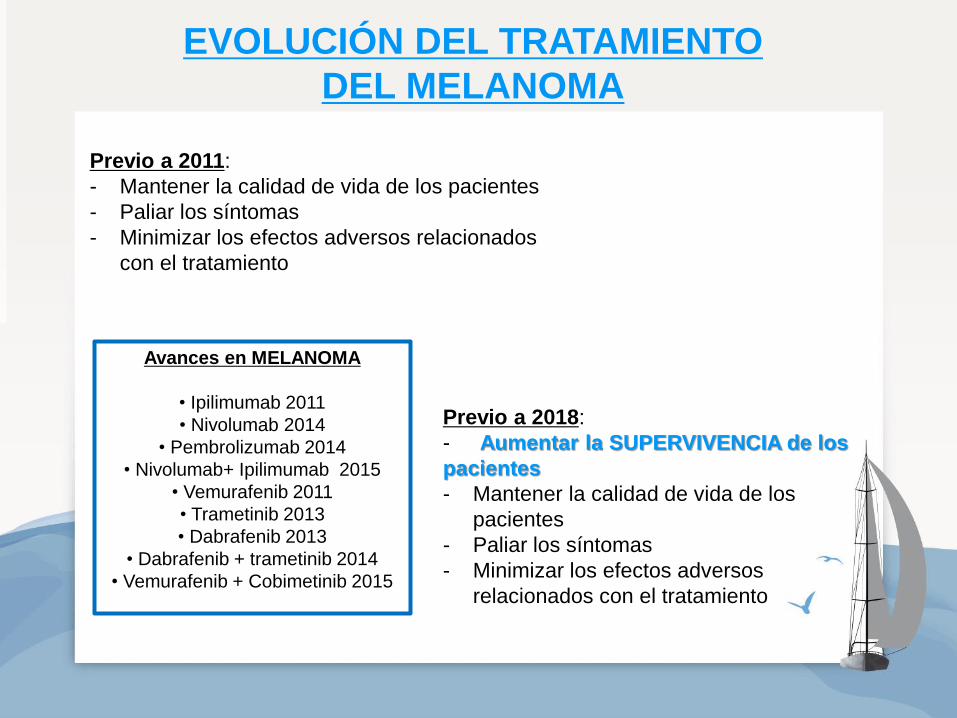
EVOLUCIÓN DEL TRATAMIENTO
DEL MELANOMA
Previo a 2011:
- Mantener la calidad de vida de los pacientes
- Paliar los síntomas
- Minimizar los efectos adversos relacionados
con el tratamiento
Previo a 2018:
- Aumentar la SUPERVIVENCIA de los
pacientes
- Mantener la calidad de vida de los
pacientes
- Paliar los síntomas
- Minimizar los efectos adversos
relacionados con el tratamiento
Avances en MELANOMA
• Ipilimumab 2011
• Nivolumab 2014
• Pembrolizumab 2014
• Nivolumab+ Ipilimumab 2015
• Vemurafenib 2011
• Trametinib 2013
• Dabrafenib 2013
• Dabrafenib + trametinib 2014
• Vemurafenib + Cobimetinib 2015