Embed Size (px)
Citation preview
8/8/2019 Presentation SCA Interim Report Q2 2010
http://slidepdf.com/reader/full/presentation-sca-interim-report-q2-2010 1/14
Interim Report Q2 2010
SCA Interim Report1 January – 30 June 2010
8/8/2019 Presentation SCA Interim Report Q2 2010
http://slidepdf.com/reader/full/presentation-sca-interim-report-q2-2010 2/14
Interim Report Q2 20102
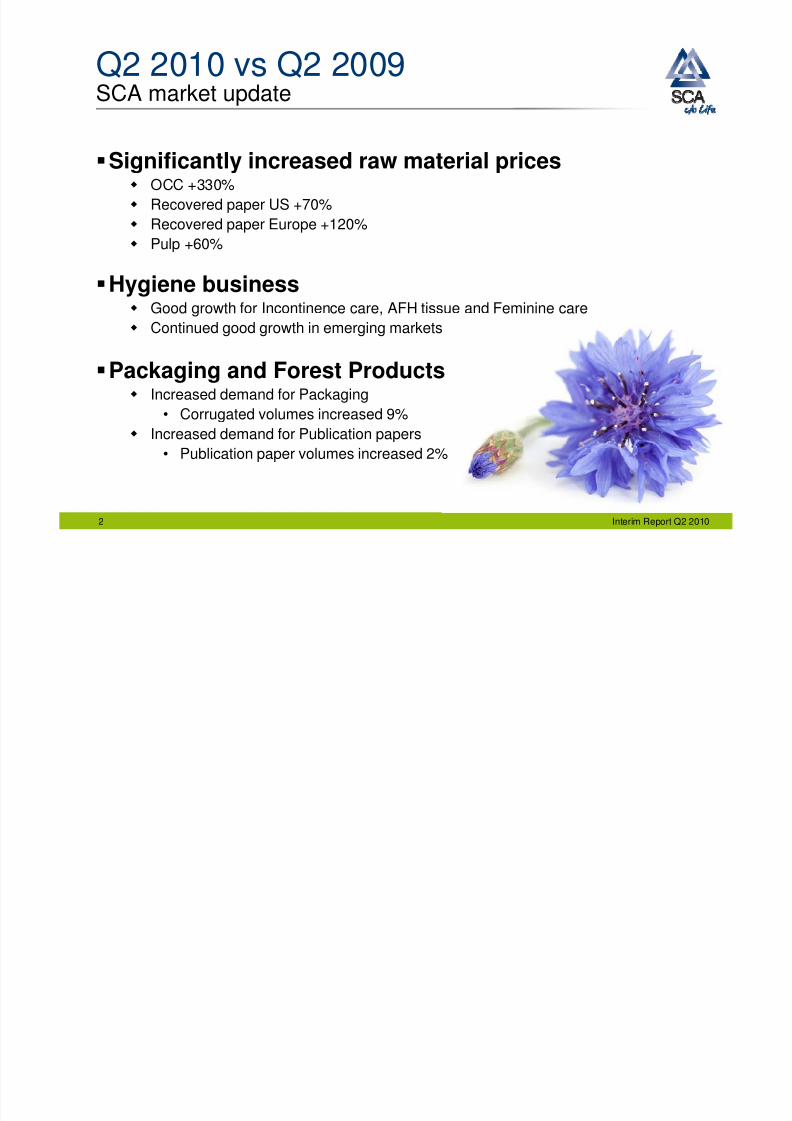
Q2 2010 vs Q2 2009SCA market update
Significantly increased raw material prices OCC +330%
Recovered paper US +70%
Recovered paper Europe +120%
Pulp +60%
Hygiene business Good growth for Incontinence care, AFH tissue and Feminine care
Continued good growth in emerging markets
Packaging and Forest Products Increased demand for Packaging
• Corrugated volumes increased 9%
Increased demand for Publication papers
• Publication paper volumes increased 2%
8/8/2019 Presentation SCA Interim Report Q2 2010
http://slidepdf.com/reader/full/presentation-sca-interim-report-q2-2010 3/14
3
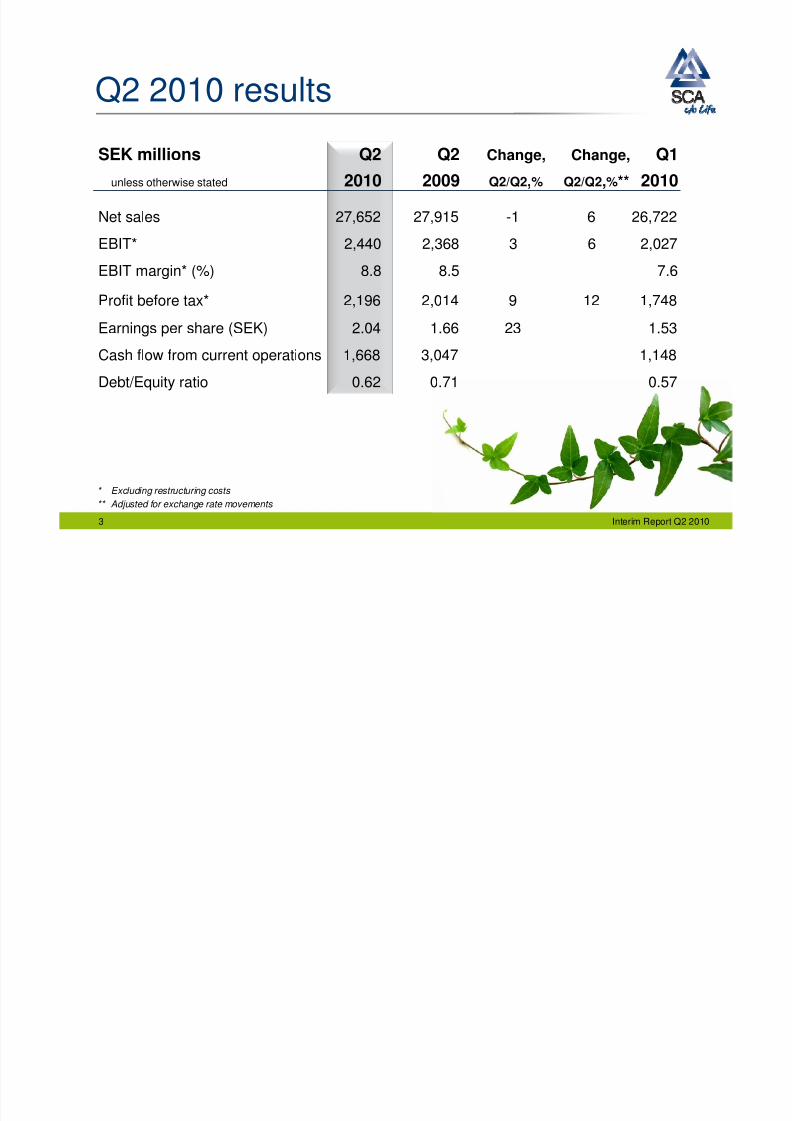
Q2 2010 results
* Excluding restructuring costs
** Adjusted for exchange rate movements
SEK millions Q2 Q2 Change, Change, Q1
unless otherwise stated 2010 2009 Q2/Q2,% Q2/Q2,%** 2010
Net sales 27,652 27,915 -1 6 26,722
EBIT* 2,440 2,368 3 6 2,027
EBIT margin* (%) 8.8 8.5 7.6
Profit before tax* 2,196 2,014 9 12 1,748
Earnings per share (SEK) 2.04 1.66 23 1.53
Cash flow from current operations 1,668 3,047 1,148
Debt/Equity ratio 0.62 0.71 0.57
Interim Report Q2 2010
8/8/2019 Presentation SCA Interim Report Q2 2010
http://slidepdf.com/reader/full/presentation-sca-interim-report-q2-2010 4/14
4
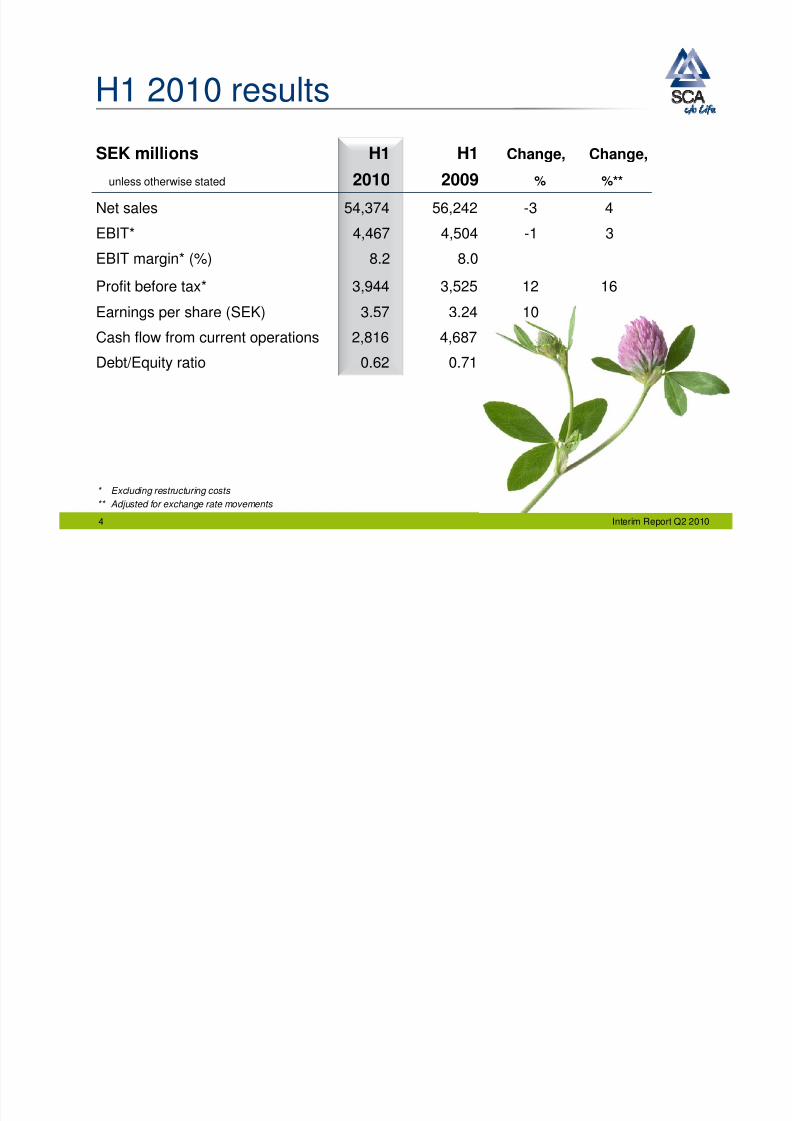
H1 2010 results
* Excluding restructuring costs
** Adjusted for exchange rate movements
SEK millions H1 H1 Change, Change,
unless otherwise stated 2010 2009 % %**
Net sales 54,374 56,242 -3 4
EBIT* 4,467 4,504 -1 3
EBIT margin* (%) 8.2 8.0
Profit before tax* 3,944 3,525 12 16Earnings per share (SEK) 3.57 3.24 10
Cash flow from current operations 2,816 4,687
Debt/Equity ratio 0.62 0.71
Interim Report Q2 2010
8/8/2019 Presentation SCA Interim Report Q2 2010
http://slidepdf.com/reader/full/presentation-sca-interim-report-q2-2010 5/14
Interim Report Q2 20105
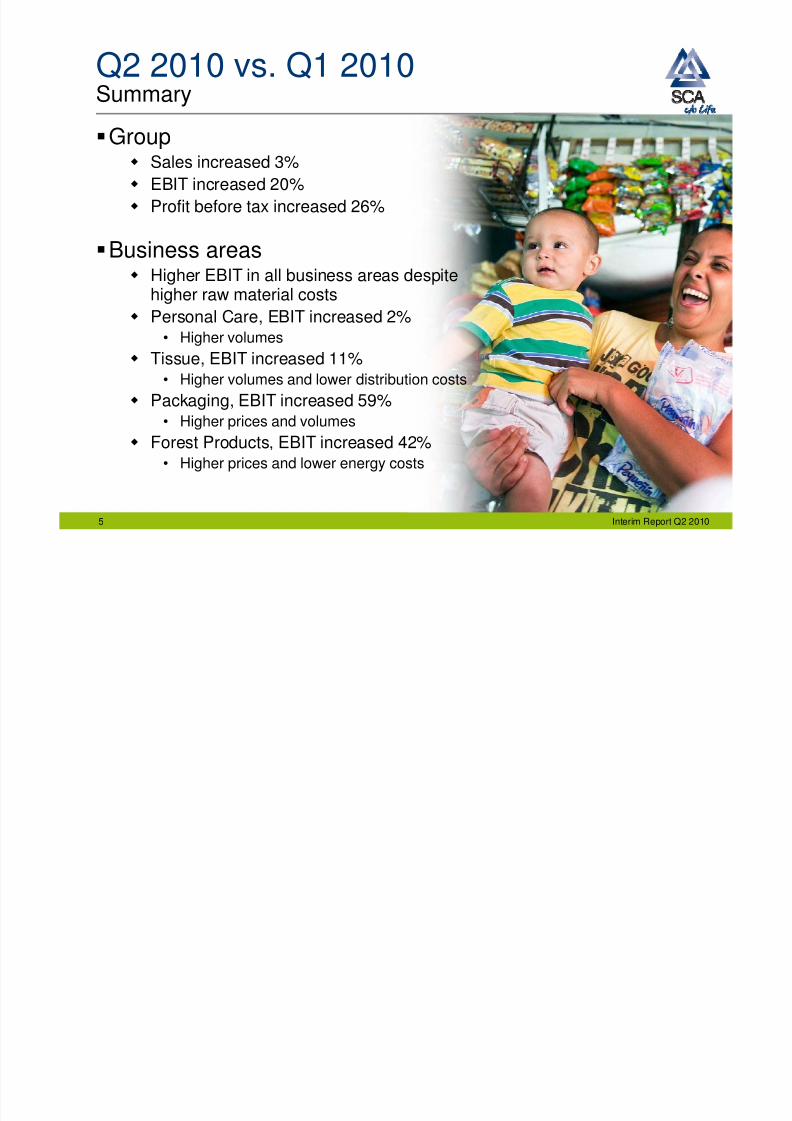
Q2 2010 vs. Q1 2010Summary
Group Sales increased 3%
EBIT increased 20%
Profit before tax increased 26%
Business areas Higher EBIT in all business areas despite
higher raw material costs Personal Care, EBIT increased 2%
• Higher volumes
Tissue, EBIT increased 11%• Higher volumes and lower distribution costs
Packaging, EBIT increased 59%• Higher prices and volumes
Forest Products, EBIT increased 42%• Higher prices and lower energy costs
8/8/2019 Presentation SCA Interim Report Q2 2010
http://slidepdf.com/reader/full/presentation-sca-interim-report-q2-2010 6/14
Interim Report Q2 20106
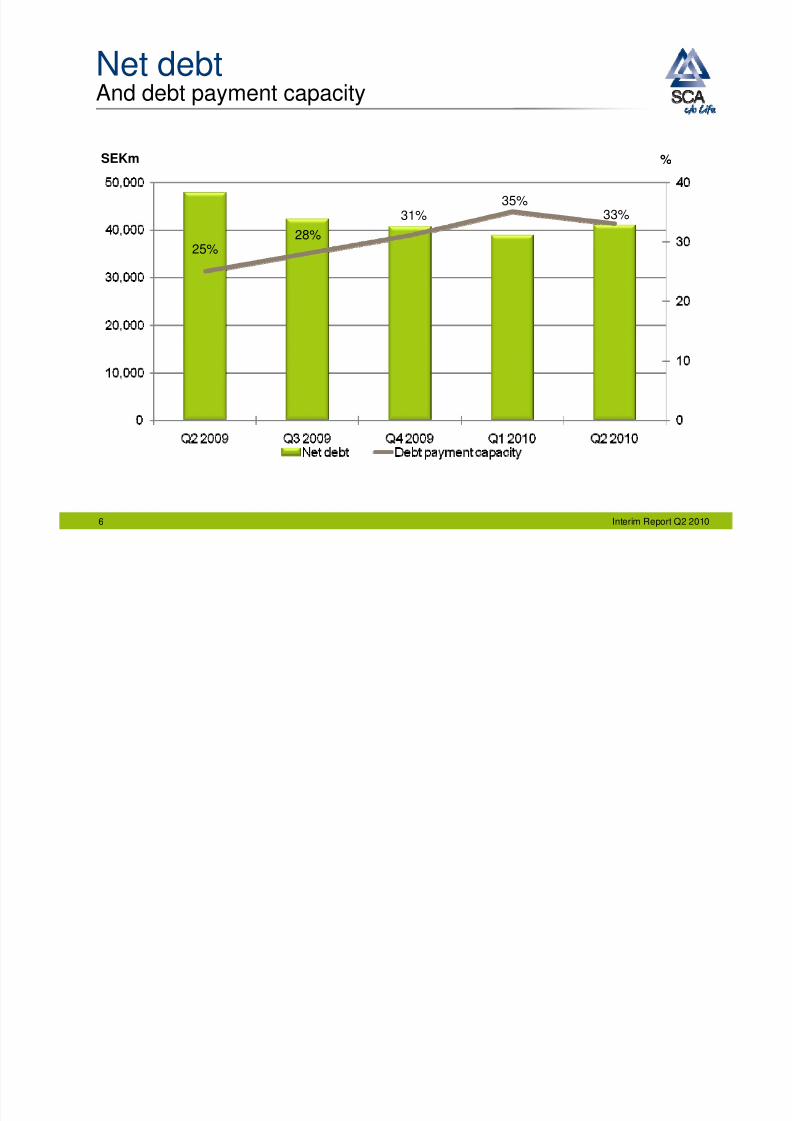
Net debtAnd debt payment capacity
%SEKm
28%
31%35%
33%
25%
8/8/2019 Presentation SCA Interim Report Q2 2010
http://slidepdf.com/reader/full/presentation-sca-interim-report-q2-2010 7/14
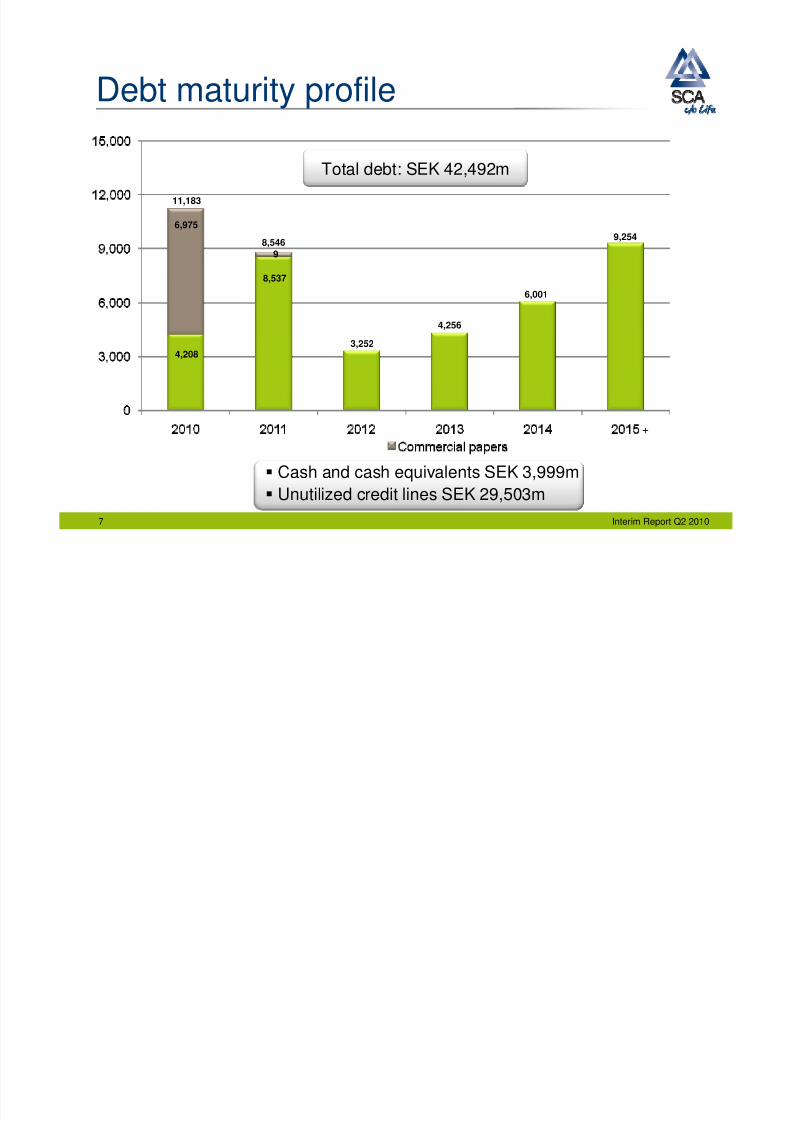
Debt maturity profile
Total debt: SEK 42,492m
6,975
4,208
11,183
9
8,537
8,546
3,252
4,256
6,001
9,254
Cash and cash equivalents SEK 3,999m
Unutilized credit lines SEK 29,503m
+
7 Interim Report Q2 2010
8/8/2019 Presentation SCA Interim Report Q2 2010
http://slidepdf.com/reader/full/presentation-sca-interim-report-q2-2010 8/14
Interim Report Q2 20108
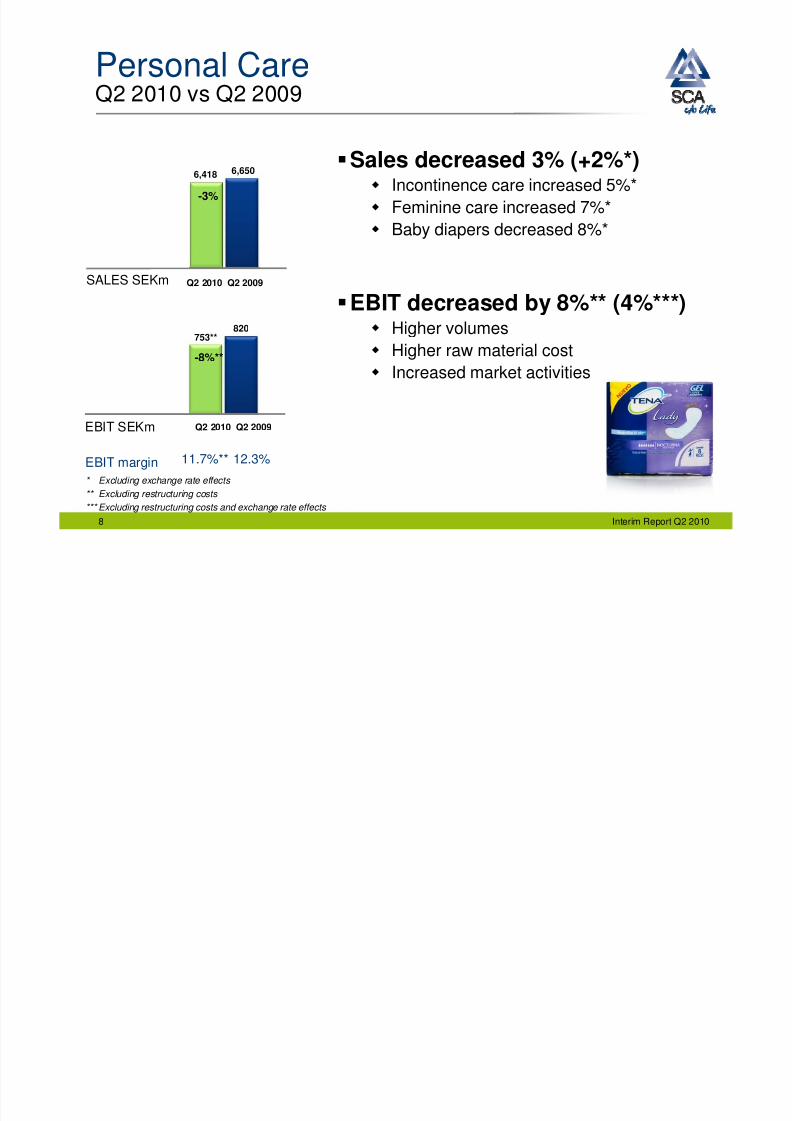
Personal CareQ2 2010 vs Q2 2009
-3%
EBIT margin 12.3%11.7%**
-8%**
SALES SEKm
EBIT SEKm
6,6506,418
820753**
Q2 2010 Q2 2009
Q2 2010 Q2 2009
* Excluding exchange rate effects
** Excluding restructuring costs
*** Excluding restructuring costs and exchange rate effects
Sales decreased 3% (+2%*) Incontinence care increased 5%*
Feminine care increased 7%*
Baby diapers decreased 8%*
EBIT decreased by 8%** (4%***) Higher volumes
Higher raw material cost
Increased market activities
8/8/2019 Presentation SCA Interim Report Q2 2010
http://slidepdf.com/reader/full/presentation-sca-interim-report-q2-2010 9/14
Interim Report Q2 20109
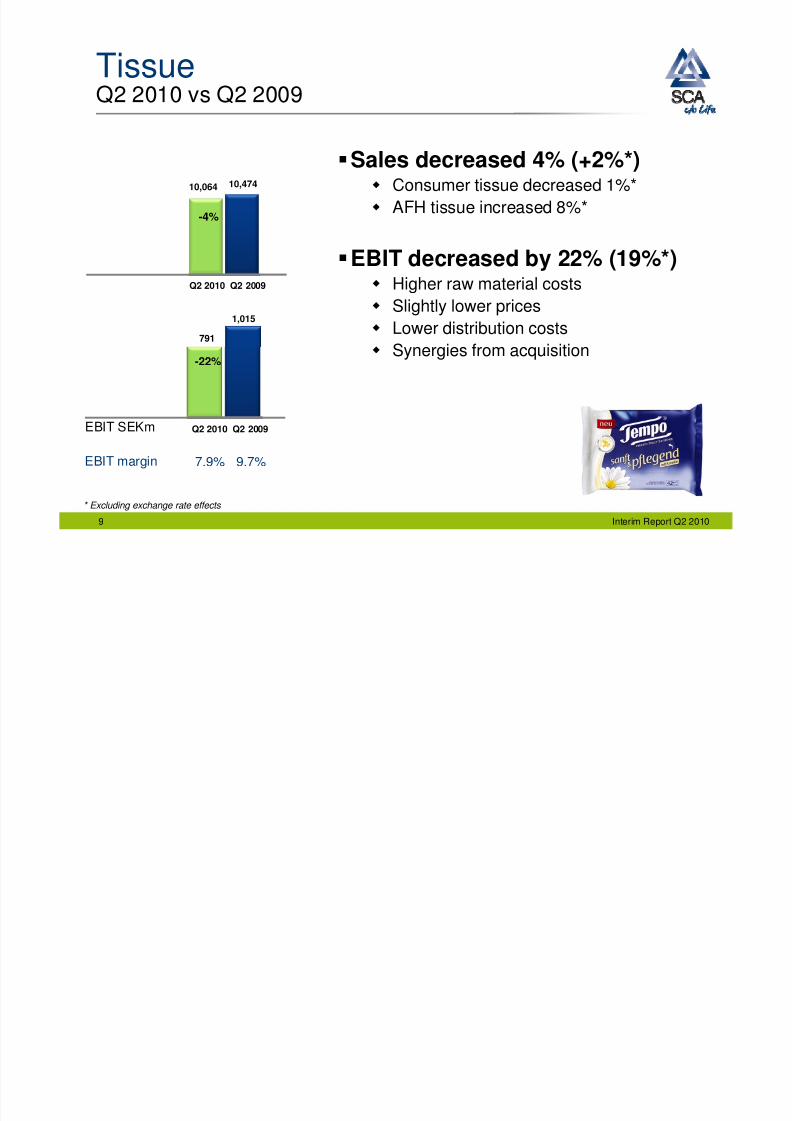
TissueQ2 2010 vs Q2 2009
-4%
EBIT margin 9.7%7.9%
-22%
10,47410,064
1,015
791
EBIT SEKm
Q2 2010 Q2 2009
Q2 2010 Q2 2009
* Excluding exchange rate effects
Sales decreased 4% (+2%*) Consumer tissue decreased 1%*
AFH tissue increased 8%*
EBIT decreased by 22% (19%*) Higher raw material costs
Slightly lower prices
Lower distribution costs
Synergies from acquisition
8/8/2019 Presentation SCA Interim Report Q2 2010
http://slidepdf.com/reader/full/presentation-sca-interim-report-q2-2010 10/14
Interim Report Q2 201010
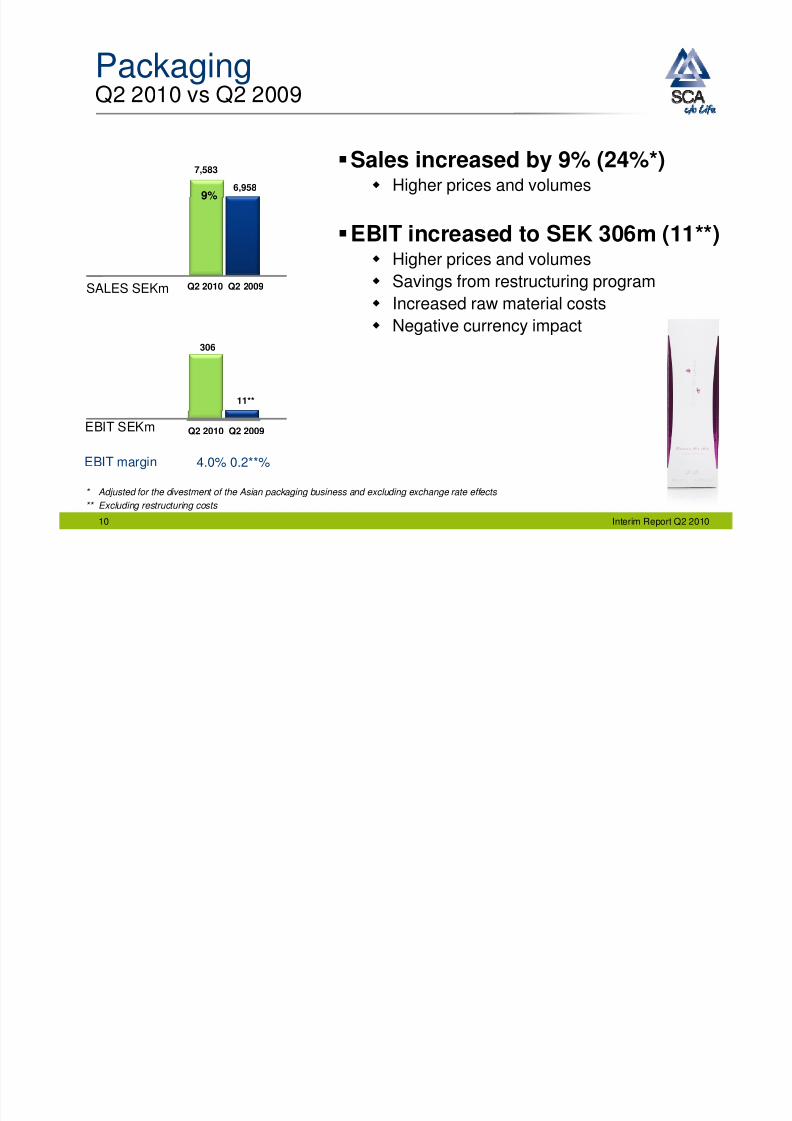
PackagingQ2 2010 vs Q2 2009
9%
EBIT margin 0.2**%4.0%
6,958
7,583
11**
306
SALES SEKm
EBIT SEKm
* Adjusted for the divestment of the Asian packaging business and excluding exchange rate effects
** Excluding restructuring costs
Q2 2010 Q2 2009
Q2 2010 Q2 2009
Sales increased by 9% (24%*) Higher prices and volumes
EBIT increased to SEK 306m (11**) Higher prices and volumes
Savings from restructuring program
Increased raw material costs
Negative currency impact
8/8/2019 Presentation SCA Interim Report Q2 2010
http://slidepdf.com/reader/full/presentation-sca-interim-report-q2-2010 11/14
Interim Report Q2 201011
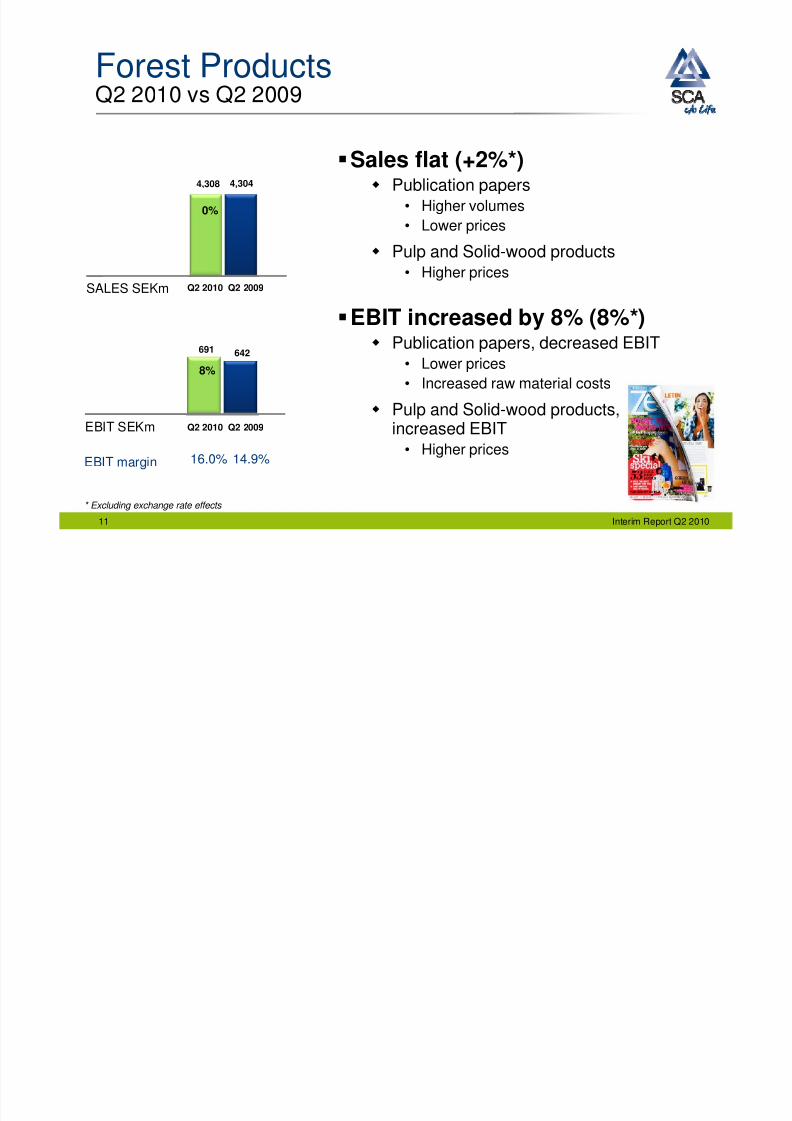
Forest ProductsQ2 2010 vs Q2 2009
0%
EBIT margin 14.9%16.0%
8%
4,3044,308
642691
SALES SEKm
EBIT SEKm
Q2 2010 Q2 2009
Q2 2010 Q2 2009
* Excluding exchange rate effects
Sales flat (+2%*) Publication papers
• Higher volumes
• Lower prices
Pulp and Solid-wood products• Higher prices
EBIT increased by 8% (8%*) Publication papers, decreased EBIT
• Lower prices
• Increased raw material costs
Pulp and Solid-wood products,increased EBIT
• Higher prices
8/8/2019 Presentation SCA Interim Report Q2 2010
http://slidepdf.com/reader/full/presentation-sca-interim-report-q2-2010 12/14
Interim Report Q2 201012
Outlook 2010 Group
Improved general market conditions Effects from price increases gradually during the
second half 2010
Hygiene businesses Good demand Increasing prices for Tissue
Packaging Demand improvement Increasing prices
Forest Products
Recovery from low level for publication papers Price increases on magazine paper

8/8/2019 Presentation SCA Interim Report Q2 2010
http://slidepdf.com/reader/full/presentation-sca-interim-report-q2-2010 13/14
Interim Report Q2 201013
Q & A
8/8/2019 Presentation SCA Interim Report Q2 2010
http://slidepdf.com/reader/full/presentation-sca-interim-report-q2-2010 14/14
Interim Report Q2 201014