Embed Size (px)
Citation preview
High Resolution Hydrography and Hydrologic Modeling
David Tarboton Utah State University
Acknowledgements Ideas: David Maidment, Nazmus Sazib, Xing Zheng, Solomon Vimal, Charlie Luce, Tom Black, Ajay Prasad Funding: National Science Foundation (HydroShare – ACI 1148453, 1148990; CI-WATER EPS-1135482), US Army Corps of Engineers (TauDEM), William Penn Foundation (Stroud Water Center Model My Watershed), USFS (for GRAIP)
http://hydrology.usu.edu/dtarb
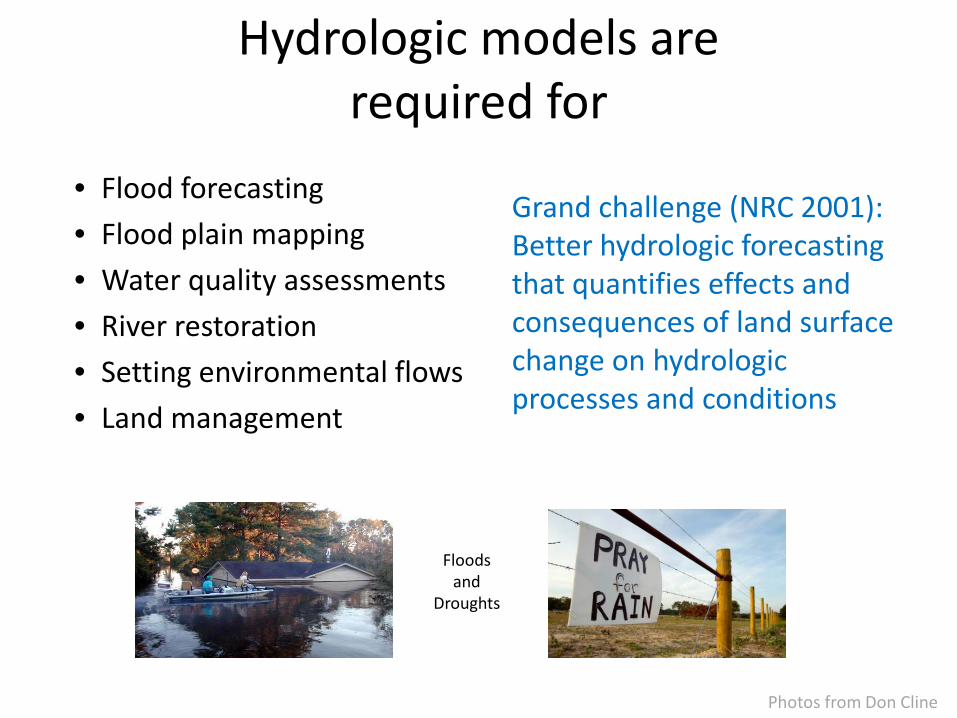
Hydrologic models are required for
• Flood forecasting • Flood plain mapping • Water quality assessments • River restoration • Setting environmental flows • Land management
Grand challenge (NRC 2001): Better hydrologic forecasting that quantifies effects and consequences of land surface change on hydrologic processes and conditions
Floods and
Droughts
Photos from Don Cline
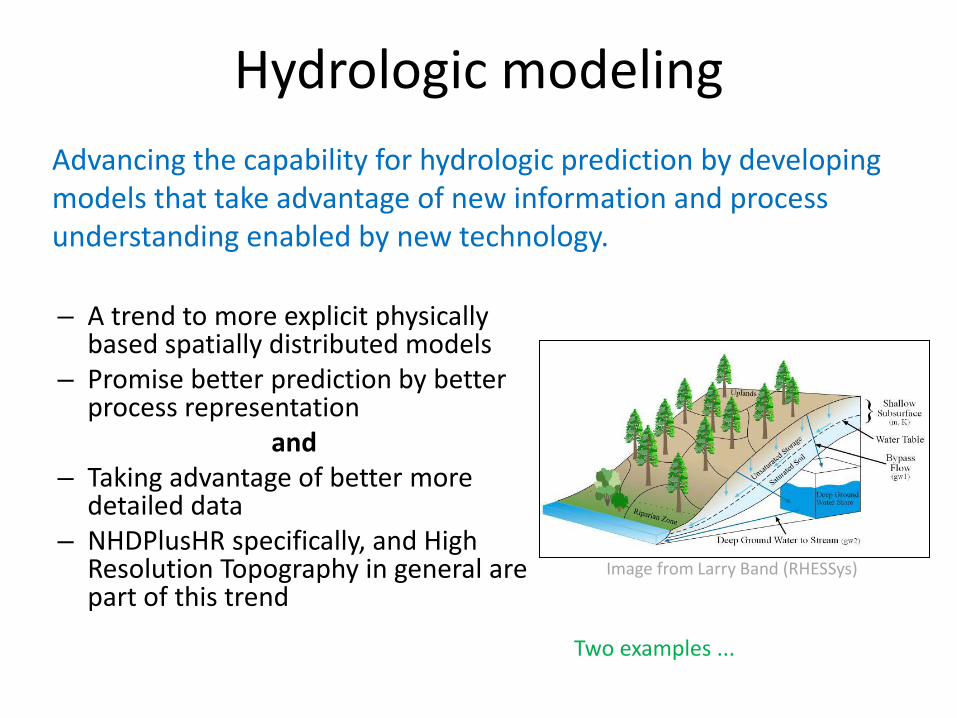
Hydrologic modeling
– A trend to more explicit physically based spatially distributed models
– Promise better prediction by better process representation
and – Taking advantage of better more
detailed data – NHDPlusHR specifically, and High
Resolution Topography in general are part of this trend
Advancing the capability for hydrologic prediction by developing models that take advantage of new information and process understanding enabled by new technology.
Two examples ...
Image from Larry Band (RHESSys)
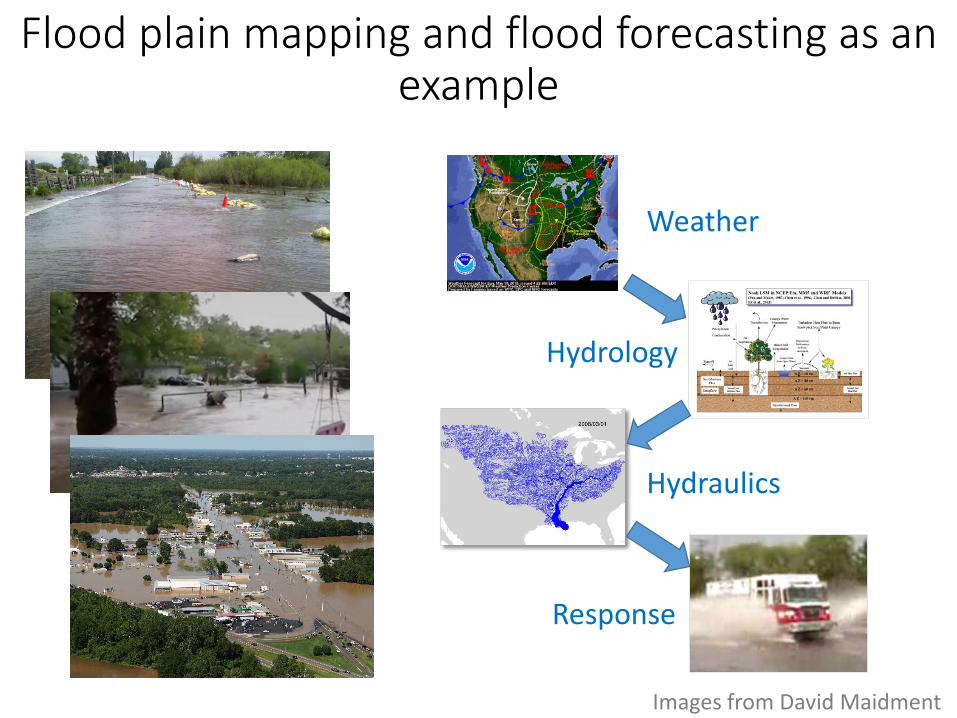
Flood plain mapping and flood forecasting as an example
Weather
Hydrology
Hydraulics
Response
Images from David Maidment
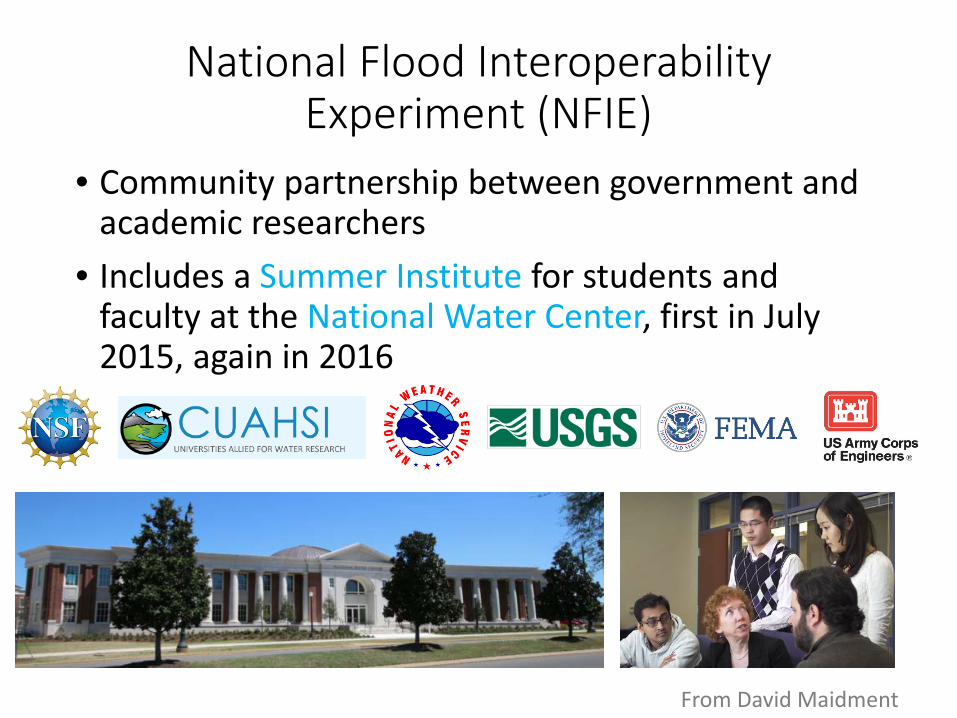
National Flood Interoperability Experiment (NFIE)
• Community partnership between government and academic researchers
• Includes a Summer Institute for students and faculty at the National Water Center, first in July 2015, again in 2016
From David Maidment
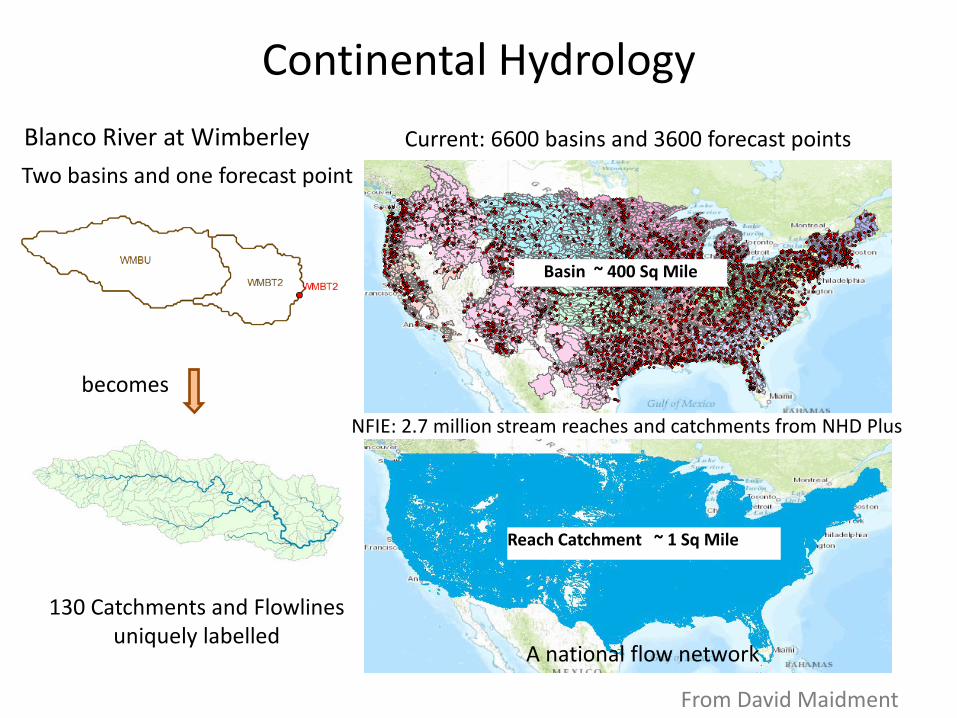
Continental Hydrology
130 Catchments and Flowlines uniquely labelled
Two basins and one forecast point
becomes
Current: 6600 basins and 3600 forecast points
NFIE: 2.7 million stream reaches and catchments from NHD Plus
A national flow network
Blanco River at Wimberley
Basin ~ 400 Sq Mile
Reach Catchment ~ 1 Sq Mile
From David Maidment
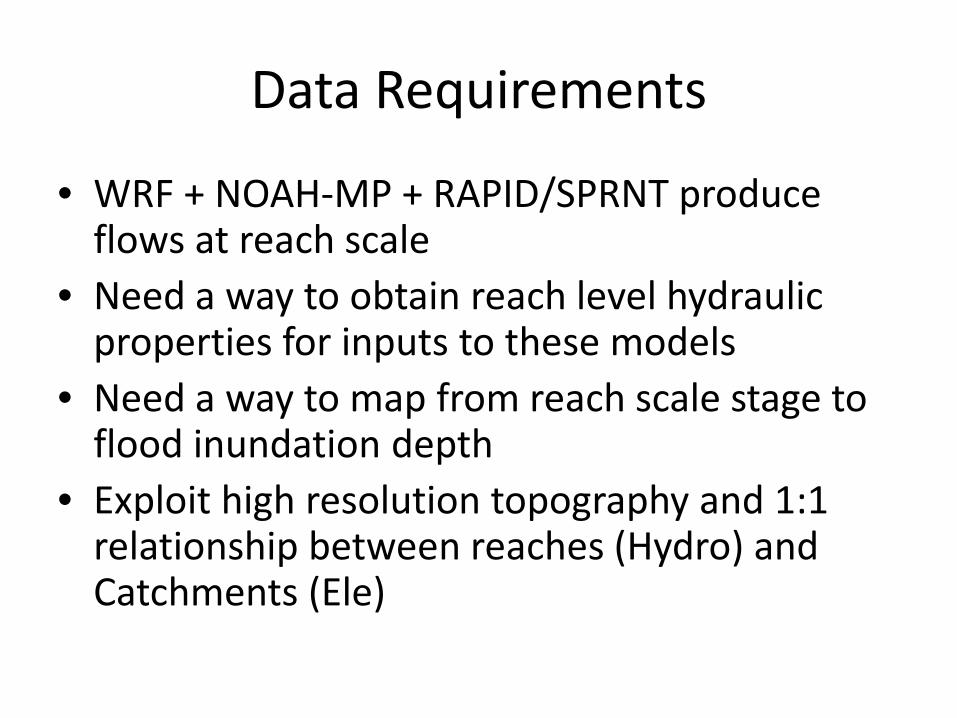
Data Requirements
• WRF + NOAH-MP + RAPID/SPRNT produce flows at reach scale
• Need a way to obtain reach level hydraulic properties for inputs to these models
• Need a way to map from reach scale stage to flood inundation depth
• Exploit high resolution topography and 1:1 relationship between reaches (Hydro) and Catchments (Ele)
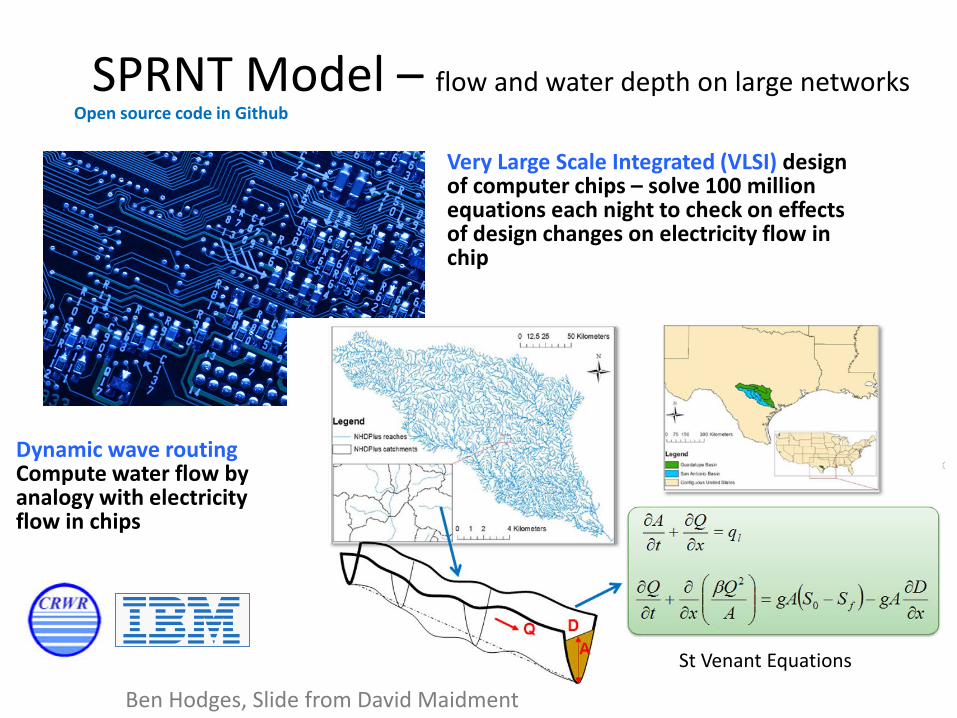
SPRNT Model – flow and water depth on large networks
Very Large Scale Integrated (VLSI) design of computer chips – solve 100 million equations each night to check on effects of design changes on electricity flow in chip
Dynamic wave routing Compute water flow by analogy with electricity flow in chips
Open source code in Github
Ben Hodges, Slide from David Maidment
St Venant Equations
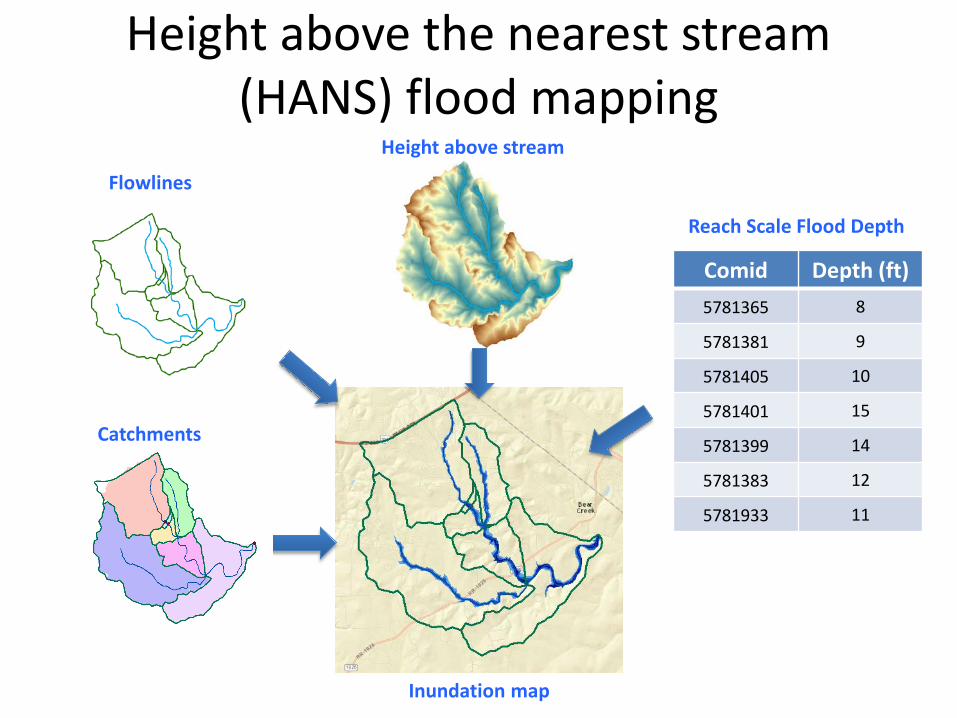
Flowlines
Catchments
Height above stream
Inundation map
Reach Scale Flood Depth
Comid Depth (ft) 5781365 8
5781381 9
5781405 10
5781401 15
5781399 14
5781383 12
5781933 11
Height above the nearest stream (HANS) flood mapping
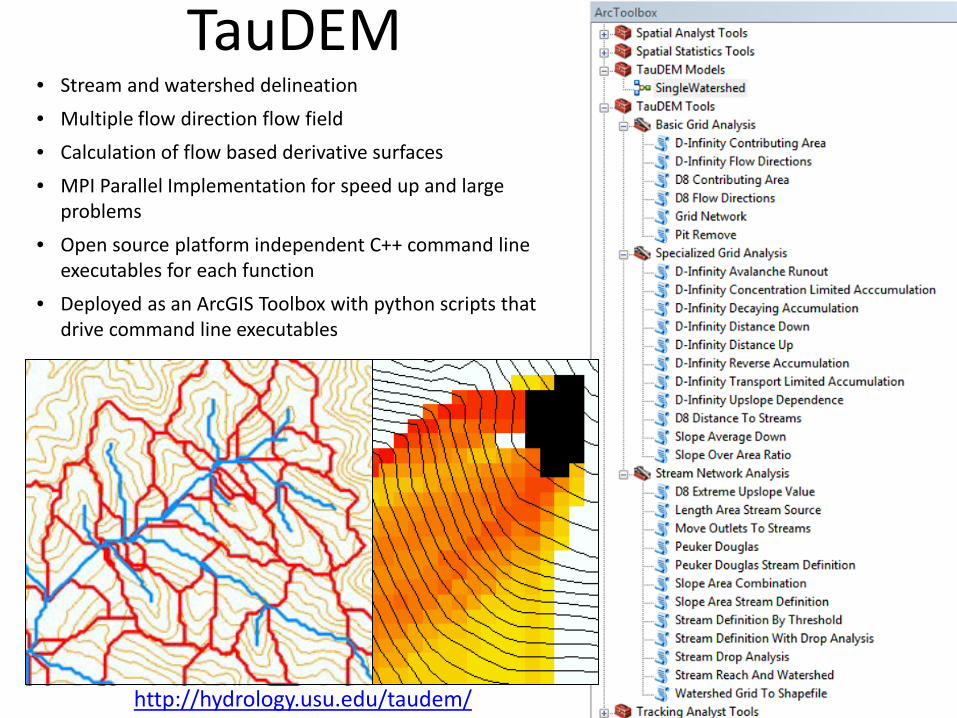
http://hydrology.usu.edu/taudem/
TauDEM • Stream and watershed delineation • Multiple flow direction flow field • Calculation of flow based derivative surfaces • MPI Parallel Implementation for speed up and large
problems • Open source platform independent C++ command line
executables for each function • Deployed as an ArcGIS Toolbox with python scripts that
drive command line executables
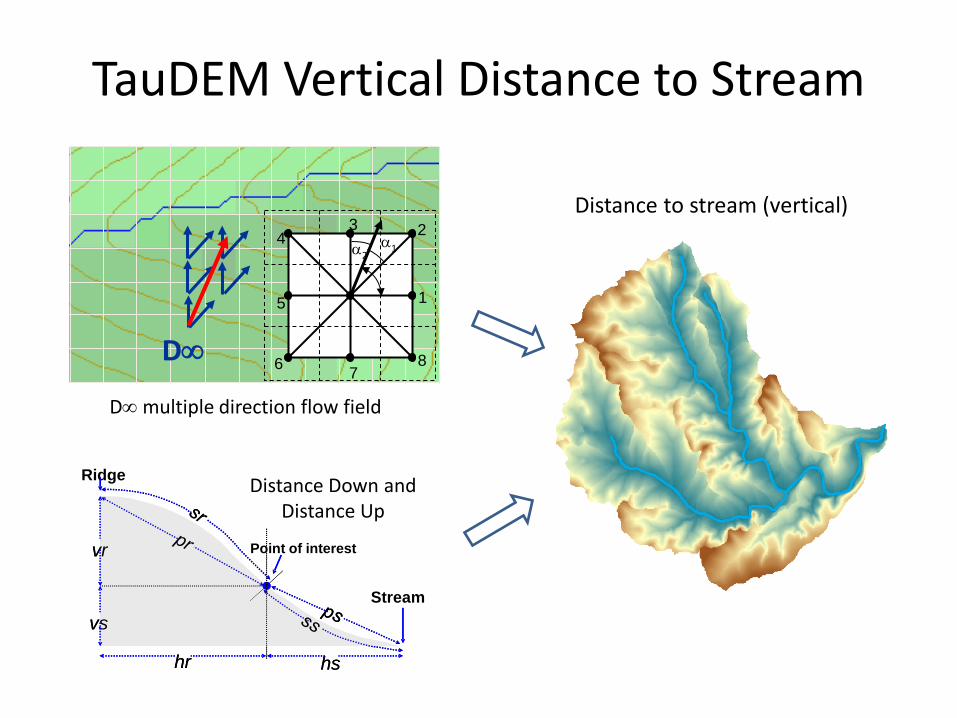
TauDEM Vertical Distance to Stream
Distance to stream (vertical)
hs hr
vr
vs
Point of interest
Ridge
hs hr
vr
vs Stream
Distance Down and Distance Up
D∞
α1 α2
1
2 3 4
5
6 7 8
D∞ multiple direction flow field
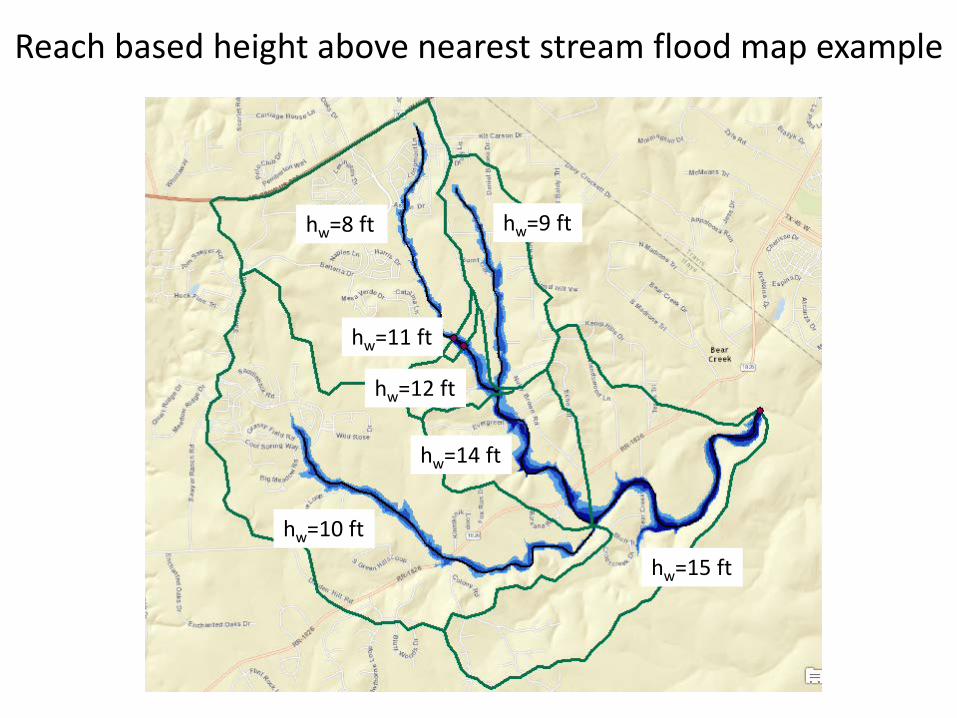
hw=8 ft hw=9 ft
hw=11 ft
hw=12 ft
hw=14 ft
hw=10 ft
hw=15 ft
Reach based height above nearest stream flood map example
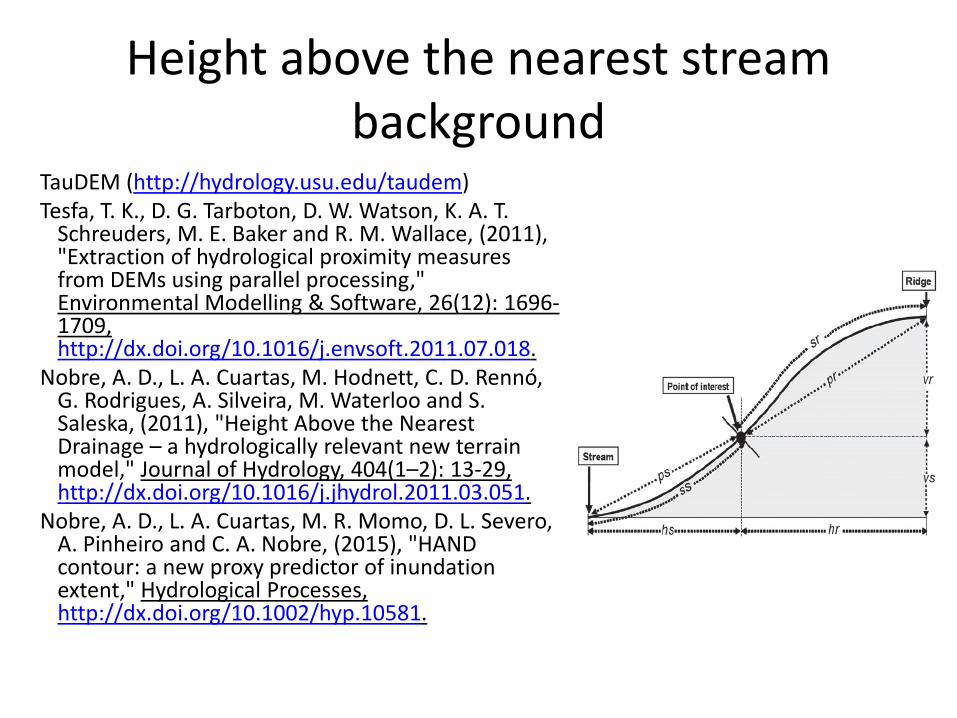
Height above the nearest stream background
TauDEM (http://hydrology.usu.edu/taudem) Tesfa, T. K., D. G. Tarboton, D. W. Watson, K. A. T.
Schreuders, M. E. Baker and R. M. Wallace, (2011), "Extraction of hydrological proximity measures from DEMs using parallel processing," Environmental Modelling & Software, 26(12): 1696-1709, http://dx.doi.org/10.1016/j.envsoft.2011.07.018.
Nobre, A. D., L. A. Cuartas, M. Hodnett, C. D. Rennó, G. Rodrigues, A. Silveira, M. Waterloo and S. Saleska, (2011), "Height Above the Nearest Drainage – a hydrologically relevant new terrain model," Journal of Hydrology, 404(1–2): 13-29, http://dx.doi.org/10.1016/j.jhydrol.2011.03.051.
Nobre, A. D., L. A. Cuartas, M. R. Momo, D. L. Severo, A. Pinheiro and C. A. Nobre, (2015), "HAND contour: a new proxy predictor of inundation extent," Hydrological Processes, http://dx.doi.org/10.1002/hyp.10581.
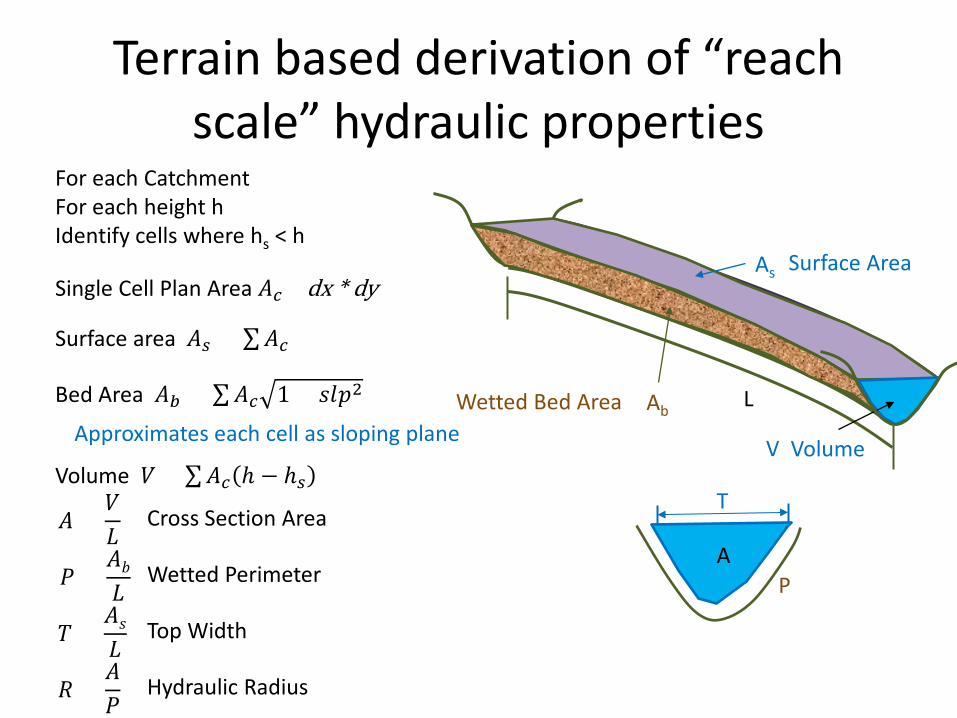
Terrain based derivation of “reach scale” hydraulic properties
For each Catchment For each height h Identify cells where hs < h
Bed Area 𝐴𝑏 = ∑𝐴𝑐 1 + 𝑠𝑠𝑝2
Surface area 𝐴𝑠 = ∑𝐴𝑐
Single Cell Plan Area 𝐴𝑐 =dx * dy
Volume 𝑉 = ∑𝐴𝑐 ℎ − ℎ𝑠 T
P A
𝐴 =𝑉𝐿 Cross Section Area
𝑃 =𝐴𝑏𝐿 Wetted Perimeter
𝑇 =𝐴𝑠𝐿 Top Width
Wetted Bed Area L
As
Ab
V
Surface Area
Volume
𝑅 =𝐴𝑃 Hydraulic Radius
Approximates each cell as sloping plane
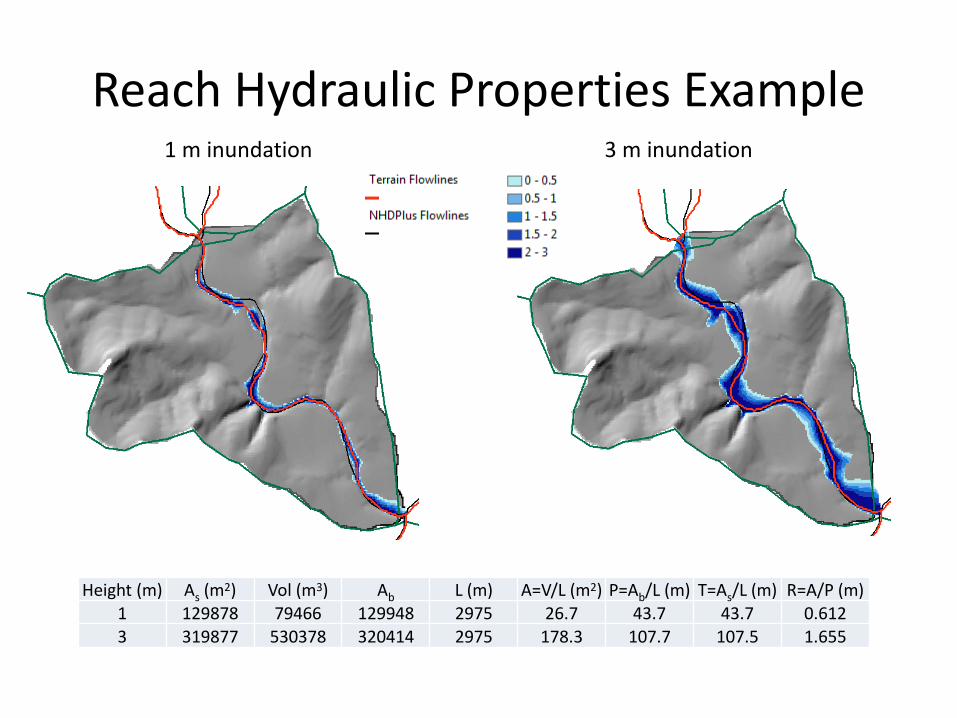
Reach Hydraulic Properties Example 1 m inundation 3 m inundation
Height (m) As (m2) Vol (m3) Ab L (m) A=V/L (m2) P=Ab/L (m) T=As/L (m) R=A/P (m) 1 129878 79466 129948 2975 26.7 43.7 43.7 0.612 3 319877 530378 320414 2975 178.3 107.7 107.5 1.655
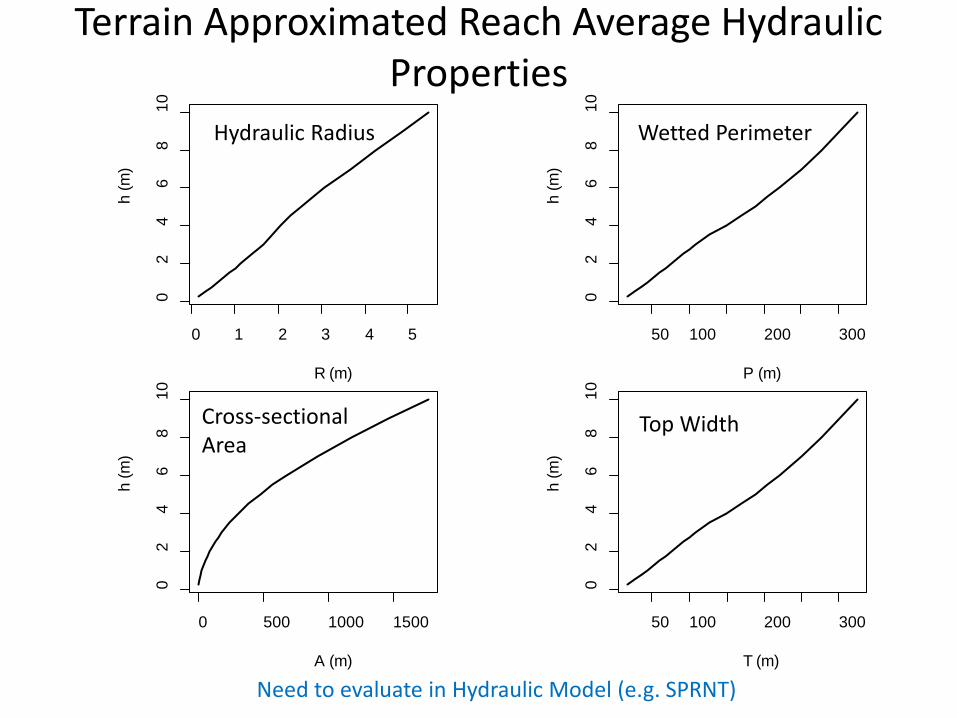
Terrain Approximated Reach Average Hydraulic Properties
0 1 2 3 4 5
02
46
810
R (m)
h (m
)
50 100 200 300
02
46
810
T (m)
h (m
)
50 100 200 300
02
46
810
P (m)
h (m
)
0 500 1000 1500
02
46
810
A (m)
h (m
)
Need to evaluate in Hydraulic Model (e.g. SPRNT)
Hydraulic Radius Wetted Perimeter
Cross-sectional Area
Top Width
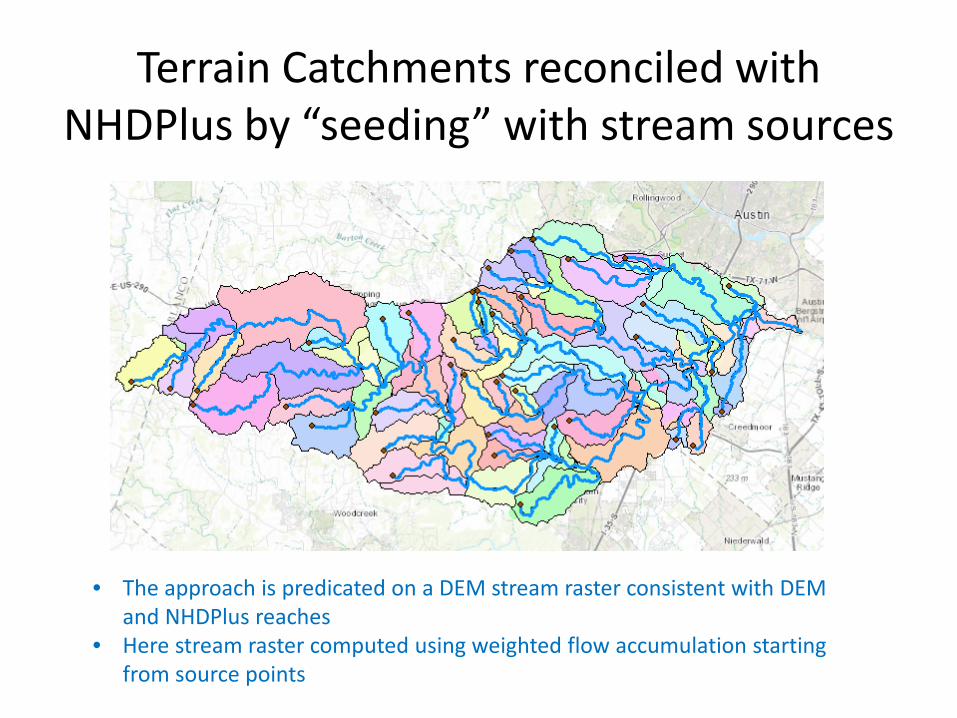
Terrain Catchments reconciled with NHDPlus by “seeding” with stream sources
• The approach is predicated on a DEM stream raster consistent with DEM and NHDPlus reaches
• Here stream raster computed using weighted flow accumulation starting from source points
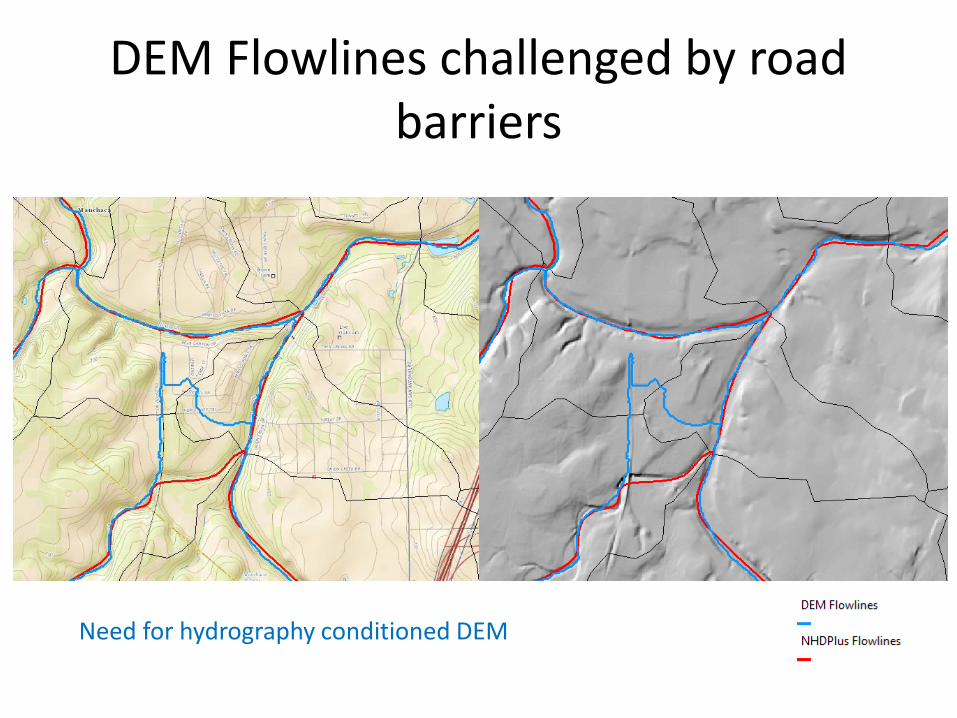
DEM Flowlines challenged by road barriers
Need for hydrography conditioned DEM
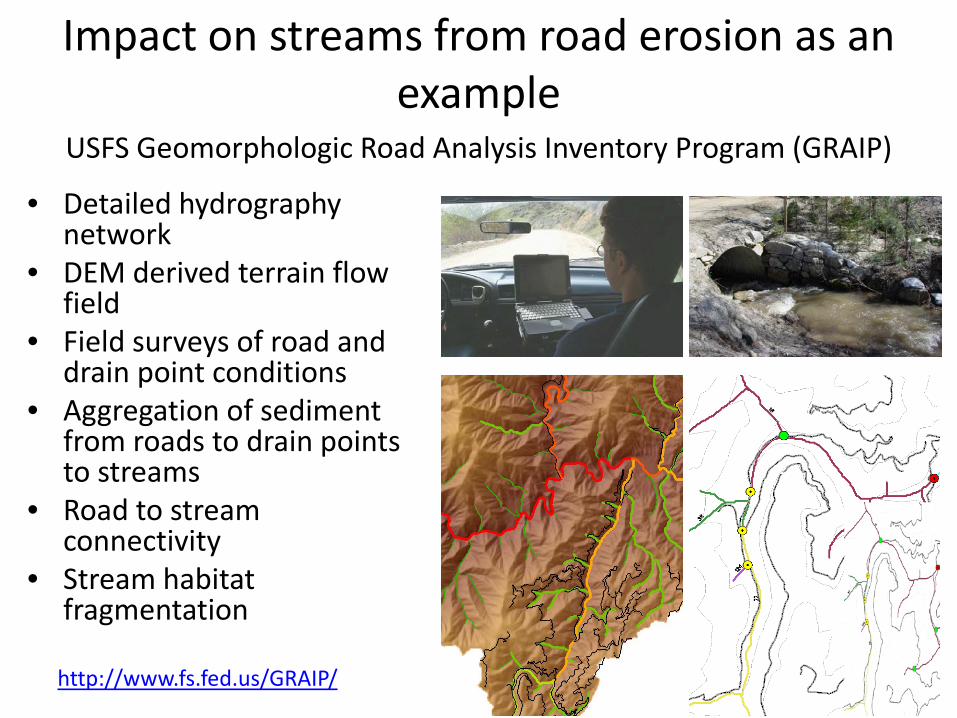
Impact on streams from road erosion as an example
• Detailed hydrography network
• DEM derived terrain flow field
• Field surveys of road and drain point conditions
• Aggregation of sediment from roads to drain points to streams
• Road to stream connectivity
• Stream habitat fragmentation
http://www.fs.fed.us/GRAIP/
USFS Geomorphologic Road Analysis Inventory Program (GRAIP)
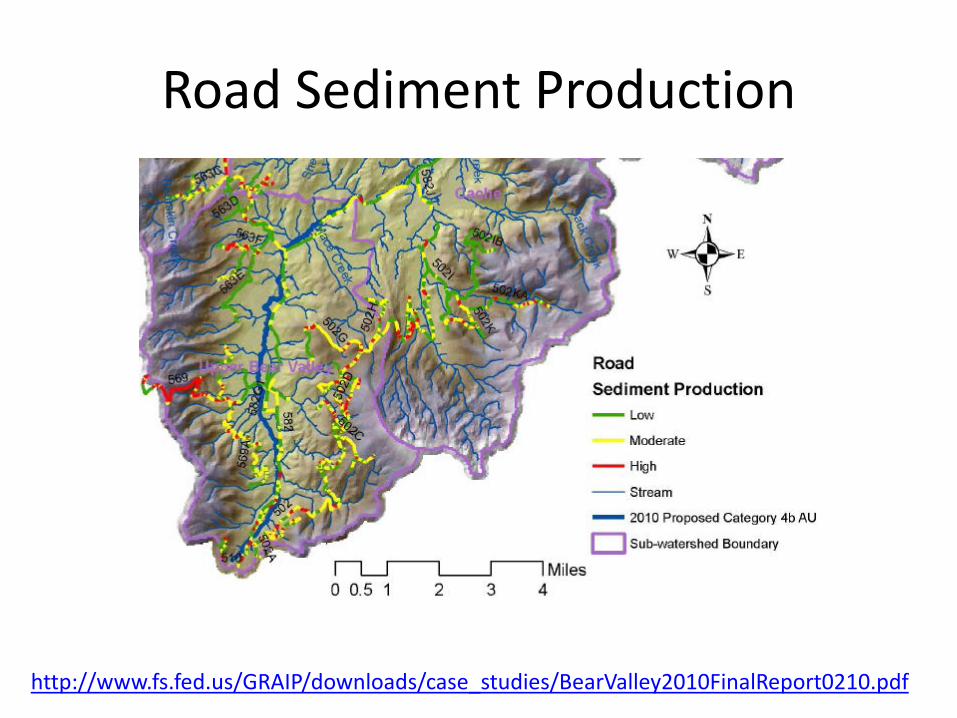
Road Sediment Production
http://www.fs.fed.us/GRAIP/downloads/case_studies/BearValley2010FinalReport0210.pdf
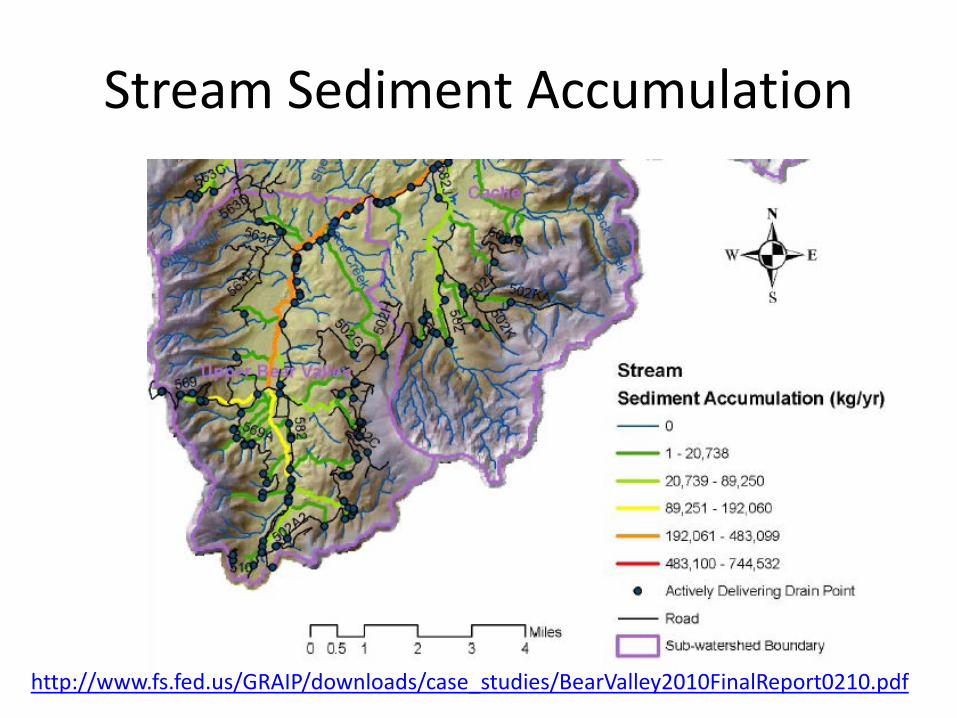
Stream Sediment Accumulation
http://www.fs.fed.us/GRAIP/downloads/case_studies/BearValley2010FinalReport0210.pdf
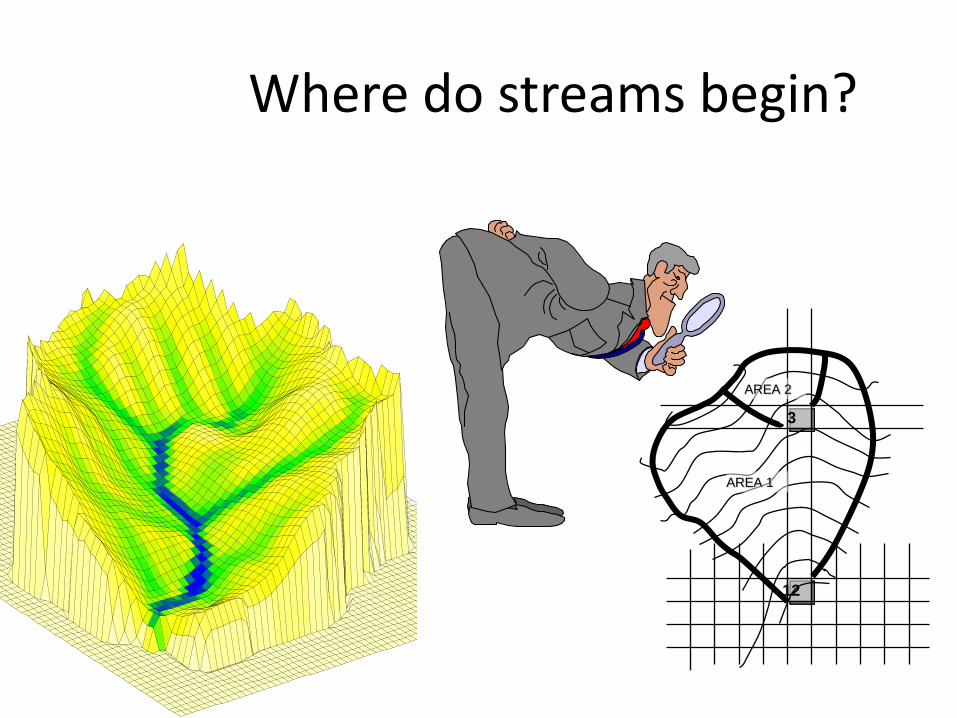
Where do streams begin?
AREA 1
AREA 2
3
12
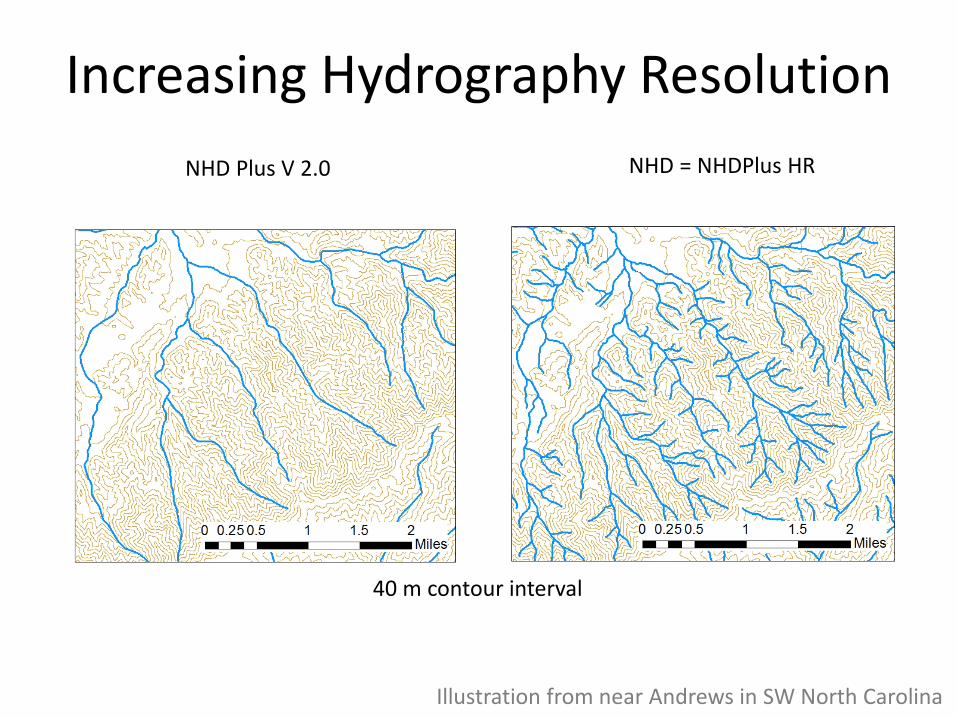
Increasing Hydrography Resolution NHD Plus V 2.0 NHD = NHDPlus HR
40 m contour interval
Illustration from near Andrews in SW North Carolina
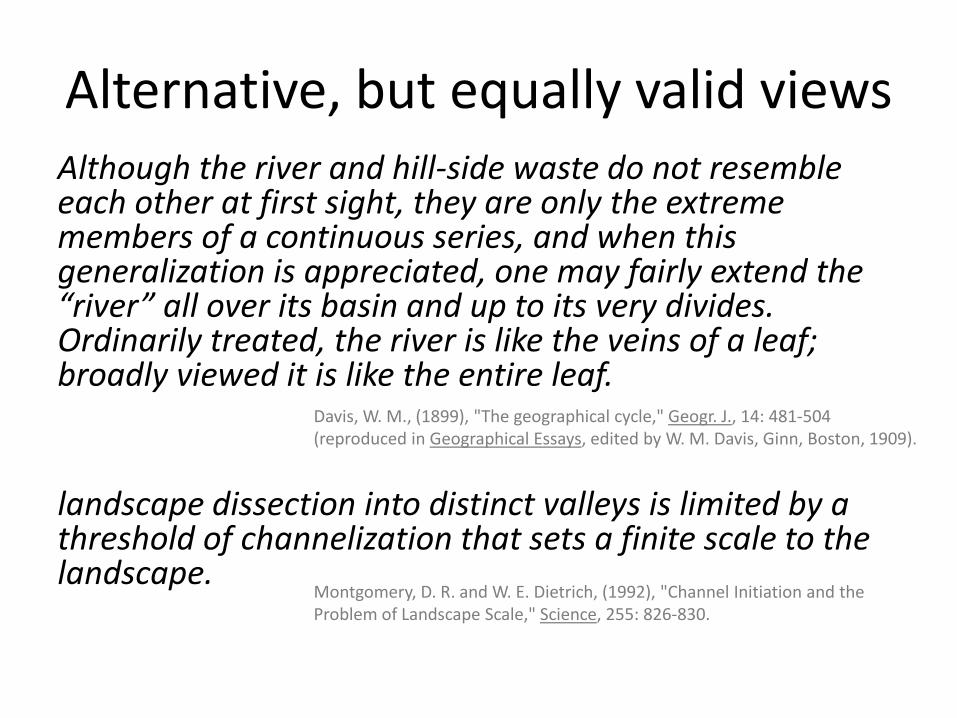
Alternative, but equally valid views Although the river and hill-side waste do not resemble each other at first sight, they are only the extreme members of a continuous series, and when this generalization is appreciated, one may fairly extend the “river” all over its basin and up to its very divides. Ordinarily treated, the river is like the veins of a leaf; broadly viewed it is like the entire leaf. landscape dissection into distinct valleys is limited by a threshold of channelization that sets a finite scale to the landscape.
Davis, W. M., (1899), "The geographical cycle," Geogr. J., 14: 481-504 (reproduced in Geographical Essays, edited by W. M. Davis, Ginn, Boston, 1909).
Montgomery, D. R. and W. E. Dietrich, (1992), "Channel Initiation and the Problem of Landscape Scale," Science, 255: 826-830.
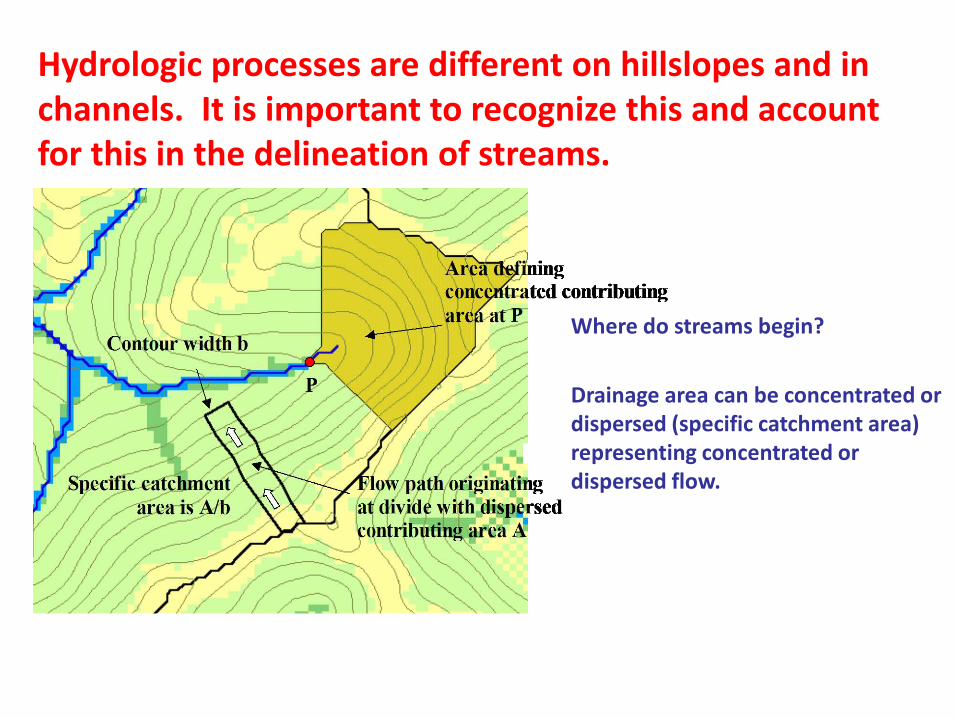
Hydrologic processes are different on hillslopes and in channels. It is important to recognize this and account for this in the delineation of streams.
Where do streams begin? Drainage area can be concentrated or dispersed (specific catchment area) representing concentrated or dispersed flow.
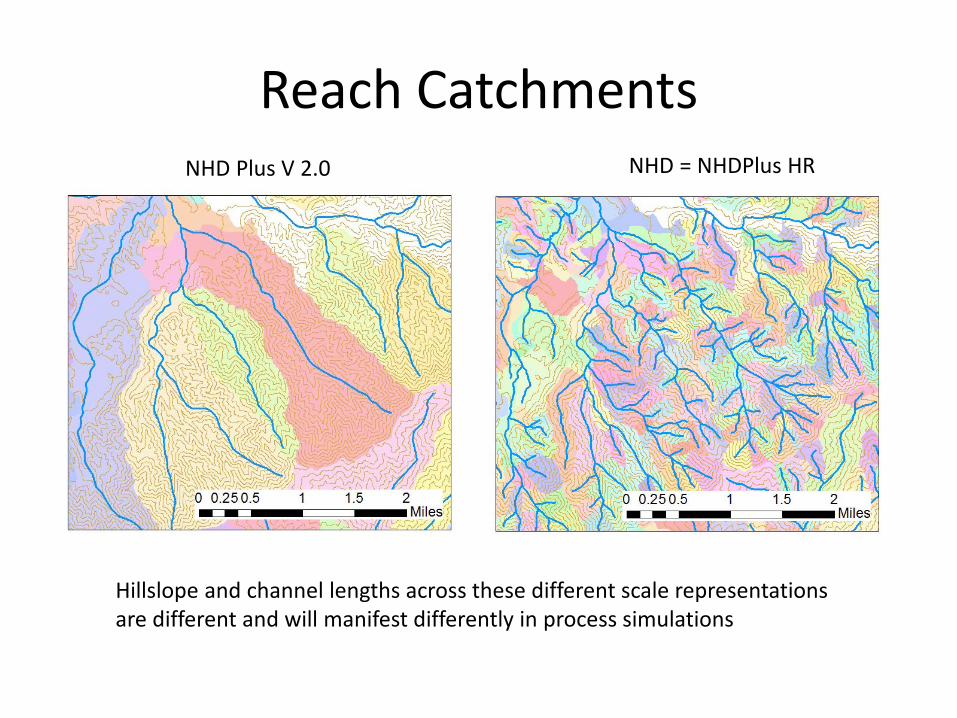
Reach Catchments NHD Plus V 2.0 NHD = NHDPlus HR
Hillslope and channel lengths across these different scale representations are different and will manifest differently in process simulations
Conclusions • Elevation and Hydrography should just be viewed
as parts of an integrated representation for the terrestrial environment
• Integrated use demands consistency between elevation and hydrography information at high resolution
• The height above nearest stream approach suggested as way to rapidly approximate real time flood inundation and approximate reach scale hydraulic properties
• Model representations must recognize scale effects