Embed Size (px)
Citation preview

The Decline of Men Working: Why It Is Happening, What It Means, and What
to Do About ItJason FurmanSenior Fellow, PIIE
Peterson Institute for International Economics | 1750 Massachusetts Ave., NW | Washington, DC 20036
University of California, San DiegoSan Diego, CA
May 2, 2017
Outline of the Talk
I. Labor Market Context
II. Facts About Prime-age Men
III.Explanationsa) Supplyb) Demandc) Institutions
IV.Policy Response
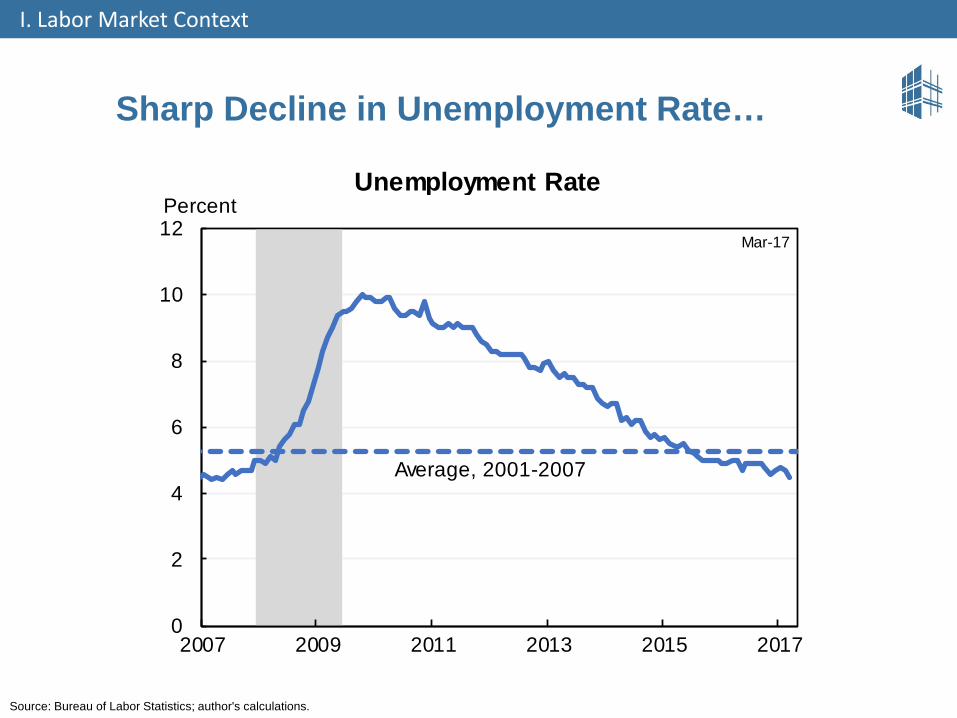
Sharp Decline in Unemployment Rate…
I. Labor Market Context
Source: Bureau of Labor Statistics; author's calculations.
Average, 2001-2007
0
2
4
6
8
10
12
2007 2009 2011 2013 2015 2017
Unemployment RatePercent
Mar-17
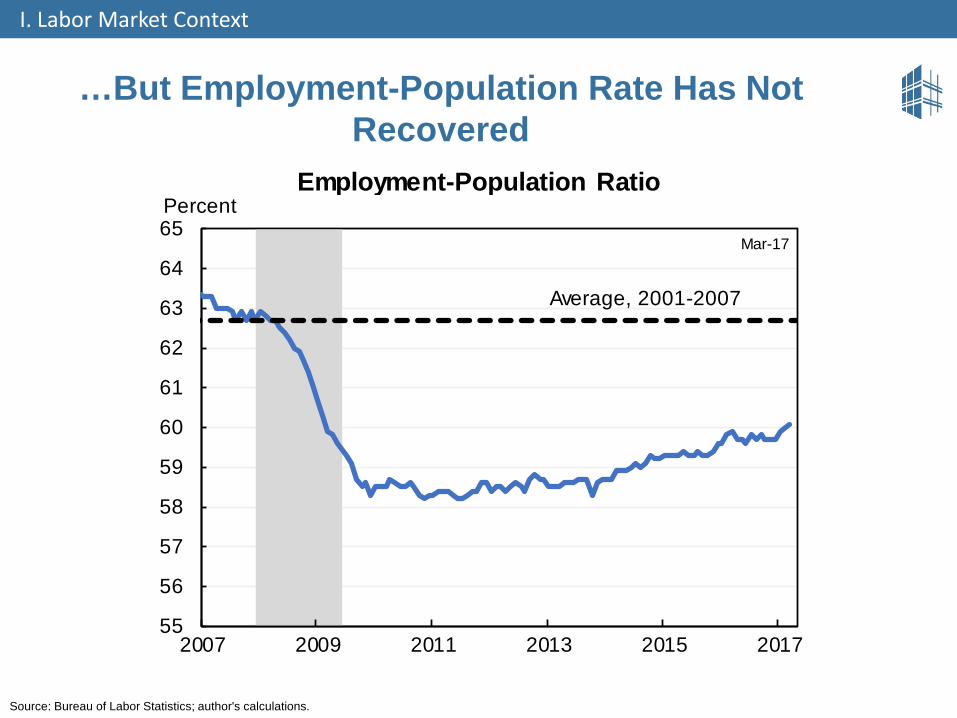
…But Employment-Population Rate Has Not Recovered
I. Labor Market Context
Source: Bureau of Labor Statistics; author's calculations.
Average, 2001-2007
55
56
57
58
59
60
61
62
63
64
65
2007 2009 2011 2013 2015 2017
Employment-Population RatioPercent
Mar-17
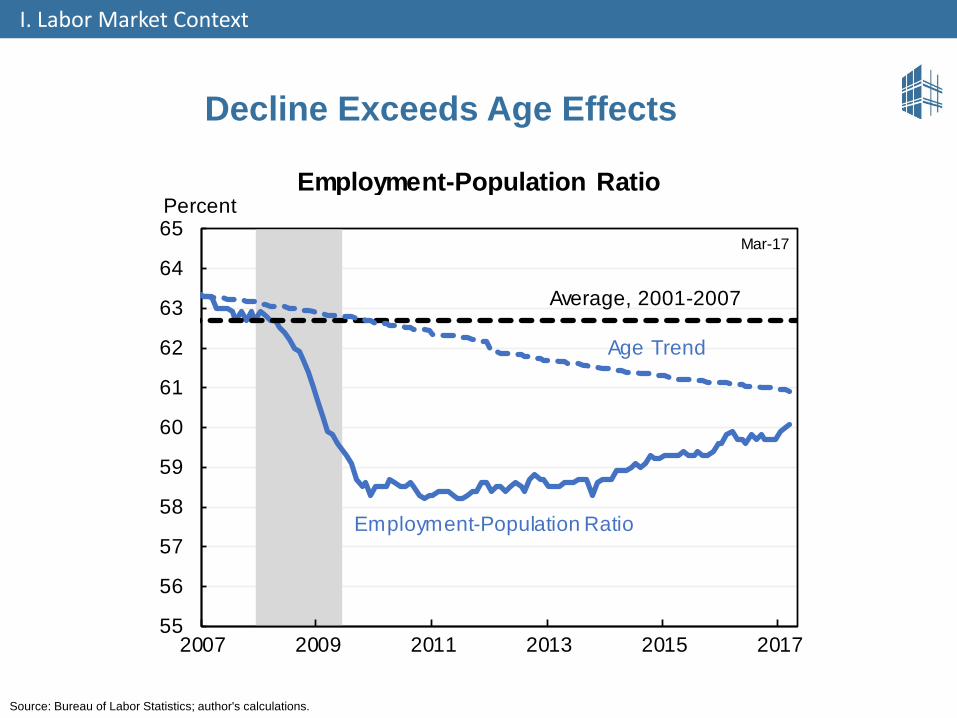
Decline Exceeds Age Effects
I. Labor Market Context
Source: Bureau of Labor Statistics; author's calculations.
Average, 2001-2007
55
56
57
58
59
60
61
62
63
64
65
2007 2009 2011 2013 2015 2017
Employment-Population RatioPercent
Mar-17
Age Trend
Employment-Population Ratio
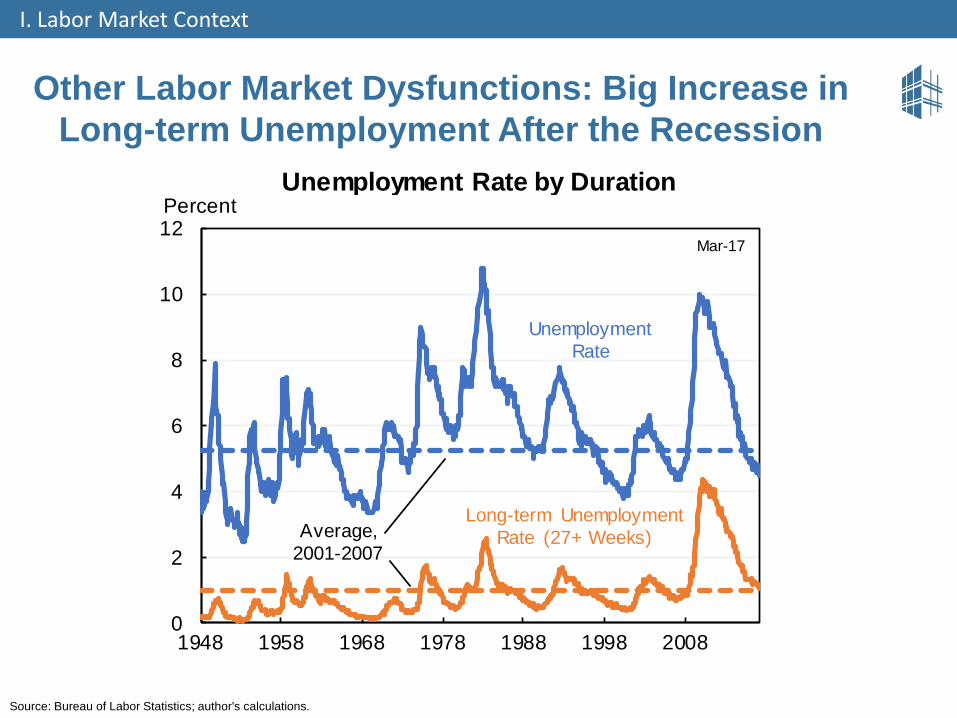
Other Labor Market Dysfunctions: Big Increase in Long-term Unemployment After the Recession
I. Labor Market Context
Source: Bureau of Labor Statistics; author's calculations.
Unemployment Rate
Long-term Unemployment Rate (27+ Weeks)Average,
2001-2007
Mar-17
0
2
4
6
8
10
12
1948 1958 1968 1978 1988 1998 2008
Unemployment Rate by DurationPercent
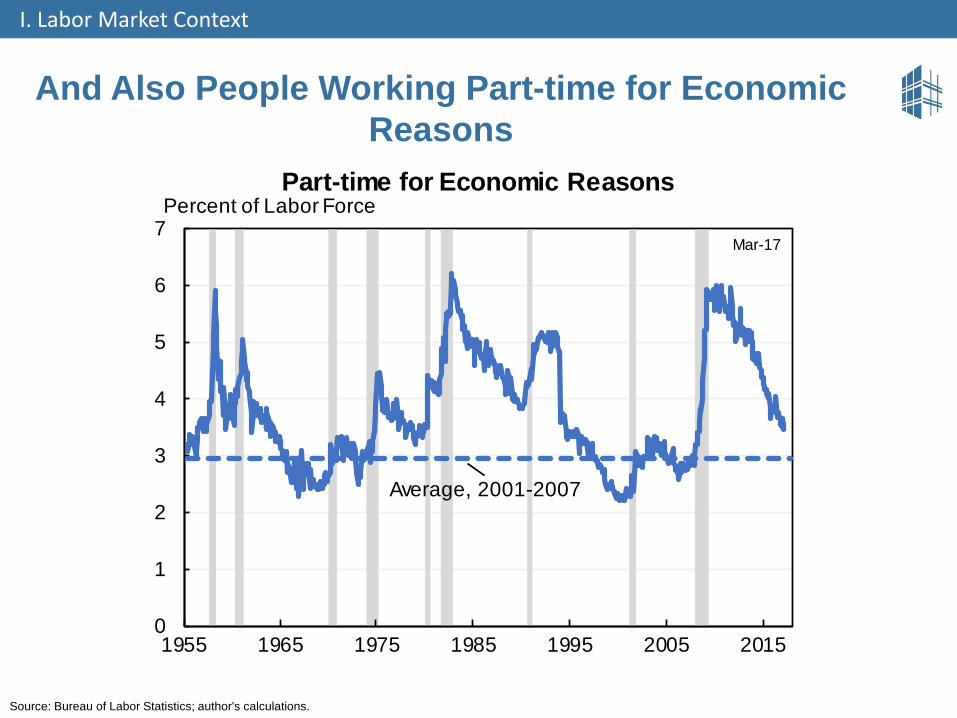
And Also People Working Part-time for Economic Reasons
I. Labor Market Context
Source: Bureau of Labor Statistics; author's calculations.
Average, 2001-2007
Mar-17
0
1
2
3
4
5
6
7
1955 1965 1975 1985 1995 2005 2015
Part-time for Economic ReasonsPercent of Labor Force
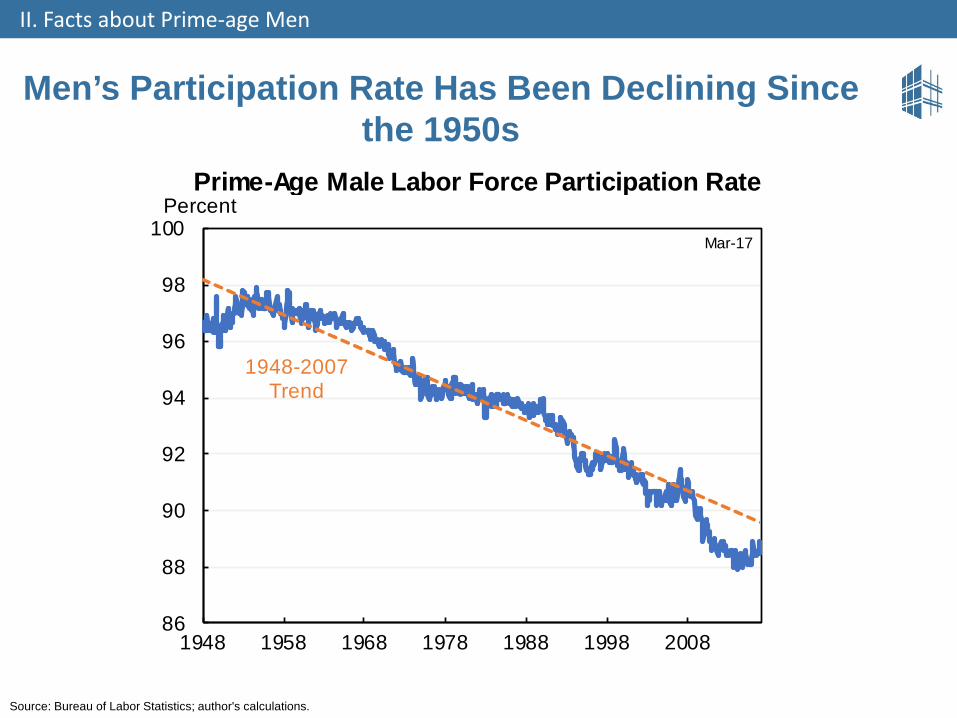
Men’s Participation Rate Has Been Declining Since the 1950s
II. Facts about Prime-age Men
Source: Bureau of Labor Statistics; author's calculations.
1948-2007 Trend
86
88
90
92
94
96
98
100
1948 1958 1968 1978 1988 1998 2008
Prime-Age Male Labor Force Participation RatePercent
Mar-17
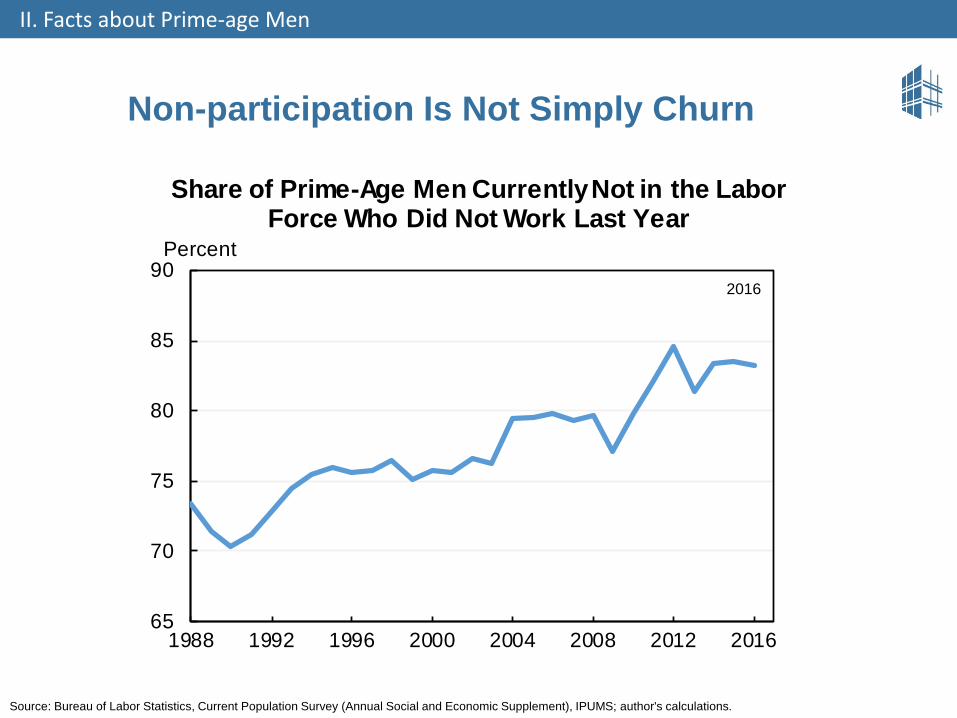
Non-participation Is Not Simply Churn
II. Facts about Prime-age Men
Source: Bureau of Labor Statistics, Current Population Survey (Annual Social and Economic Supplement), IPUMS; author's calculations.
2016
65
70
75
80
85
90
1988 1992 1996 2000 2004 2008 2012 2016
Share of Prime-Age Men Currently Not in the Labor Force Who Did Not Work Last Year
Percent
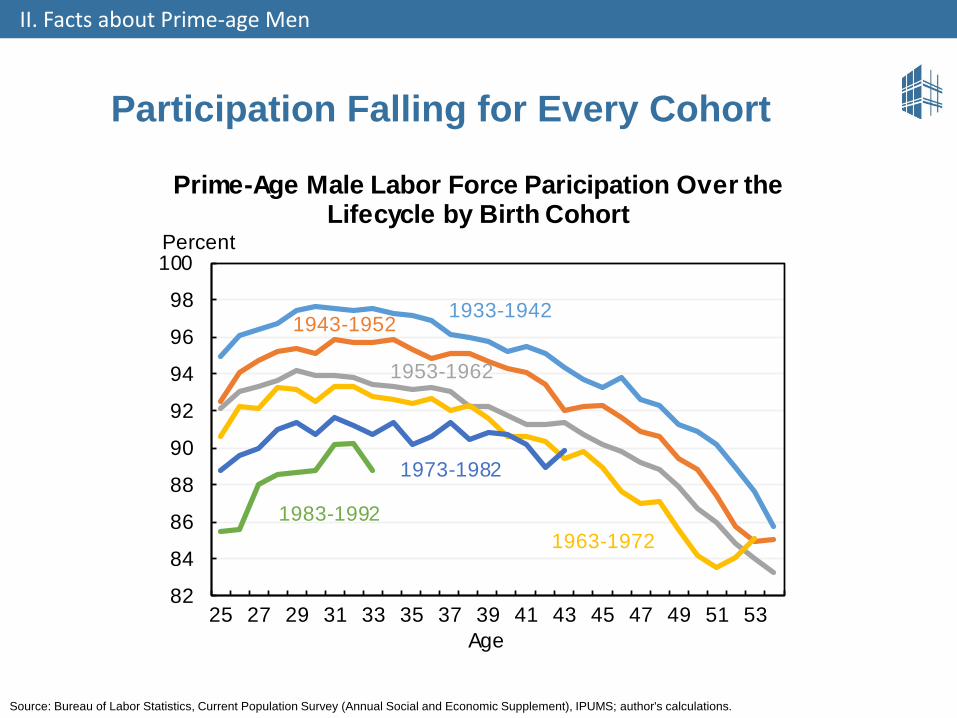
Participation Falling for Every Cohort
II. Facts about Prime-age Men
Source: Bureau of Labor Statistics, Current Population Survey (Annual Social and Economic Supplement), IPUMS; author's calculations.
1933-19421943-1952
1953-1962
1963-1972
82
84
86
88
90
92
94
96
98
100
25 27 29 31 33 35 37 39 41 43 45 47 49 51 53
Prime-Age Male Labor Force Paricipation Over the Lifecycle by Birth Cohort
Percent
1973-1982
1983-1992
Age
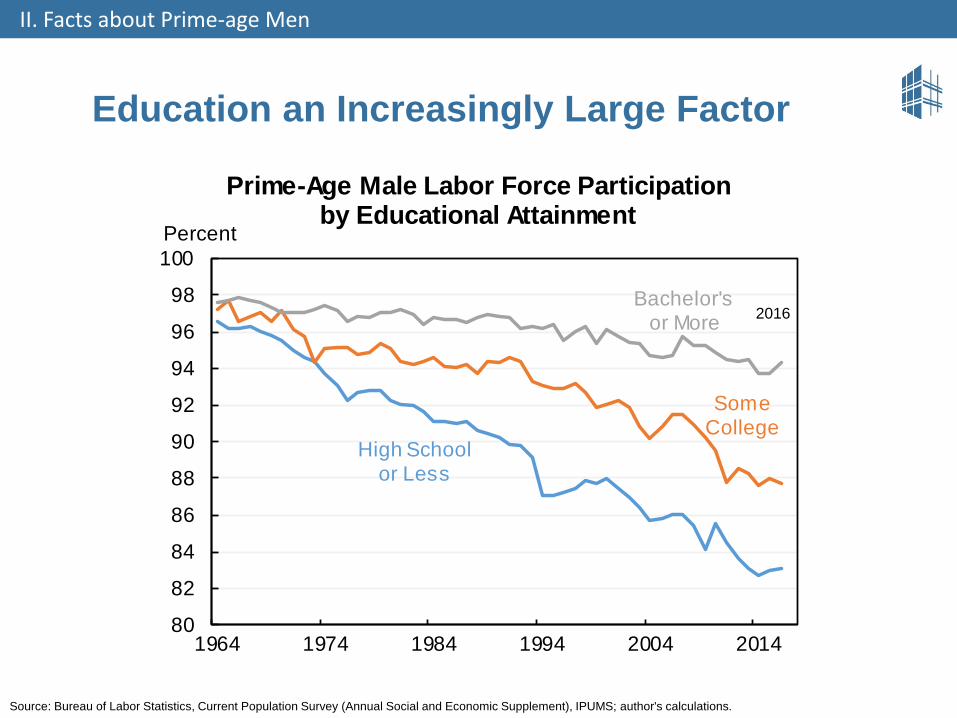
Education an Increasingly Large Factor
II. Facts about Prime-age Men
Source: Bureau of Labor Statistics, Current Population Survey (Annual Social and Economic Supplement), IPUMS; author's calculations.
High School or Less
Some College
Bachelor's or More 2016
80
82
84
86
88
90
92
94
96
98
100
1964 1974 1984 1994 2004 2014
Prime-Age Male Labor Force Participation by Educational Attainment
Percent
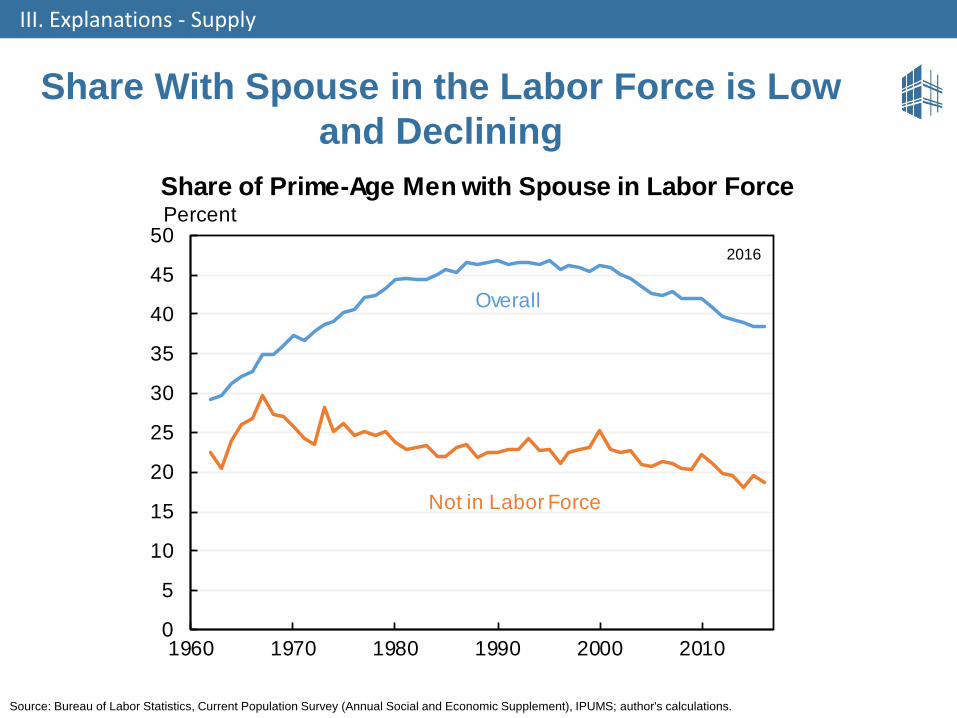
Share With Spouse in the Labor Force is Low and Declining
III. Explanations - Supply
Source: Bureau of Labor Statistics, Current Population Survey (Annual Social and Economic Supplement), IPUMS; author's calculations.
Overall
2016
Not in Labor Force
0
5
10
15
20
25
30
35
40
45
50
1960 1970 1980 1990 2000 2010
Share of Prime-Age Men with Spouse in Labor ForcePercent
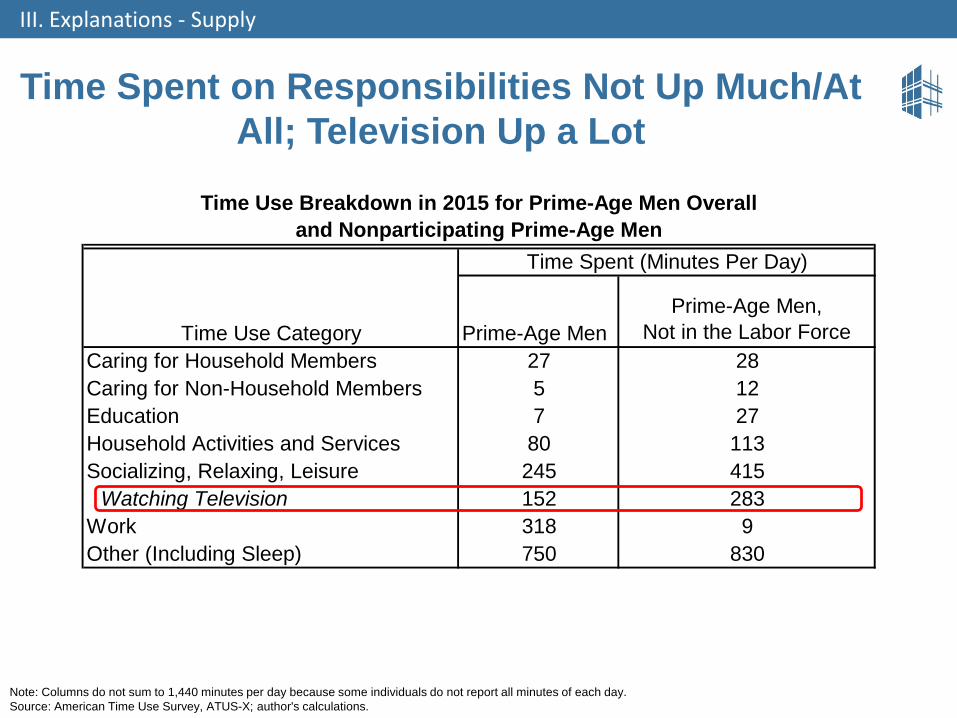
Time Spent on Responsibilities Not Up Much/At All; Television Up a Lot
III. Explanations - Supply
Note: Columns do not sum to 1,440 minutes per day because some individuals do not report all minutes of each day.Source: American Time Use Survey, ATUS-X; author's calculations.
Time Use Category Prime-Age MenPrime-Age Men,
Not in the Labor ForceCaring for Household Members 27 28Caring for Non-Household Members 5 12Education 7 27Household Activities and Services 80 113Socializing, Relaxing, Leisure 245 415
Watching Television 152 283Work 318 9Other (Including Sleep) 750 830
Time Spent (Minutes Per Day)
Time Use Breakdown in 2015 for Prime-Age Men Overall and Nonparticipating Prime-Age Men
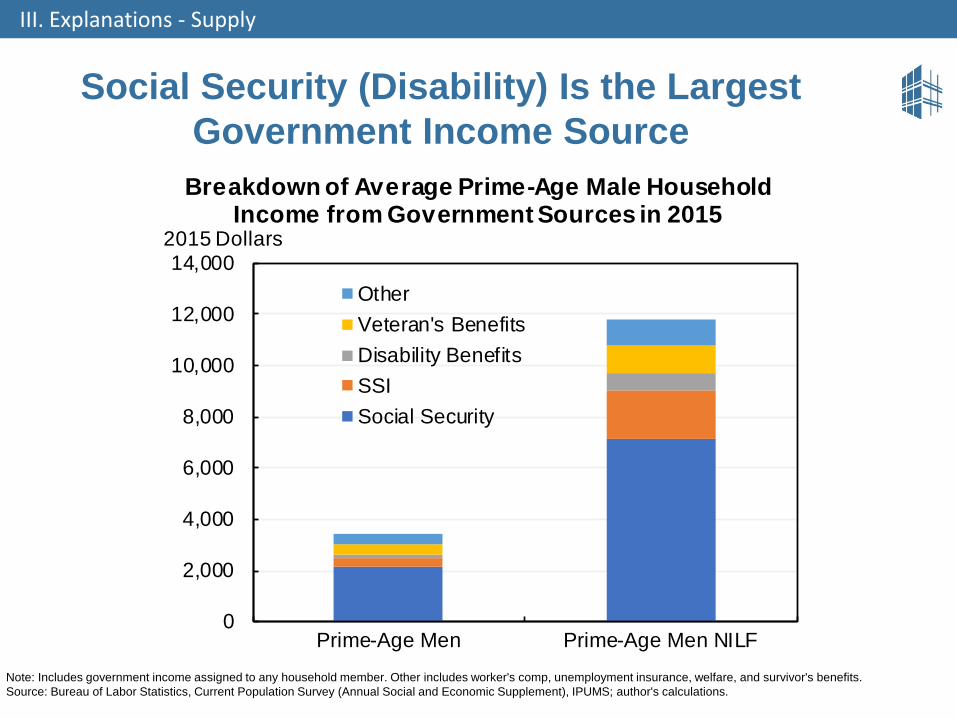
Social Security (Disability) Is the Largest Government Income Source
III. Explanations - Supply
Note: Includes government income assigned to any household member. Other includes worker's comp, unemployment insurance, welfare, and survivor's benefits.Source: Bureau of Labor Statistics, Current Population Survey (Annual Social and Economic Supplement), IPUMS; author's calculations.
0
2,000
4,000
6,000
8,000
10,000
12,000
14,000
Prime-Age Men Prime-Age Men NILF
OtherVeteran's BenefitsDisability BenefitsSSISocial Security
Breakdown of Average Prime-Age Male Household Income from Government Sources in 2015
2015 Dollars
Disability Cannot Explain the Majority of the Decline in Prime-age Male LFPR
III. Explanations - Supply
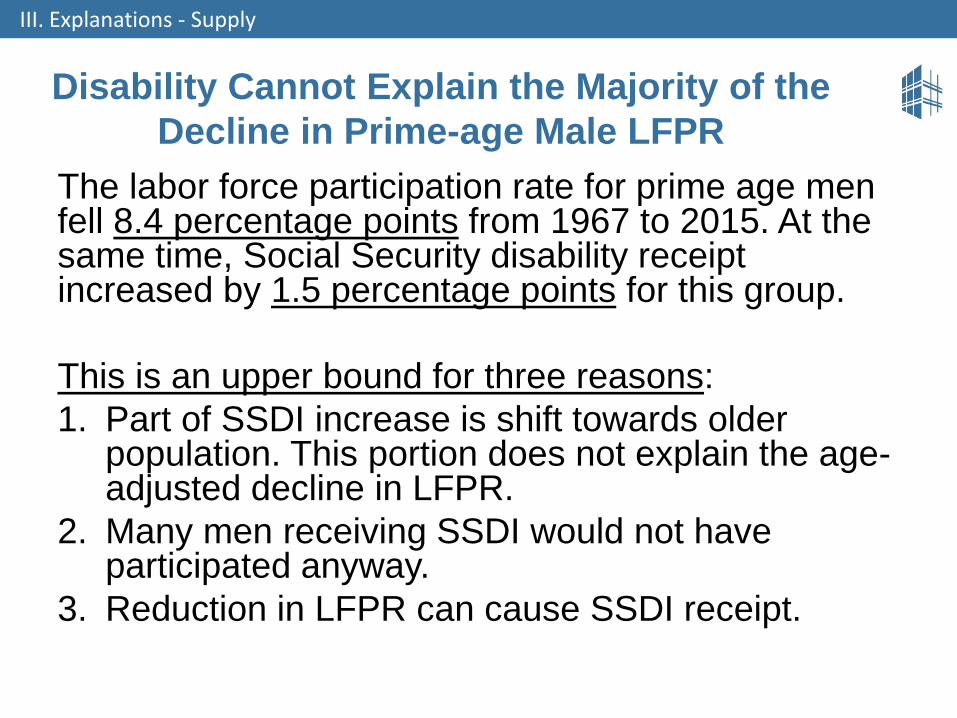
The labor force participation rate for prime age men fell 8.4 percentage points from 1967 to 2015. At the same time, Social Security disability receipt increased by 1.5 percentage points for this group.
This is an upper bound for three reasons:1. Part of SSDI increase is shift towards older
population. This portion does not explain the age-adjusted decline in LFPR.
2. Many men receiving SSDI would not have participated anyway.
3. Reduction in LFPR can cause SSDI receipt.
Plausible Estimates are SSDI Accounts for 0.1 to 0.4 p.p. Reduction in LFPR
III. Explanations - Supply
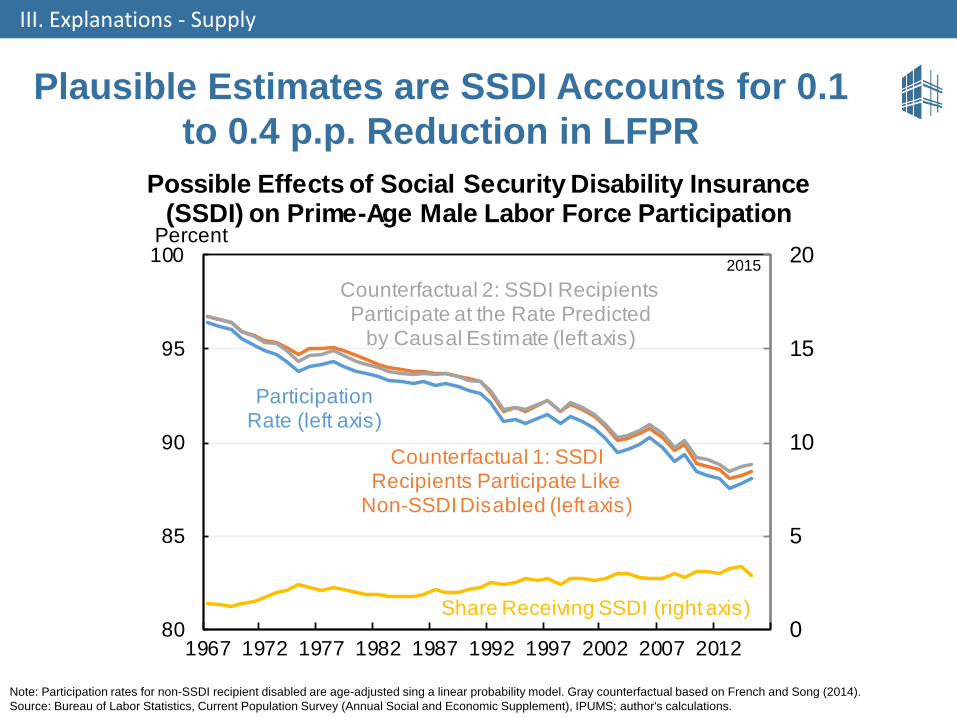
Note: Participation rates for non-SSDI recipient disabled are age-adjusted sing a linear probability model. Gray counterfactual based on French and Song (2014).Source: Bureau of Labor Statistics, Current Population Survey (Annual Social and Economic Supplement), IPUMS; author's calculations.
Participation Rate (left axis)
Counterfactual 1: SSDI Recipients Participate Like
Non-SSDI Disabled (left axis)
Counterfactual 2: SSDI Recipients Participate at the Rate Predicted
by Causal Estimate (left axis)
2015
Share Receiving SSDI (right axis)0
5
10
15
20
80
85
90
95
100
1967 1972 1977 1982 1987 1992 1997 2002 2007 2012
Possible Effects of Social Security Disability Insurance (SSDI) on Prime-Age Male Labor Force Participation
Percent
Other Government Cash Benefits Have Fallen
III. Explanations - Supply
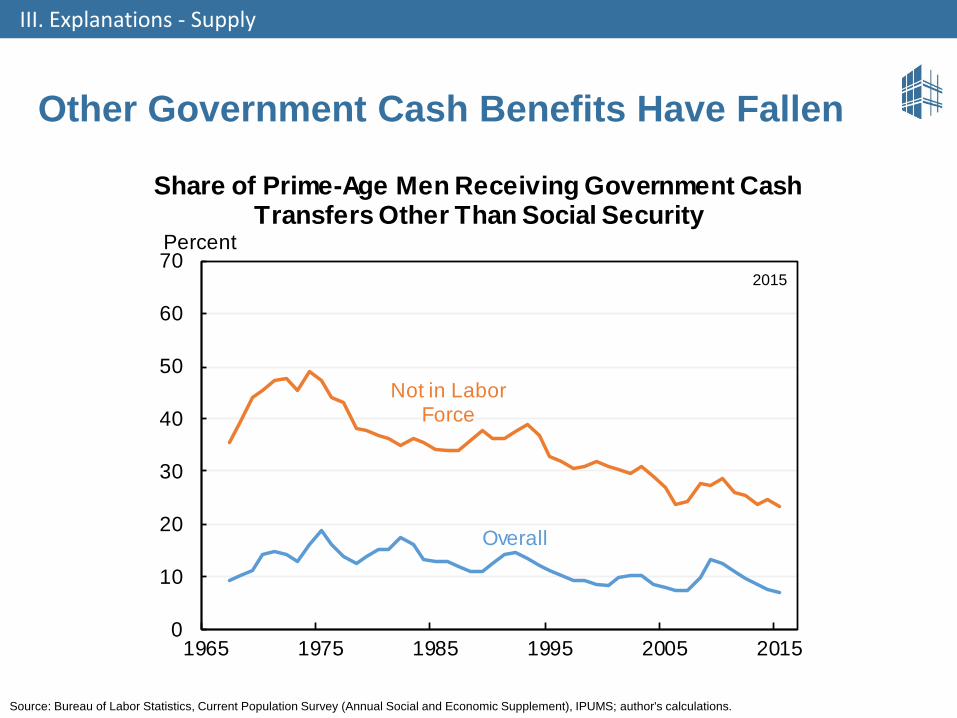
Source: Bureau of Labor Statistics, Current Population Survey (Annual Social and Economic Supplement), IPUMS; author's calculations.
Overall
Not in Labor Force
2015
0
10
20
30
40
50
60
70
1965 1975 1985 1995 2005 2015
Share of Prime-Age Men Receiving Government Cash Transfers Other Than Social Security
Percent
As a Result Overall Government Cash Benefit Incidence Has Fallen
III. Explanations - Supply
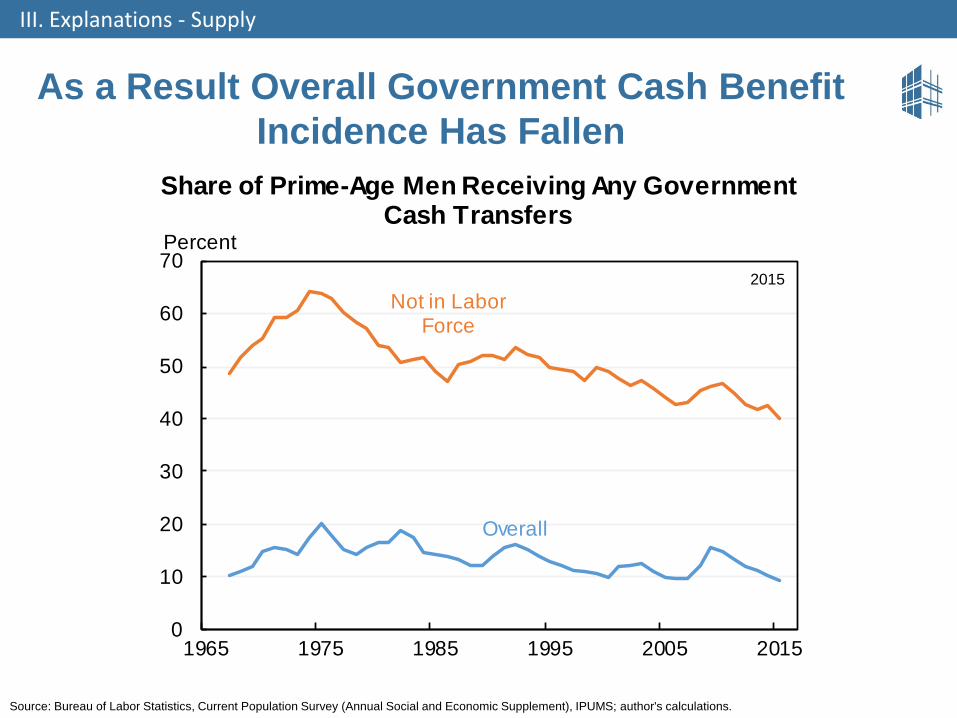
Source: Bureau of Labor Statistics, Current Population Survey (Annual Social and Economic Supplement), IPUMS; author's calculations.
Overall
Not in Labor Force
2015
0
10
20
30
40
50
60
70
1965 1975 1985 1995 2005 2015
Share of Prime-Age Men Receiving Any Government Cash Transfers
Percent
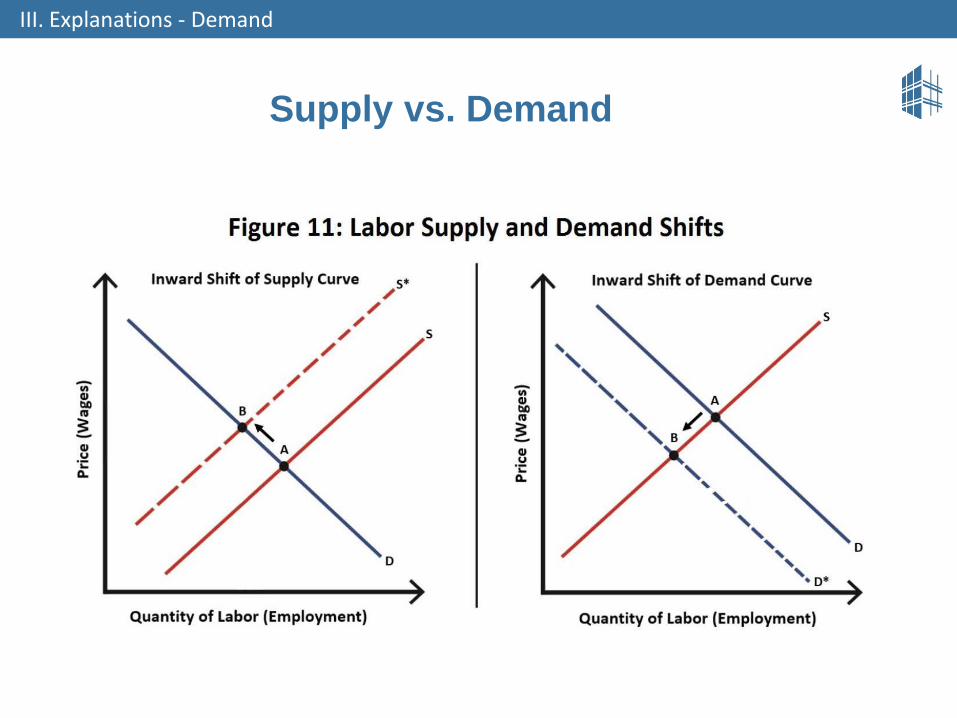
Supply vs. Demand
III. Explanations - Demand
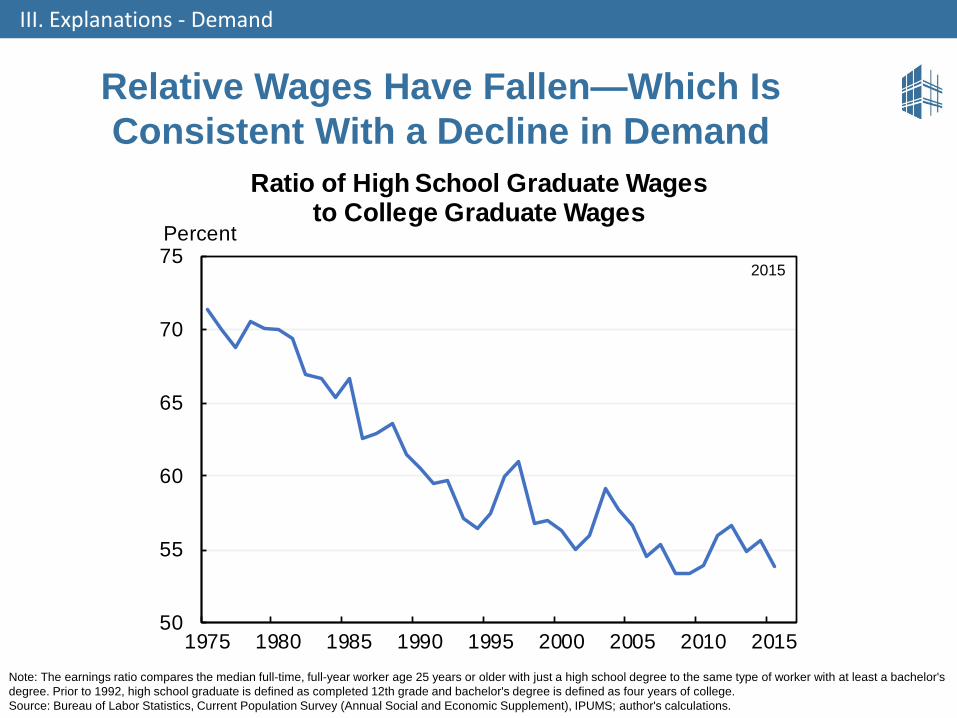
Relative Wages Have Fallen—Which Is Consistent With a Decline in Demand
III. Explanations - Demand
Note: The earnings ratio compares the median full-time, full-year worker age 25 years or older with just a high school degree to the same type of worker with at least a bachelor's degree. Prior to 1992, high school graduate is defined as completed 12th grade and bachelor's degree is defined as four years of college.Source: Bureau of Labor Statistics, Current Population Survey (Annual Social and Economic Supplement), IPUMS; author's calculations.
2015
50
55
60
65
70
75
1975 1980 1985 1990 1995 2000 2005 2010 2015
Ratio of High School Graduate Wages to College Graduate Wages
Percent
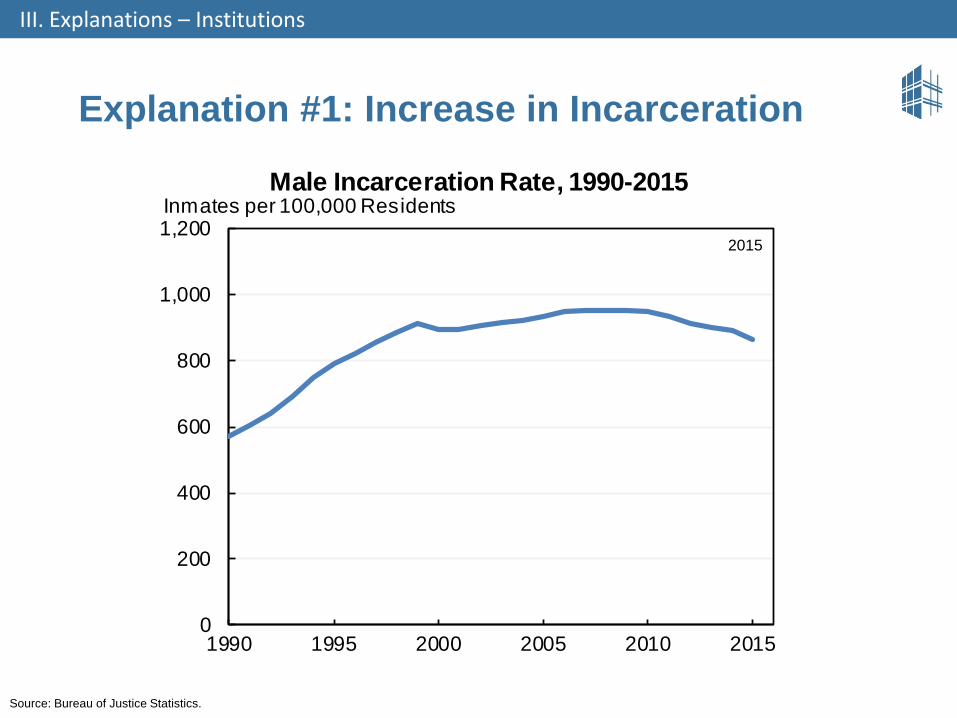
Explanation #1: Increase in Incarceration
III. Explanations – Institutions
Source: Bureau of Justice Statistics.
2015
0
200
400
600
800
1,000
1,200
1990 1995 2000 2005 2010 2015
Male Incarceration Rate, 1990-2015Inmates per 100,000 Residents
Effects of Incarceration on LFPR
III. Explanations – Institutions
Currently in prison: 1.1 million in Federal or State prison not in numerator or denominator. To the degree that people in prison would have participated at a lower rate, including them would lower the measured participation rate—but plausibly only by a few tenths of a percentage point.
Formerly in prison: ~5 million formerly incarcerated (~7% of prime age men). They appear to participate at a substantially lower rate, plausibly lowers prime-age male LFPR by ~1 p.p.
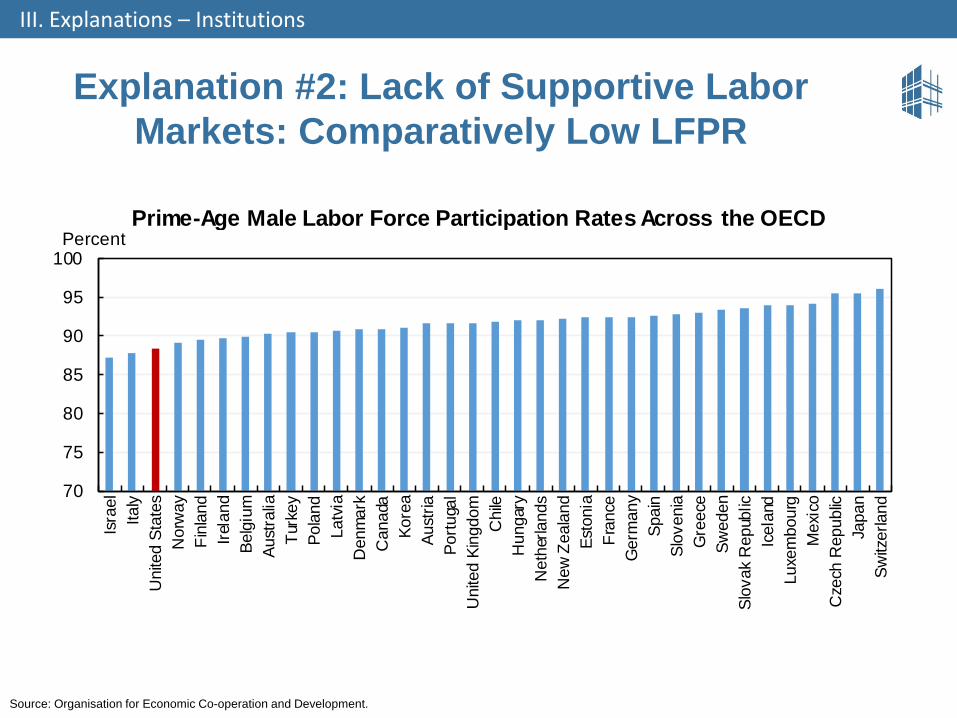
Explanation #2: Lack of Supportive Labor Markets: Comparatively Low LFPR
III. Explanations – Institutions
Source: Organisation for Economic Co-operation and Development.
70
75
80
85
90
95
100
Isra
elIta
lyU
nite
d St
ates
Nor
way
Finl
and
Irela
ndBe
lgiu
mAu
stra
liaTu
rkey
Pola
ndLa
tvia
Den
mar
kC
anad
aKo
rea
Aust
riaPo
rtuga
lU
nite
d Ki
ngdo
mC
hile
Hun
gary
Net
herla
nds
New
Zea
land
Esto
nia
Fran
ceG
erm
any
Spai
nSl
oven
iaG
reec
eSw
eden
Slov
ak R
epub
licIc
elan
dLu
xem
bour
gM
exic
oC
zech
Rep
ublic
Japa
nSw
itzer
land
Prime-Age Male Labor Force Participation Rates Across the OECDPercent
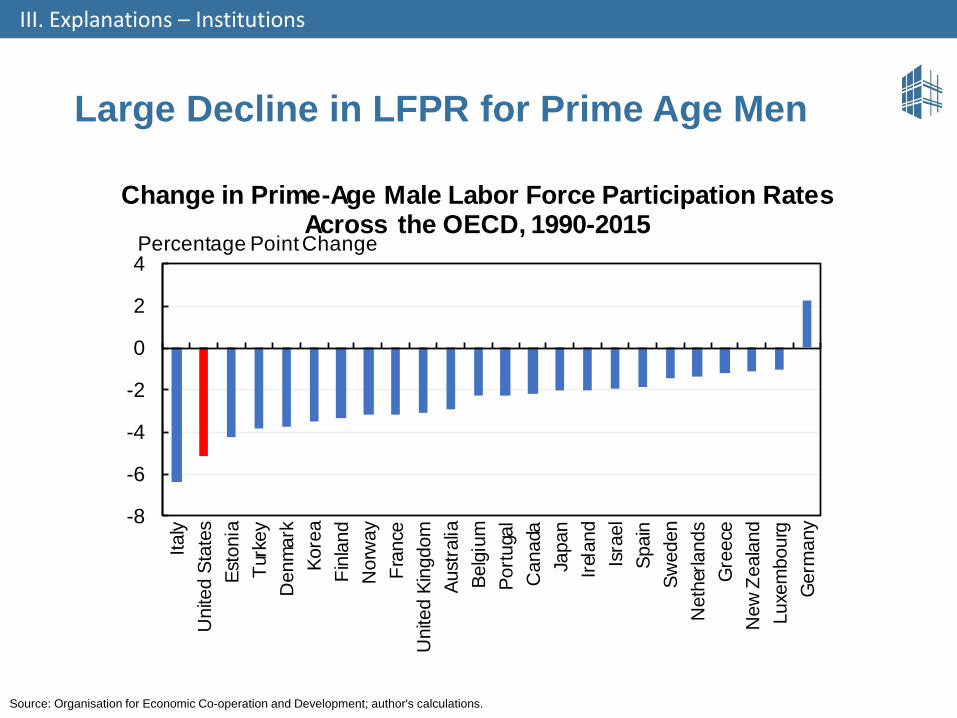
Large Decline in LFPR for Prime Age Men
III. Explanations – Institutions
Source: Organisation for Economic Co-operation and Development; author's calculations.
-8
-6
-4
-2
0
2
4
Italy
Uni
ted
Stat
esEs
toni
aTu
rkey
Den
mar
kKo
rea
Finl
and
Nor
way
Fran
ceU
nite
d Ki
ngdo
mAu
stra
liaBe
lgiu
mPo
rtuga
lC
anad
aJa
pan
Irela
ndIs
rael
Spai
nSw
eden
Net
herla
nds
Gre
ece
New
Zea
land
Luxe
mbo
urg
Ger
man
y
Change in Prime-Age Male Labor Force Participation RatesAcross the OECD, 1990-2015
Percentage Point Change
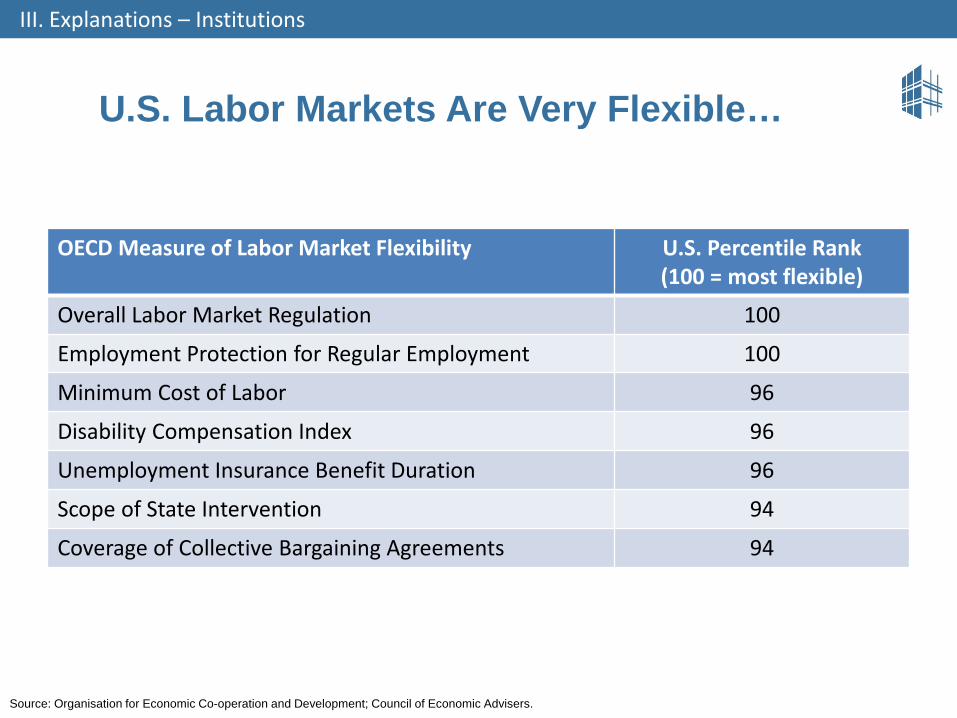
U.S. Labor Markets Are Very Flexible…
III. Explanations – Institutions
OECD Measure of Labor Market Flexibility U.S. Percentile Rank(100 = most flexible)
Overall Labor Market Regulation 100
Employment Protection for Regular Employment 100
Minimum Cost of Labor 96
Disability Compensation Index 96
Unemployment Insurance Benefit Duration 96
Scope of State Intervention 94
Coverage of Collective Bargaining Agreements 94
Source: Organisation for Economic Co-operation and Development; Council of Economic Advisers.
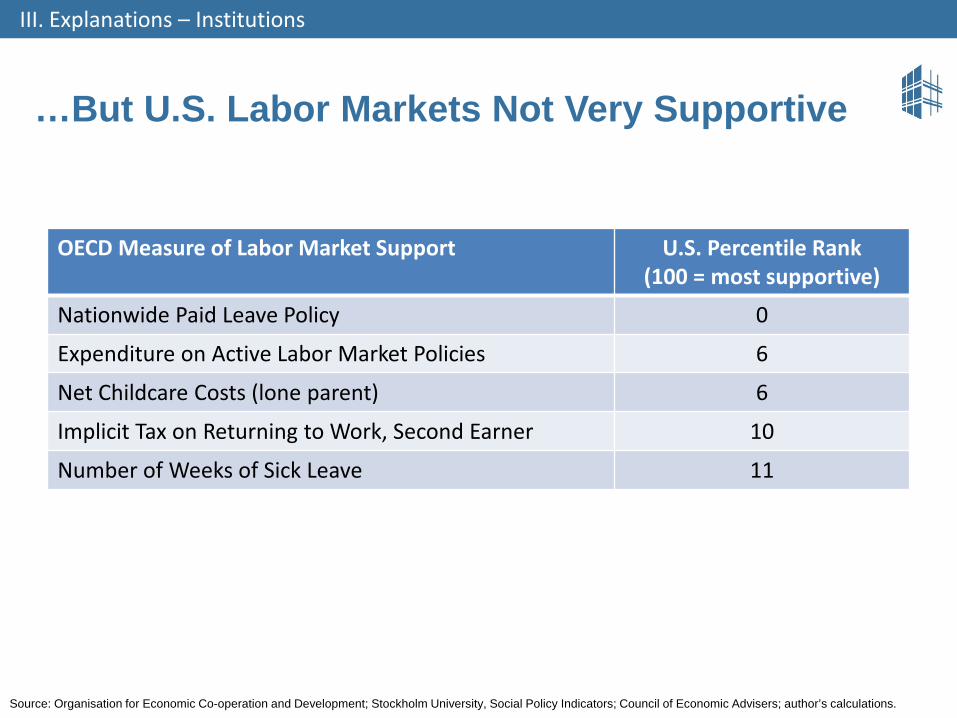
…But U.S. Labor Markets Not Very Supportive
III. Explanations – Institutions
OECD Measure of Labor Market Support U.S. Percentile Rank(100 = most supportive)
Nationwide Paid Leave Policy 0
Expenditure on Active Labor Market Policies 6
Net Childcare Costs (lone parent) 6
Implicit Tax on Returning to Work, Second Earner 10
Number of Weeks of Sick Leave 11
Source: Organisation for Economic Co-operation and Development; Stockholm University, Social Policy Indicators; Council of Economic Advisers; author’s calculations.
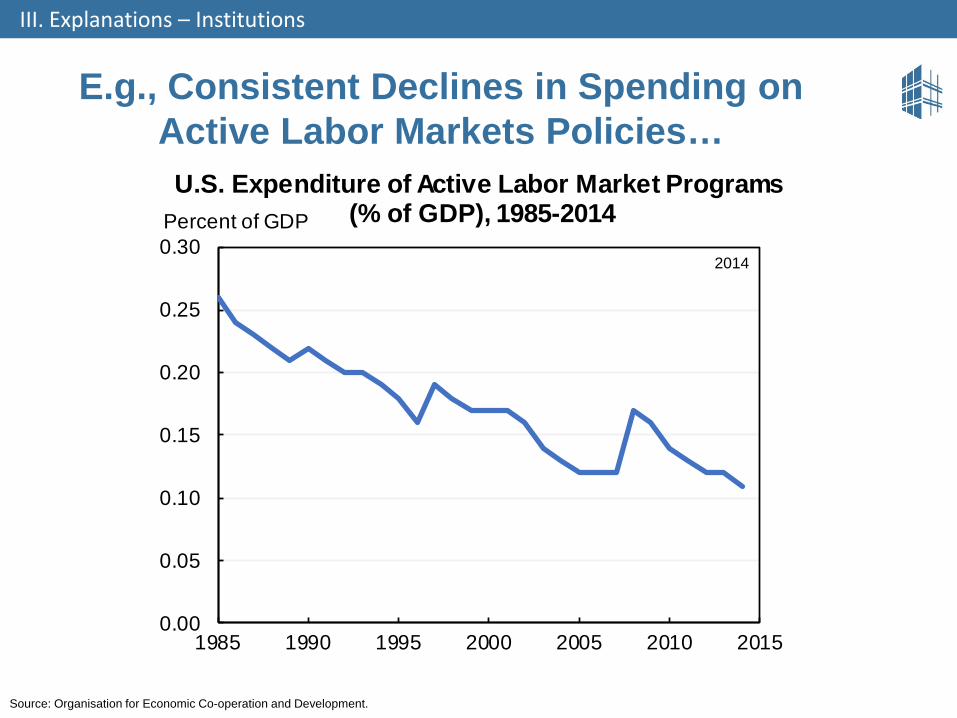
E.g., Consistent Declines in Spending on Active Labor Markets Policies…
III. Explanations – Institutions
Source: Organisation for Economic Co-operation and Development.
2014
0.00
0.05
0.10
0.15
0.20
0.25
0.30
1985 1990 1995 2000 2005 2010 2015
U.S. Expenditure of Active Labor Market Programs(% of GDP), 1985-2014Percent of GDP
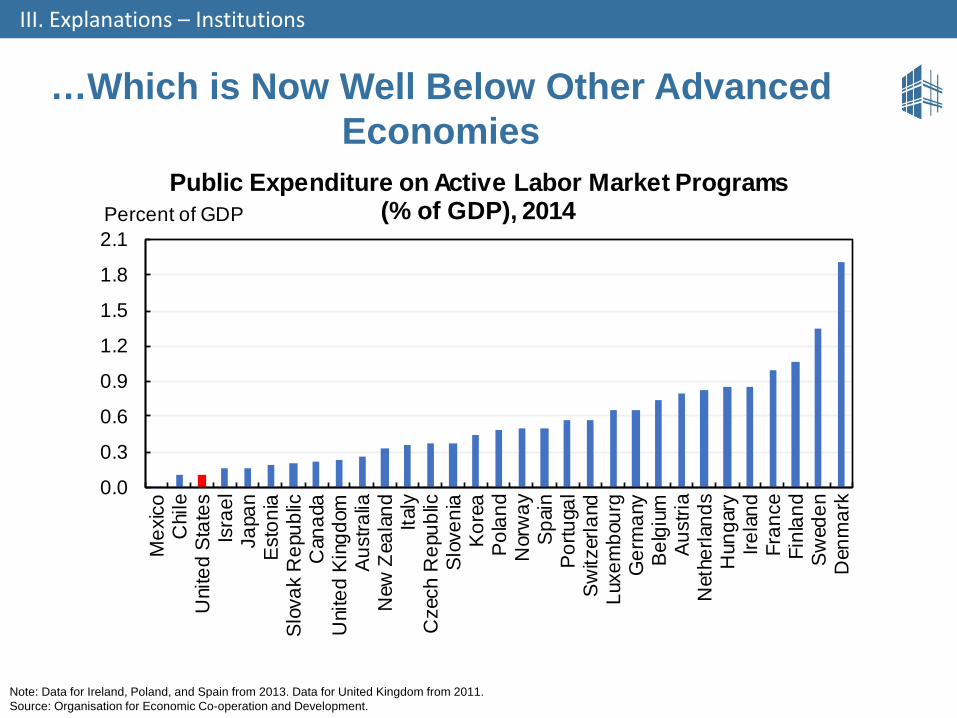
…Which is Now Well Below Other Advanced Economies
III. Explanations – Institutions
Note: Data for Ireland, Poland, and Spain from 2013. Data for United Kingdom from 2011. Source: Organisation for Economic Co-operation and Development.
0.0
0.3
0.6
0.9
1.2
1.5
1.8
2.1
Mex
icoC
hile
Uni
ted
Stat
esIs
rael
Japa
nEs
toni
aSl
ovak
Rep
ublic
Can
ada
Uni
ted
King
dom
Aust
ralia
New
Zea
land
Italy
Cze
ch R
epub
licSl
oven
iaKo
rea
Pola
ndN
orw
aySp
ain
Portu
gal
Switz
erla
ndLu
xem
bour
gG
erm
any
Belg
ium
Aust
riaN
ethe
rland
sH
unga
ryIre
land
Fran
ceFi
nlan
dSw
eden
Den
mar
k
Public Expenditure on Active Labor Market Programs (% of GDP), 2014Percent of GDP
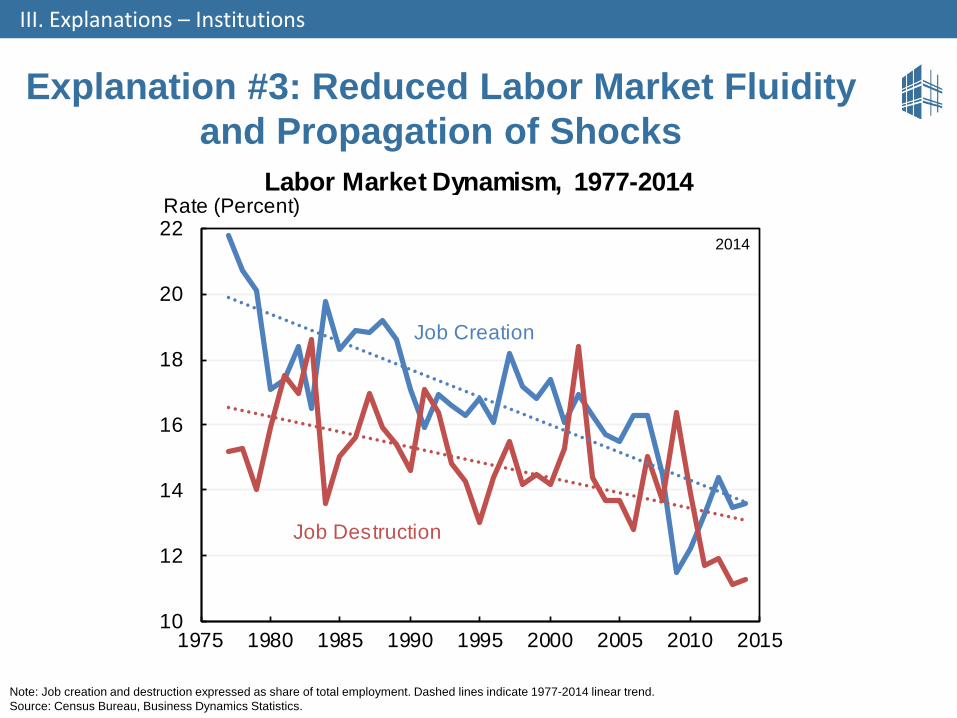
Explanation #3: Reduced Labor Market Fluidity and Propagation of Shocks
III. Explanations – Institutions
Note: Job creation and destruction expressed as share of total employment. Dashed lines indicate 1977-2014 linear trend.Source: Census Bureau, Business Dynamics Statistics.
Job Creation
2014
Job Destruction
10
12
14
16
18
20
22
1975 1980 1985 1990 1995 2000 2005 2010 2015
Labor Market Dynamism, 1977-2014Rate (Percent)
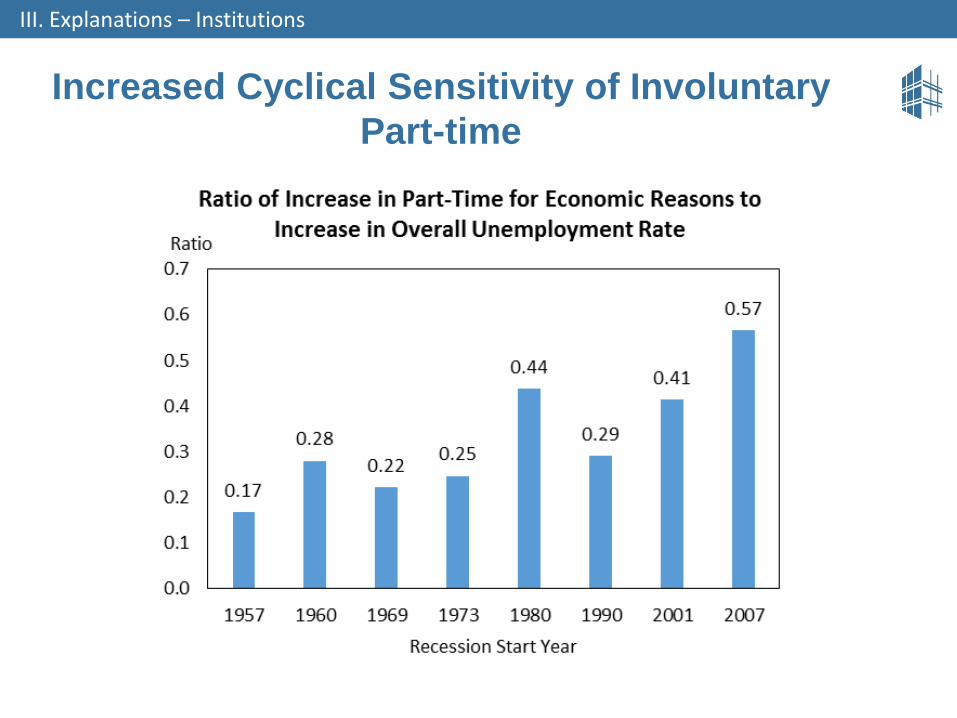
Increased Cyclical Sensitivity of Involuntary Part-time
III. Explanations – Institutions
Summary of the Key Facts & Explanation
III. Explanationsd Explanations
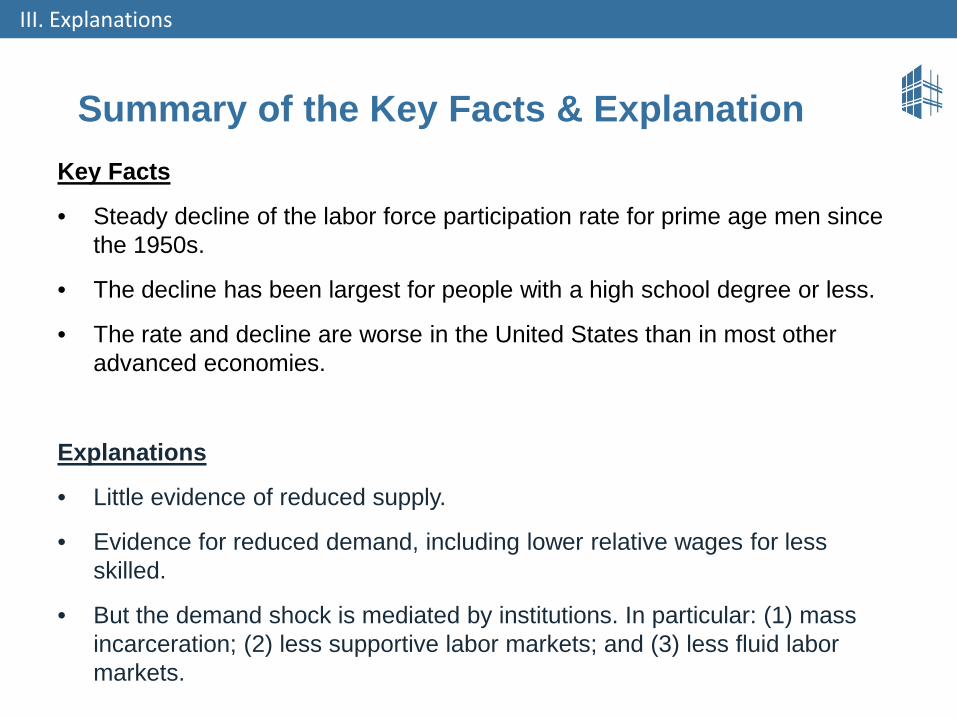
Key Facts
• Steady decline of the labor force participation rate for prime age men since the 1950s.
• The decline has been largest for people with a high school degree or less.
• The rate and decline are worse in the United States than in most other advanced economies.
Explanations
• Little evidence of reduced supply.
• Evidence for reduced demand, including lower relative wages for less skilled.
• But the demand shock is mediated by institutions. In particular: (1) mass incarceration; (2) less supportive labor markets; and (3) less fluid labor markets.
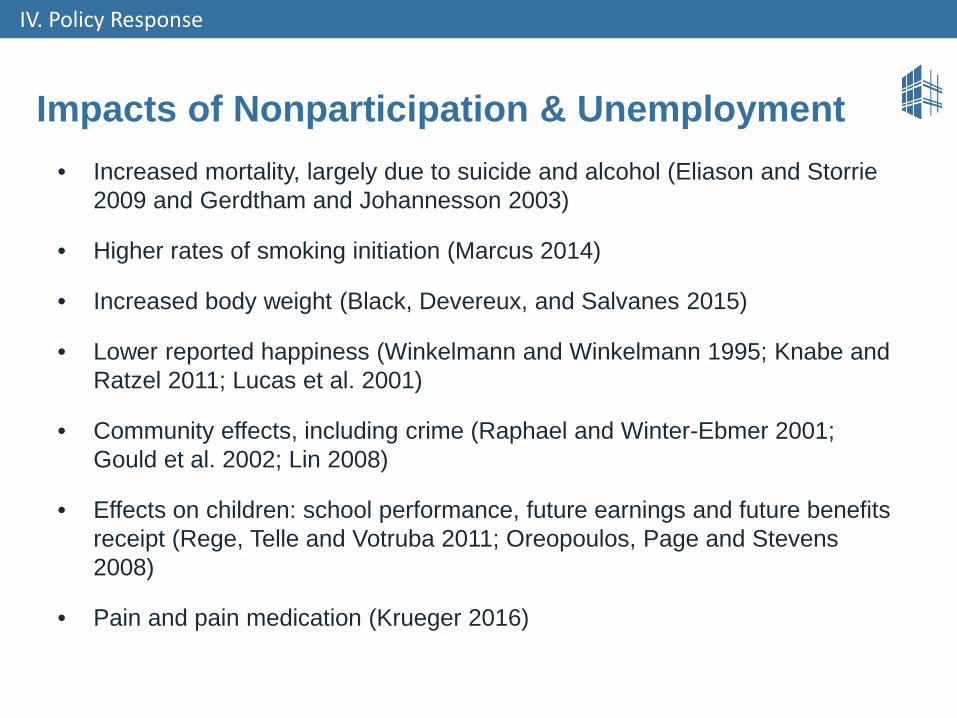
Impacts of Nonparticipation & Unemployment
IV. Policy Response
• Increased mortality, largely due to suicide and alcohol (Eliason and Storrie2009 and Gerdtham and Johannesson 2003)
• Higher rates of smoking initiation (Marcus 2014)
• Increased body weight (Black, Devereux, and Salvanes 2015)
• Lower reported happiness (Winkelmann and Winkelmann 1995; Knabe and Ratzel 2011; Lucas et al. 2001)
• Community effects, including crime (Raphael and Winter-Ebmer 2001; Gould et al. 2002; Lin 2008)
• Effects on children: school performance, future earnings and future benefits receipt (Rege, Telle and Votruba 2011; Oreopoulos, Page and Stevens 2008)
• Pain and pain medication (Krueger 2016)
Some Specific Policies
IV. Policy Response
1. Labor Demand
Infrastructure
Public employment
Work Opportunity Tax Credit for long-term unemployed
Some Specific Policies
IV. Policy Response
1. Labor Demand
2. Labor Supply
Minimum wage/unionization
EITC for workers without qualifying children
Tax treatment of secondary earners
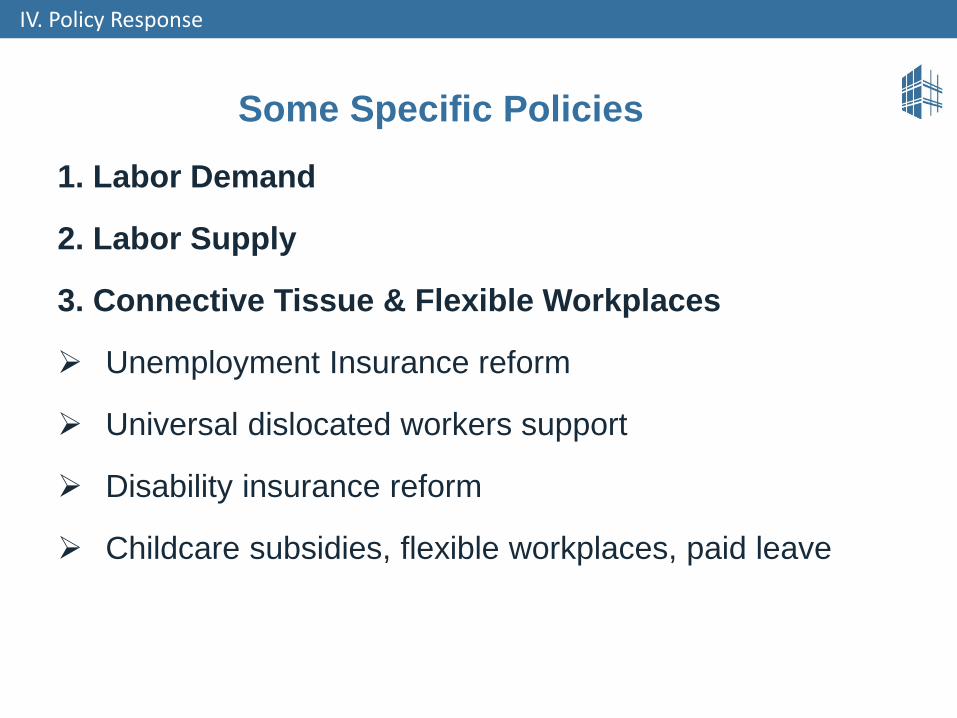
Some Specific Policies
IV. Policy Response
1. Labor Demand
2. Labor Supply
3. Connective Tissue & Flexible Workplaces
Unemployment Insurance reform
Universal dislocated workers support
Disability insurance reform
Childcare subsidies, flexible workplaces, paid leave
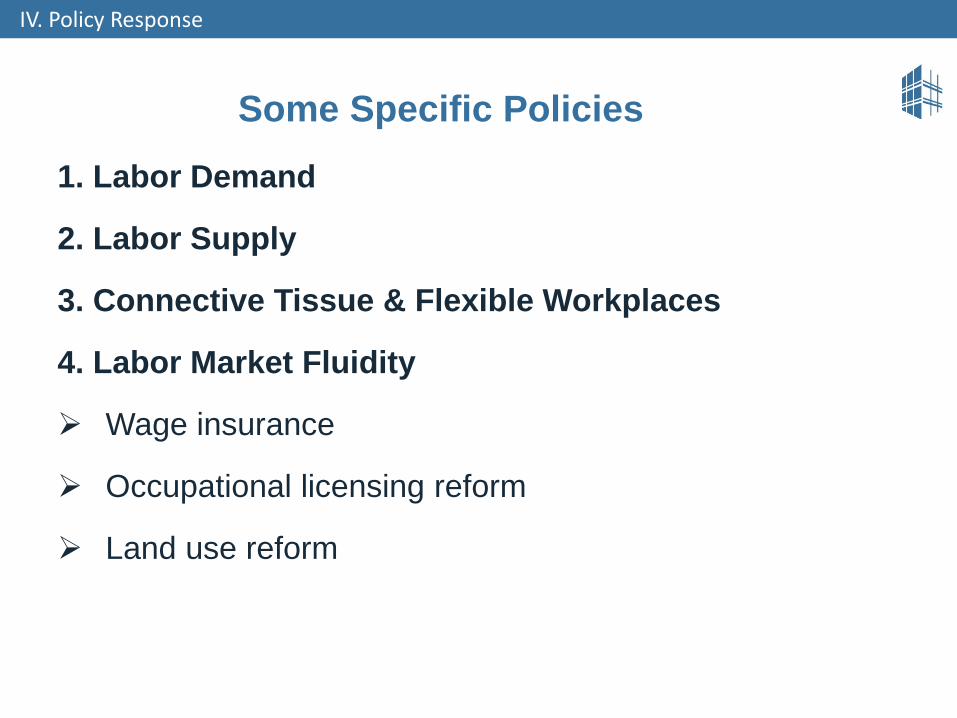
Some Specific Policies
IV. Policy Response
1. Labor Demand
2. Labor Supply
3. Connective Tissue & Flexible Workplaces
4. Labor Market Fluidity
Wage insurance
Occupational licensing reform
Land use reform
The Decline of Men Working: Why It Is Happening, What It Means, and What
to Do About ItJason FurmanSenior Fellow, PIIE
Peterson Institute for International Economics | 1750 Massachusetts Ave., NW | Washington, DC 20036
University of California, San DiegoSan Diego, CA
May 2, 2017