Embed Size (px)
Citation preview

CORPORATE DIVISION
Vittorio Ogliengo
2
AGENDA
The new Corporate Division
Strategic guidelines and business model
Key targets
3
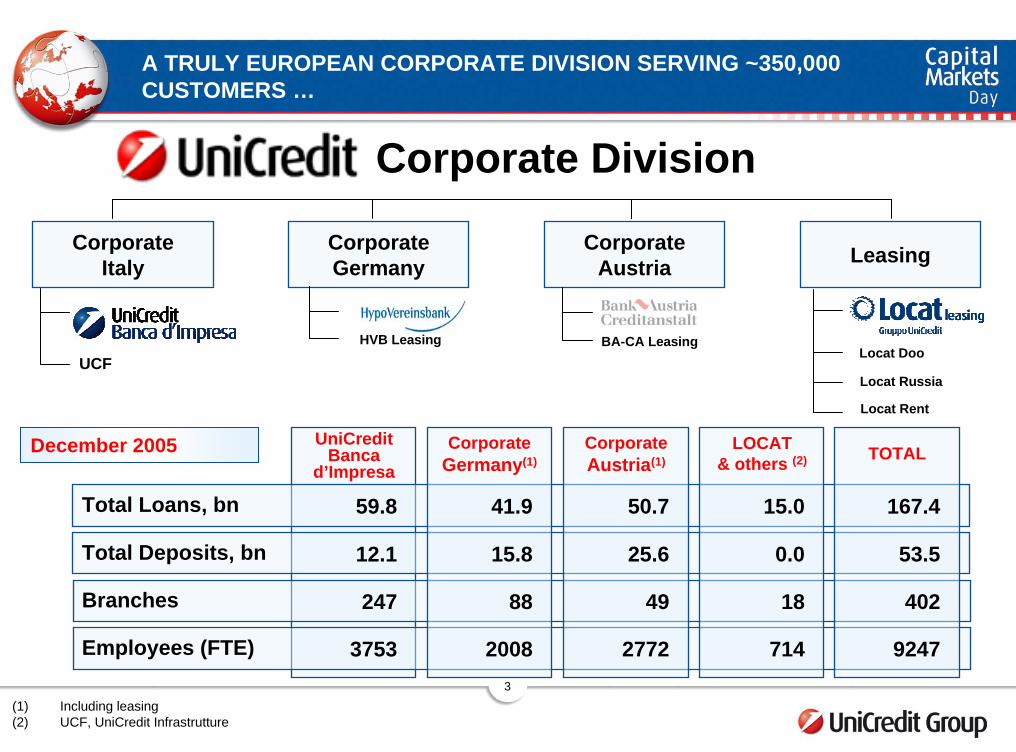
A TRULY EUROPEAN CORPORATE DIVISION SERVING ~350,000 CUSTOMERS …
Corporate Division
Corporate Italy
Corporate Germany
CorporateAustria Leasing
Total Loans, bn
Branches
Employees (FTE)
December 2005
59.8
247
3753
UniCredit Banca
d’Impresa
Total Deposits, bn 12.1
41.9
88
2008
CorporateGermany(1)
15.8
50.7
49
2772
CorporateAustria(1)
25.6
15.0
18
714
LOCAT & others (2)
0.0
167.4
402
9247
TOTAL
53.5
(1) Including leasing(2) UCF, UniCredit Infrastrutture
HVB Leasing BA-CA LeasingLocat Doo
UCFLocat Russia
Locat Rent
4
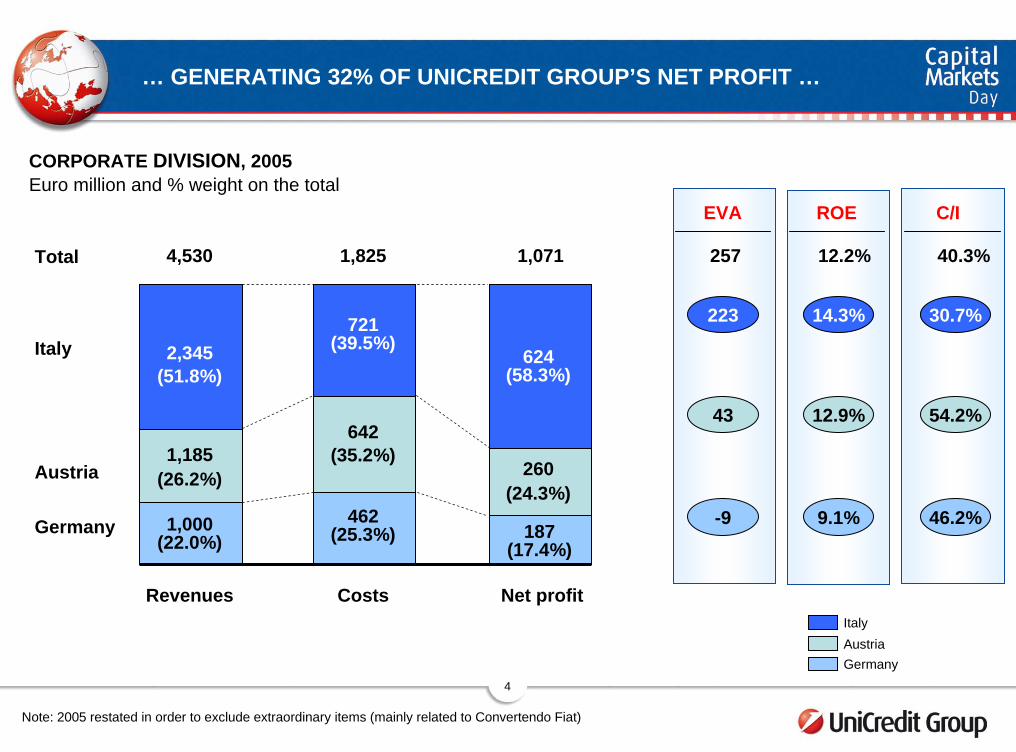
… GENERATING 32% OF UNICREDIT GROUP’S NET PROFIT …
CORPORATE DIVISION, 2005Euro million and % weight on the total
EVA
223
-9
43
257
ROE C/I
4,530 1,825 1,071Total 12.2% 40.3%
Revenues Costs Net profit
2,345(51.8%)
721(39.5%)
609
1,000(22.0%)
462(25.3%)
1,185(26.2%)
642(35.2%)
624(58.3%)
187(17.4%)
260(24.3%)
14.3%
9.1%
12.9%
30.7%
46.2%
54.2%
Italy
Austria
Germany
AustriaGermany
Italy
Note: 2005 restated in order to exclude extraordinary items (mainly related to Convertendo Fiat)
5
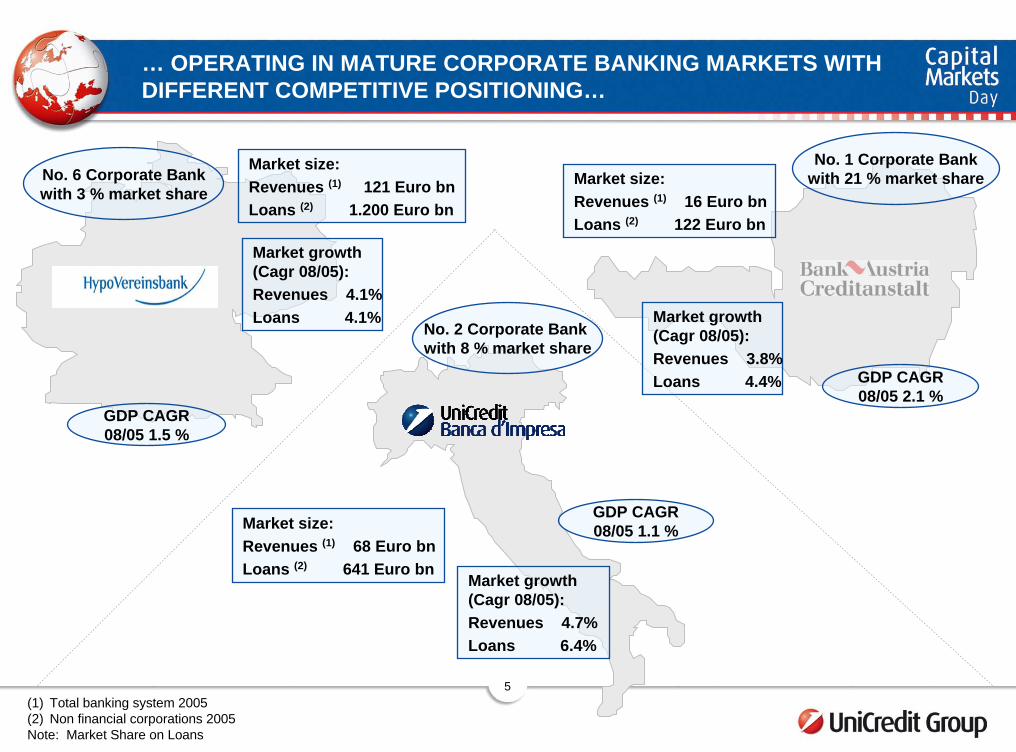
… OPERATING IN MATURE CORPORATE BANKING MARKETS WITH DIFFERENT COMPETITIVE POSITIONING…
No. 6 Corporate Bankwith 3 % market share
Market size: Revenues (1) 121 Euro bnLoans (2) 1.200 Euro bn
GDP CAGR 08/05 1.5 %
Market growth(Cagr 08/05): Revenues 4.1%Loans 4.1%
No. 2 Corporate Bank with 8 % market share
Market size: Revenues (1) 68 Euro bnLoans (2) 641 Euro bn
Market growth (Cagr 08/05): Revenues 4.7%Loans 6.4%
GDP CAGR 08/05 1.1 %
GDP CAGR 08/05 2.1 %
No. 1 Corporate Bankwith 21 % market shareMarket size:
Revenues (1) 16 Euro bn Loans (2) 122 Euro bn
Market growth (Cagr 08/05): Revenues 3.8%Loans 4.4%
(1) Total banking system 2005(2) Non financial corporations 2005Note: Market Share on Loans
6
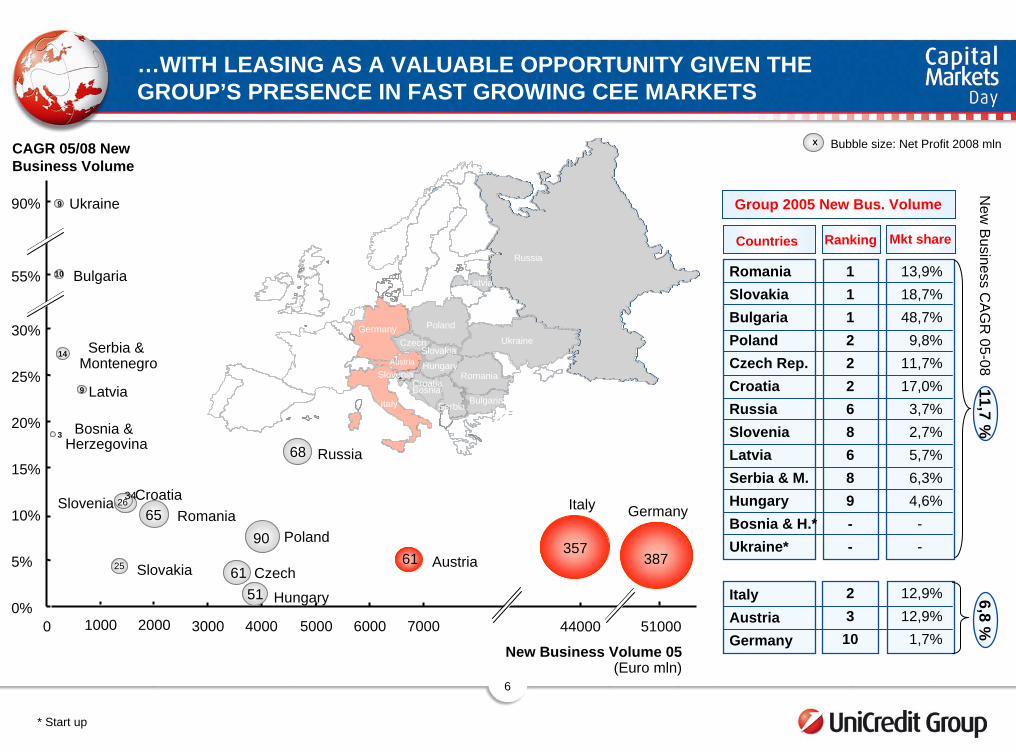
…WITH LEASING AS A VALUABLE OPPORTUNITY GIVEN THE GROUP’S PRESENCE IN FAST GROWING CEE MARKETS
Bubble size: Net Profit 2008 mln
PolandUkraine
Russia
RomaniaHungary
Czech Slovakia
Latvia
Italy
Germany
Austria
Bulgaria
CroatiaSlovenia
Bosnia
Serbia
9
X
Austria
Serbia & Montenegro
Bosnia & Herzegovina
0%
5%
10%
15%
20%
25%
30%
1000 2000 3000 4000 5000 6000 7000
Russia
Poland
Hungary
Czech
Slovenia CroatiaRomania
Slovakia
Latvia
55%
90%
44000
Italy Germany
0 51000
Ukraine
Bulgaria
35738761
90
6151
34
25
14
3
10
65
9
9
68
CAGR 05/08 New Business Volume
Group 2005 New Bus. Volume
RomaniaSlovakiaBulgariaPolandCzech Rep.CroatiaRussiaSloveniaLatviaSerbia & M.HungaryBosnia & H.*Ukraine*
Ranking Mkt shareCountries
New Business Volume 05 (Euro mln)
* Start up
26
* Start up
ItalyAustriaGermany
23
10
12,9%12,9%
1,7%
11122268689--
13,9%18,7%48,7%
9,8%11,7%17,0%
3,7%2,7%5,7%6,3%4,6%
--
11,7 %N
ew B
usiness CA
GR
05-086,8 %
7
AGENDA
The new Corporate Division
Strategic guidelines and business model
Key targets
8
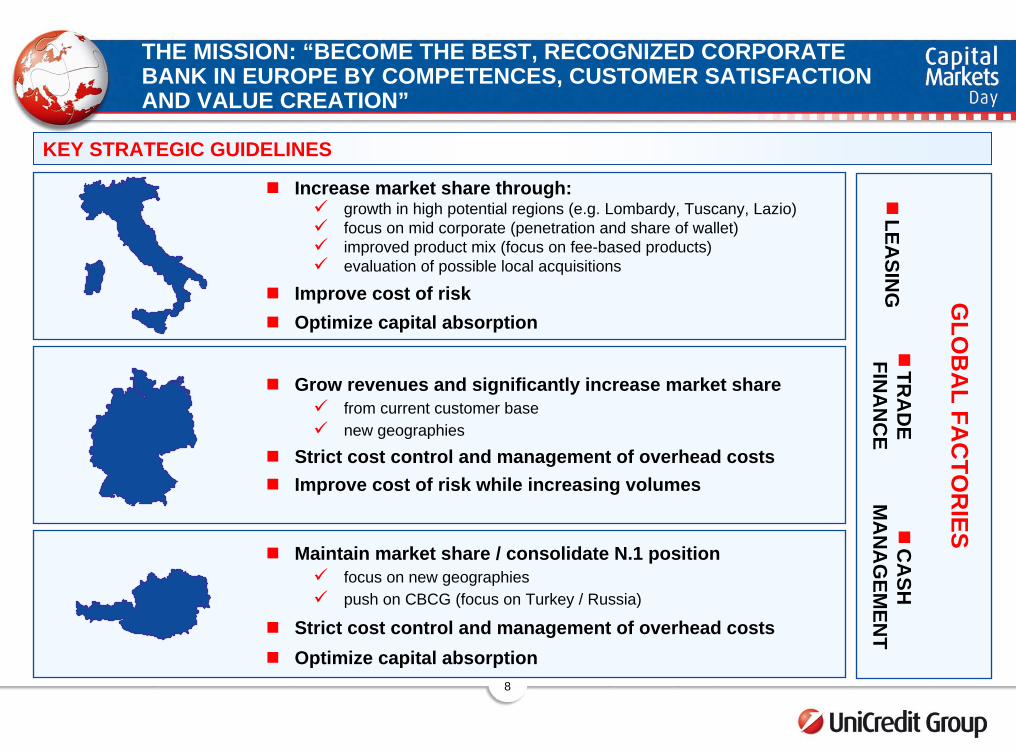
THE MISSION: “BECOME THE BEST, RECOGNIZED CORPORATE BANK IN EUROPE BY COMPETENCES, CUSTOMER SATISFACTION AND VALUE CREATION”
KEY STRATEGIC GUIDELINES
Increase market share through:growth in high potential regions (e.g. Lombardy, Tuscany, Lazio)focus on mid corporate (penetration and share of wallet)improved product mix (focus on fee-based products)evaluation of possible local acquisitions
Improve cost of riskOptimize capital absorption
Grow revenues and significantly increase market sharefrom current customer basenew geographies
Strict cost control and management of overhead costsImprove cost of risk while increasing volumes
Maintain market share / consolidate N.1 positionfocus on new geographiespush on CBCG (focus on Turkey / Russia)
Strict cost control and management of overhead costsOptimize capital absorption
GLO
BA
L FAC
TOR
IES
LEASIN
GTR
AD
E FIN
AN
CE
CA
SH
MA
NA
GEM
ENT
9
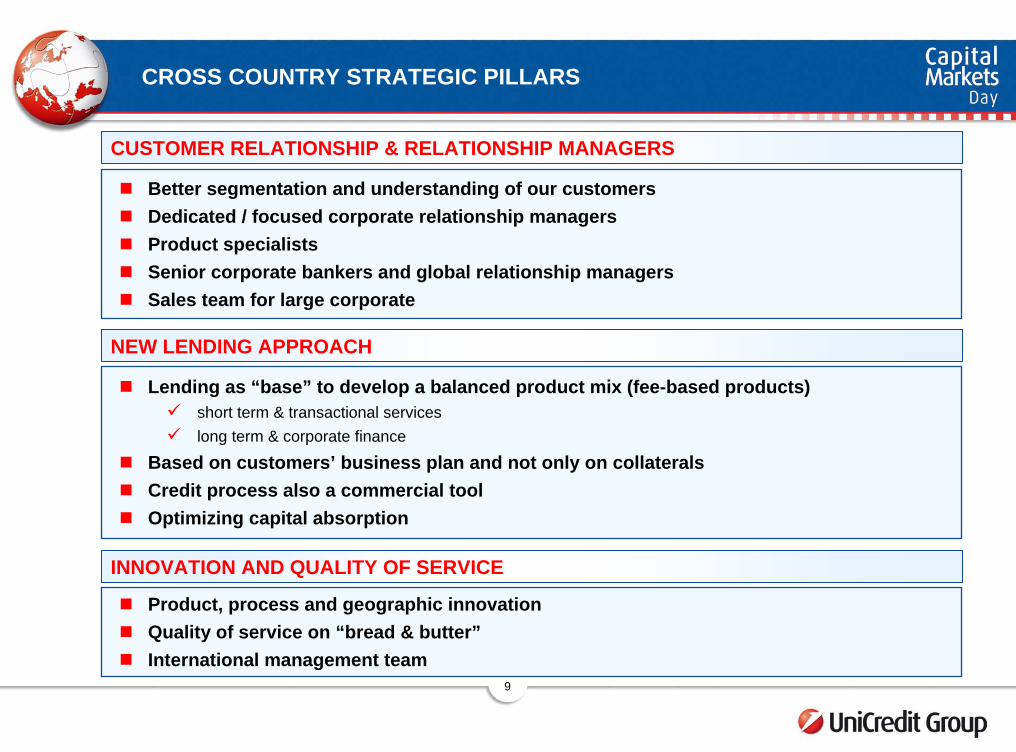
CROSS COUNTRY STRATEGIC PILLARS
Better segmentation and understanding of our customersDedicated / focused corporate relationship managersProduct specialists Senior corporate bankers and global relationship managersSales team for large corporate
CUSTOMER RELATIONSHIP & RELATIONSHIP MANAGERS
NEW LENDING APPROACH
Lending as “base” to develop a balanced product mix (fee-based products)short term & transactional serviceslong term & corporate finance
Based on customers’ business plan and not only on collateralsCredit process also a commercial toolOptimizing capital absorption
INNOVATION AND QUALITY OF SERVICE
Product, process and geographic innovationQuality of service on “bread & butter”International management team
10
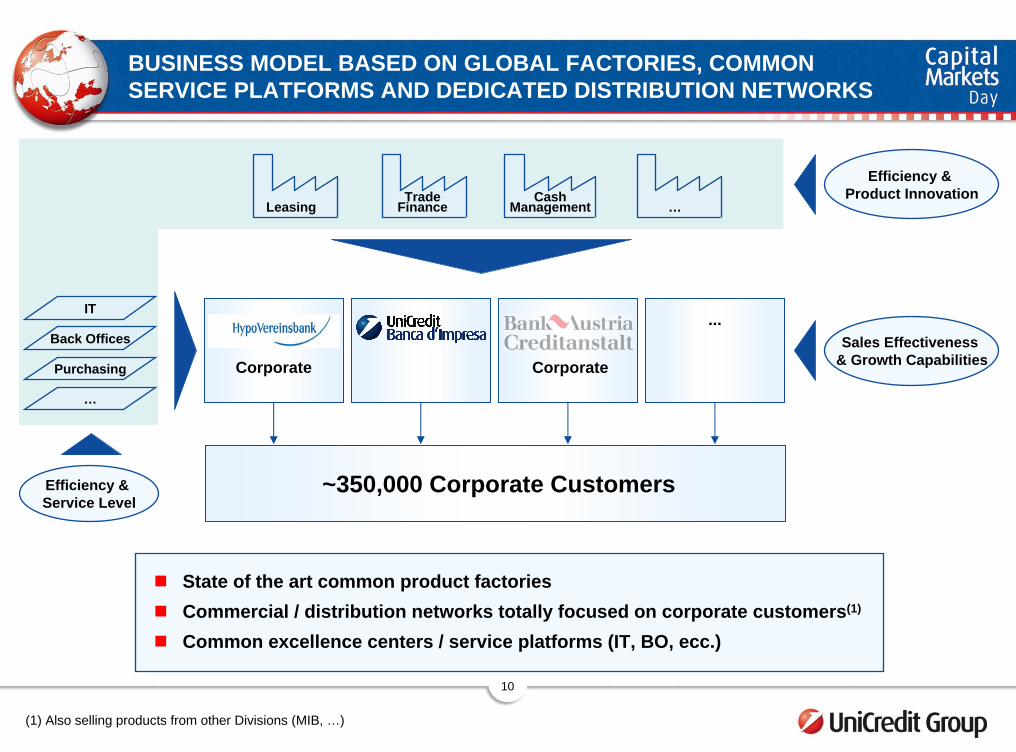
BUSINESS MODEL BASED ON GLOBAL FACTORIES, COMMON SERVICE PLATFORMS AND DEDICATED DISTRIBUTION NETWORKS
~350,000 Corporate Customers
Efficiency & Product Innovation
IT
Purchasing
Back Offices
…
LeasingCash
Management …Trade
Finance
Corporate
...
Efficiency & Service Level
Sales Effectiveness & Growth CapabilitiesCorporate
State of the art common product factoriesCommercial / distribution networks totally focused on corporate customers(1)
Common excellence centers / service platforms (IT, BO, ecc.)
(1) Also selling products from other Divisions (MIB, …)
11
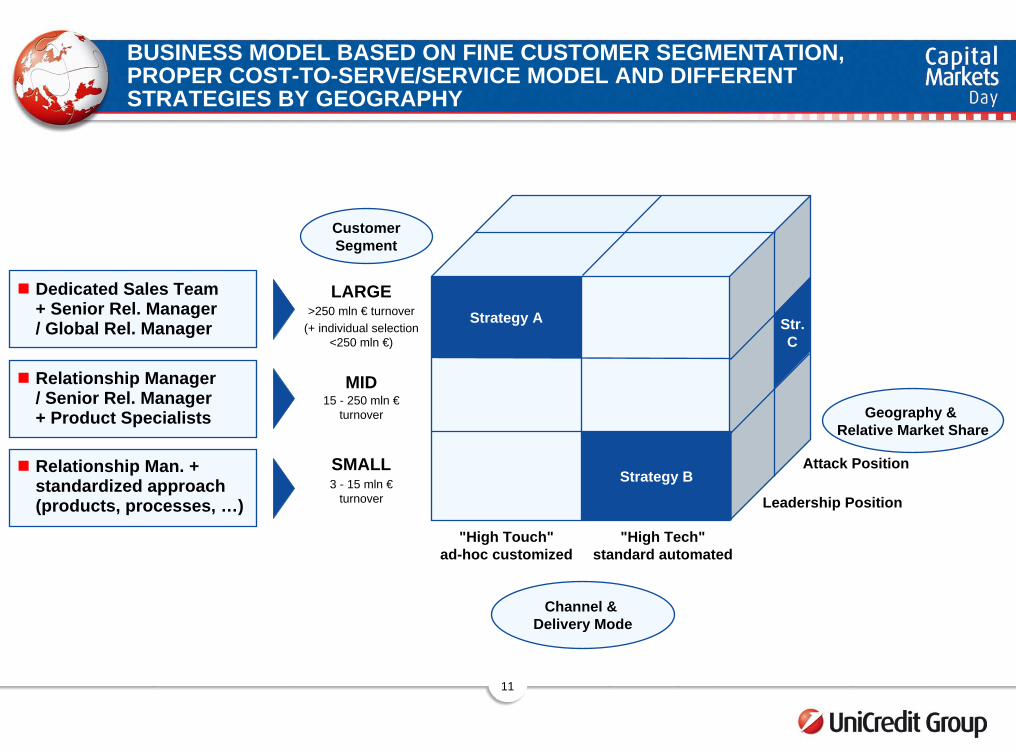
BUSINESS MODEL BASED ON FINE CUSTOMER SEGMENTATION, PROPER COST-TO-SERVE/SERVICE MODEL AND DIFFERENT STRATEGIES BY GEOGRAPHY
CustomerSegment
Dedicated Sales Team + Senior Rel. Manager / Global Rel. Manager
Relationship Manager / Senior Rel. Manager + Product Specialists
Relationship Man. + standardized approach (products, processes, …)
LARGE
MIDGeography &
Relative Market Share
SMALL
Leadership Position
Attack Position
>250 mln € turnover (+ individual selection
<250 mln €)
15 - 250 mln €turnover
3 - 15 mln €turnover
Strategy A
Strategy B
Str.C
"High Touch" ad-hoc customized
"High Tech" standard automated
Channel & Delivery Mode
12
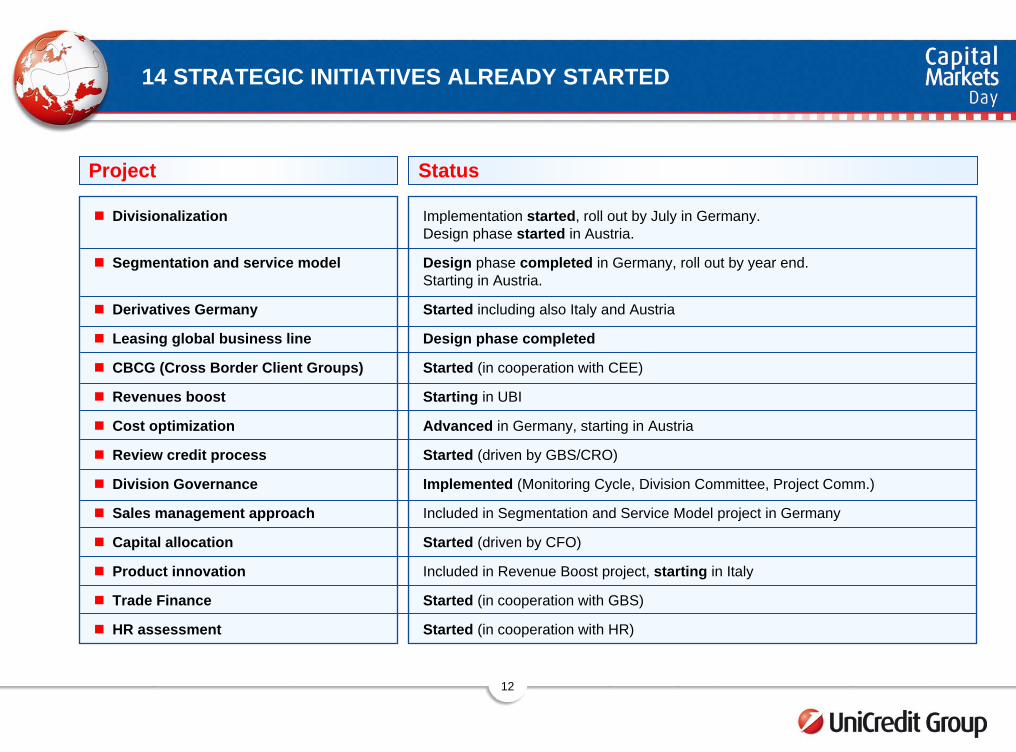
14 STRATEGIC INITIATIVES ALREADY STARTED
Project Status
Divisionalization
Segmentation and service model
Derivatives Germany
Leasing global business line
CBCG (Cross Border Client Groups)
Revenues boost
Cost optimization
Review credit process
Division Governance
Sales management approach
Capital allocation
Product innovation
Trade Finance
HR assessment
Implementation started, roll out by July in Germany. Design phase started in Austria.
Design phase completed in Germany, roll out by year end. Starting in Austria.
Started including also Italy and Austria
Design phase completed
Started (in cooperation with CEE)
Starting in UBI
Advanced in Germany, starting in Austria
Started (driven by GBS/CRO)
Implemented (Monitoring Cycle, Division Committee, Project Comm.)
Included in Segmentation and Service Model project in Germany
Started (driven by CFO)
Included in Revenue Boost project, starting in Italy
Started (in cooperation with GBS)
Started (in cooperation with HR)
13
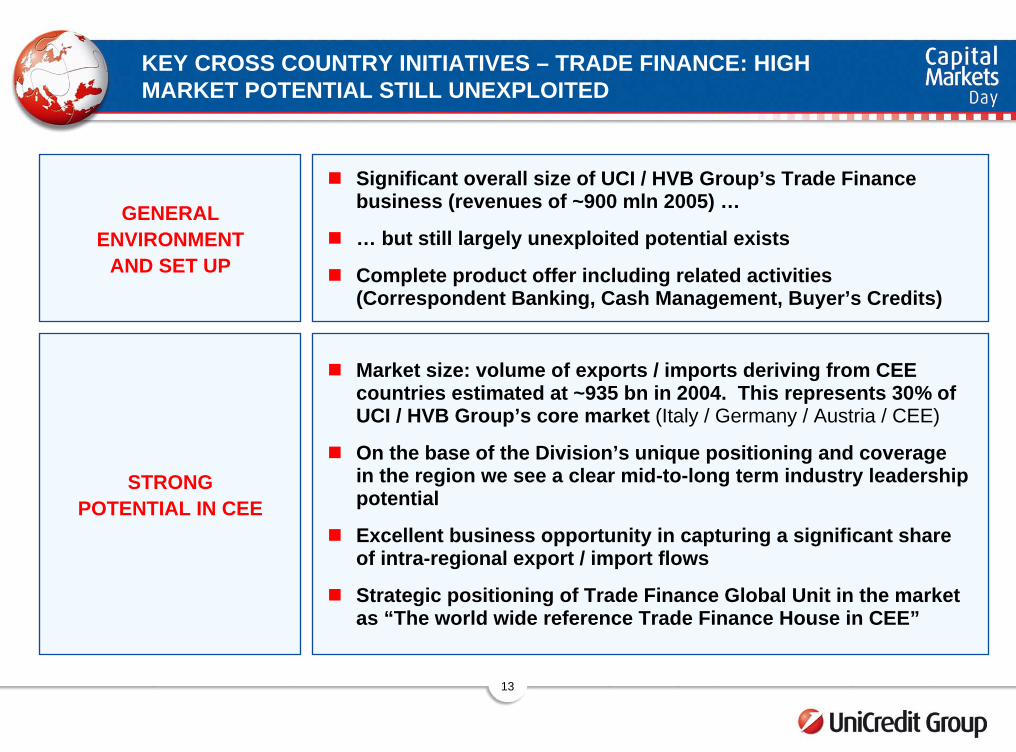
Market size: volume of exports / imports deriving from CEE countries estimated at ~935 bn in 2004. This represents 30% of UCI / HVB Group’s core market (Italy / Germany / Austria / CEE)
On the base of the Division’s unique positioning and coverage in the region we see a clear mid-to-long term industry leadership potential
Excellent business opportunity in capturing a significant share of intra-regional export / import flows
Strategic positioning of Trade Finance Global Unit in the marketas “The world wide reference Trade Finance House in CEE”
KEY CROSS COUNTRY INITIATIVES – TRADE FINANCE: HIGH MARKET POTENTIAL STILL UNEXPLOITED
Significant overall size of UCI / HVB Group’s Trade Finance business (revenues of ~900 mln 2005) …
… but still largely unexploited potential exists
Complete product offer including related activities (Correspondent Banking, Cash Management, Buyer’s Credits)
GENERAL ENVIRONMENT
AND SET UP
STRONG POTENTIAL IN CEE
14
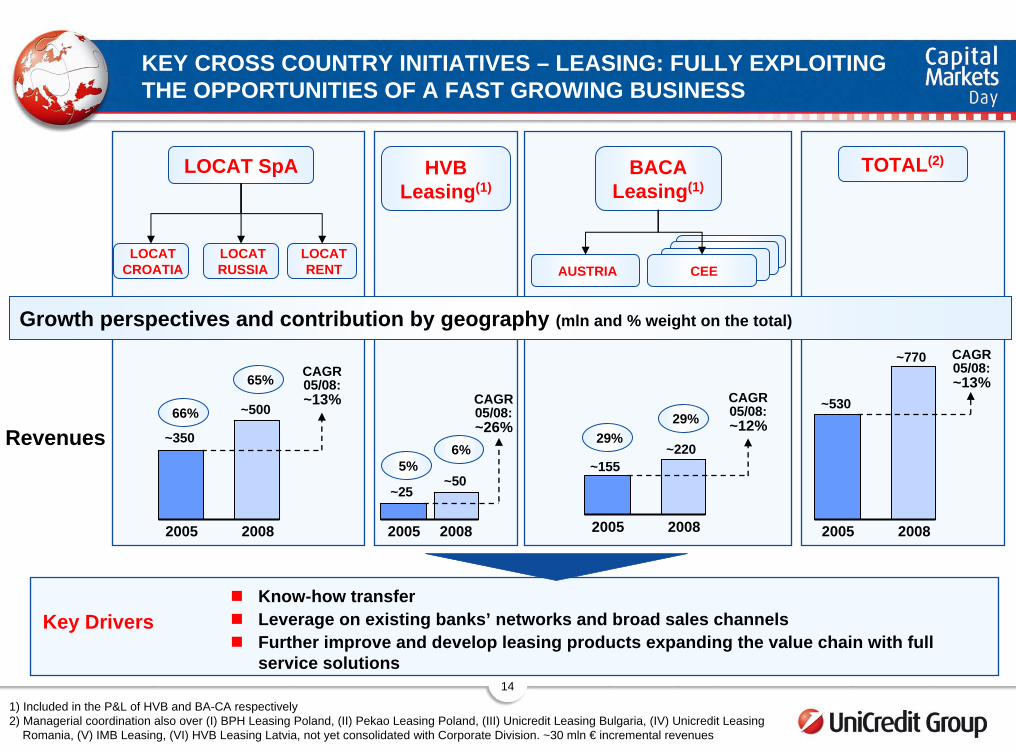
KEY CROSS COUNTRY INITIATIVES – LEASING: FULLY EXPLOITING THE OPPORTUNITIES OF A FAST GROWING BUSINESS
LOCAT SpA HVB Leasing(1)
BACA Leasing(1)
AUSTRIA
Growth perspectives and contribution by geography (mln and % weight on the total)
TOTAL(2)
LOCAT RUSSIA
LOCAT RENT
LOCAT CROATIA CEE
Revenues~530
2005 2008
CAGR 05/08:~13%
~770
~155
2005 2008
CAGR 05/08:~12%
~220~350
2005 2008
CAGR 05/08:~13%
~500
~25
2005 2008
CAGR 05/08:~26%
~50
66%
65%
5%6%
29%29%
Know-how transferLeverage on existing banks’ networks and broad sales channelsFurther improve and develop leasing products expanding the value chain with full service solutions
Key Drivers
1) Included in the P&L of HVB and BA-CA respectively2) Managerial coordination also over (I) BPH Leasing Poland, (II) Pekao Leasing Poland, (III) Unicredit Leasing Bulgaria, (IV) Unicredit Leasing
Romania, (V) IMB Leasing, (VI) HVB Leasing Latvia, not yet consolidated with Corporate Division. ~30 mln € incremental revenues
15
AGENDA
The new Corporate Division
Strategic guidelines and business model
Key targets
16
UNICREDIT BANCA D‘IMPRESA: KEY STRATEGIC GUIDELINES AND TARGETS
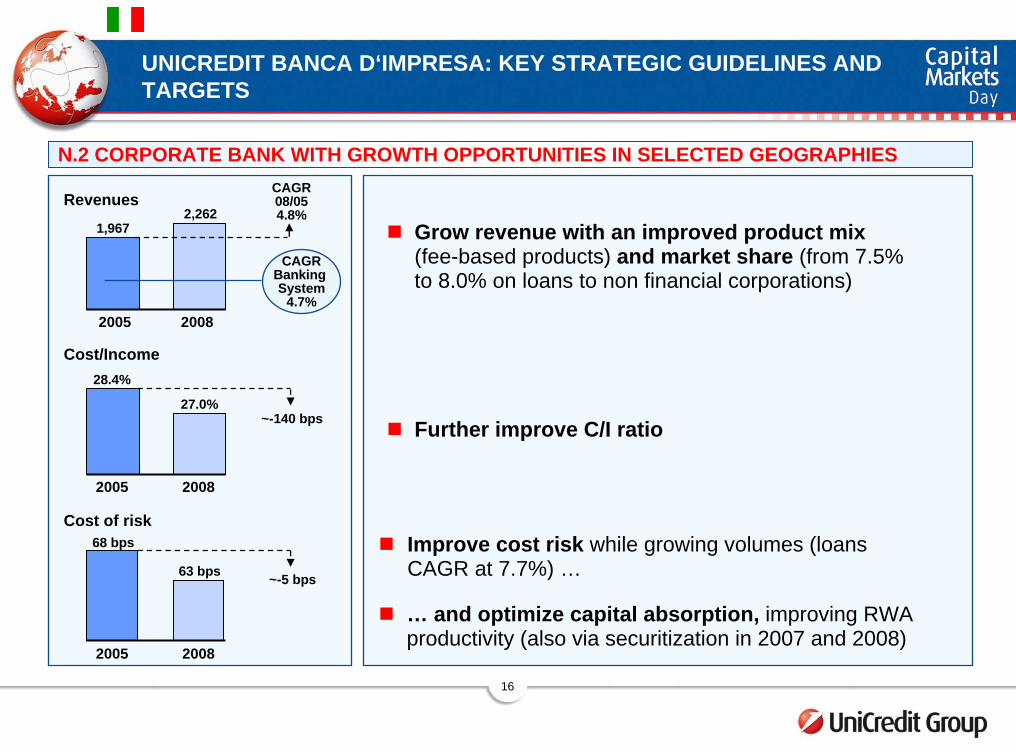
N.2 CORPORATE BANK WITH GROWTH OPPORTUNITIES IN SELECTED GEOGRAPHIES
Revenues1,967
2,262
2005 2008
CAGRBanking System
4.7%
CAGR08/054.8%
28.4%
27.0%
2005 2008
~-140 bps
Cost/Income
68 bps
63 bps
Cost of risk
~-5 bps
2005 2008
Grow revenue with an improved product mix (fee-based products) and market share (from 7.5% to 8.0% on loans to non financial corporations)
… and optimize capital absorption, improving RWA productivity (also via securitization in 2007 and 2008)
Improve cost risk while growing volumes (loans CAGR at 7.7%) …
Further improve C/I ratio
17
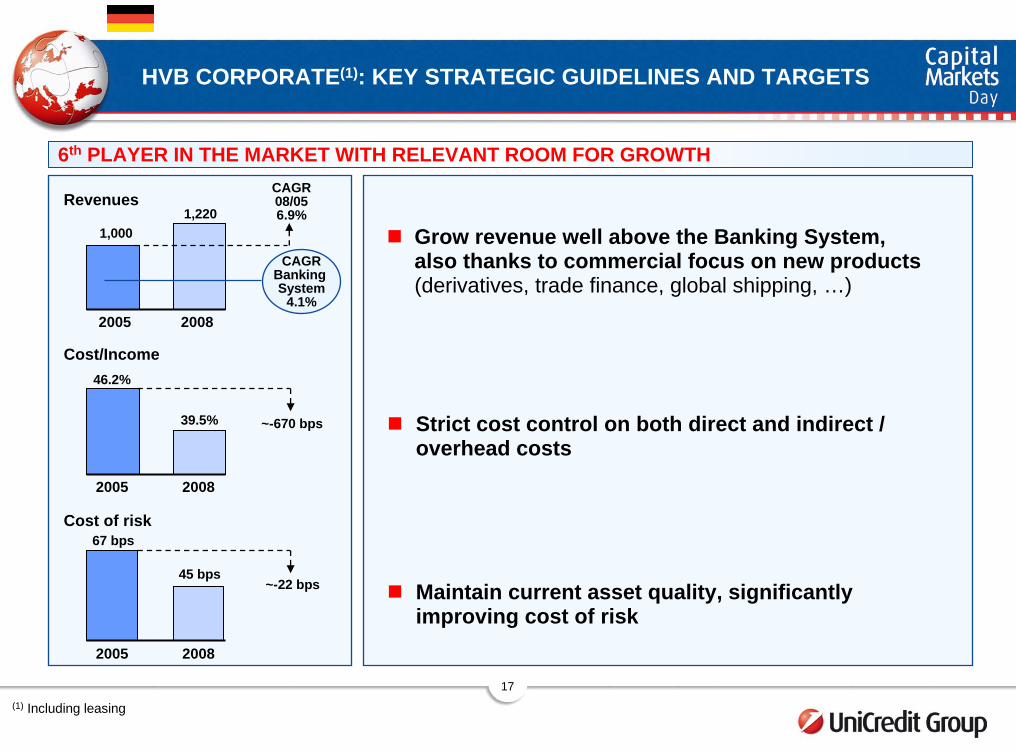
HVB CORPORATE(1): KEY STRATEGIC GUIDELINES AND TARGETS
6th PLAYER IN THE MARKET WITH RELEVANT ROOM FOR GROWTH
Revenues
1,0001,220
2005 2008
CAGRBanking System
4.1%
CAGR08/056.9%
46.2%
39.5%
2005 2008
~-670 bps
Cost/Income
67 bps
45 bps
Cost of risk
~-22 bps
2005 2008
Strict cost control on both direct and indirect / overhead costs
Grow revenue well above the Banking System, also thanks to commercial focus on new products (derivatives, trade finance, global shipping, …)
Maintain current asset quality, significantly improving cost of risk
(1) Including leasing
18
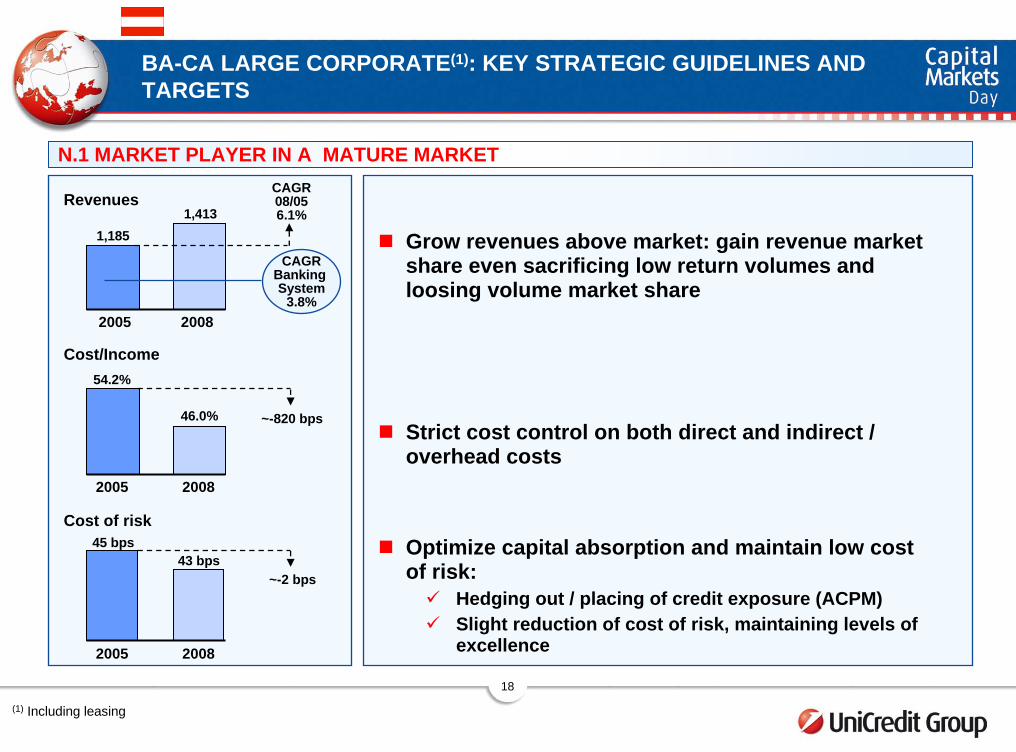
BA-CA LARGE CORPORATE(1): KEY STRATEGIC GUIDELINES AND TARGETS
N.1 MARKET PLAYER IN A MATURE MARKET
Revenues
1,1851,413
2005 2008
CAGRBanking System
3.8%
CAGR08/056.1%
54.2%
46.0%
2005 2008
~-820 bps
Cost/Income
45 bps43 bps
Cost of risk
~-2 bps
2005 2008
Grow revenues above market: gain revenue market share even sacrificing low return volumes and loosing volume market share
Strict cost control on both direct and indirect / overhead costs
Optimize capital absorption and maintain low cost of risk:
Hedging out / placing of credit exposure (ACPM)Slight reduction of cost of risk, maintaining levels of excellence
(1) Including leasing
19
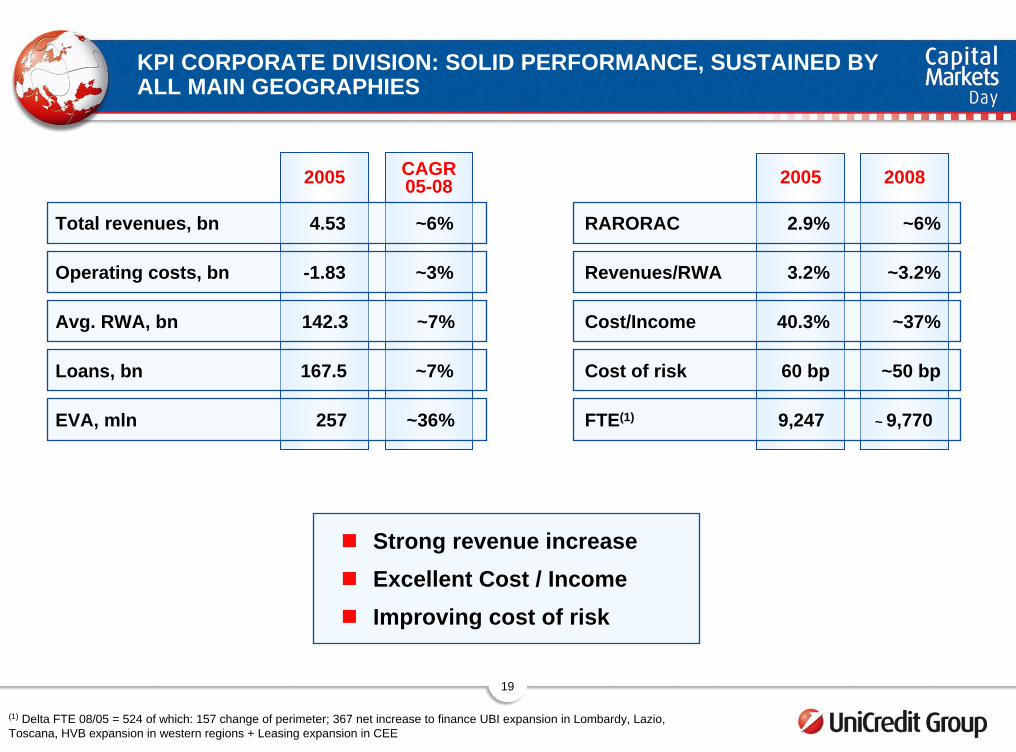
KPI CORPORATE DIVISION: SOLID PERFORMANCE, SUSTAINED BY ALL MAIN GEOGRAPHIES
CAGR 05-08
(1) Delta FTE 08/05 = 524 of which: 157 change of perimeter; 367 net increase to finance UBI expansion in Lombardy, Lazio, Toscana, HVB expansion in western regions + Leasing expansion in CEE
FTE(1) 9,247
2.9%
3.2%
RARORAC
Revenues/RWA
2005
167.5
4.53
142.3
-1.83
Loans, bn
~ 9,770
~6%
~3.2%
Total revenues, bn ~6%
~7%
~3%Operating costs, bn
Avg. RWA, bn Cost/Income 40.3% ~37%
60 bp
2005
~50 bp
2008
~7%
~36%
Cost of risk
257EVA, mln
Strong revenue increaseExcellent Cost / IncomeImproving cost of risk
20
ANNEX
21
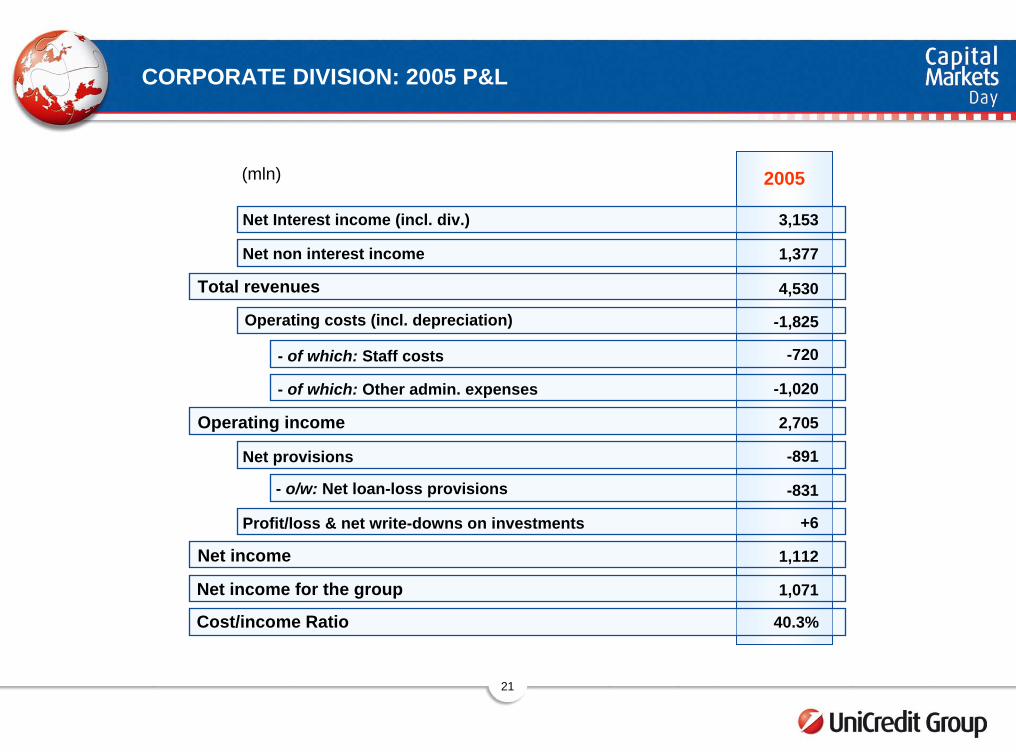
CORPORATE DIVISION: 2005 P&L
(mln)
Net Interest income (incl. div.)
Net non interest income
Total revenues
Operating costs (incl. depreciation)
Operating income
Net income
Net provisions
Net income for the group
- of which: Staff costs
- of which: Other admin. expenses
- o/w: Net loan-loss provisions
Cost/income Ratio
2005
3,153
1,377
4,530
2,705
-1,020
-720
-1,825
1,112
1,071
40.3%
-831
-891
Profit/loss & net write-downs on investments +6