Embed Size (px)
Citation preview
Presented by:Jerri Bohard, ODOT Transportation Development Division Administrator
Paul Mather, ODOT Highway Division AdministratorTravis Brouwer, ODOT Assistant Director
2018-2021 Statewide
Transportation Improvement
Program
ODOT Funding Allocation Buckets
Transportation System Agency
Capital Program FundsSTIP, Transit, Rail
Federal Funds (and State Funds when sufficient)
BudgetNon-Capital Programs
State and Federal Funds
BudgetState and Federal Funds
“Enhance”
Expanding or Improving the
System
“Fix-It” Fixing or
Preserving the System
Maintaining and Operating the
System
ODOT Regulatory, Financial and Administrative
Functions
2
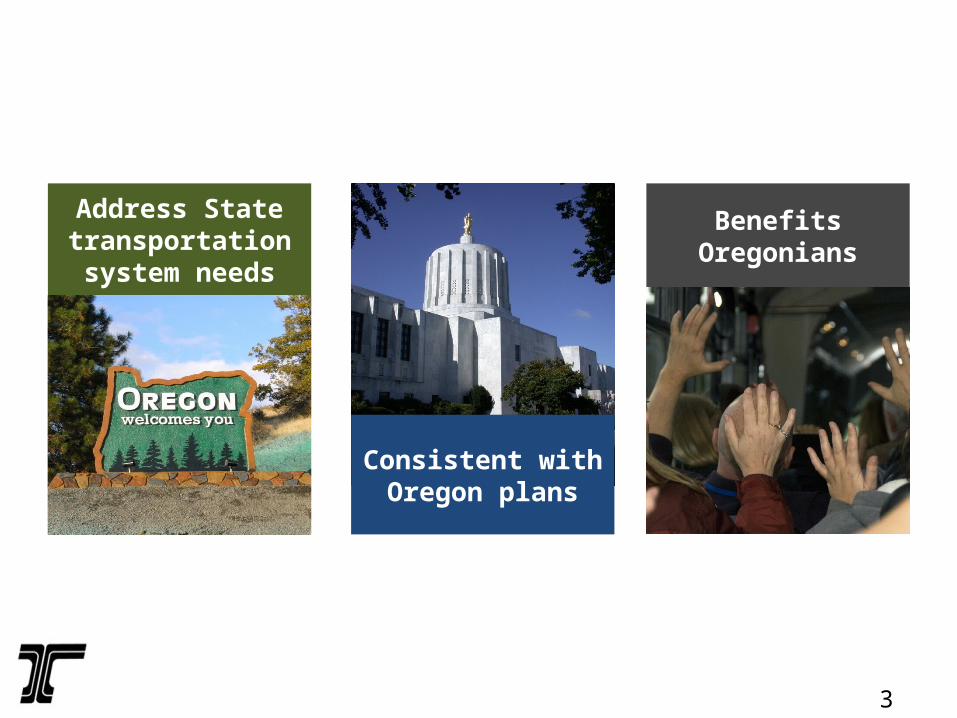
Address State transportation system needs
Consistent with Oregon plans
Benefits Oregonians
3
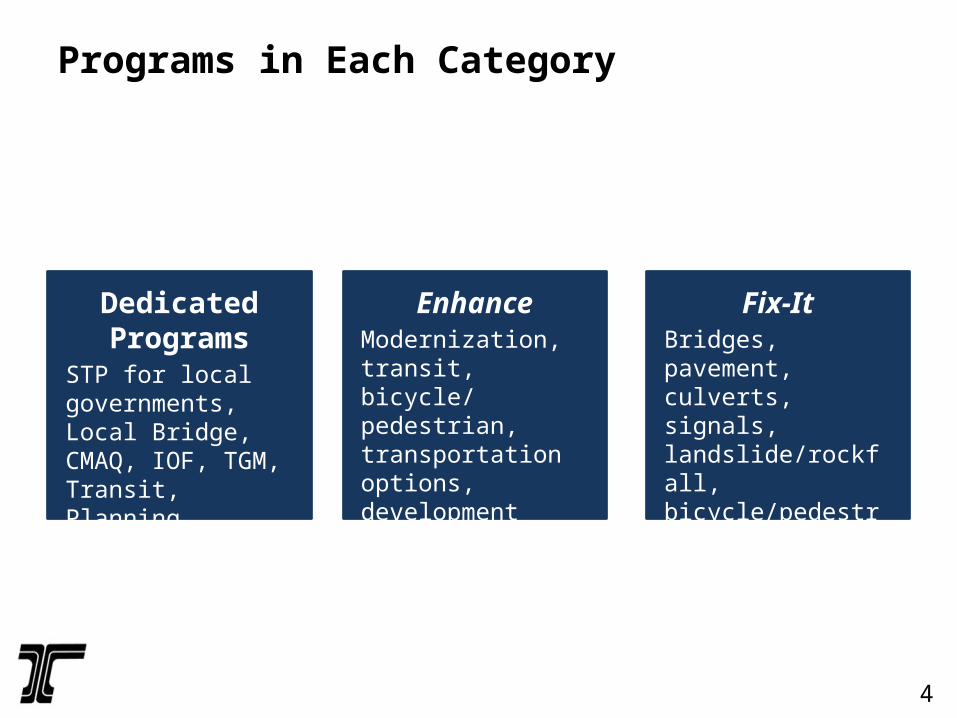
Programs in Each Category
Dedicated Programs
STP for local governments, Local Bridge, CMAQ, IOF, TGM, Transit, Planning
EnhanceModernization, transit, bicycle/ pedestrian, transportation options, development
Fix-ItBridges, pavement, culverts, signals, landslide/rockfall, bicycle/pedestrian, safety
4
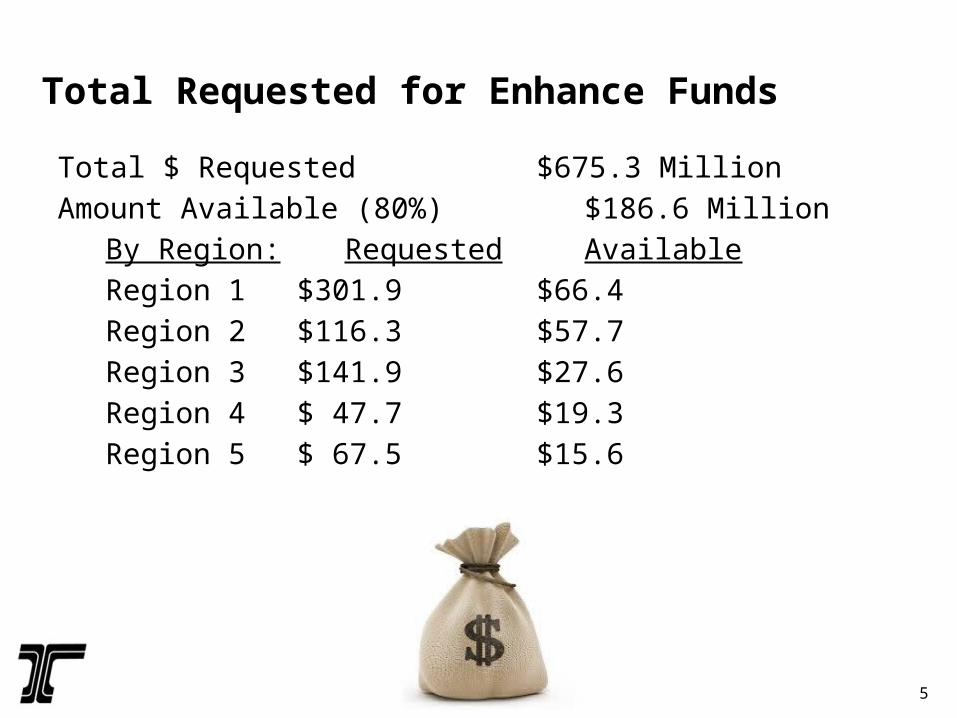
Total Requested for Enhance Funds
Total $ Requested $675.3 MillionAmount Available (80%) $186.6 Million
By Region: Requested AvailableRegion 1 $301.9
$66.4Region 2 $116.3
$57.7Region 3 $141.9
$27.6Region 4 $ 47.7 $19.3Region 5 $ 67.5 $15.6
5
6
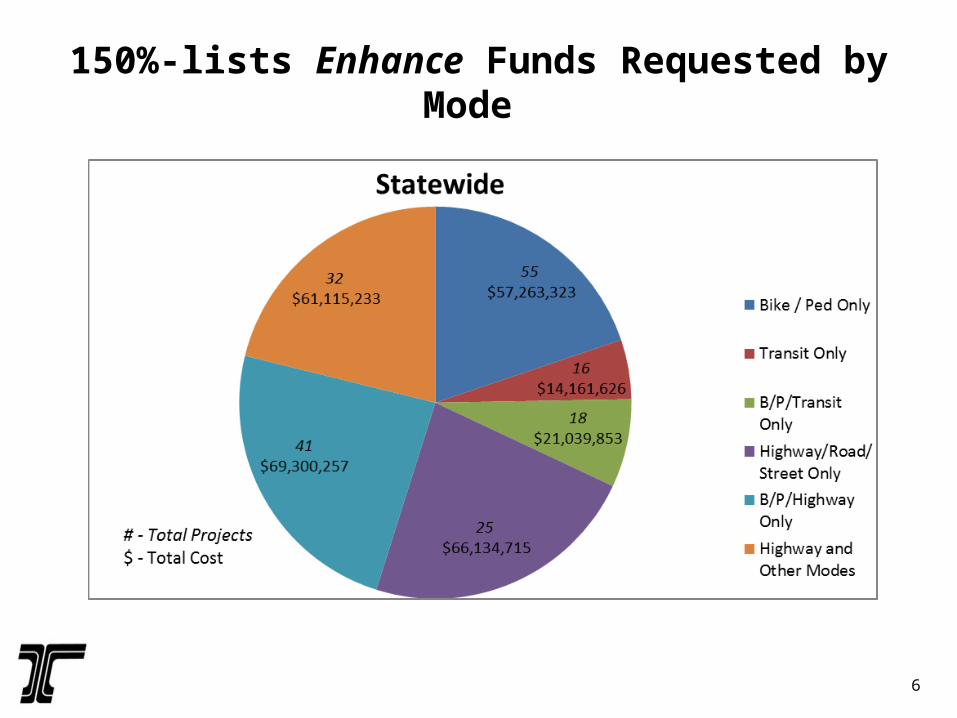
150%-lists Enhance Funds Requested by Mode
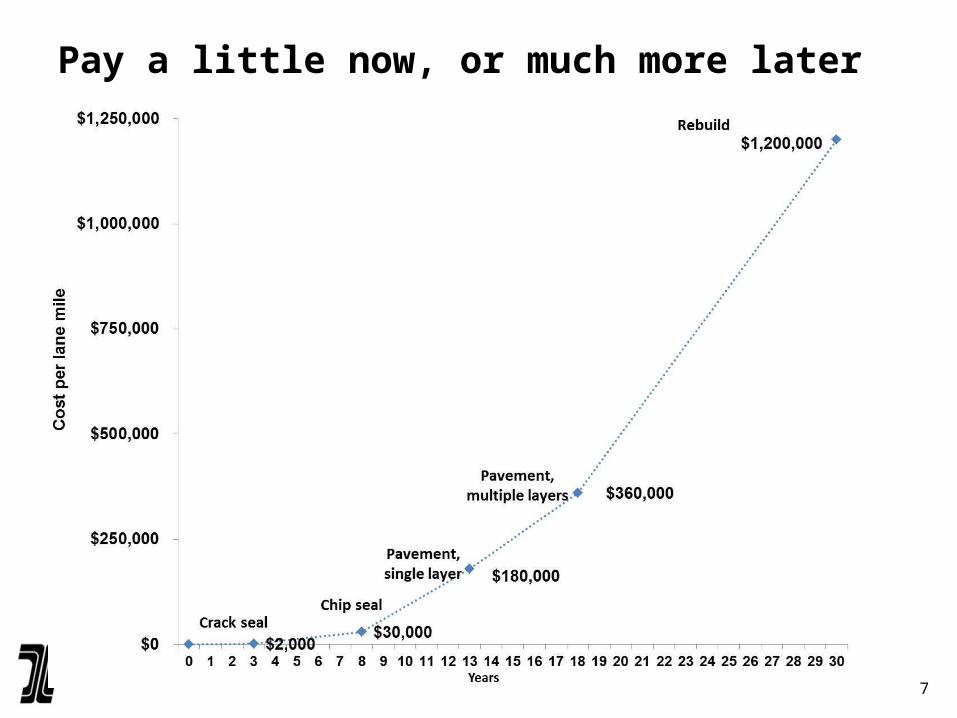
Pay a little now, or much more later
7
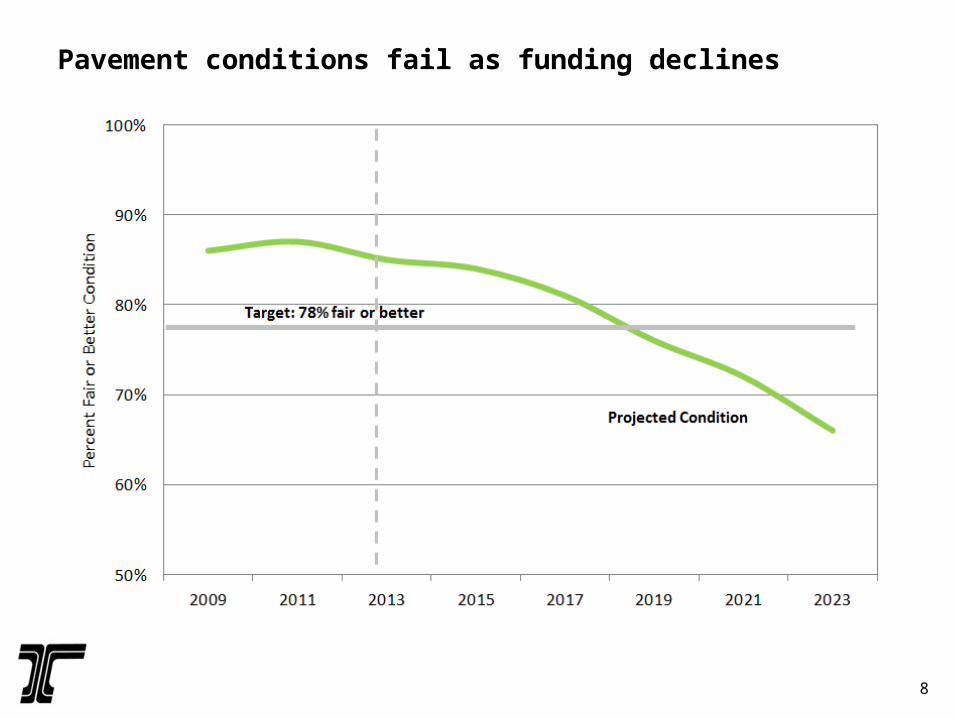
Pavement conditions fail as funding declines
8
2012(Current) 2035 (Current)0%
2000%
4000%
6000%
8000%
10000%
Interstate InterstateStatewide StatewideReg/Dist Reg/Dist
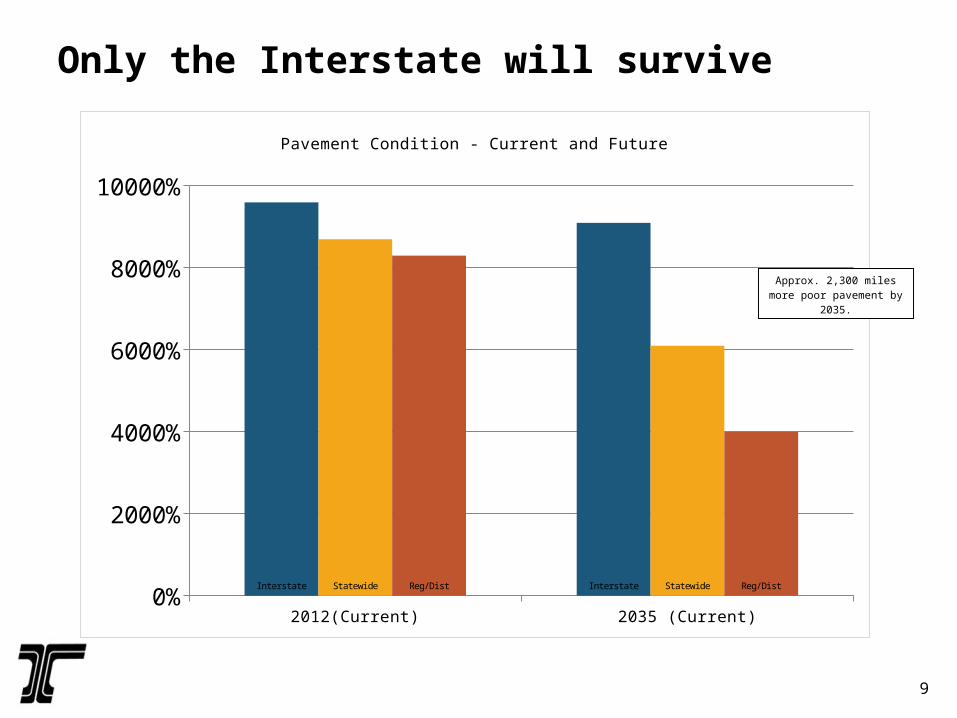
Pavement Condition - Current and Future
Approx. 2,300 miles more poor pavement by 2035.
Only the Interstate will survive
9
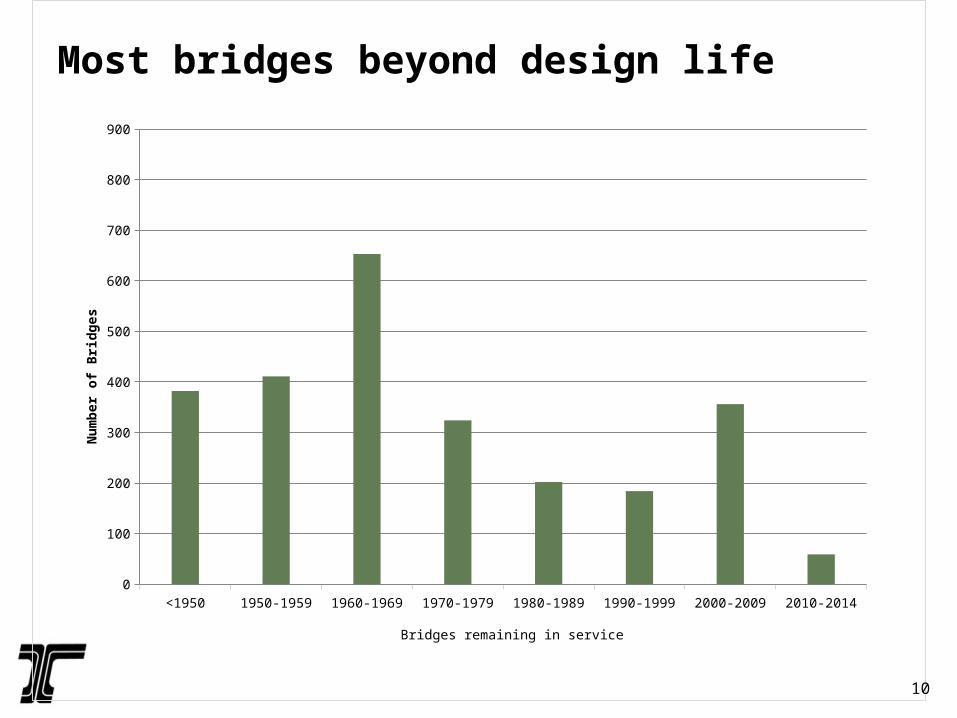
Most bridges beyond design life
<1950 1950-1959 1960-1969 1970-1979 1980-1989 1990-1999 2000-2009 2010-20140
100
200
300
400
500
600
700
800
900
Bridges remaining in service
Num
ber o
f Brid
ges
10
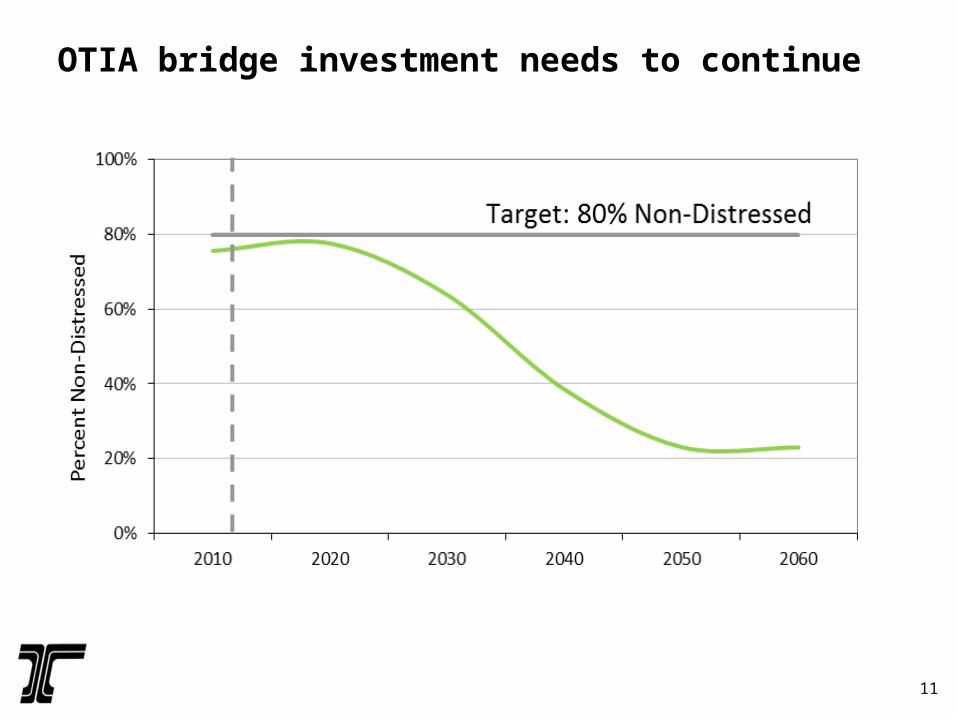
OTIA bridge investment needs to continue
11
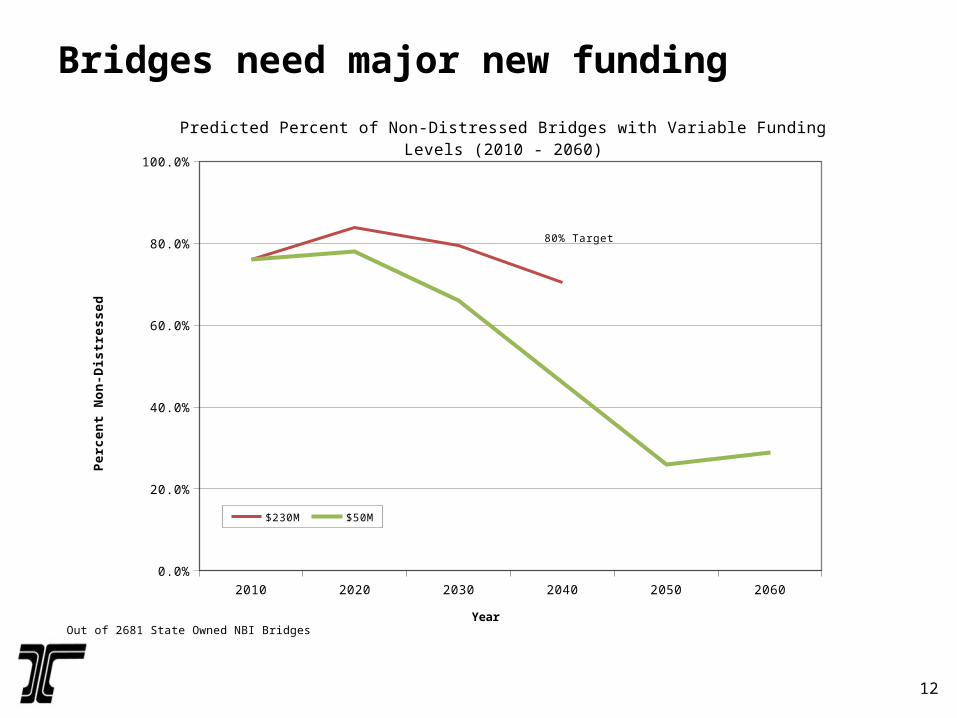
Bridges need major new funding
2010 2020 2030 2040 2050 20600.0%
20.0%
40.0%
60.0%
80.0%
100.0%
Predicted Percent of Non-Distressed Bridges with Variable Funding Levels (2010 - 2060)
$230M $50M
Year
Per
cen
t N
on
-Dis
tres
sed
Out of 2681 State Owned NBI Bridges
80% Target
12
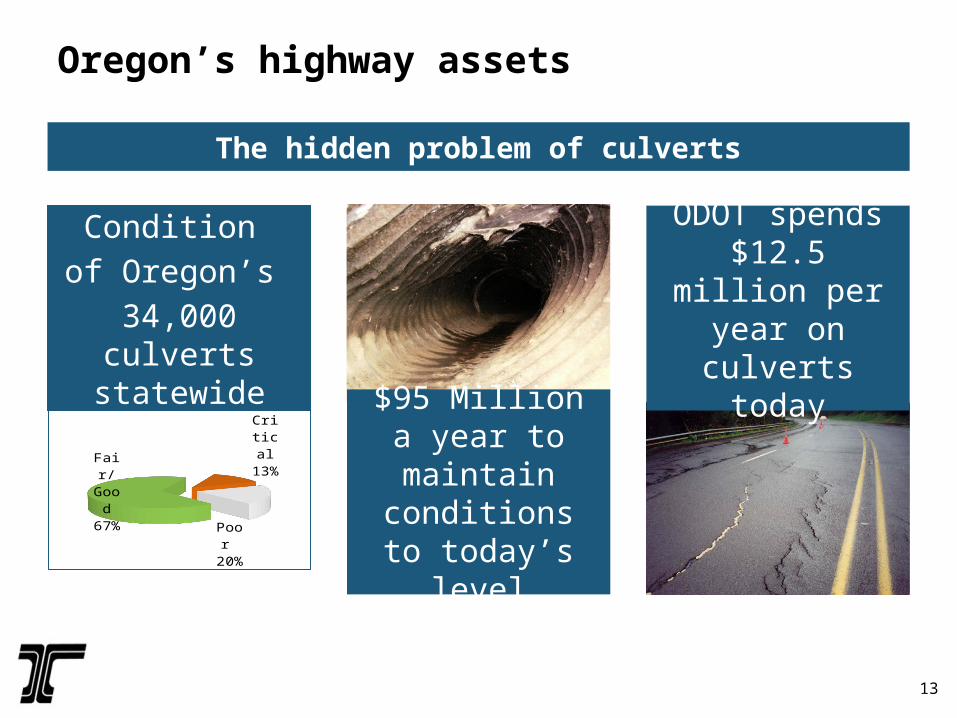
Crit-ical
13%
Poor 20%
Fair/Good 67%
Oregon’s highway assets
Condition
of Oregon’s
34,000 culverts statewide
ODOT spends $12.5 million per year on culverts
today
$95 Million a year to maintain
conditions to today’s level
The hidden problem of culverts
13
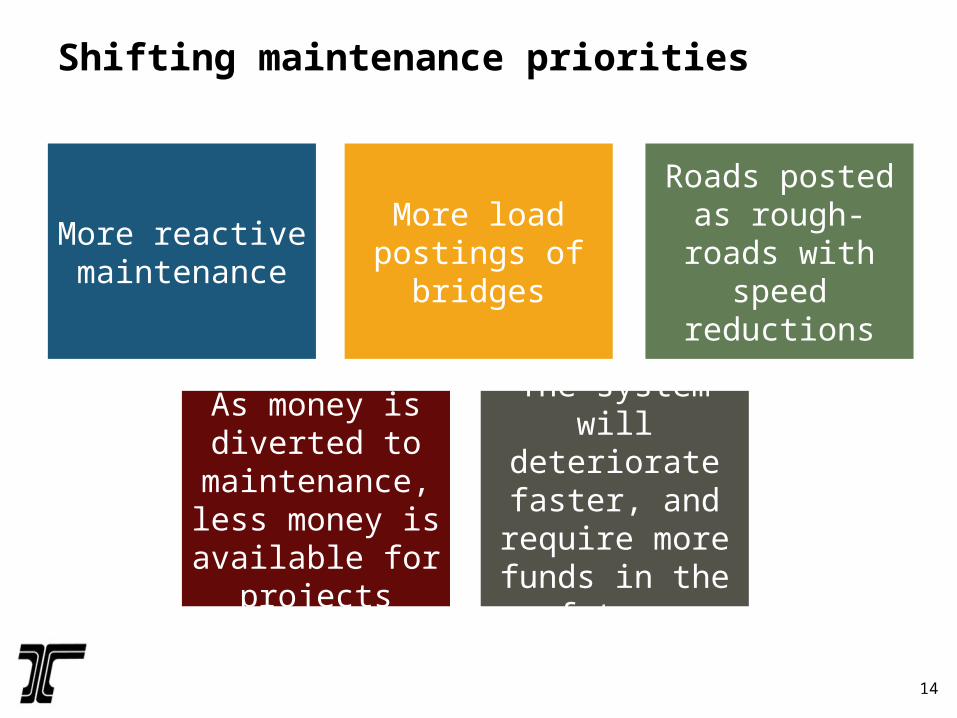
More reactive maintenance
More load postings of
bridges
Roads posted as rough-roads with speed reductions
As money is diverted to
maintenance, less money is available
for projects
The system will deteriorate faster, and require more
funds in the future
Shifting maintenance priorities
14
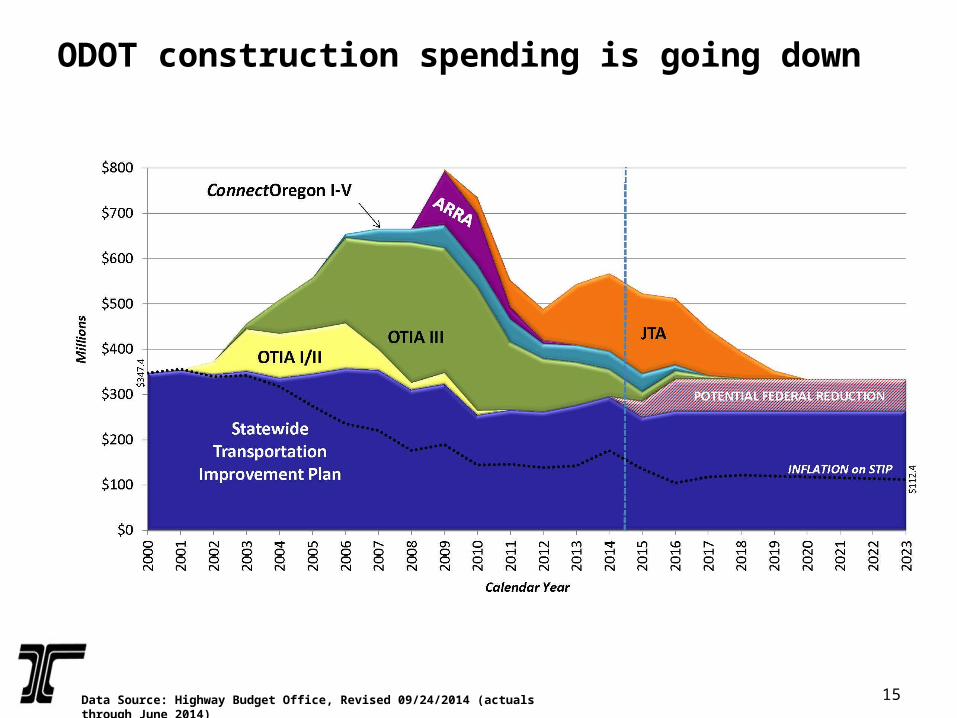
ODOT construction spending is going down
Data Source: Highway Budget Office, Revised 09/24/2014 (actuals through June 2014)
15
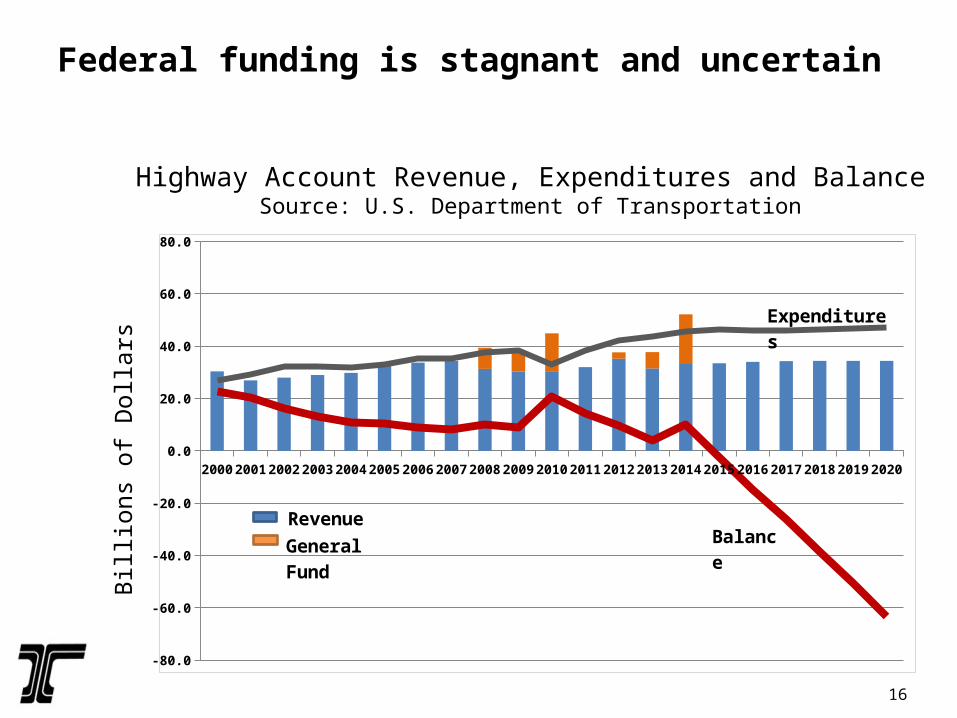
Federal funding is stagnant and uncertain
Bill
ions
of
Dol
lars
Highway Account Revenue, Expenditures and BalanceSource: U.S. Department of Transportation
2000 2001 2002 2003 2004 2005 2006 2007 2008 2009 2010 2011 2012 2013 2014 2015 2016 2017 2018 2019 2020
-80.0
-60.0
-40.0
-20.0
0.0
20.0
40.0
60.0
80.0
Balance
Expenditures
Revenue
General Fund
16
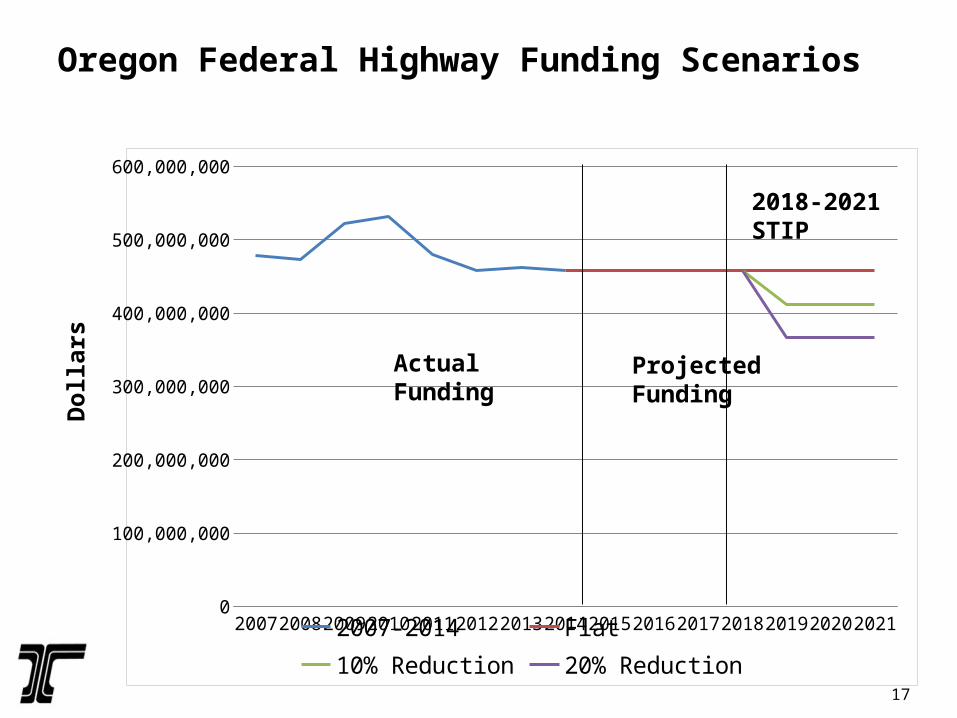
Oregon Federal Highway Funding ScenariosD
olla
rs
2007 2008 2009 2010 2011 2012 2013 2014 2015 2016 2017 2018 2019 2020 20210
100,000,000
200,000,000
300,000,000
400,000,000
500,000,000
600,000,000
2007-2014 Flat 10% Reduction 20% Reduction
Actual Funding Projected Funding
2018-2021 STIP
17
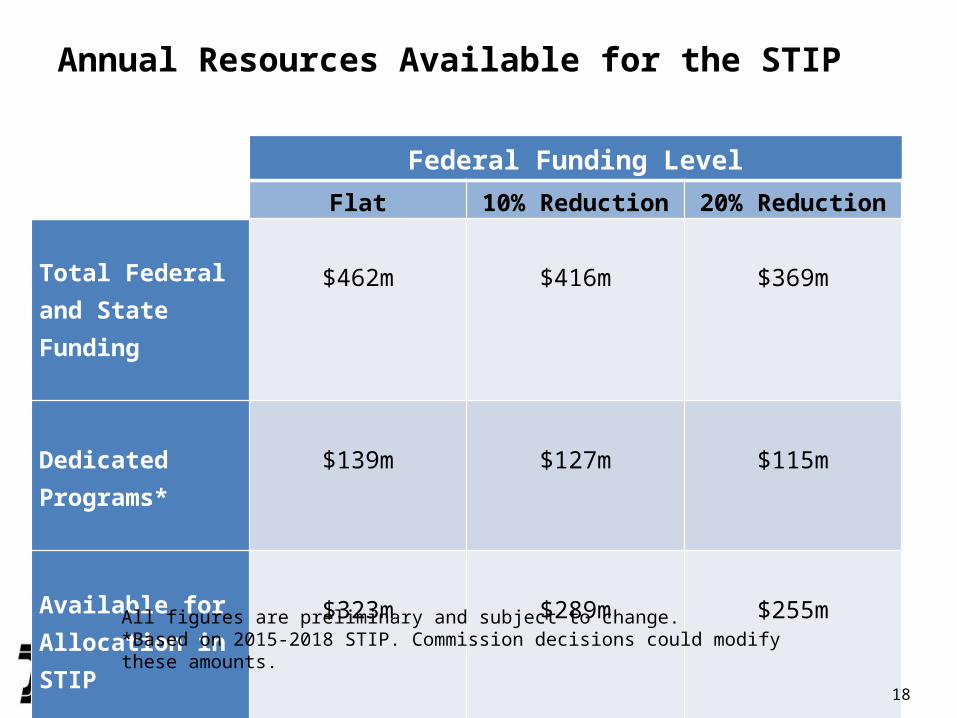
Annual Resources Available for the STIP
Federal Funding Level
Flat 10% Reduction 20% Reduction
Total Federal and State Funding
$462m
$416m
$369m
Dedicated Programs*
$139m
$127m
$115m
Available for Allocation in STIP
$323m
$289m
$255m
All figures are preliminary and subject to change.*Based on 2015-2018 STIP. Commission decisions could modify these amounts.
18
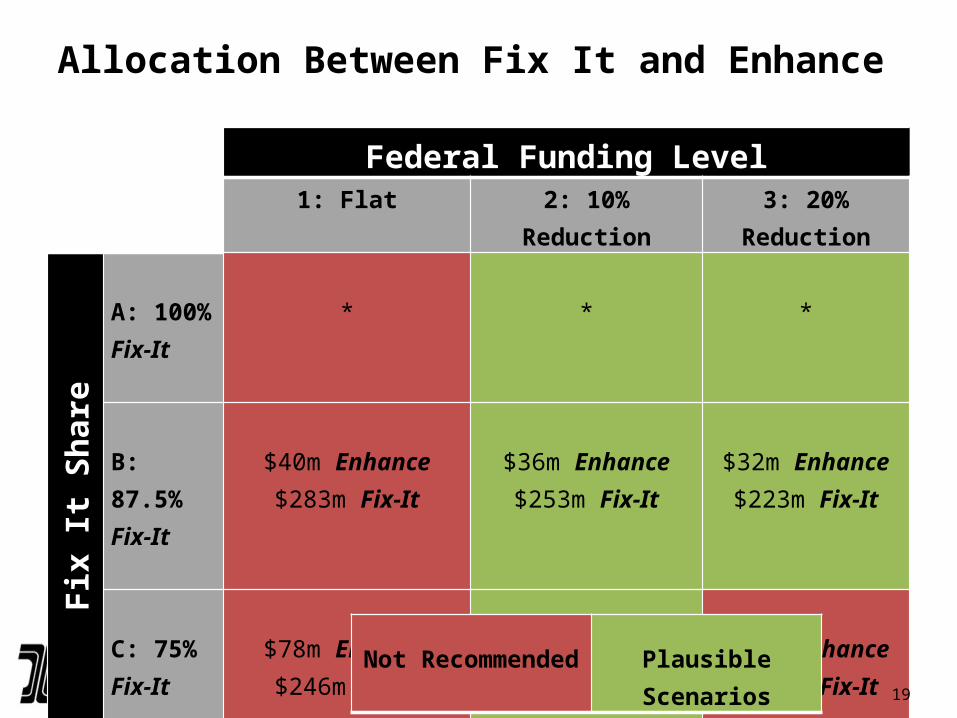
Allocation Between Fix It and Enhance
Federal Funding Level1: Flat 2: 10% Reduction 3: 20% Reduction
Fix It Share
A: 100% Fix-It
*
*
*
B: 87.5% Fix-It
$40m Enhance
$283m Fix-It
$36m Enhance
$253m Fix-It
$32m Enhance
$223m Fix-It
C: 75% Fix-It
$78m Enhance
$246m Fix-It
$72m Enhance
$216m Fix-It
$64m Enhance
$191m Fix-It
Not Recommended
Plausible Scenarios
19
Questions for OTC Consideration
What is our tolerance for risk with regard to federal funding?
How should available funding be allocated between Fix-It and Enhance?
If funding for Enhance is less than the 2015-2018 STIP, should the selection process be modified to account for the small amount of funding?
20