Embed Size (px)
Citation preview
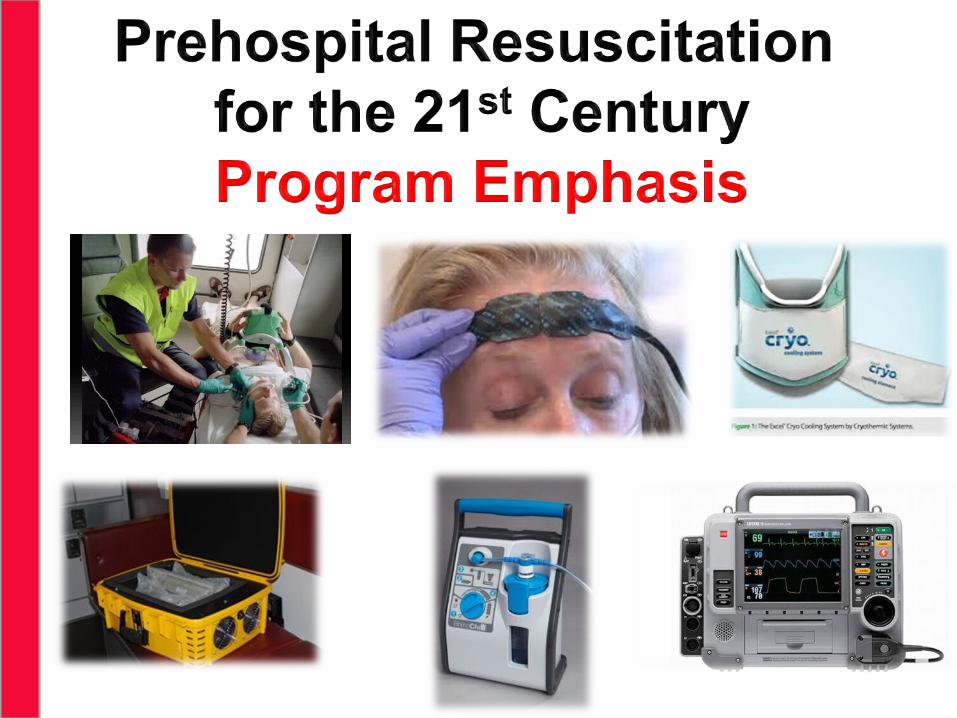
Presenter Disclosure Information
• Colby Rowe
• FINANCIAL DISCLOSURE:
• No relevant financial relationship exists
• No Unlabeled/Unapproved Uses in Presentation
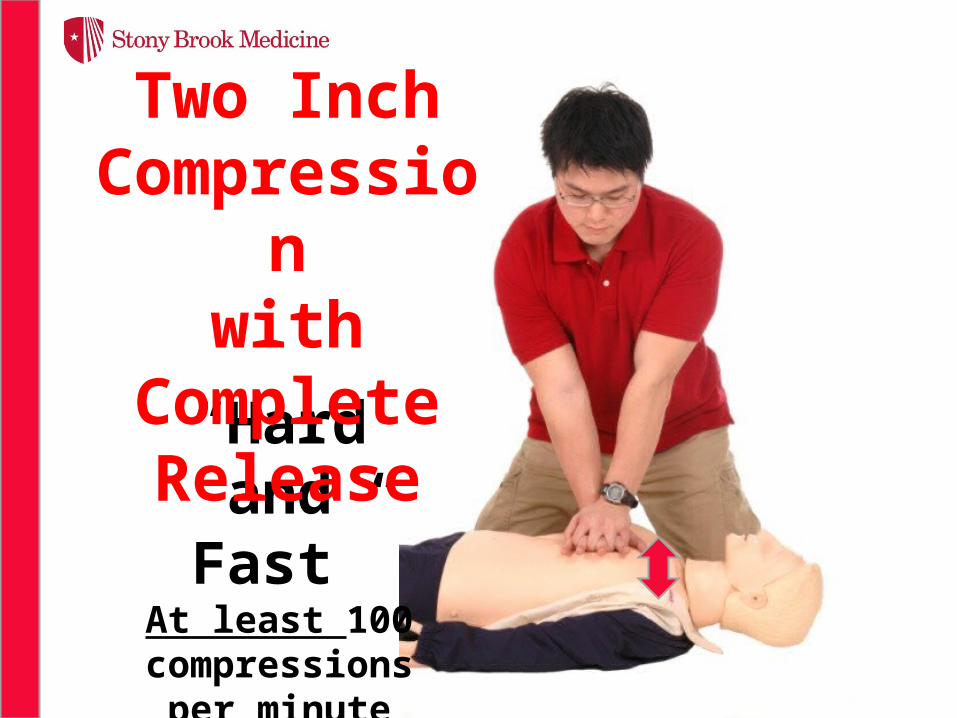
“Hard and
Fast”At least 100
compressions per minute
Two Inch Compressi
onwith
Complete Release
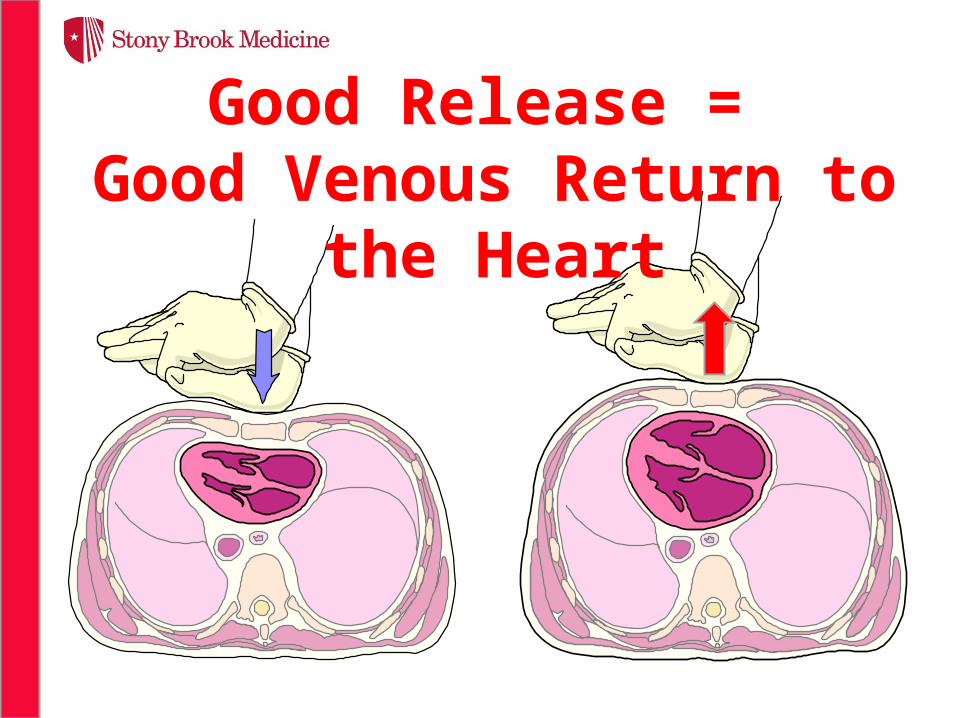
Good Release = Good Venous Return to
the Heart
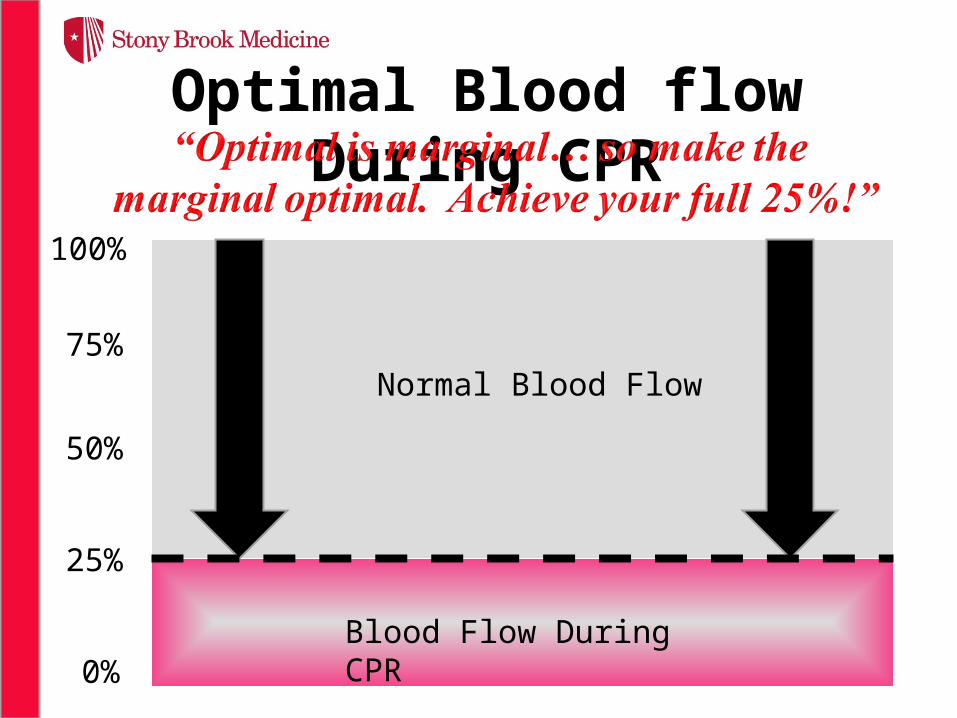
Optimal Blood flow During CPR
100%
25%
0%
50%
75%Normal Blood Flow
Blood Flow During CPR
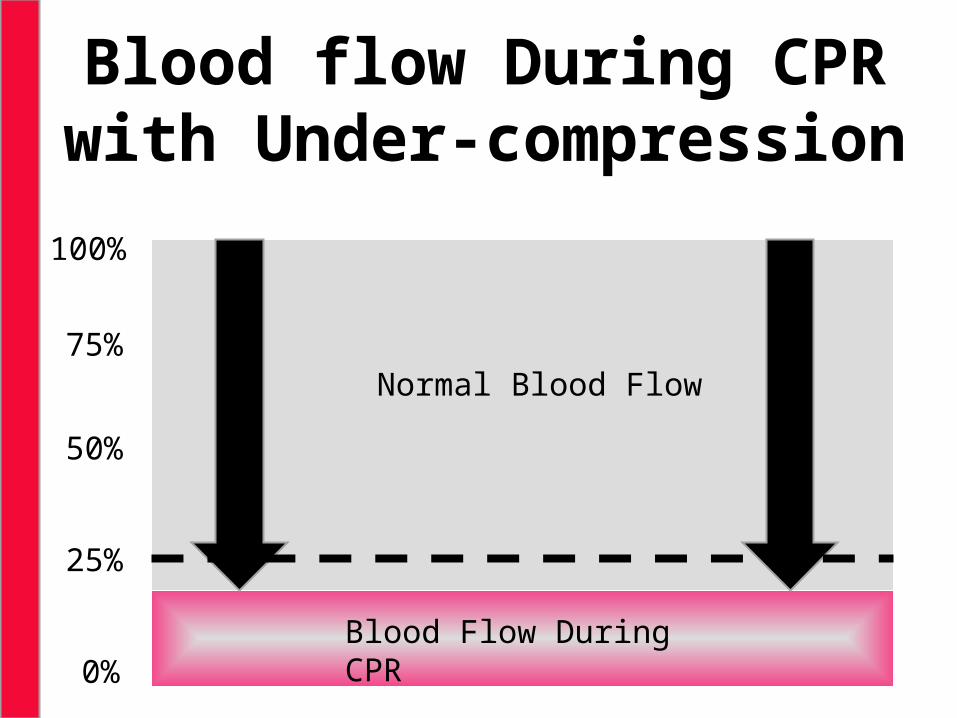
Blood flow During CPRwith Under-compression
0
Normal Blood Flow
Blood Flow During CPR
100%
25%
0%
50%
75%
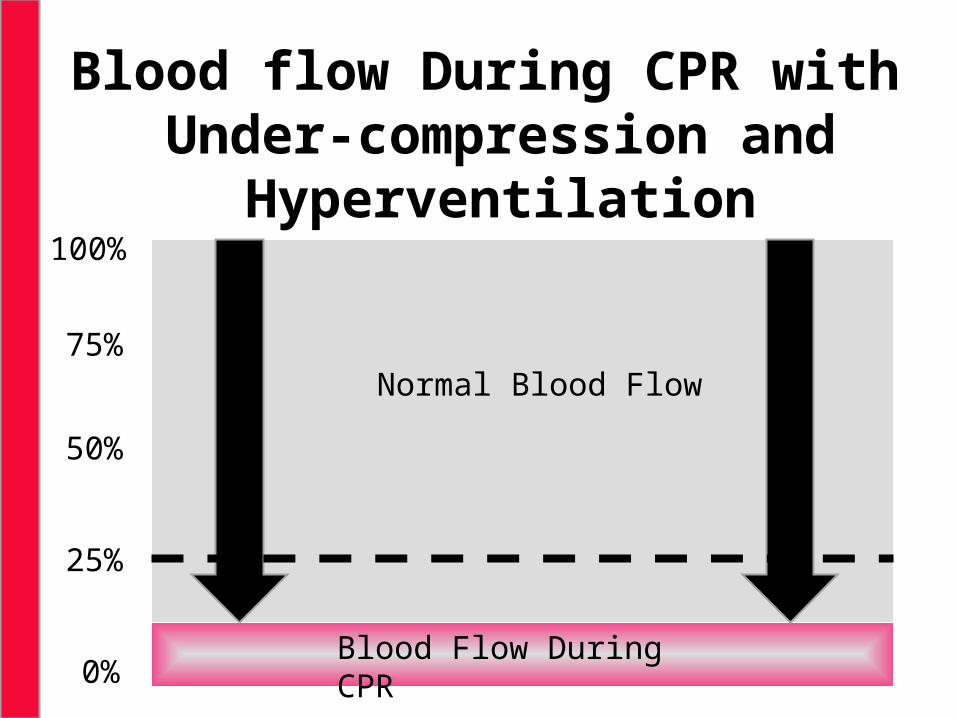
Blood flow During CPR with Under-compression and
Hyperventilation
0
Normal Blood Flow
Blood Flow During CPR
100%
25%
0%
50%
75%
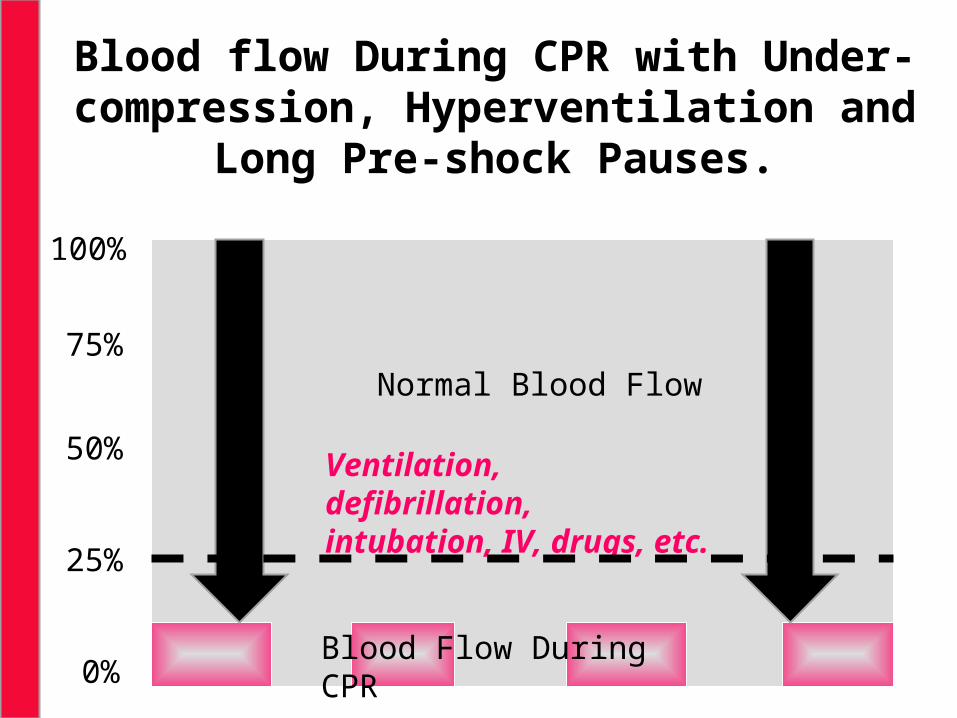
Blood flow During CPR with Under-compression, Hyperventilation and
Long Pre-shock Pauses.
100
25
0
50
75Normal Blood Flow
Blood Flow During CPR
Ventilation, defibrillation, intubation, IV, drugs, etc.
100%
25%
0%
50%
75%
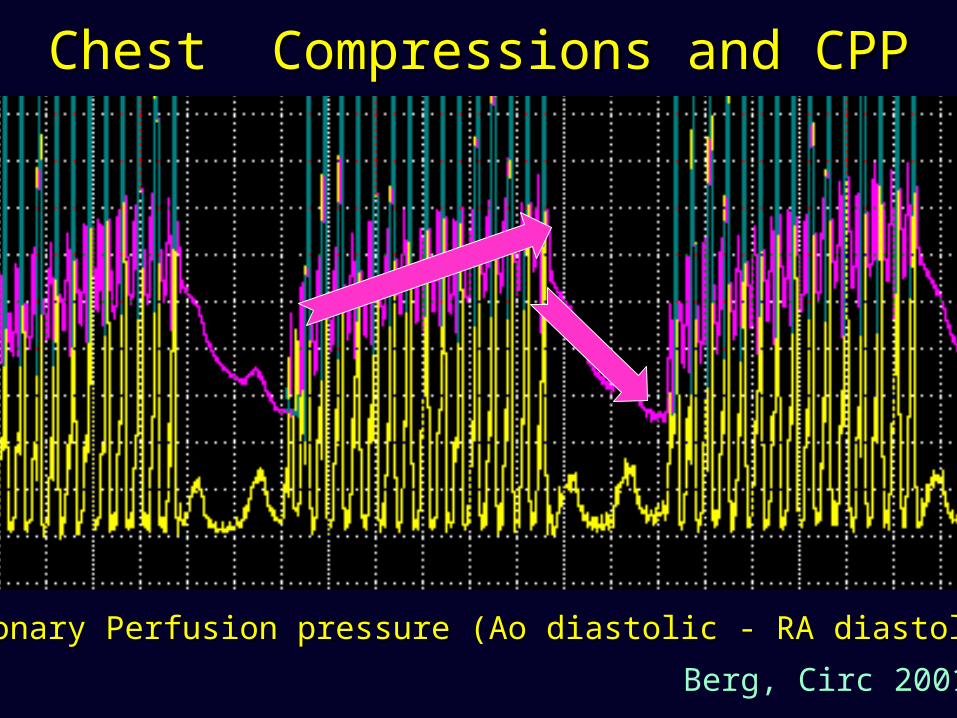
Coronary Perfusion pressure (Ao diastolic - RA diastolic)Coronary Perfusion pressure (Ao diastolic - RA diastolic)
Chest Compressions and CPPChest Compressions and CPP
Berg, Circ 2001
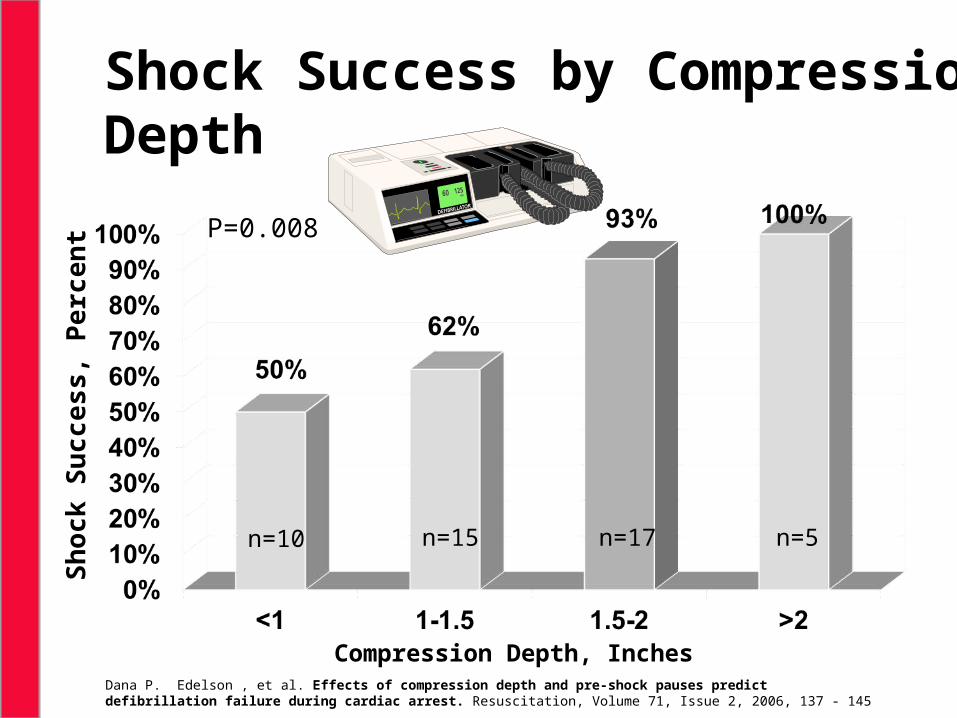
Shock Success by Compression Depth
Sh
ock
Su
cc
ess
, Pe
rcen
t
Compression Depth, Inches
n=10 n=5n=17n=15
P=0.008
Dana P. Edelson , et al. Effects of compression depth and pre-shock pauses predict defibrillation failure during cardiac arrest. Resuscitation, Volume 71, Issue 2, 2006, 137 - 145
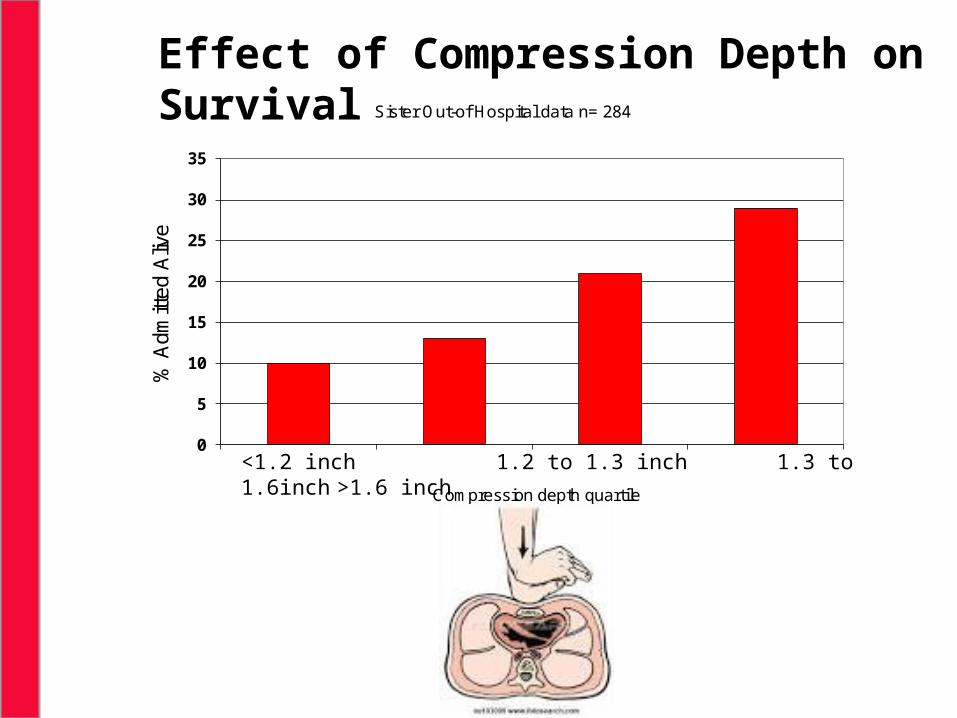
Effect of Compression Depth on Survival
0
5
10
15
20
25
30
35
1 2 3 4
% A
dmitt
ed A
live
Compression depth quartile
Sister Out-of Hospital data n= 284
<1.2 inch 1.2 to 1.3 inch 1.3 to 1.6inch >1.6 inch
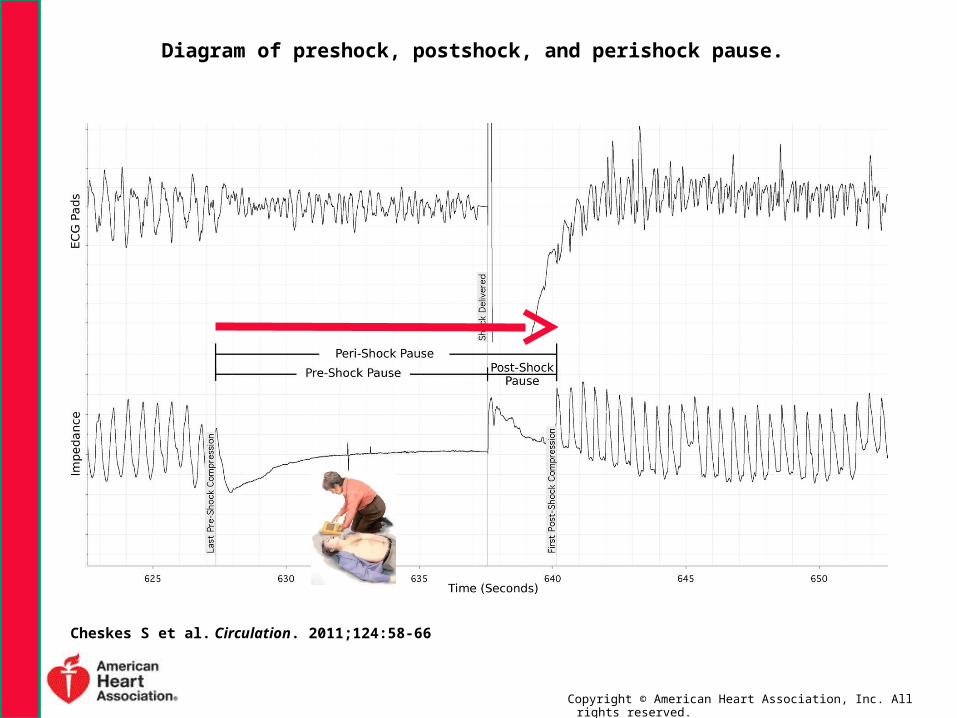
Diagram of preshock, postshock, and perishock pause.
Cheskes S et al. Circulation. 2011;124:58-66
Copyright © American Heart Association, Inc. All rights reserved.
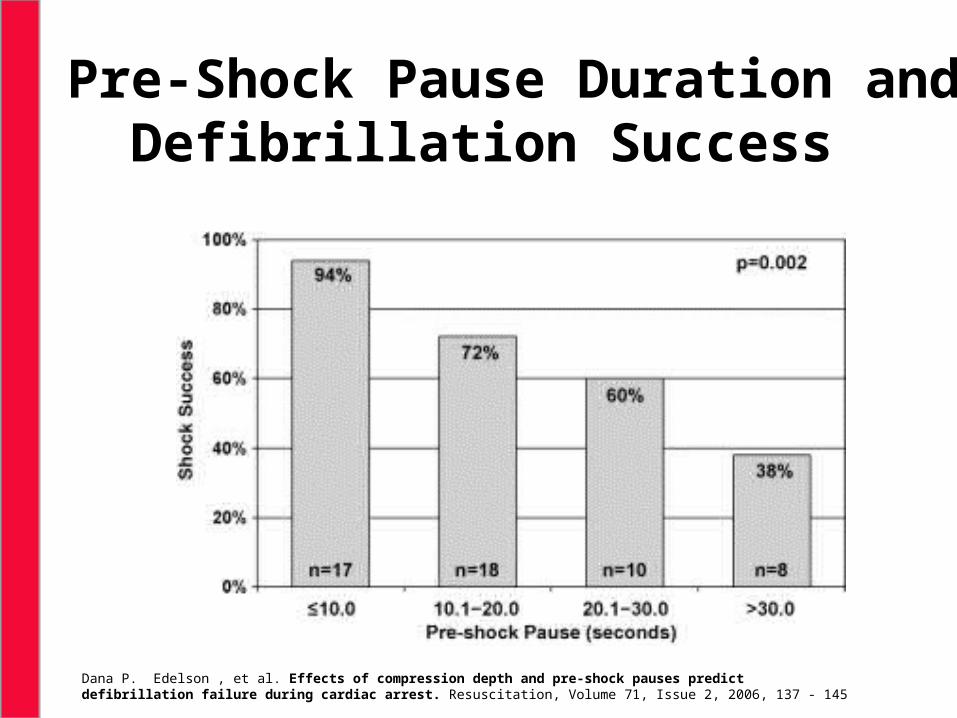
Association between pre-shock pause and shock success.
Cases are grouped by pre-shock pause in 10 s intervals. Note that longer pre-shock pauses are significantly associated with a smaller probability of shock success.
The quality of CPR prior to defibrillation directly affects clinical outcomes.
Specifically, longer pre-shock pauses and shallow chest compressions are associated with defibrillation failure.
Pre-Shock Pause Duration and Defibrillation Success
15
Dana P. Edelson , et al. Effects of compression depth and pre-shock pauses predict defibrillation failure during cardiac arrest. Resuscitation, Volume 71, Issue 2, 2006, 137 - 145
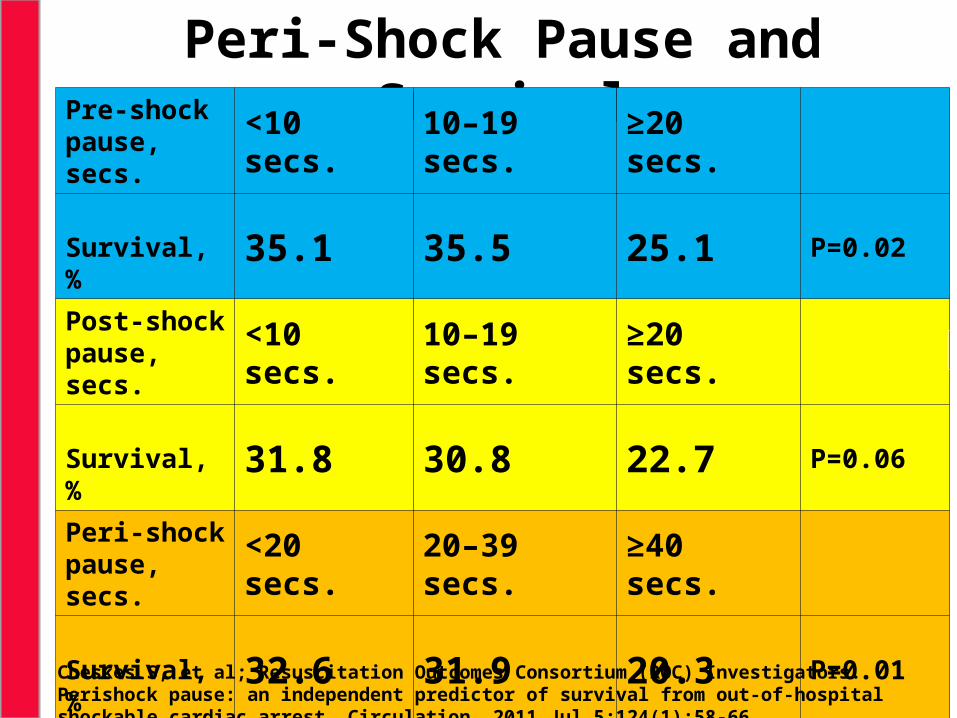
Peri-Shock Pause and SurvivalPre-shock
pause, secs.
<10 secs.
10–19 secs.
≥20 secs.
Survival, %
35.1 35.5 25.1 P=0.02
Post-shock pause, secs.
<10 secs.
10–19 secs.
≥20 secs.
Survival, %
31.8 30.8 22.7 P=0.06
Peri-shock pause, secs.
<20 secs.
20–39 secs.
≥40 secs.
Survival, %
32.6 31.9 20.3 P=0.01Cheskes S, et al; Resuscitation Outcomes Consortium (ROC) Investigators. Perishock pause: an independent predictor of survival from out-of-hospital shockable cardiac arrest. Circulation. 2011 Jul 5;124(1):58-66.
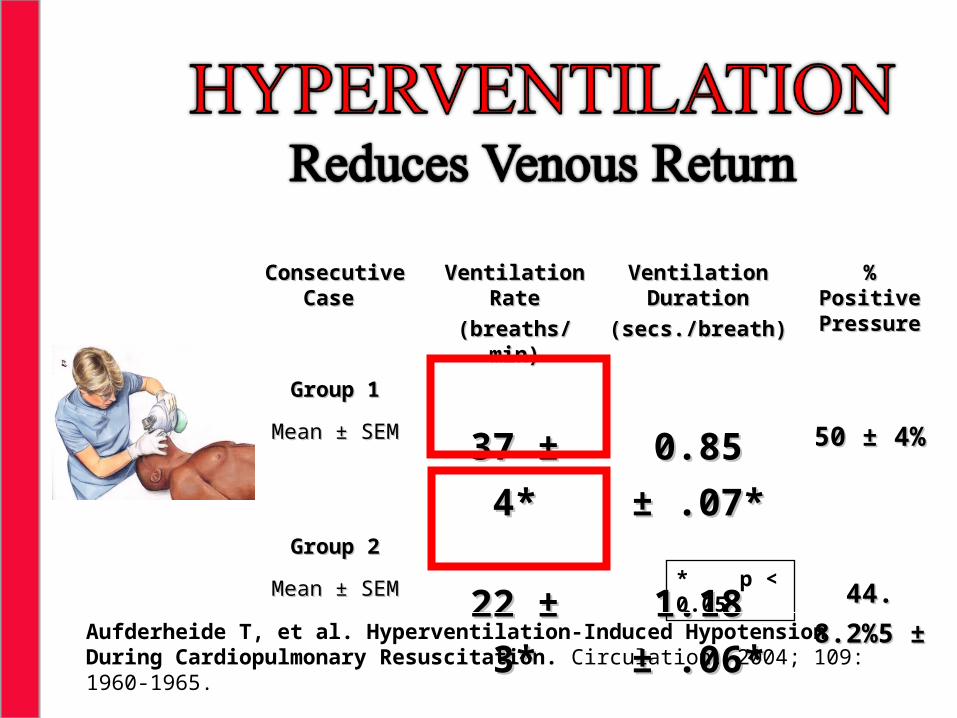
Consecutive Case Consecutive Case Ventilation Ventilation RateRate
(breaths/min)(breaths/min)
Ventilation Ventilation DurationDuration
(secs./breath)(secs./breath)
% Positive % Positive PressurePressure
Group 1Group 1
Mean Mean ± SEM± SEM37 37 ± 4*± 4* 0.85 0.85 ± .07*± .07* 50 50 ± 4± 4%%
Group 2Group 2
Mean Mean ± SEM± SEM22 22 ± 3*± 3* 1.18 1.18 ± .06*± .06* 44.44. 8.2 8.2%5 %5
±±* p < 0.05
Aufderheide T, et al. Hyperventilation-Induced Hypotension During Cardiopulmonary Resuscitation. Circulation. 2004; 109: 1960-1965.
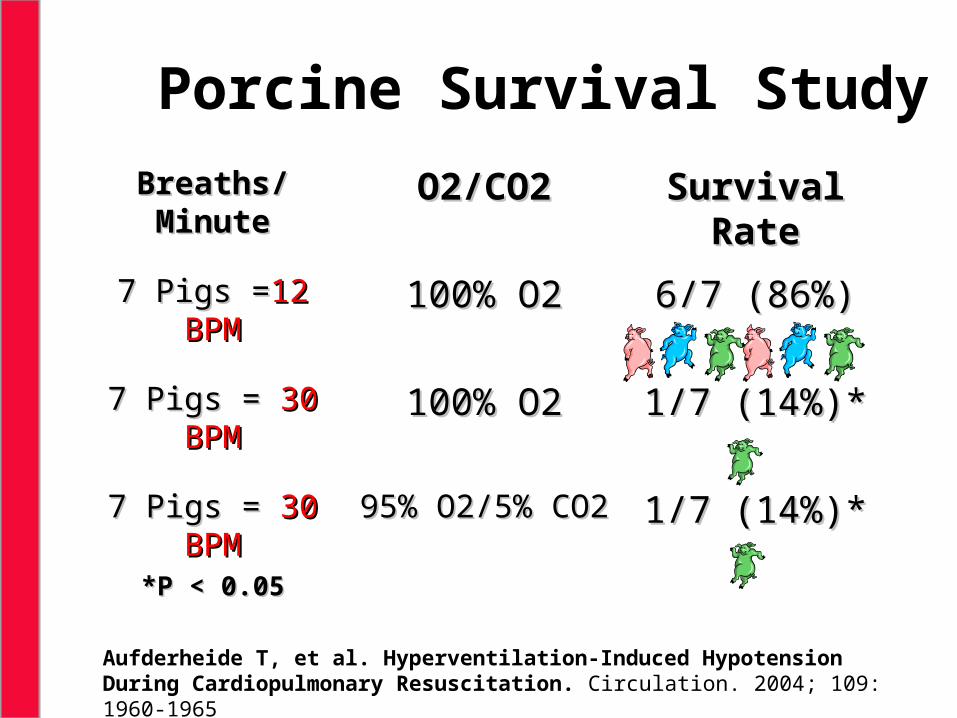
Porcine Survival Study
Breaths/MinuteBreaths/Minute O2/CO2O2/CO2 Survival RateSurvival Rate
7 Pigs =7 Pigs =12 BPM12 BPM 100% O2100% O2 6/7 (86%)6/7 (86%)
7 Pigs = 7 Pigs = 30 BPM30 BPM 100% O2100% O2 1/7 (14%)*1/7 (14%)*
7 Pigs = 7 Pigs = 30 BPM30 BPM*P < 0.05*P < 0.05
95% O2/5% CO295% O2/5% CO2 1/7 (14%)*1/7 (14%)*
Aufderheide T, et al. Hyperventilation-Induced Hypotension During Cardiopulmonary Resuscitation. Circulation. 2004; 109: 1960-1965
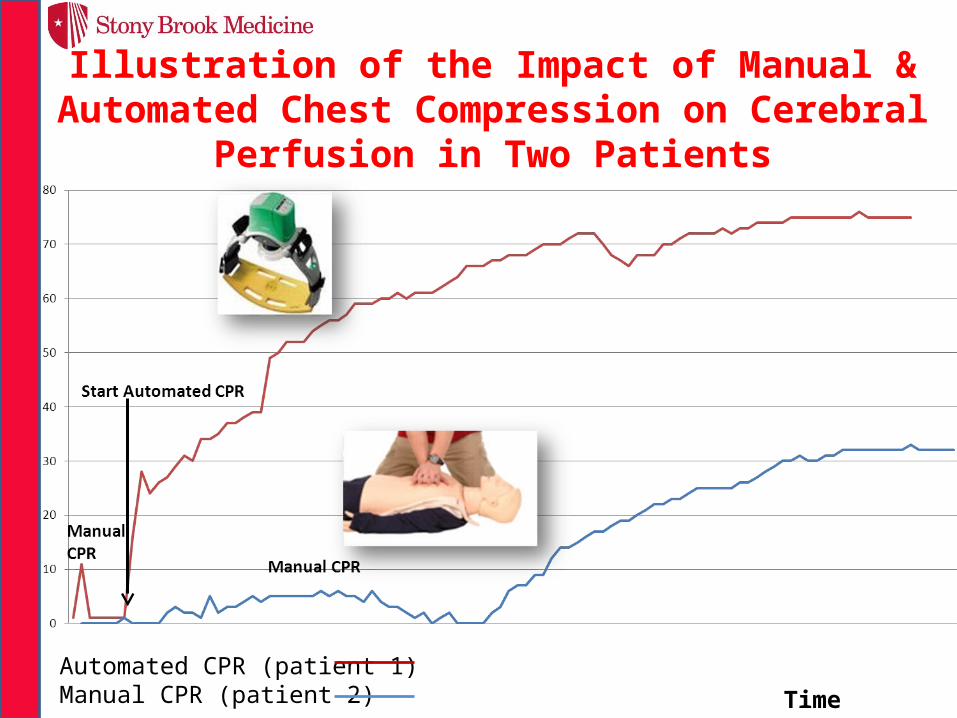
Time (mins)
% rS
O2
Illustration of the Impact of Manual & Automated Chest Compression on Cerebral Perfusion in Two Patients
Automated CPR (patient 1) Manual CPR (patient 2)
0
20
40
60
80
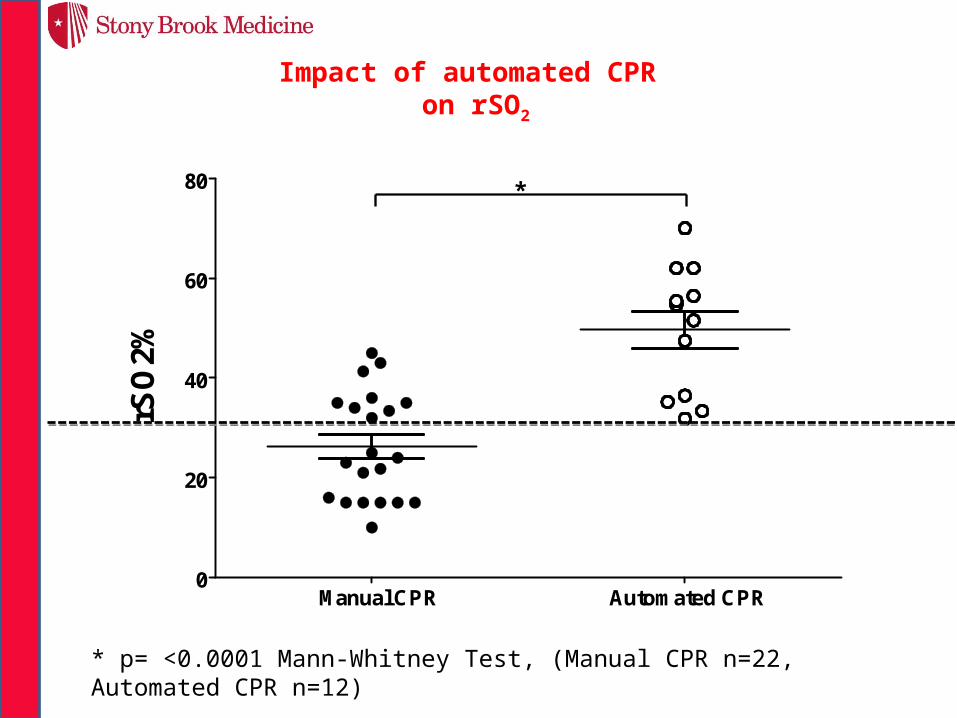
rSO
2%
Manual CPR Automated CPR
Impact of automated CPR on rSO2
*
* p= <0.0001 Mann-Whitney Test, (Manual CPR n=22, Automated CPR n=12)
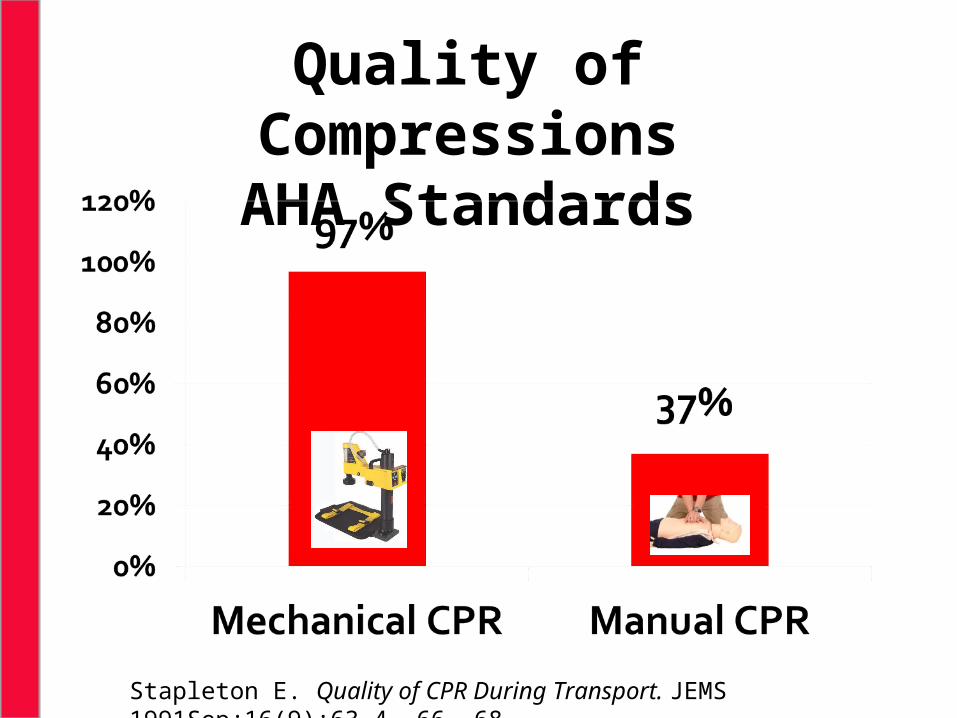
Quality of CompressionsAHA Standards
Stapleton E. Quality of CPR During Transport. JEMS 1991Sep;16(9):63-4, 66, 68
Manual CPR Automated CPR
*
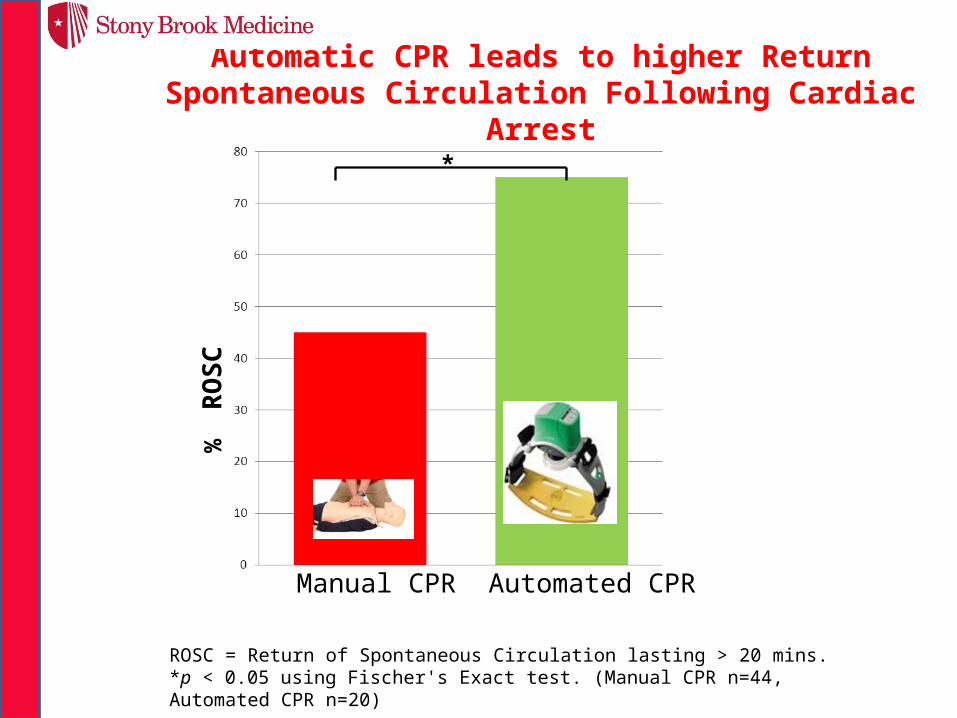
ROSC = Return of Spontaneous Circulation lasting > 20 mins. *p < 0.05 using Fischer's Exact test. (Manual CPR n=44, Automated CPR n=20)
% R
OSC
Automatic CPR leads to higher Return Spontaneous Circulation Following Cardiac Arrest
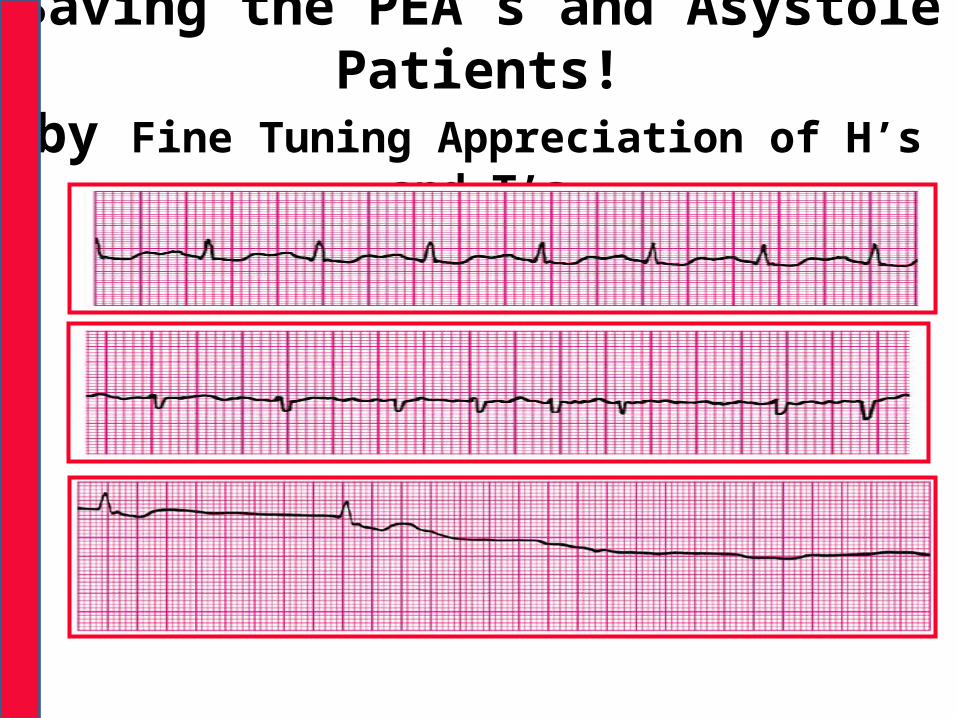
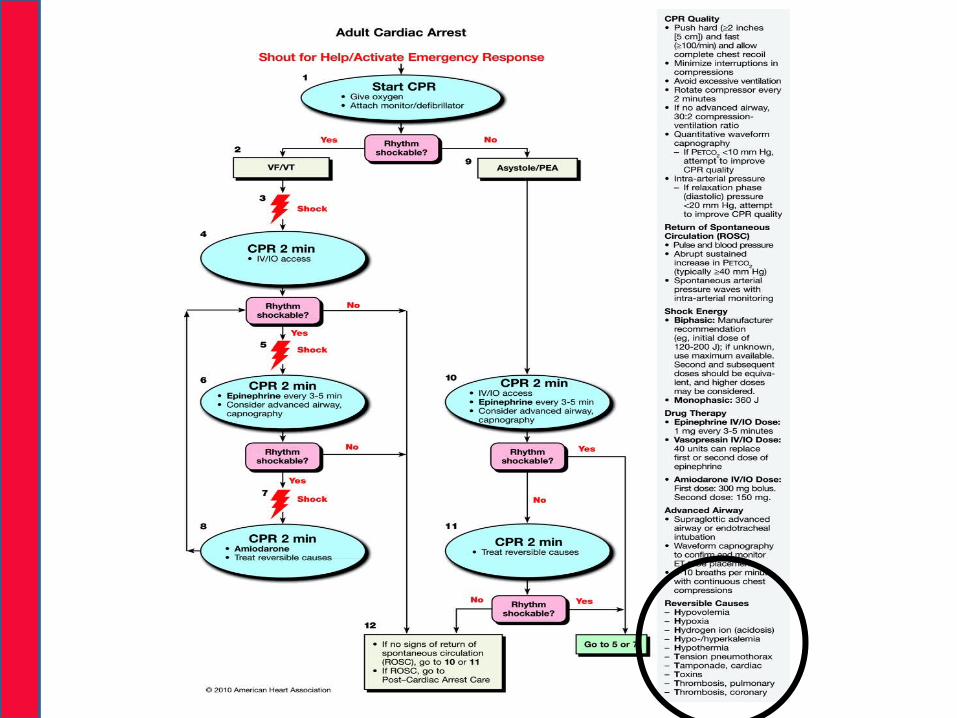
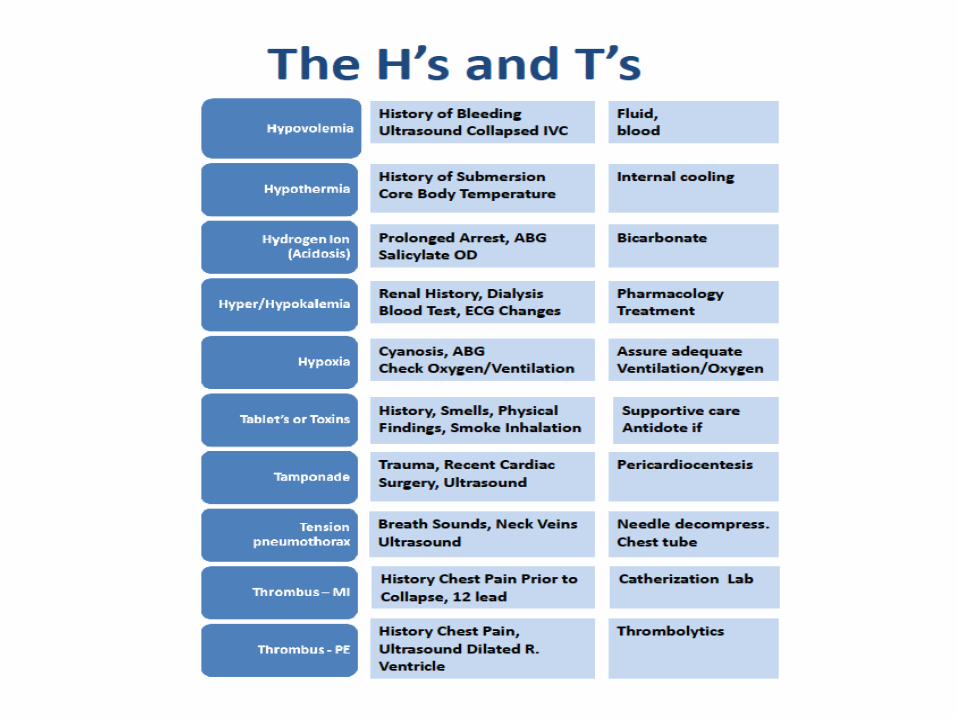
Saving the PEA’s and Asystole Patients!by Fine Tuning Appreciation of H’s and T’s
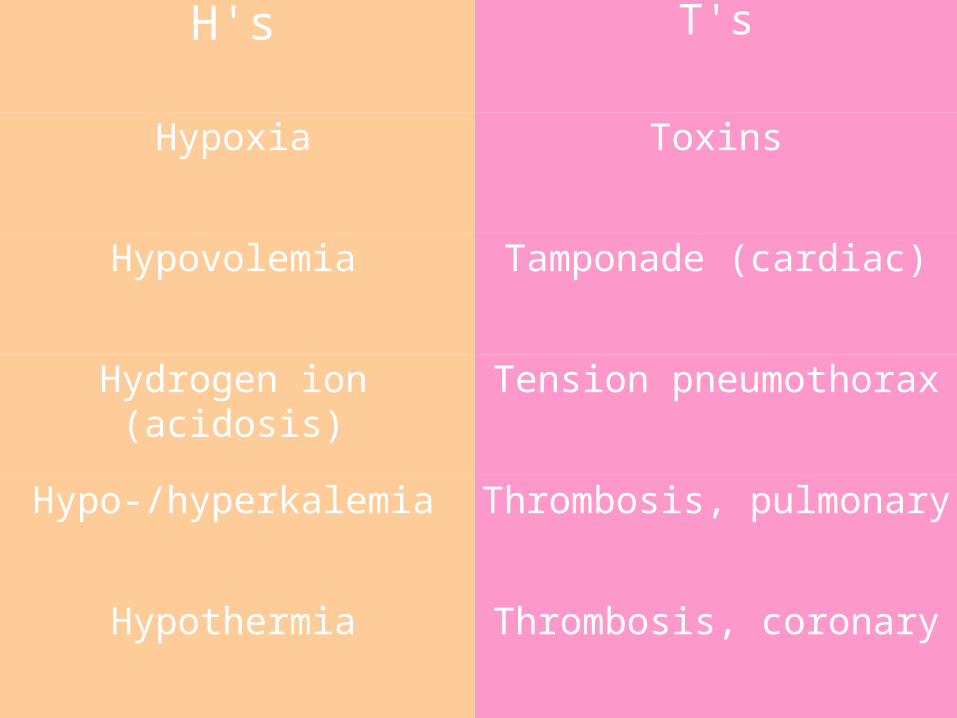
H's T's
Hypoxia Toxins
Hypovolemia Tamponade (cardiac)
Hydrogen ion (acidosis) Tension pneumothorax
Hypo-/hyperkalemia Thrombosis, pulmonary
Hypothermia Thrombosis, coronary
What can Prehospital Providers do for H’s and T’s anyway?
• Decompress Tension Pneumothorax• Pericardiocentesis• Volume• Toxicology Antidotes• Treatment of Hyper/Hypokalemia
• Early notification• “Trauma system strategy”• “12 Lead ECG strategy”
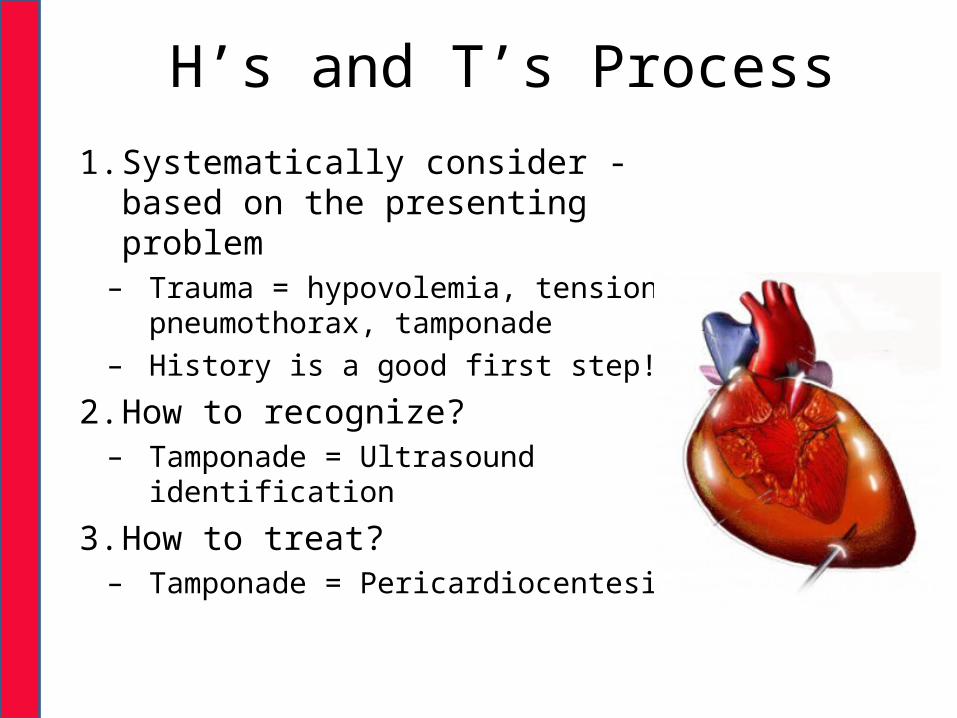
H’s and T’s Process
1. Systematically consider - based on the presenting problem
– Trauma = hypovolemia, tension pneumothorax, tamponade
– History is a good first step!
2. How to recognize?– Tamponade = Ultrasound
identification
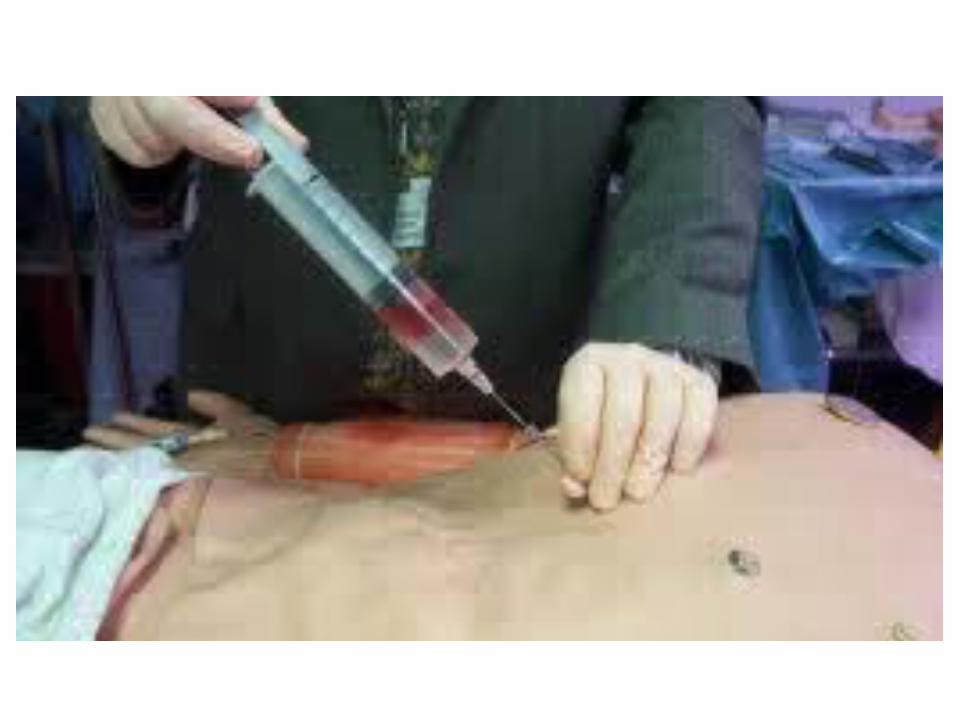
3. How to treat?– Tamponade = Pericardiocentesis
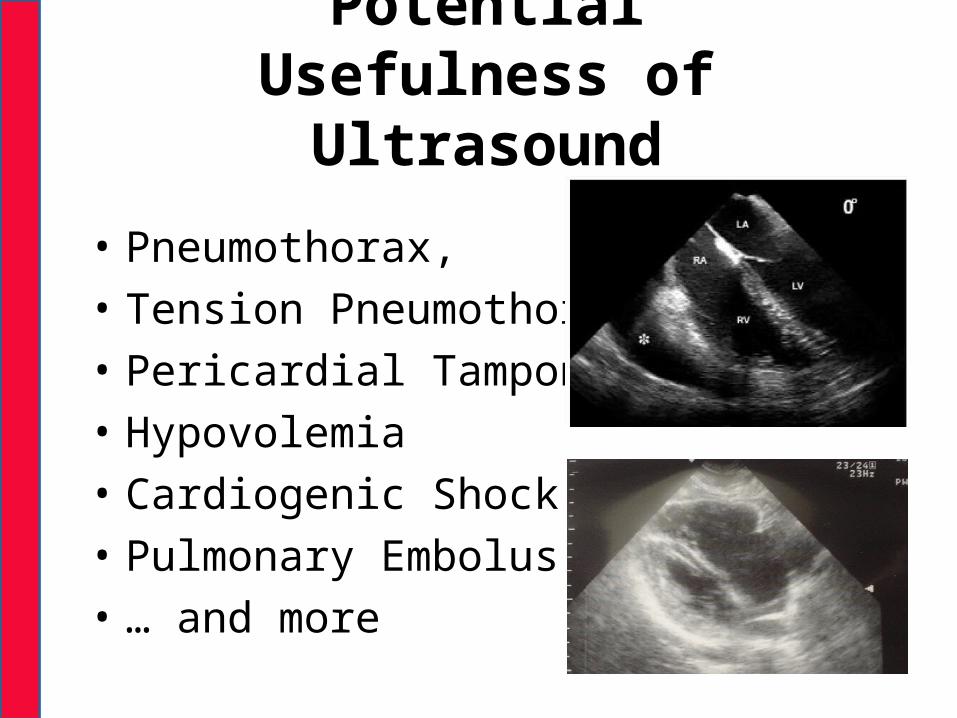
PotentialUsefulness of Ultrasound
• Pneumothorax, • Tension Pneumothorax• Pericardial Tamponade• Hypovolemia• Cardiogenic Shock• Pulmonary Embolus• … and more

Thank you!