Embed Size (px)
Citation preview
Pressure drop of HFC refrigerants insideevaporator and condenser coils as
determined by CFD
S.J. Smith*, L. Shao, S.B. Riffat
Institute of Building Technology, School of the Built Environment,
University of Nottingham, University Park, Nottingham NG7 2RD, UK
Accepted 19 April 2001
Abstract
This paper presents pressure-drop data for inside evaporator and condenser coils of refrig-eration and air conditioning systems using hydrofluorocarbon (HFC) refrigerants and blends.
Computational fluid dynamics (CFD) was used to simulate the two-phase flows of differentrefrigerants through two types of coil common to the evaporator and condenser componentsfound in a typical vapour-compression system. A comparison of single-phase and two-phase
flows is made with respect to pressure drop across the evaporator, firstly at constant tem-perature for single-phase saturated vapour, and secondly at increasing temperature withvarying components such as density and viscosity for two-phase vapour. Pressure losses ofHFC refrigerants and blends were compared with data for conventional refrigerants and data
provided by other researchers. # 2001 Elsevier Science Ltd. All rights reserved.
1. Introduction
Chlorofluorocarbons (CFCs) have been widely used in refrigeration and air-con-ditioning systems. The Montreal Protocol has agreed that these refrigerants shouldbe phased out and new ‘‘ozone-friendly’’ refrigerants to CFCs are being developedas replacements. Hydrofluorocarbon (HFC) refrigerants, such as R134a and zeo-tropic refrigerant mixtures such as R407C have been introduced to replace R12 andR22, respectively.
Applied Energy 70 (2001) 169–178
www.elsevier.com/locate/apenergy
0306-2619/01/$ - see front matter # 2001 Elsevier Science Ltd. All rights reserved.
PI I : S0306-2619(01 )00022 -8
* Corresponding author. Tel.: +44-115-846-6042; fax: +44-115-951-3159.
E-mail address: [email protected] (S.J. Smith).
The literature contains little information about pressure drops of HFC refrigerantflows through evaporator and condenser heat-exchanger coils. Experimental workon heat and pressure-drop characteristics of HFC refrigerant mixtures (e.g. R32/R125/R134a/R143a) inside horizontal enhanced-surface tubing has been carried outby Sami and Song [1]. Other researchers [2] have compared thermal performances
Nomenclature
�P pressure loss (Pa)� density of refrigerant (kg/m3)Re Reynolds number (m3/kg)Dc spiral coil diameter (m)f single-phase flow friction factor� kinematic viscosity of refrigerant (m2/s)x vapour qualityðdP=dLÞ frictional pressure drop for two-phase flow (Pa)Xt Lockhart–Martinelli coefficientCo total bend loss-coefficientu mean velocity of refrigerant (m/s)D pipe diameter (m)L coil length (m)k roughness coefficientGr mass velocity of refrigerant (kg/m2s)� void fraction� dynamic viscosity of refrigerant (kg/ms)
Subscriptsgs geometric S-shapedm due to momentum changeL for liquids S-shaped coilgc geometric spiralv for vapourF due to frictionc spiral coil
RefrigerantsR12 dichlorodifluoromethane (CH2Cl2F2)R717 ammonia (NH3)R32 difluoromethane (CH2F2)R134a tetrafluoroethane (CH2FCF3)R407B blend R3210%+R12570%+R134a20%R407C blend R3223%+R12525%+R134a52%R125 pentafluoroethane (CHF2CF3)
170 S.J. Smith et al. / Applied Energy 70 (2001) 169–178
and pressure losses in evaporators and condensers of vehicle air-conditioning sys-tems when R12 is replaced with R134a.In order to achieve optimum performance, an accurate design technique is neces-
sary for the prediction of refrigerant pressure-drops and flow-patterns through theevaporator, condenser and other heat exchangers used in refrigeration and air con-ditioning systems. Computational fluid dynamics (CFD) can be used as a design toolto estimate or enhance our understanding of pressure losses in coils prior to con-struction. The CFD would allow different types of working fluids and coils of variousgeometries to be examined. This paper is concerned with the application of CFDmodelling to predict pressure losses in evaporator and condenser coils using conven-tional and new refrigerants including R12, R717, R32, R407A and R407C.
2. Theory
2.1. Description of a vapour-compression system
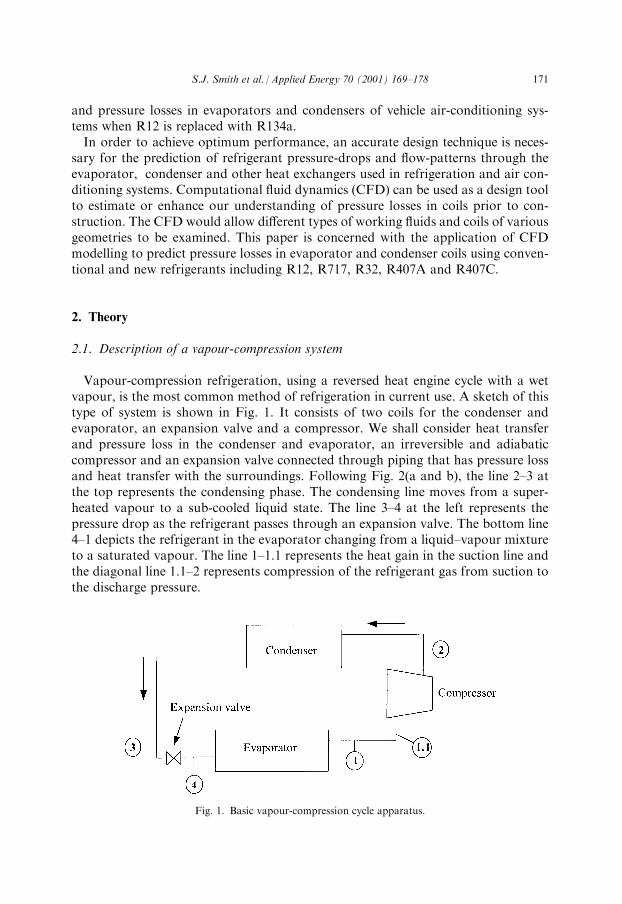
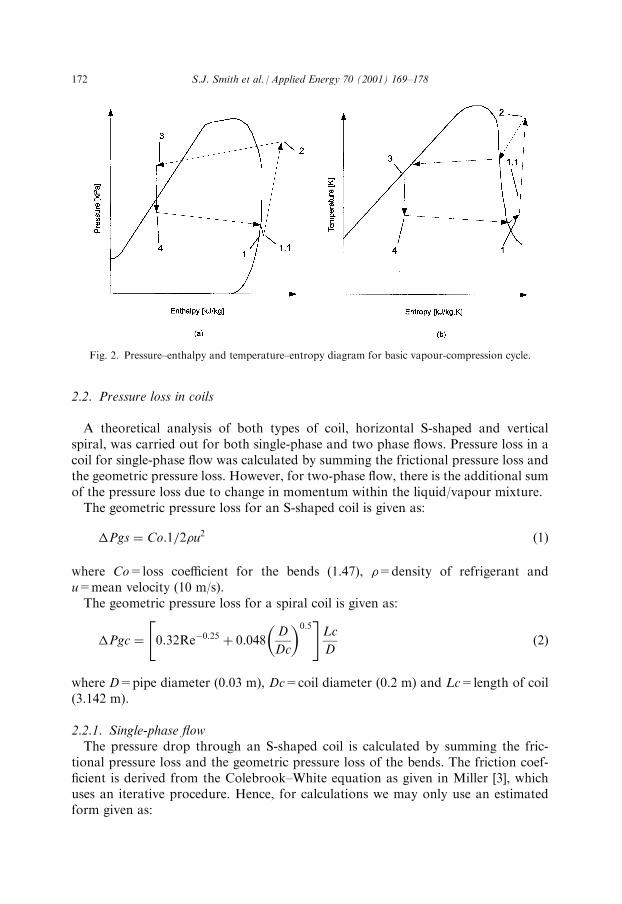
Vapour-compression refrigeration, using a reversed heat engine cycle with a wetvapour, is the most common method of refrigeration in current use. A sketch of thistype of system is shown in Fig. 1. It consists of two coils for the condenser andevaporator, an expansion valve and a compressor. We shall consider heat transferand pressure loss in the condenser and evaporator, an irreversible and adiabaticcompressor and an expansion valve connected through piping that has pressure lossand heat transfer with the surroundings. Following Fig. 2(a and b), the line 2–3 atthe top represents the condensing phase. The condensing line moves from a super-heated vapour to a sub-cooled liquid state. The line 3–4 at the left represents thepressure drop as the refrigerant passes through an expansion valve. The bottom line4–1 depicts the refrigerant in the evaporator changing from a liquid–vapour mixtureto a saturated vapour. The line 1–1.1 represents the heat gain in the suction line andthe diagonal line 1.1–2 represents compression of the refrigerant gas from suction tothe discharge pressure.
Fig. 1. Basic vapour-compression cycle apparatus.
S.J. Smith et al. / Applied Energy 70 (2001) 169–178 171
2.2. Pressure loss in coils
A theoretical analysis of both types of coil, horizontal S-shaped and verticalspiral, was carried out for both single-phase and two phase flows. Pressure loss in acoil for single-phase flow was calculated by summing the frictional pressure loss andthe geometric pressure loss. However, for two-phase flow, there is the additional sumof the pressure loss due to change in momentum within the liquid/vapour mixture.The geometric pressure loss for an S-shaped coil is given as:
�Pgs ¼ Co:1=2�u2 ð1Þ
where Co=loss coefficient for the bends (1.47), �=density of refrigerant andu=mean velocity (10 m/s).The geometric pressure loss for a spiral coil is given as:
�Pgc ¼ 0:32Re�0:25 þ 0:048D
Dc
� �0:5" #Lc
Dð2Þ
where D=pipe diameter (0.03 m), Dc=coil diameter (0.2 m) and Lc=length of coil(3.142 m).
2.2.1. Single-phase flowThe pressure drop through an S-shaped coil is calculated by summing the fric-
tional pressure loss and the geometric pressure loss of the bends. The friction coef-ficient is derived from the Colebrook–White equation as given in Miller [3], whichuses an iterative procedure. Hence, for calculations we may only use an estimatedform given as:
Fig. 2. Pressure–enthalpy and temperature–entropy diagram for basic vapour-compression cycle.
172 S.J. Smith et al. / Applied Energy 70 (2001) 169–178
f ¼ 0:25= logk
3:7Dþ5:74
Re0:9
� �� �2ð3Þ
where D=pipe diameter (0.015 m), f=friction coefficient, k=roughness factor(�0.0025 mm) and Re=Reynolds number.Using Eqs. (1) and (3), the pressure loss through both coils can be estimated as:
�P ¼fLs;c�u
2
2D
� �þ�Pgs;c ð4Þ
where Ls=length of coil (5.6 m).
2.2.2. Two-phase flowThe pressure drop across an S-shaped coil with two-phase flow is given by friction,
momentum change within the liquid/vapour mixture and the geometric arrangementof the coil. The pressure loss due to the liquid/vapour mixture as given in Eq. (7)correlated well with experimental results as given in Miyara et al. [4].
�Pm ¼ ��Gr2x2
��vþGr2ð1� xÞ2
ð1� �Þ�L
� �ð5Þ
where � is the void fraction that can be calculated from Smith’s [5] equation:
� ¼ x xþ�v�L
1� xð Þ 0:4þ 0:6x�L=�v þ 0:4 1� xð Þ
xþ 0:4 1� xð Þ
� �0:5( )" #�1
ð6Þ
where x=vapour quality, Gr=mass velocity of refrigerant, �v and �L=densities ofrefrigerant vapour and liquid, respectively.Using Soliman’s [6] equation, the frictional pressure-drop through both types of
coils can be calculated by:
�Pf ¼ Lð1þ 2:85X0:523t Þ2 dP
dL
� �v
ð7Þ
where ðdP=dLÞF is the frictional pressure-drop for the two-phase flow. The frictionalpressure drop for the vapour flow ðdP=dLÞv is calculated by:
dP
dL
� �v
¼2fvGr
2x2
D�vð8Þ
and Xt ¼1� x
x
� �0:9 �v�L
� �0:5 �v
�L
� �0:1ð9Þ
S.J. Smith et al. / Applied Energy 70 (2001) 169–178 173
and fv ¼ 0:046=Re�0:2v ð10Þ
Therefore, from Eqs. (1), (2), (7) and (9), the pressure drop across both types of coilwith two-phase flow is given as:
�Ps;c ¼ �Pgs;c þ�Pm þ�Pf ð11Þ
3. CFD simulation
The CFD prediction was produced using the commercially-available FLUENT [7]package. The Reynolds stress terms in the averaged Navier-Stokes equations werecomputed using the standard two equation k� " model and wall functions wereused in areas of low Reynolds number, i.e. close to the walls. Discretisation isemployed as an extension to the Upwind Scheme [8]; the QUICK Scheme [9] com-putes the face value of an unknown based on the values stored at the two adjacentcell centres and a third cell centre at an additional upstream point.Upstream and downstream lengths were of the order of 20 diameters to allow the
flow to develop fully within the entrance length, and recover after the coil.The PREBFC (body fitted co-ordinate) pre-processor was used to construct the
geometry and grid for each coil. The pre-processor allowed construction of smoothedcurves without need for a high number of cells to achieve the desired smoothness. Thisis a feature that FLUENT [7] lacks due to the Cartesian co-ordinate system used tocreate the grid which requires a large number of cells to create smooth curves.
4. Results and discussion
A comparative analysis of various refrigerants was carried out for single phaseflow through the S-shaped coil. Table 1 shows a relationship between theoreticalpressure-drop and predicted pressure-drop using CFD when predicting liquid andvapour flows. It was found that CFD was able to predict the pressure drop with86% accuracy on average, compared with theoretical analysis. It can be seen thatthe newer refrigerants (R134a and R32) give a much higher pressure-drop comparedwith the conventional refrigerants (R12 and R717). CFD, however, did on average
Table 1
Pressure drop through an S-shaped coil for single-phase liquid and vapour
Pressure loss (kPa)
RefrigerantR12 R717 R134a R32
CFD vapour 12.3 3.3 37.4 42.9
Theory vapour 11.8 2.9 25.1 32.1
CFD liquid 438.9 209.3 1036.0 736.0
Theory liquid 454.9 210.6 844.0 615.2
174 S.J. Smith et al. / Applied Energy 70 (2001) 169–178
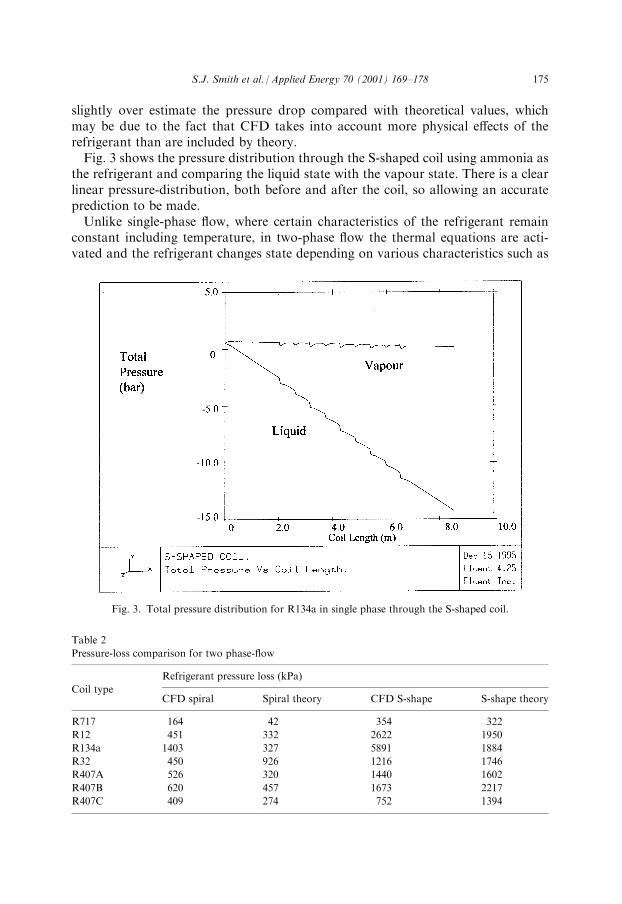
slightly over estimate the pressure drop compared with theoretical values, whichmay be due to the fact that CFD takes into account more physical effects of therefrigerant than are included by theory.Fig. 3 shows the pressure distribution through the S-shaped coil using ammonia as
the refrigerant and comparing the liquid state with the vapour state. There is a clearlinear pressure-distribution, both before and after the coil, so allowing an accurateprediction to be made.Unlike single-phase flow, where certain characteristics of the refrigerant remain
constant including temperature, in two-phase flow the thermal equations are acti-vated and the refrigerant changes state depending on various characteristics such as
Fig. 3. Total pressure distribution for R134a in single phase through the S-shaped coil.
Table 2
Pressure-loss comparison for two phase-flow
Refrigerant pressure loss (kPa)
Coil typeCFD spiral Spiral theory CFD S-shape S-shape theory
R717 164 42 354 322
R12 451 332 2622 1950
R134a 1403 327 5891 1884
R32 450 926 1216 1746
R407A 526 320 1440 1602
R407B 620 457 1673 2217
R407C 409 274 752 1394
S.J. Smith et al. / Applied Energy 70 (2001) 169–178 175
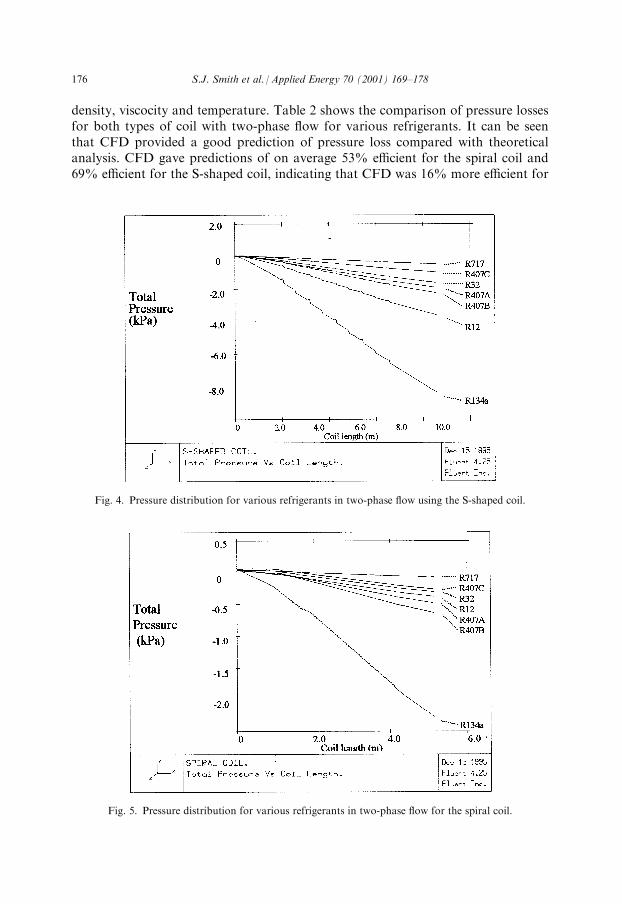
density, viscocity and temperature. Table 2 shows the comparison of pressure lossesfor both types of coil with two-phase flow for various refrigerants. It can be seenthat CFD provided a good prediction of pressure loss compared with theoreticalanalysis. CFD gave predictions of on average 53% efficient for the spiral coil and69% efficient for the S-shaped coil, indicating that CFD was 16% more efficient for
Fig. 4. Pressure distribution for various refrigerants in two-phase flow using the S-shaped coil.
Fig. 5. Pressure distribution for various refrigerants in two-phase flow for the spiral coil.
176 S.J. Smith et al. / Applied Energy 70 (2001) 169–178
prediction of flow through the S-shaped coil compared with the spiral coil using thesame refrigerants and operating conditions.Figs. 4 and 5 show the pressure distributions through both types of coil with two-
phase flow using various refrigerants. The effect on the pressure of each refrigerantcan be observed as being very similar for each coil. It can also be seen that a suddenpressure drop is evident through the spiral coil, whilst the S-shaped coil provides asignificant pressure change at each individual bend. It is possible that CFD may bemore accurate at predicting flows through the S-shaped coil because it is possible tomake definite predictions at each bend.The results show an increase in pressure drop of more than 400% when using one
of the new refrigerant blends rather than a conventional refrigerant. This was not onlyconsistent with CFD predictions but also evident with experimentally correlated the-ory. R134a gave the highest pressure-drop of all the refrigerants used in this investi-gation showing that the performance of the evaporator within the refrigeration cyclewould depend very much on the refrigerant used.
5. Conclusions
CFD was found to be a very useful tool for predicting pressure loss throughevaporator coils typically used in heat-pump refrigeration systems. Using variousrefrigerants, the CFD prediction was consistent with theoretical equations corre-lated to experimental results, Miyara et al. [4]. CFD was shown to be 25% moreefficient for predicting single-phase flow rather than two-phase flow.It was found that new refrigerant blends, such as R407A, B and C, yield a much
higher pressure-drop through the evaporator coil than conventional refrigerantssuch as R717. This will inevitably have an effect on the evaporator operating con-ditions and therefore the performance of the heat pump system.
Acknowledgements
The authors would like to thank the Engineering and Physical Sciences ResearchCouncil (EPSRC) for their financial support for the project and for awarding MrS.J. Smith an EPSRC studentship.
References
[1] Sami SM, Song B. Heat transfer and pressure drop characteristics of HFC quarternary refrigerant
mixtures inside horizontal enhanced surface tubing. Applied Thermal Engineering 1996;16(6):461–73.
[2] Jones RA, Abu Madi M, Heikal MR. Performance of non-ozone depletion refrigerants in condensers
and evaporators. The Institute of Marine Engineers. Marine Refrigeration 1996;107(3):31–48.
[3] Miller DS. Internal flow systems. 2nd ed. Bedford: BHRA (Information Services), 1990.
[4] Miyara A, Koyama S, Fujii T. Consideration on the performance on the vapour compression heat-
pump cycle using NARMs. Int J Refrigeration 1993;16(3):161–8.
S.J. Smith et al. / Applied Energy 70 (2001) 169–178 177
[5] Smith SL. Void fractions in two-phase flow: a correlation based upon an equal velocity heat model.
Heat and Fluid Flow 1971;V1(1):22–39.
[6] Soliman M, Schuster JR, Berenson PJ. A general heat-transfer correlation for annular flow con-
densation. J Heat Transfer 1986;V90(2):267–76.
[7] Fluent. Fluent users’ guide. USA: Fluent, 1993.
[8] Leonard BP. A stable and accurate convective modelling procedure based on quadratic upstream
interpolation, computer. Methods in Appl Mech Eng 1979;19:59–98.
[9] Maruszuwski JP. Bounded QUICK scheme in FLUENT. Fluent, Technical Memo, TM-049, 1991.
178 S.J. Smith et al. / Applied Energy 70 (2001) 169–178