Embed Size (px)
Citation preview
38 TRANSPORTATION RESEARCH RECORD 1286
Prestressed Concrete Pavement: Instrumentation, Behavior, and Analysis of Horizontal Movements
ELLIOTT DAVID MANDEL, NED H. BURNS, AND B. FRANK McCULLOUGH
The long-term work plan for the initial design phase of the McLennan County prestressed concrete pavement (PCP) overlay consisted of the determination of variables that are relevant to design, the development of models and design procedures, and the study of the effect of environmental factors on PCP slabs. The evaluation of the performance of PCP, with specific observation of horizontal slab displacements caused by changes in temperature, is discussed. The behavior of the PCP is characterized by the results of a field data analysis. The instrumentation of the PCP slabs is described, graphs of measured displacements of the slabs for daily temperature cycles are presented, and a regression analysis of the slab movements is discussed. Finally, conclusions and recommendations based on the instrumentation program and data analysis are outlined.
Prestressed concrete pavement (PCP) takes advantage of the high compressive strength of concrete to prevent or decrease tensile stresses during service. When a permanent horizontal compressive stress is introduced to a pavement slab during construction, its capacity to withstand traffic and environmental loads is increased. This compression of concrete slabs results in a potentially cost-efficient alternative to traditional pavements or pavement overlays.
This paper addresses applications of pavement theory by reporting the analysis of data collected from in situ PCP slabs on Interstate 35 in Texas. Initial performance of the PCP has been reported previously (1,2), and recent performance has been reported in detail (3 ,4). The data are used to characterize the behavior of the slabs caused by environmental loads and to calibrate a model that predicts the behavior of PCP. The results of this study are offered as input to an ongoing process of understanding PCP for the purpose of refining the design process for its wider implementation.
GENERAL BEHAVIOR
All concrete pavements are subject to constant fluctuations in temperature because of daily and seasonal thermal cycles. These temperature changes cause individual pavement slabs
E. D. Mandel, DeLeuw, Cather & Company, Washington, D.C. 20005. N. H. Burns, Department of Civil Engineering, The University of Texas at Austin, Austin, Tex. 78712. B. F. McCullough, Center for Transportation Research, The University of Texas at Austin, Austin, Tex. 78705.
to undergo two types of movements: volumetric and curling. Motion that is subjected to restraint at boundaries or gravity loads causes stress to develop in the concrete. The magnitudes of displacement and stress determine the behavior and ultimate serviceability of a pavement.
Volumetric Movement
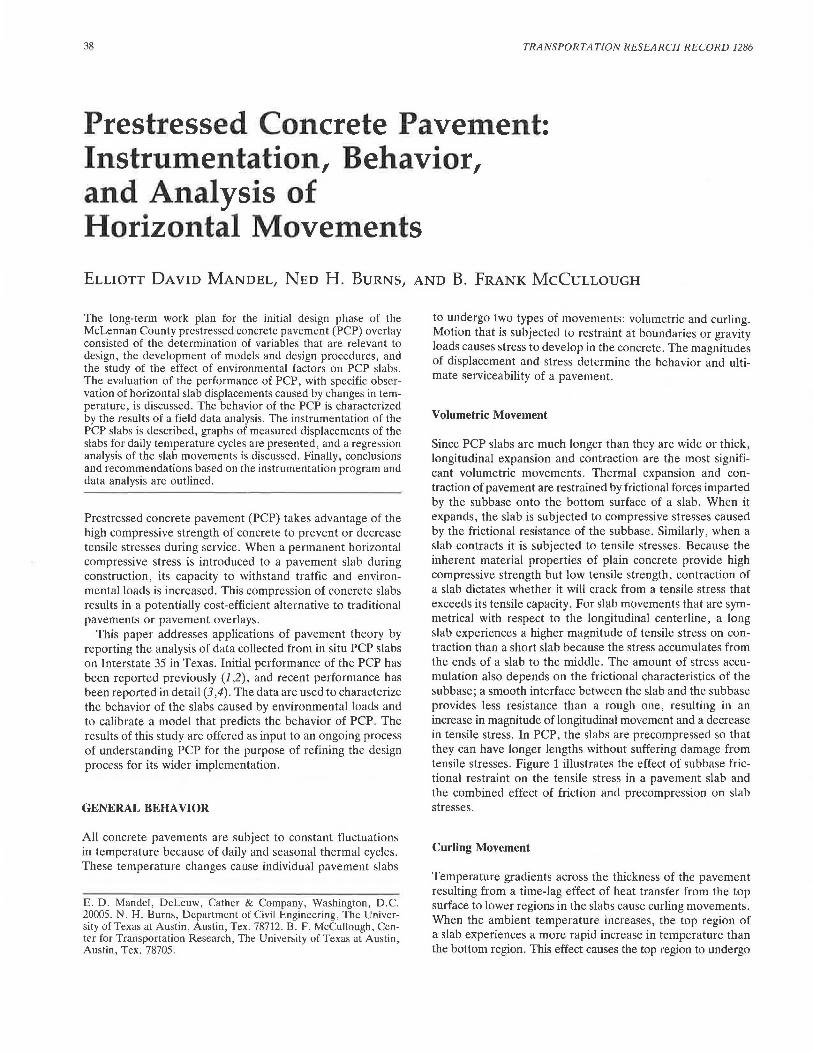
Since PCP slabs are much longer than they are wide or thick, longitudinal expansion and contraction are the most significant volumetric movements. Thermal expansion and contraction of pavement are restrained by frictional forces imparted by the subbase onto the bottom surface of a slab. When it expands, the slab is subjected to compressive stresses caused by the frictional resistance of the subbase. Similarly, when a slab contracts it is subjected to tensile stresses. Because the inherent material properties of plain concrete provide high compressive strength but low tensile strength, contraction of a slab dictates whether it will crack from a tensile stress that exceeds its tensile capacity. For slab movements that are symmetrical with respect to the longitudinal centerline, a long slab experiences a higher magnitude of tensile stress on contraction than a short slab because the stress accumulates from the ends of a slab to the middle. The amount of stress accumulation also depends on the frictional characteristics of the subbase; a smooth interface between the slab and the subbase provides less resistance than a rough one, resulting in an increase in magnitude of longitudinal movement and a decrease in tensile stress. In PCP, the slabs are precompressed so that they can have longer lengths without suffering damage from tensile stresses. Figure 1 illustrates the effect of subbase frictional restraint on the tensile stress in a pavement slab and the combined effect of friction and precompression on slab stresses.
Curling Movement
Temperature gradients across the thickness of the pavement resulting from a time-lag effect of heat transfer from the top surface to lower regions in the slabs cause curling movements. When the ambient temperature increases, the top region of a slab experiences a more rapid increase in temperature than the bottom region. This effect causes the top region to undergo
Mandel et al. 39
//X"..' /./.I&'(//
i---->-- Movement Movement ... -1111(&.---1
..--~i~ ~;- .,. ..- i.., .,. --. ~ct~ F::e---...
Jt~ ! I
HI -===+=-=== l H t.__k::: __ --IJ.....__==:::J---JI
FIGURE 1 Effect of subbase frictional restraint on stress in a concrete slab for a temperature decrease and the additional effect of precompression by force P.
a more rapid volumetric increase than the bottom region. Similarly, when the ambient temperature decreases, the top region experiences a more rapid volumetric decrease than the bottom region. The differential in volumetric deformation through the thickness of the pavement causes the slabs to curl vertically. This movement of the slabs fluctuates constantly as the temperature gradient across the thickness of the slab changes, reversing the direction of induced curling movement. For long pavement slabs, curling movements can be large, causing significant tensile stress in the concrete. In addition, large curling movements can cause the slab to pull away from the subbase; if enough separation occurs, repetitive traffic loads can cause pumping of material from beneath the slab, resulting in large voids under the pavement.
PREVIOUS RESEARCH
The current study on the behavior of PCP is an extension of previous research conducted at The University of Texas at Austin from 1984 to 1987. A series of conceptual and experimental investigations into the design and implementation of PCP were carried out during that time. These studies examined several separate aspects of PCP, including the application
of special prestressing techniques, the evaluation of projected in situ parameters, and the formulation of design procedures. The research provided information required for the design, construction, and early-life instrumentation of a 1-mile experimental prototype section of a PCP overlay located in central Texas (1,2,5-9).
OBJECTIVES AND SCOPE
Field work performed on the McLennan County, Texas, PCP overlay from July 1988 to February 1989 is described, as well as analytical work performed subsequently. The collection and analysis of horizontal movement data are covered, as well as instrumentation details. Although curling movement data are available, the results will be reported elsewhere.
LAYOUT OF THE PCP
The experimental prototype section of PCP in McLennan County is located on Interstate 35 southbound, about 15 mi north of Waco. The section is 1 mi long and contains a total of 32 prestressed slabs. The slabs consist of a PCP overlay 6
40
2
3
4 .t:! u
5
6
0 :E v ~ N
@J I-
Ul 0
.0 c
7 <1l 0
V5 u 8
a> i:I! Ci
Q; 9 .0 E 10 ::::i z E ·a 11 -,
12
13
14
15
16
17
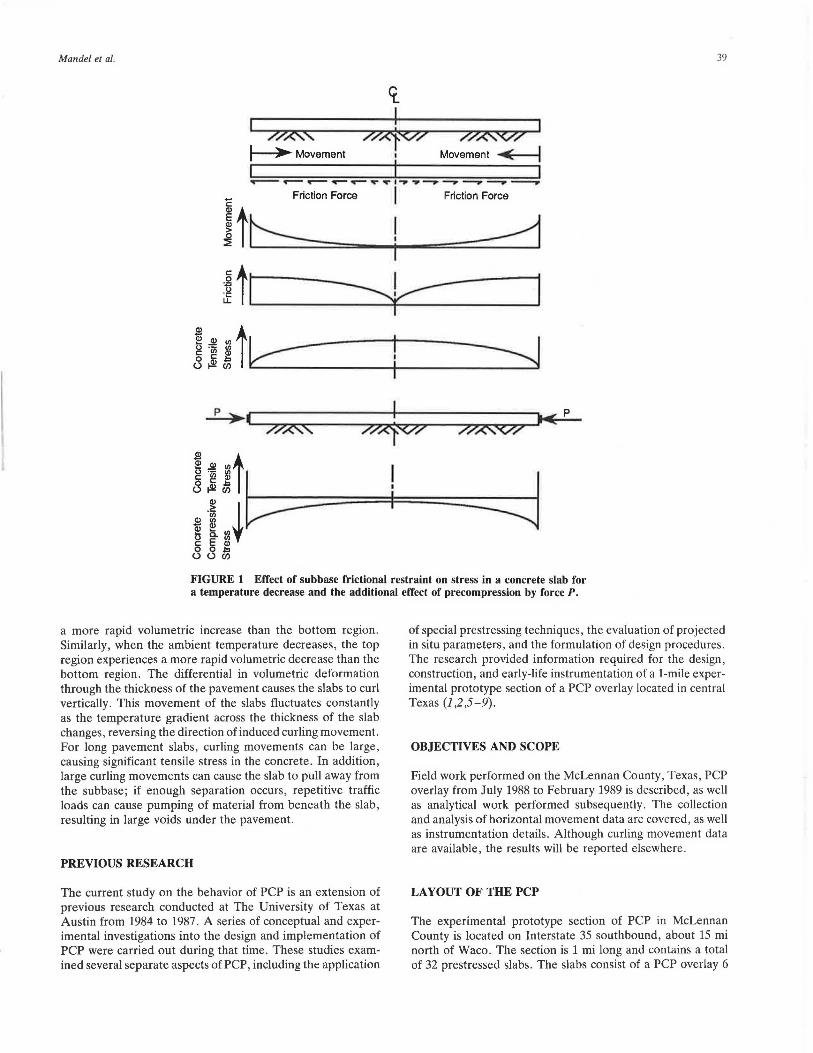
FIGURE 2 Layout plan of the McLennan County PCP experimental section.
in. thick over an existing 11-in. jointed concrete pavement (JCP) with an intermediate 3-in. ACP stress-reducing course. The pavement is 38 ft wide and consists of two 12-ft lanes, a 10-ft outside shoulder, and a 4-ft inside shoulder. It has the following dimensions in plan:
• 9 slabs at 240 ft by 21 ft • 7 slabs at 440 ft by 21 ft • 9 slabs at 240 ft by 17 ft • 7 slabs at 440 ft by 17 ft
A layout plan, including the joint numbering system of the entire experimental section, is shown in Figure 2.
PREVIOUS INSTRUMENTATION
An instrumentation program was carried out during the early life of the McLennan County overlay (2). Measurements taken at that time were intended to provide a verification of predicted values of concrete stress and slab movements caused by both prestressing and daily temperature cycles. The measurement program included
TRANSPORTATION RESEARCH RECORD 1286
1. Determination of daily fluctuations in ambient temperature, concrete temperature at middepth of the pavement slabs, and the temperature gradient over the thickness of the pavement slabs;
2. Measurement of horizontal and vertical slab movements and joint widths;
3. Measurement of tendon elongations during stressing operations;
4. Measurement of concrete strain in the slabs; and 5. Determination of concrete strength and modulus of elas
ticity at early ages.
CURRENT INSTRUMENTATION
A second instrumentation program for the McLennan County PCP (covered herein) was carried out to monitor movements of the slabs after changes in the material properties of the concrete had stabilized and after shrinkage and creep effects essentially were complete. Information collected in this instrumentation program was used to characterize the long-term behavior of the PCP.
Field Visits
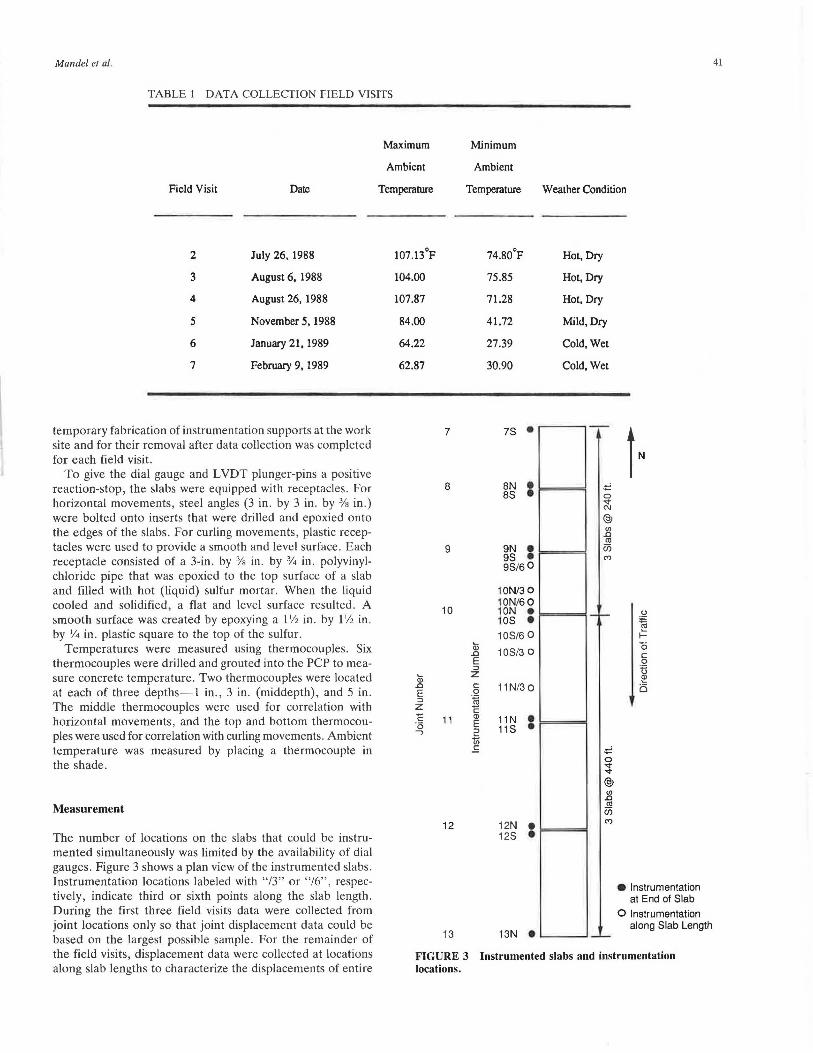
Work performed at the McLennan County PCP site included site surveys, preliminary measurements, installation of instrumentation equipment, and data collection. Data collection took place from July 1988 to February 1989. During that time six field visits were made. The field visits took place under varying conditions of moisture and ambient temperaturethree during hot and dry conditions, one during mild and dry conditions, and two during cold and wet conditions. Table 1 outlines the five data collection field visits and an additional trip. The duration of all data collection periods was 24 hr, wilh lhe exception of Lhe sixlh fielJ visil, which lasted 48 hr.
The array of weather conditions covers the maximum range of temperatures that occurred at the site. It is difficult to evaluate whether the wet moisture conditions can be considered as the extreme conditions; 1988 was a drought year with almost no precipitation from July to December. The conditions described as "wet" in Table 1 were moist from rain that occurred 1 to 2 days before data collection.
Instrumentation Set-Up
Concrete "dead-man" anchors were used to support dial gauges and linear voltage-distance transducers (L VDTs). The anchors consisted of typical 6-in. by 12-in. concrete cylinders with embedded threaded inserts that receive 7/s-in. threaded dowels. Two inserts were installed in case one failed to function. Rubber stoppers protected the inserts when they were not in use. The anchors were inserted into the soil, leveled, and secured into place with concrete, about 18 in. from the west edge of the slabs. Then, for each field visit, a vertical steel dowel with a threaded end was screwed into each anchor, and horizontal dowels were secured and attached to the verticals with 90-degree dowel clamps. Dial gauges or L VDTs were then secured to the horizontals. This set-up allowed for the
Mandel et al.
TABLE 1 DATA COLLECTION FIELD VISITS
Field Visit Date
2 July 26, 1988
3 August 6, 1988
4 August 26, 1988
5 November 5, 1988
6 January 21, 1989
7 February 9, 1989
temporary fabrication of instrumentation supports at the work site and for their removal after data collection was completed for each field visit.
To give the dial gauge and LVDT plunger-pins a positive reaction-stop, the slabs were equipped with receptacles. For horizontal movements, steel angles (3 in . by 3 in . by 3/R in .) were bolted onto inserts that were drilled and epoxied onto the edges of the slabs. For curling movements, plastic receptacles were used to provide a smooth and level surface. Each receptacle consisted of a 3-in. by % in. by % in . polyvinylchloride pipe that was epoxied to the top surface of a slab and filled with hot (liquid) sulfur mortar. When the liquid cooled and solidified, a flat and level surface resulted . A smooth surface was created by epoxying a 1 Y2 in. by 1 Y2 in. by Y4 in. plastic square to the top of the sulfur.
Temperatures were measured using thermocouples. Six thermocouples were drilled and grouted into the PCP to measure concrete temperature. Two thermocouples were located at each of three depths-1 in., 3 in. (middepth), and 5 in. The middle thermocouples were used for correlation with horizontal movements, and the top and bottom thermocouples were used for correlation with curling movements . Ambient temperature was measured by placing a thermocouple in the shade.
Measurement
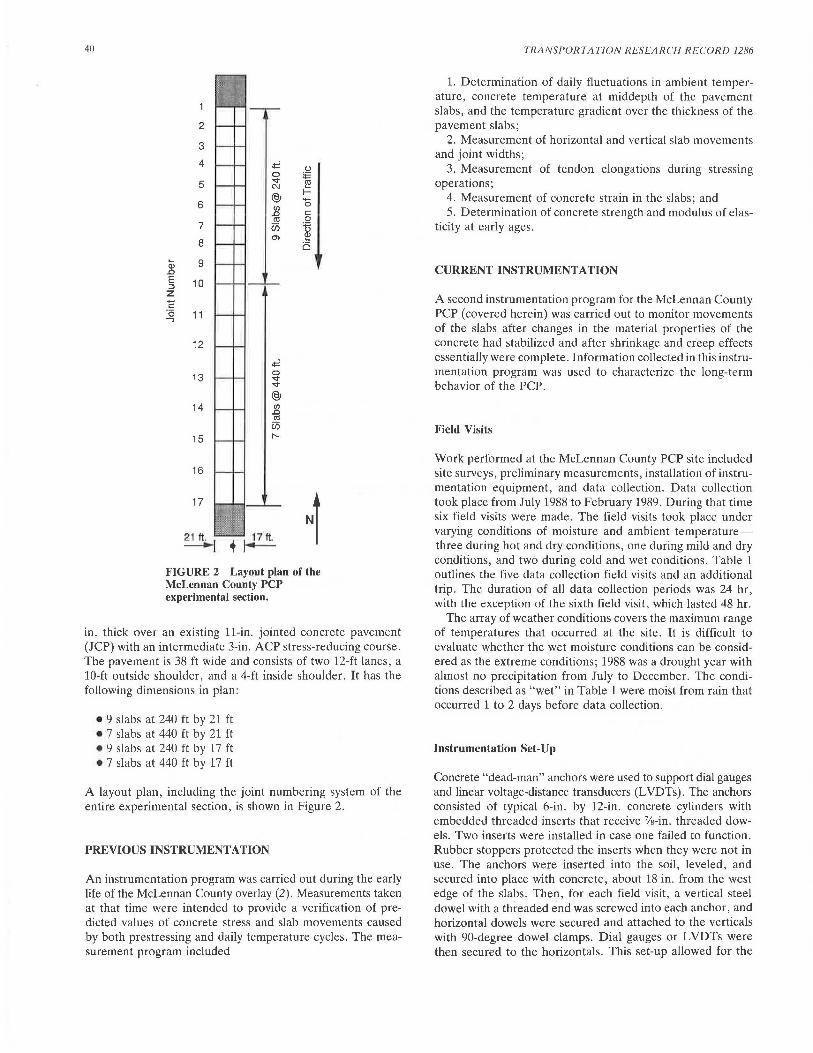
The number of locations on the slabs that could be instrumented simultaneously was limited by the availability of dial gauges. Figure 3 shows a plan view of the instrumented slabs . Instrumentation locations labeled with "/3" or "16", respectively , indicate third or sixth points along the slab length . During the first three field visits data were collected from joint locations only so that joint displacement data could be based on the largest possible sample. For the remainder of the field visits, displacement data were collected at locations along slab lengths to characterize the displacements of entire
Maximum
Ambient
Temperature
107.13°F
104.00
107.87
84.00
64.22
62.87
Q; .0 E :::i z c '6 ....,
7
8
9
10
11
12
13
Minimum
Ambient
Temperature Weather Condition
Q; .0 E :::i z c 0 ·~ c Q)
E 2 Ui E
74.80°F Hot, Dry
75 .85 Hot, Dry
71.28 Hot, Dry
41.72 Mild, Dry
27.39 Cold, Wet
30.90 Cold, Wet
:: :o ~ t· 9N e l===='I 9S • 9S/60
10N/3 o 10N/60 1 ON e I=-==-=--! 10S •
10S/6 0
10S/3 0
11N/30
11 N •• l=====I 11 s
12N e l=-===I 12S •
13N e ......_ _ __.
~ N
@J
Jl "' us
(".)
• Instrumentation at End of Slab
O Instrumentation along Slab Length
FIGURE 3 Instrumented slabs and instrumentation locations.
41
42
slabs. The instrumentation set-up allowed for the measurement of horizontal and vertical slab movements with respect to an arbitrary datum. Displacements measured from the first data reading at each location for each field visit.
Prevention of Error
Several methods for avoiding error in final versions of data were employed. These methods include prevention of interference, redundant readings, and internal checking of data. Interference was prevented in two ways: steel dowels were encased in foam insulation to prevent error caused by uneven heating from the sun, and temporary masonry walls were constructed to prevent error created by wind gusts from traffic. Redundancy of data readings included two slab temperature readings at each of the three depths-1 in., 3 in., and 5 in. -and at Joint 10, horizontal slab movements were measured with both dial gauges and L VDTs. The measurements of horizontal slab movements could be internally checked because the sum of the movements measured by dial gauges or L VDTs at the ends should add up to the change in joint opening measured with dial calipers.
DATA ANALYSIS
This section describes the treatment of the field data collected at the McLennan County PCP. The data include measurements of horizontal and vertical slab displacements, joint widths, ambient temperatures, and concrete temperatures at three depths in the pavement. Only the analysis of horizontal displacements and their corresponding concrete temperatures at middepth in the slabs is included in this paper. Hankins et al. (3) included a complete listing and graphic presentation of all data.
c = c: Ql
E Ql
~ 0.. (/)
0 ~ c: 0 N "§ I
0.1
o.o
-0.1
-0.2
-0.3
-0.4
-- 240 ft. slabs - 240 ft. slabs (1/3 point) - 240 ft. slabs (1/6 point) - 440 ft. slabs - 440 ft. slabs (1 /6 point) - 440 ft . slabs (1/3 point)
0 0 0 0 0 0 0 0 ~ 0
9. 9. !'? 0 0 9. 9. 9. 0 ... ~ co ~ (\j 0 N ... <D a; N
~ g o N
Time (hour:min)
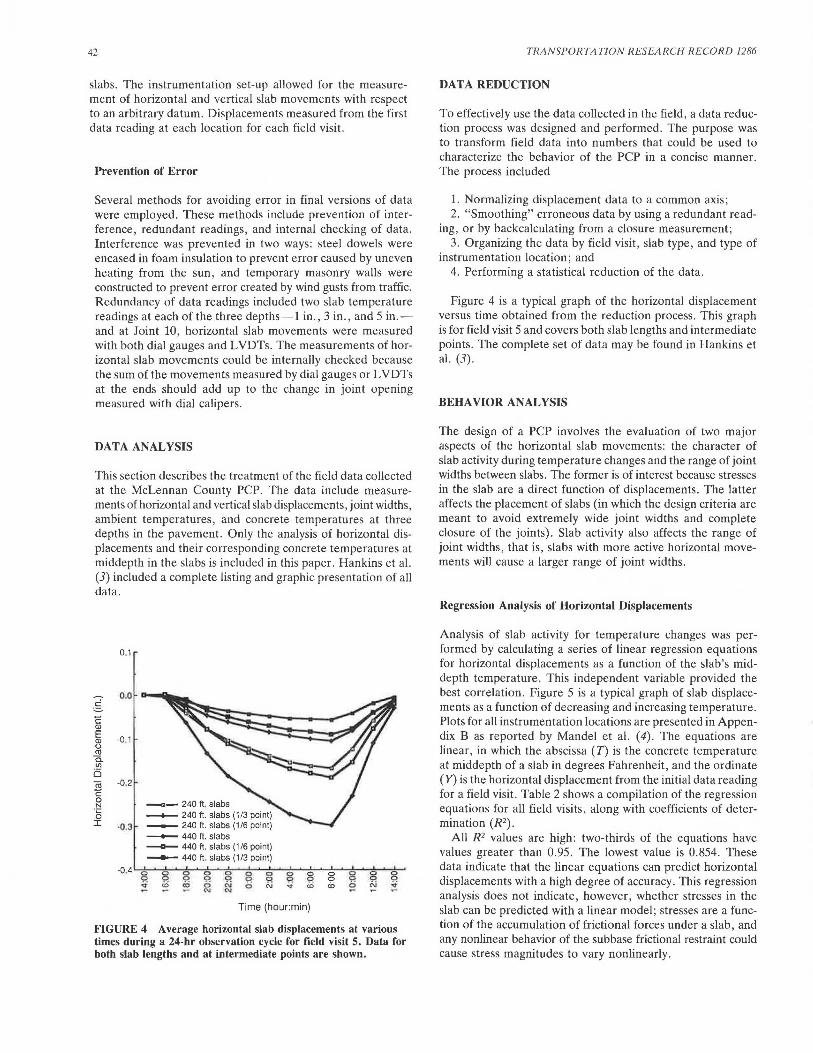
FIGURE 4 Average horizontal slab displacements at various times during a 24-hr observation cycle for field visit 5. Data for both slab lengths and at intermediate points are shown.
TRANSPORTATION RESEARCH RECORD 1286
DAT A REDUCTION
To effectively use the data collected in the field, a data reduction process was designed and performed. The purpose was to transform field data into numbers that could be used to characterize the behavior of the PCP in a concise manner. The process included
l. Normalizing displacement data to a common axis; 2. "Smoothing" erroneous data by using a redundant read
ing, or by backcalculating from a closure measurement; 3. Organizing the data by field visit, slab type, and type of
instrumentation location; and 4. Performing a statistical reduction of the data.
Figure 4 is a typical graph of the horizontal displacement versus time obtained from the reduction process. This graph is for field visit 5 and covers both slab lengths and intermediate points. The complete set of data may be found in Hankins et al. (3).
BEHAVIOR ANALYSIS
The design of a PCP involves the evaluation of two major aspects of the horizontal slab movements: the character of slab activity during temperature changes and the range of joint widths between slabs. The former is of interest because stresses in the slab are a direct function of displacements. The latter affects the placement of slabs (in which the design criteria are meant to avoid extremely wide joint widths and complete closure of the joints). Slab activity also affects the range of joint widths, that is, slabs with more active horizontal movements will cause a larger range of joint widths.
Regression Analysis of Horizontal Displacements
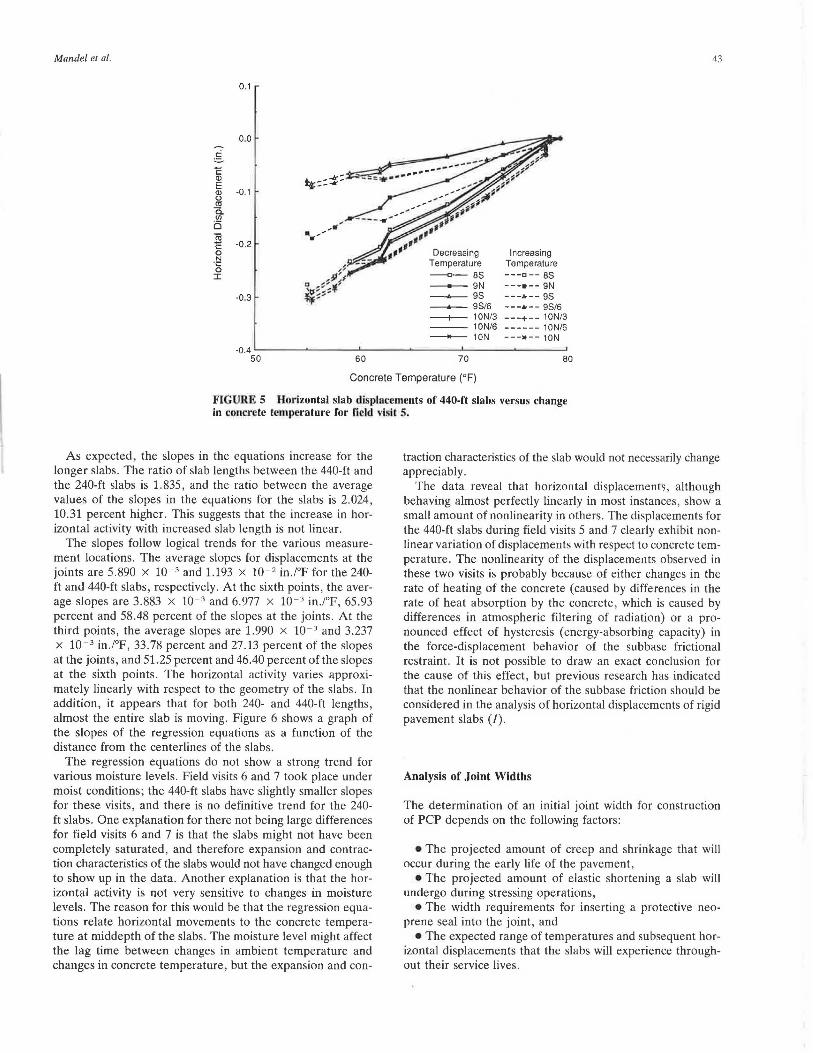
Analysis of slab activity for temperature changes was performed by calculating a series of linear regression equations for horizontal displacements as a function of the slab's middepth temperature. This independent variable provided the best correlation. Figure 5 is a typical graph of slab displacements as a function of decreasing and increasing temperature. Plots for all instrumentation locations are presented in Appendix B as reported by Mandel et al. (4). The equations are linear, in which the abscissa (T) is the concrete temperature at middepth of a slab in degrees Fahrenheit, and the ordinate (Y) is the horizontal displacement from the initial data reading for a field visit. Table 2 shows a compilation of the regression equations for all field visits, along with coefficients of determination (R2).
All R2 values are high: two-thirds of the equations have values greater than 0.95. The lowest value is 0.854. These data indicate that the linear equations can predict horizontal displacements with a high degree of accuracy. This regression analysis does not indicate, however , whether stresses in the slab can be predicted with a linear model; stresses are a function of the accumulation of frictional forces under a slab, and any nonlinear behavior of the subbase frictional restraint could cause stress magnitudes to vary nonlinearly.
Mandel et al.
§_ E Q)
E Q)
g a. Cf)
Ci ]j c: 0 N '§ I
0.1
0.0
-0.1
-0.2
-0.3
Decreasing Temperature ---<i- BS
----- 9N ---+----- 9S _____...__ 9S/6 ---+-- 10N/3 --- 10N/6 ______.,_ 10N
Increasing Temperature ---c--ss ---•-- 9N ___ ,.. __ 9S
---•-- 9S/6 ---+-- 10N/3 ------ 10N/6 --->t-- 10N
43
-0.4 L---~~----'---~----'----~---' 50 60 70 80
Concrete Temperature (°F}
FIGURE 5 Horizontal slab displacements of 440-ft slabs versus change in concrete temperature for field visit 5.
As expected, the slopes in the equations increase for the longer slabs. The ratio of slab lengths between the 440-ft and the 240-ft slabs is 1.835, and the ratio between the average values of the slopes in the equations for the slabs is 2.024, 10.31 percent higher. This suggests that the increase in horizontal activity with increased slab length is not linear.
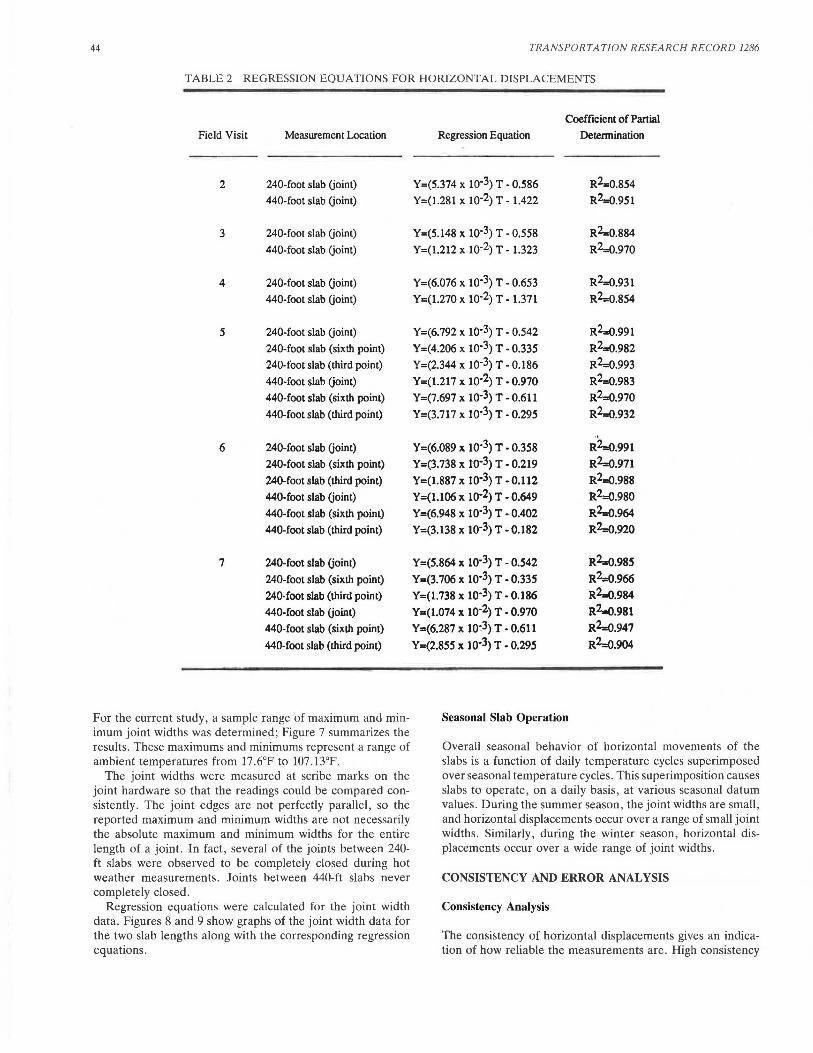
The slopes follow logical trends for the various measurement locations. The average slopes for displacements at the joints are 5.890 x 10- 3 and 1.193 x 10- 2 in./°F for the 240-ft and 440-ft slabs, respectively. At the sixth points, the average slopes are 3.883 x 10- 3 and 6.977 x 10 - 3 in ./°F, 65.93 percent and 58.48 percent of the slopes at the joints. At the third points, the average slopes are 1.990 x 10- 3 and 3.237 x 10- 3 in.l°F, 33.78 percent and 27.13 percent of the slopes at the joints, and 51.25 percent and 46.40 percent of the slopes at the sixth points. The horizontal activity varies approximately linearly with respect to the geometry of the slabs. In addition, it appears that for both 240- and 440-ft lengths , almost the entire slab is moving. Figure 6 shows a graph of the slopes of the regression equations as a function of the distance from the centerlines of the slabs.
The regression equations do not show a strong trend for various moisture levels. Field visits 6 and 7 took place under moist conditions; the 440-ft slabs have slightly smaller slopes for these visits, and there is no definitive trend for the 240-ft slabs. One explanation for there not being large differences for field visits 6 and 7 is that the slabs might not have been completely saturated , and therefore expansion and contraction characteristics of the slabs would not have changed enough to show up in the data. Another explanation is that the horizontal activity is not very sensitive to changes in moisture levels. The reason for this would be that the regression equations relate horizontal movements to the concrete temperature at middepth of the slabs. The moisture level might affect the lag time between changes in ambient temperature and changes in concrete temperature, but the expansion and con-
traction characteristics of the slab would not necessarily change appreciably.
The data reveal that horizontal displacements, although behaving almost perfectly linearly in most instances, show a small amount of nonlinearity in others . The displacements for the 440-ft slabs during field visits 5 and 7 clearly exhibit nonlinear variation of displacements with respect to concrete temperature. The nonlinearity of the displacements observed in these two visits is probably because of either changes in the rate of heating of the concrete (caused by differences in the rate of heat absorption by the concrete, which is caused by differences in atmospheric filtering of radiation) or a pronounced effect of hysteresis (energy-absorbing capacity) in the force-displacement behavior of the subbase frictional restraint . It is not possible to draw an exact conclusion for the cause of this effect, but previous research has indicated that the nonlinear behavior of the subbase friction should be considered in the analysis of horizontal displacements of rigid pavement slabs (1).
Analysis of Joint Widths
The determination of an initial joint width for construction of PCP depends on the following factors:
•The projected amount of creep and shrinkage that will occur during the early life of the pavement,
• The projected amount of elastic shortening a slab will undergo during stressing operations,
• The width requirements for inserting a protective neoprene seal into the joint, and
• The expected range of temperatures and subsequent horizontal displacements that the slabs will experience throughout their service lives .
44 TRA NSPOR TATION R ESEARCH RECORD 1286
TABLE 2 REGRESSION EQUATIONS FOR HORIZONTAL DISPLACEMENTS
Field Visit Measurement Location
2 240-foot slab (joint)
440-foot slab (joint)
3 240-foot slab (joint)
440-foot slab (joint)
4 240-foot slab (joint)
440-foot slab (joint)
5 240-foot slab (joint)
240-foot slab (sixth point)
240-foot slab (third point)
440-foot slab (joint)
440-foot slab (sixth point)
440-foot slab (third point)
6 240-foot slab (joint)
240-foot slab (sixth point)
240-foot slab (third point)
440-foot slab (joint)
440-foot slab (sixth point)
440-foot slab (third point)
7 240-foot slab (joint)
240-foot slab (sixth point)
240-foot slab (third point)
440-foot slab (joint)
440-foot slab (sixth point)
440-foot slab (third point)
For the current study, a sample range of maximum and minimum joint widths was determined; Figure 7 summarizes the results. These maximums and minimums represent a range of ambient temperatures from 17.6°F to 107.13°F.
The joint widths were measured at scribe marks on the joint hardware so that the readings could be compared consistently. The joint edges are not perfectly parallel, so the reported maximum and minimum widths are not necessarily the absolute maximum and minimum widths for the entire length of a joint . In fact , several of the joints between 240-ft slabs were observed to be completely closed during hot weather measurements. Joints between 440-ft slabs never completely closed .
Regression equations were calculated for the joint width data. Figures 8 and 9 show graphs of the joint width data for the two slab lengths along with the corresponding regression equations .
Regression Equation
Y=(5.374 x 10⁻³) T - 0.586
Y=(l.281 x 10-2) T - 1.422
Y=(5.148 x 10⁻³) T- 0.558
Y=(l.212 x 10-2) T- 1.323
Y=(6.076 x 10·3) T • 0.653
Y=(l.270 x 10-2) T • 1.371
Y=(6.792 x 10⁻³) T • 0.542
Y=(4.206 x 10·3) T • 0.335
Y=(2.344 x 10⁻³) T • 0.186
Y=(l.217 x 10·2) T • 0.970
Y=(7.697 x 10·3) T • 0.611
Y=(3.717 x 10⁻³) T • 0.295
Y=(6.089 x 10·3) T • 0.358
Y=(3.738 x to·3) T • 0.219
Y=(l.887 x 10·3) T • 0.112
Y=(l.106 x 10·2) T • 0.649
Y=(6.948 x 10·3) T • 0.402
Y=(3.138 x 10·3) T • 0.182
Y=(5.864 x 10·3) T- 0.542
Y=(3.706 x 10·3) T • 0.335
Y=(l.738 x 10·3) T • 0.186
Y=(l.074 x 10·2) T • 0.970
Y=(6.287 x 10~3) T • 0.611
Y=(2.855 x 10·3) T • 0.295
Coefficient of Partial
Detennination
R2=0.854
R2=0.951
R2=0.884
R2=0.970
R2=0.931
R2=0.8S4
R2-<J.991
R2=0.982
R2=0.993
R2=0.983
R2=0.970
R2=0.932
,, R2=0.991
R2=0.971
R2=0.988
R2=0.980
R2=0.964
R2=0.920
R2=o.985
R2-0.966
R2=0.984
RZ.0.981
R2=0.947
R2=0.904
Seasonal Slab Operation
Overall seasonal behavior of horizontal movements of the slabs is a function of daily temperature cycles superimposed over seasonal temperature cycles . This superimposition causes slabs to operate , on a daily basis , at various seasonal datum values. During the summer season , the joint widths are small, and horizontal displacements occur over a range of small joint widths . Similarly, during the winter season, horizontal displacements occur over a wide range of joint widths.
CONSISTENCY AND ERROR ANALYSIS
Consistency Analysis
The consistency of horizontal displacements gives an indication of how reliable the measurements are. High consistency
Mandel et al.
14 u::-Q...
0 12 0 ci x g 10 c: 0
-~ 8 :i
O" UJ c: 0 6 "iii cJl Q)
Ci 4 Q)
a: 0 Q) 2 0.. 0
V5 0
0 100
• 240 foot slabs • 2 Y = 0.013 + 0.049X R = 0.938
• 440 foot slabs
Y = - 1.3990 + 0.060X R 2 = 0.965
200 300
Distance From Centerline (ft.)
FIGURE 6 Slopes of the regression equations in Table 2 as a function of distance from slab centerline.
4 • Maximum width 440 foot slabs
• Minimum width
3
§,
~ 2 ~ c "C5 ...,
0 7 8 9 10 11 12 13
Joint Number
FIGURE 7 Maximum and minimum joint widths for all field visits.
in the data would indicate a high degree of reliability in analysis and recommendations, whereas wide scatter in the data would indicate that any analysis of the data , or any recommendation based on the data, would not be as well founded.
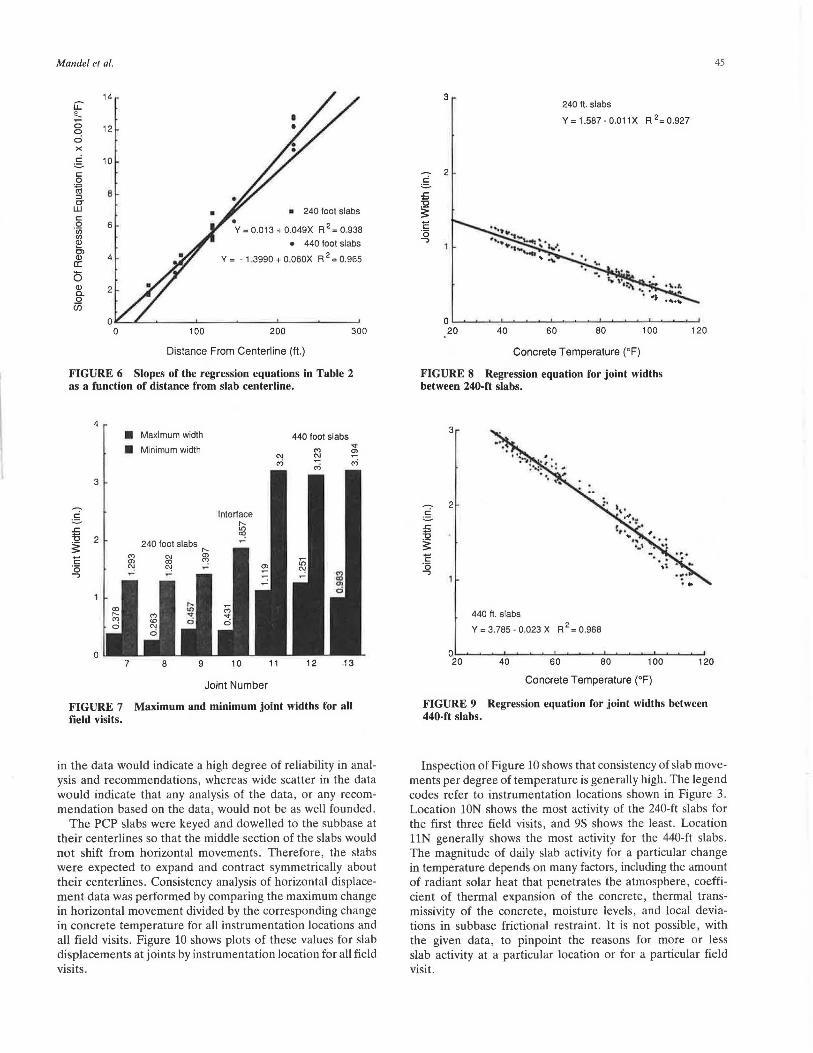
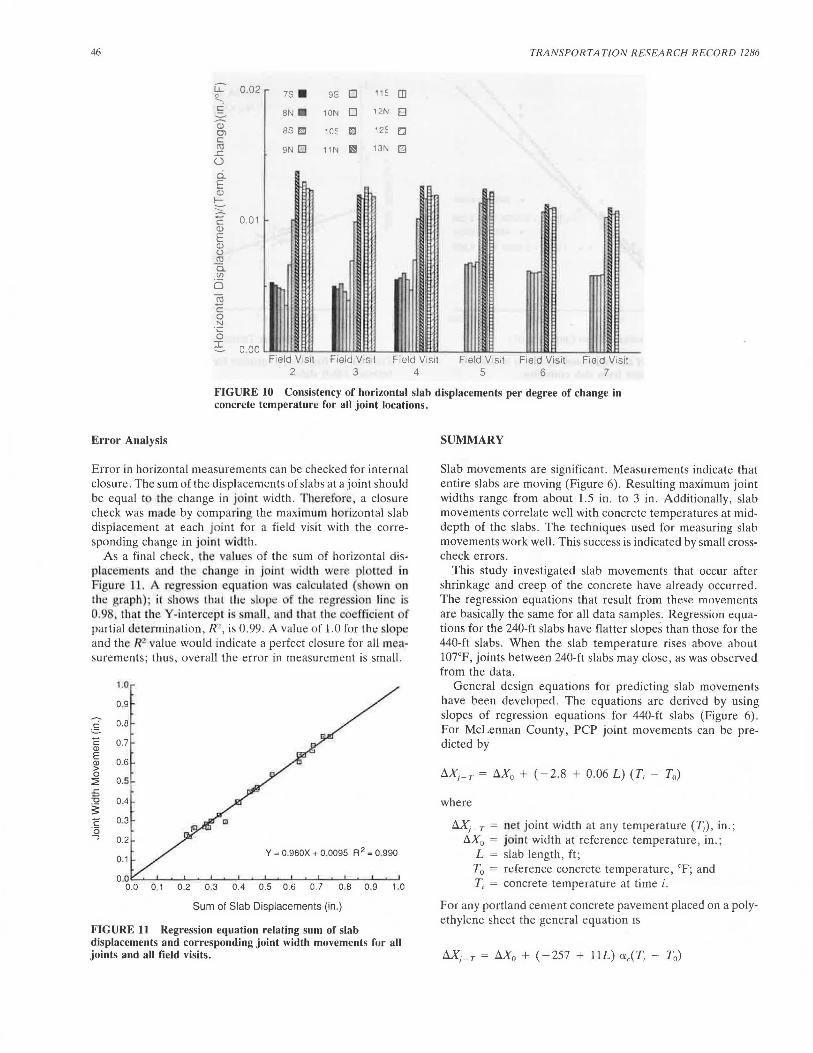
The PCP slabs were keyed and dowelled to the subbase at their centerlines so that the middle section of the slabs would not shift from horizontal movements. Therefore, the slabs were expected to expand and contract symmetrically about their centerlines. Consistency analysis of horizontal displacement data was performed by comparing the maximum change in horizontal movement divided by the corresponding change in concrete temperature for all instrumentation locations and all field visits. Figure 10 shows plots of these values for slab displacements at joints by instrumentation location for all field visits .
3 240 ft. slabs
Y=1.587-0.011X R 2=0.927
2 g .s::::. u ~ E ·5 ...,
o .......... __._.__.~__.~_..~_._ .................... ~~~~~~~ 20 40 60 80 100 120
Concrete Temperature (°F)
FIGURE 8 Regression equation for joint widths between 240-ft slabs.
3
2 c = £ "O
~ E ·5 ...,
440 ft. slabs
Y = 3.785 - 0.023 X R 2 = 0.968
o--~....._.._,__.__.__.__.~_.._.._._.__.__.__.__._~~_,
20 40 60 80 100 120
Concrete Temperature (°F)
FIGURE 9 Regression equation for joint widths between 440-ft slabs.
45
Inspection of Figure 10 shows that consistency of slab movements per degree of temperature is generally high. The legend codes refer to instrumentation locations shown in Figure 3. Location lON shows the most activity of the 240-ft slabs for the first three field visits , and 9S shows the least. Location llN generally shows the most activity for the 440-ft slabs . The magnitude of daily slab activity for a particular change in temperature depends on many factors, including the amount of radiant solar heat that penetrates the atmosphere, coefficient of thermal expansion of the concrete, thermal transmissivity of the concrete, moisture levels, and local deviations in subbase frictional restraint. It is not possible , with the given data, to pinpoint the reasons for more or less slab activity at a particular location or for a particular field visit.
46 TRANSPORTATION RESEARCH RECORD 1286
LL' ~
0.02 7S . 9S D 11E CD .!:: BN 10N D 12N B al Ol BS Ell 10E c 12E D c C1l
..c 9N 0 11N e 13N m u ci.. E ClJ
~ c 0 .01 ClJ
E ClJ (.) C1l Ci
Cf)
0 "iii c 0 N ·g
I ooo ~ ......... ...,,......_~ ............... .w....--Jiu.u.wlllll..IJ.~~w.ull..Cl...~--JLWJ.lol..tl~~..LLIJLJ.1:1.JIJ_~
Field V1s1t Field V1s1t Field V1s1t Field V1s1t Field V1s1t Field V1s1t 2 3 4 5 6 7
FIGURE 10 Consistency of horizontal slab displacements per degree of change in concrete temperature for all joint locations.
Error Analysis
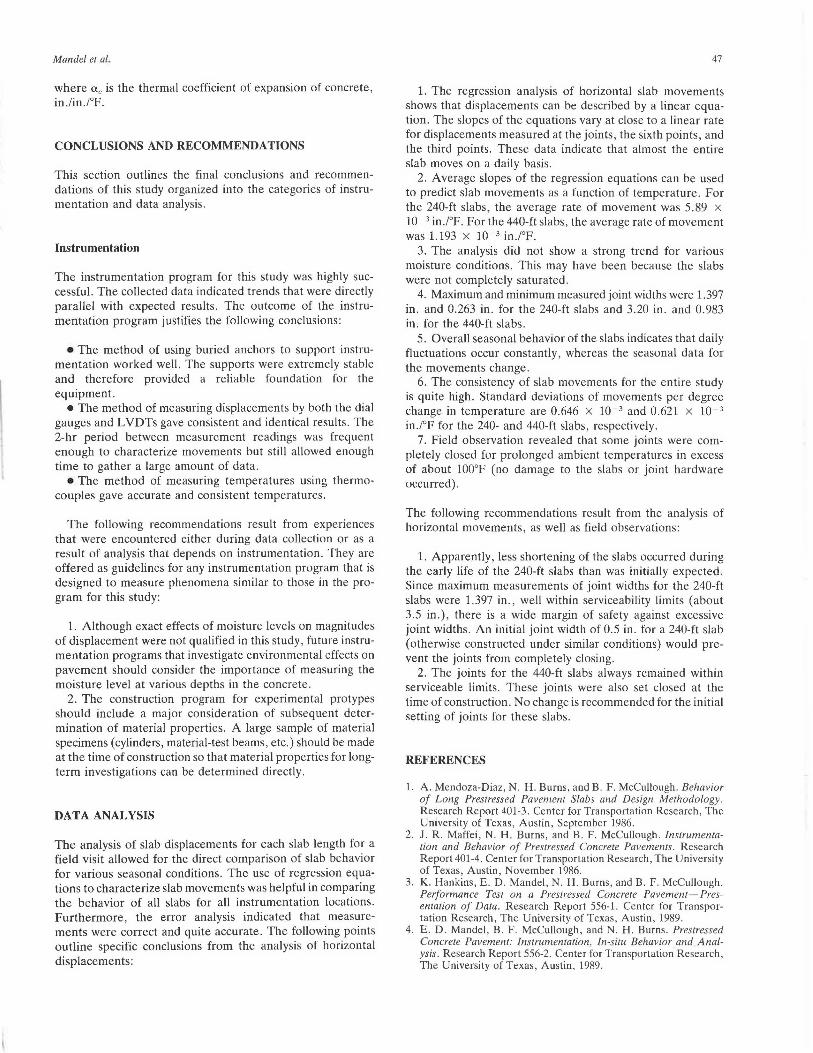
Error in horizontal measurements can be checked for internal closure. The sum of the displacements of slabs at a joint should be equal to rhc change in joint width. Therefore, a closure check was made by comparing the maximum horizontal slab displacement at each joint for a field visit with the corresponding change in joint width.
As a final check, the values of the sum of horizontal displacements and the change in joint width were plotted in Figure 11. A regre ·sion equatioa was ca lculated ( h wn on the graph) · it shows Llrnl !lit: ~lupe of the regre ion lin is 0.98, that the Y-in tercept i ·ma ll , and that the coefficient of partial determination, R2, is 0.99. A value of 1.0 for the lope and the R2 value would indicate a perfect closure for all measurements; thus, overall the error in measurement is small.
1.0
0.9
:§_ 0.8
E 0.7 Q)
E 0.6 Q)
> 0
::2; 0.5 .r:: ~ 0.4 ~ E 0.3 'Ci ....,
0.2
0.1 Y = 0.980X + 0.0095 R 2 = 0.990
0.1 0.2 0 .3 0.4 0.5 0.6 0.7 0.8 0.9 1.0
Sum of Slab Displacements (in.)
FIGURE 11 Regression equation relating sum of slab displacements and corresponding joint width movements for all joints and all field visits.
SUMMARY
Slab movements are significant. Measurements indicate that entire slabs are moving (Figure 6). Resulting maximum joint widths range from about 1.5 in. to 3 in. Additionally, slab movements correlate well with concrete temperatures at middepth of the slabs . The techniques used for measuring slab movements work well. This success is indicated by small crosscheck errors.
This study investigated slab movements that occur after shrinkage and creep of the concrete have already occurred. The regression equations that result from these movements are basically the same for all data samples. Regression el!uations for the 240-ft slabs have flatter slopes than those for the 440-ft slabs. When the slab temperature rises above about 107°F, joints between 240-ft slabs may close, as was observed from the tlata.
General design equations for predicting slab movements have been developed . The equations are derived by using slopes of regression equations for 440-ft slabs (Figure 6). For McLennan County, PCP joint movements can be predicted by
t.Xj - T = AX0 + (-2.8 + 0.06 L) (T; - T0 )
where
t1X; - r = net joint width at any temperature (T;), in.; t1X0 = j int width at reference temperature, in.;
L = slab length, ft; T0 = reference concrete temperature, °F; and T; = concrete temperature at time i .
For any portland cement concrete pavement placed on a polyethylene sheet the general equation 1s
Mandel et al.
where ac is the thermal coefficient of expansion of concrete, in ./in ./°F.
CONCLUSIONS AND RECOMMENDATIONS
This section outlines the final conclusions and recommendations of this study organized into the categories of instrumentation and data analysis .
Instrumentation
The instrumentation program for this study was highly successful. The collected data indicated trends that were directly parallel with expected results. The outcome of the instrumentation program justifies the following conclusions:
• The method of using buried anchors to support instrumentation worked well. The supports were extremely stable and therefore provided a reliable foundation for the equipment.
• The method of measuring displacements by both the dial gauges and L VDTs gave consistent and identical results. The 2-hr period between measurement readings was frequent enough to characterize movements but still allowed enough time to gather a large amount of data.
• The method of measuring temperatures using thermocouples gave accurate and consistent temperatures.
The following recommendations result from experiences that were encountered either during data collection or as a result of analysis that depends on instrumentation. They are offered as guidelines for any instrumentation program that is designed to measure phenomena similar to those in the program for this study:
1. Although exact effects of moisture levels on magnitudes of displacement were not qualified in this study, future instrumentation programs that investigate environmental effects on pavement should consider the importance of measuring the moisture level at various depths in the concrete.
2. The construction program for experimental protypes should include a major consideration of subsequent determination of material properties. A large sample of material specimens (cylinders, material-test beams, etc.) should be made at the time of construction so that material properties for longterm investigations can be determined directly.
DATA ANALYSIS
The analysis of slab displacements for each slab length for a field visit allowed for the direct comparison of slab behavior for various seasonal conditions. The use of regression equations to characterize slab movements was helpful in comparing the behavior of all slabs for all instrumentation locations. Furthermore, the error analysis indicated that measurements were correct and quite accurate. The following points outline specific conclusions from the analysis of horizontal displacements:
47
1. The regression analysis of horizontal slab movements shows that displacements can be described by a linear equation . The slopes of the equations vary at close to a linear rate for displacements measured at the joints, the sixth points , and the third points. These data indicate that almost the entire slab moves on a daily basis.
2. Average slopes of the regression equations can be used to predict slab movements as a function of temperature . For the 240-ft slabs, the average rate of movement was 5.89 x 10 - 3 in./°F. For the 440-ft slabs, the average rate of movement was 1.193 x 10- 3 in./°F.
3. The analysis did not show a strong trend for various moisture conditions. This may have been because the slabs were not completely saturated.
4. Maximum and minimum measured joint widths were 1.397 in. and 0.263 in. for the 240-ft slabs and 3.20 in. and 0.983 in. for the 440-ft slabs.
5. Overall seasonal behavior of the slabs indicates that daily fluctuations occur constantly , whereas the seasonal data for the movements change.
6. The consistency of slab movements for the entire study is quite high. Standard deviations of movements per degree change in temperature are 0.646 x 10- 3 and 0.621 x 10 - 3
in./°F for the 240- and 440-ft slabs , respectively. 7. Field observation revealed that some joints were com
pletely closed for prolonged ambient temperatures in excess of about 100°F (no damage to the slabs or joint hardware occurred).
The following recommendations result from the analysis of horizontal movements, as well as field observations:
1. Apparently, less shortening of the slabs occurred during the early life of the 240-ft slabs than was initially expected. Since maximum measurements of joint widths for the 240-ft slabs were 1.397 in., well within serviceability limits (about 3.5 in.), there is a wide margin of safety against excessive joint widths. An initial joint width of 0.5 in. for a 240-ft slab (otherwise constructed under similar conditions) would prevent the joints from completely closing.
2. The joints for the 440-ft slabs always remained within serviceable limits. These joints were also set closed at the time of construction. No change is recommended for the initial setting of joints for these slabs.
REFERENCES
1. A. Mendoza-Diaz, N. H. Burns, and B. F. McCullough. Behavior of Long Prestressed Pavement Slabs and Design Methodology. Research Report 401-3. Center for Transportation Research, The University of Texas, Austin, September 1986.
2. J. R. Maffei, N. H. Burns, and B. F. McCullough. lnslrumenlation and Behavior of Prestressed Concrete Pavements. Research Report 401-4. Center for Transportation Research, The University of Texas, Austin, November 1986.
3. K. Hankins, E. D. Mandel, N. H. Burns, and B. F. McCullough. Performance Test on a Prestressed Concrete Pavement-Presentation of Data. Research Report 556-1. Center for Transportation Research, The University of Texas, Austin, 1989.
4. E. D. Mandel, B. F. McCullough, and N. H. Burns. Preslressed Concrete Pavement: Instrumentation, In-situ Behavior and Analysis. Research Report 556-2. Center for Transportation Research, The University of Texas, Austin, 1989.

48
5. S. J. O'Brien, N. H. Burns, and B. F. McCullough. Very Early Post-Tensioning of Prestressed Concrete Pavements. Research Report 401-1. Center for Transportation Research, The University of Texas, Austin, June 1985.
6. N. D . Cable, N. H . Burns, and B. F. McCullough . New Concepts in Prestressed Concrete Pavement. Research Report 401-2. Center for Transportation Research, The University of Texas, Austin, December 1985.
7. W. S. Chia, B. F. McCullough, and N. H. Burns. Field Evaluation of Sub base Friction Characteristics. Research Report 401-5. Center for Transportation Research, The University of Texas, Austin, September 1986.
8. B. W. Dunn, N. H. Burns, and B. F. McCullough. Friction Losses in Unbound Post-Te11sio11i11g Tendons. Research Report 401-6.
TRANSPORTATION RESEARCH RECORD 1286
Center for Transportation Research, The University of Texas, Austin, November 1986.
9. W. S. Chia, N. H. Burns, and B. F. McCullough. Effect of Prestress on the Fatigue Life of Concrete. Research Report 401-7. Center for Transportation Research, The University of Texas, Austin, November 1986.
Publication of this paper sponsored by Committee on Rigid Pavement Design.