Embed Size (px)
Citation preview
8/7/2019 Prévisions intermédiaires de croissance pour 2011
http://slidepdf.com/reader/full/previsions-intermediaires-de-croissance-pour-2011 1/12
February 2011
EU rec overy ga ining ground
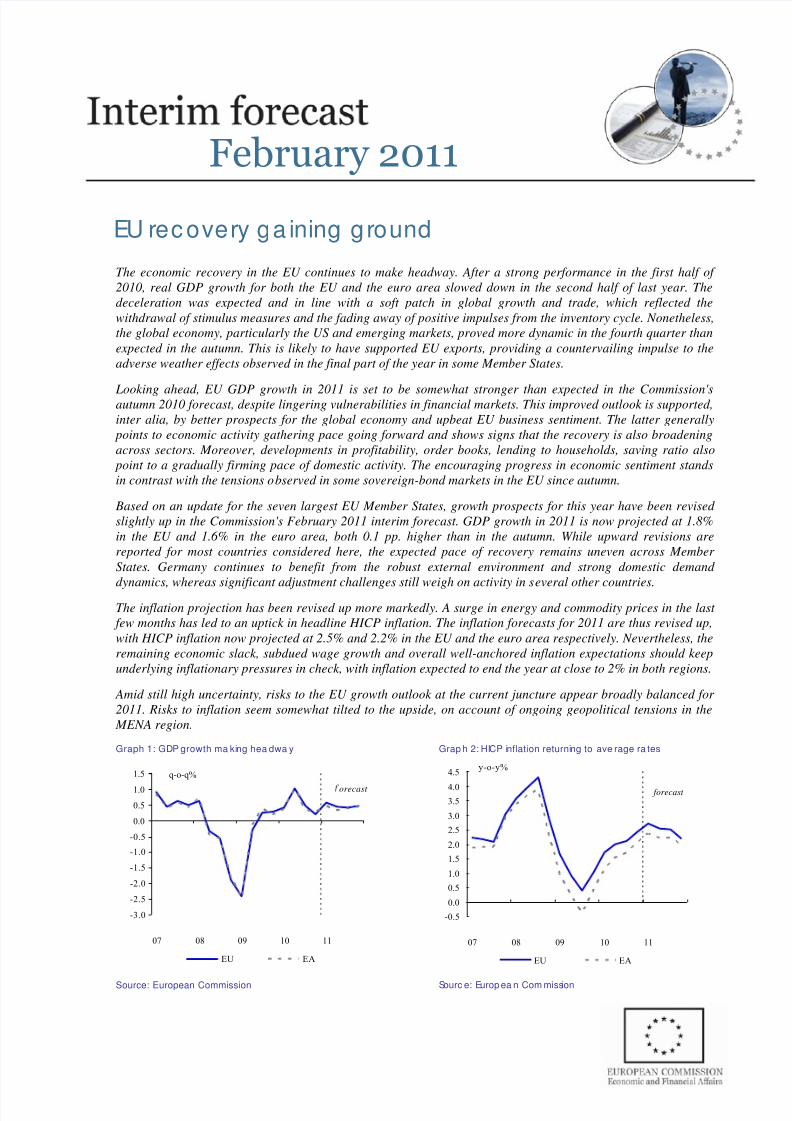
The economic recovery in the EU continues to make headway. After a strong performance in the first half of
2010, real GDP growth for both the EU and the euro area slowed down in the second half of last year. The
deceleration was expected and in line with a soft patch in global growth and trade, which reflected the
withdrawal of stimulus measures and the fading away of positive impulses from the inventory cycle. Nonetheless,
the global economy, particularly the US and emerging markets, proved more dynamic in the fourth quarter than
expected in the autumn. This is likely to have supported EU exports, providing a countervailing impulse to the
adverse weather effects observed in the final part of the year in some Member States.
Looking ahead, EU GDP growth in 2011 is set to be somewhat stronger than expected in the Commission'sautumn 2010 forecast, despite lingering vulnerabilities in financial markets. This improved outlook is supported,
inter alia, by better prospects for the global economy and upbeat EU business sentiment. The latter generally
points to economic activity gathering pace going forward and shows signs that the recovery is also broadening
across sectors. Moreover, developments in profitability, order books, lending to households, saving ratio also
point to a gradually firming pace of domestic activity. The encouraging progress in economic sentiment stands
in contrast with the tensions observed in some sovereign-bond markets in the EU since autumn.
Based on an update for the seven largest EU Member States, growth prospects for this year have been revised
slightly up in the Commission's February 2011 interim forecast. GDP growth in 2011 is now projected at 1.8%
in the EU and 1.6% in the euro area, both 0.1 pp. higher than in the autumn. While upward revisions are
reported for most countries considered here, the expected pace of recovery remains uneven across Member
States. Germany continues to benefit from the robust external environment and strong domestic demand
dynamics, whereas significant adjustment challenges still weigh on activity in several other countries.
The inflation projection has been revised up more markedly. A surge in energy and commodity prices in the last
few months has led to an uptick in headline HICP inflation. The inflation forecasts for 2011 are thus revised up,
with HICP inflation now projected at 2.5% and 2.2% in the EU and the euro area respectively. Nevertheless, the
remaining economic slack, subdued wage growth and overall well-anchored inflation expectations should keep
underlying inflationary pressures in check, with inflation expected to end the year at close to 2% in both regions.
Amid still high uncertainty, risks to the EU growth outlook at the current juncture appear broadly balanced for
2011. Risks to inflation seem somewhat tilted to the upside, on account of ongoing geopolitical tensions in the
MENA region.
Graph 1: GDP growth ma king hea dwa y
-3.0
-2.5
-2.0
-1.5
-1.0
-0.5
0.0
0.5
1.0
1.5
07
08
09
10
11
EU EA
orecast
q-o-q%
Source: European Commission
Grap h 2: HICP inflation returning to ave rage ra tes
-0.5
0.0
0.5
1.0
1.5
2.0
2.5
3.0
3.5
4.0
4.5
07
08
09
10
11
EU EA
forecast
y-o-y%
Sourc e: Europ ea n Com mission
8/7/2019 Prévisions intermédiaires de croissance pour 2011
http://slidepdf.com/reader/full/previsions-intermediaires-de-croissance-pour-2011 2/12
2
Interim forecast February 2011
Global outlook improves ag ain
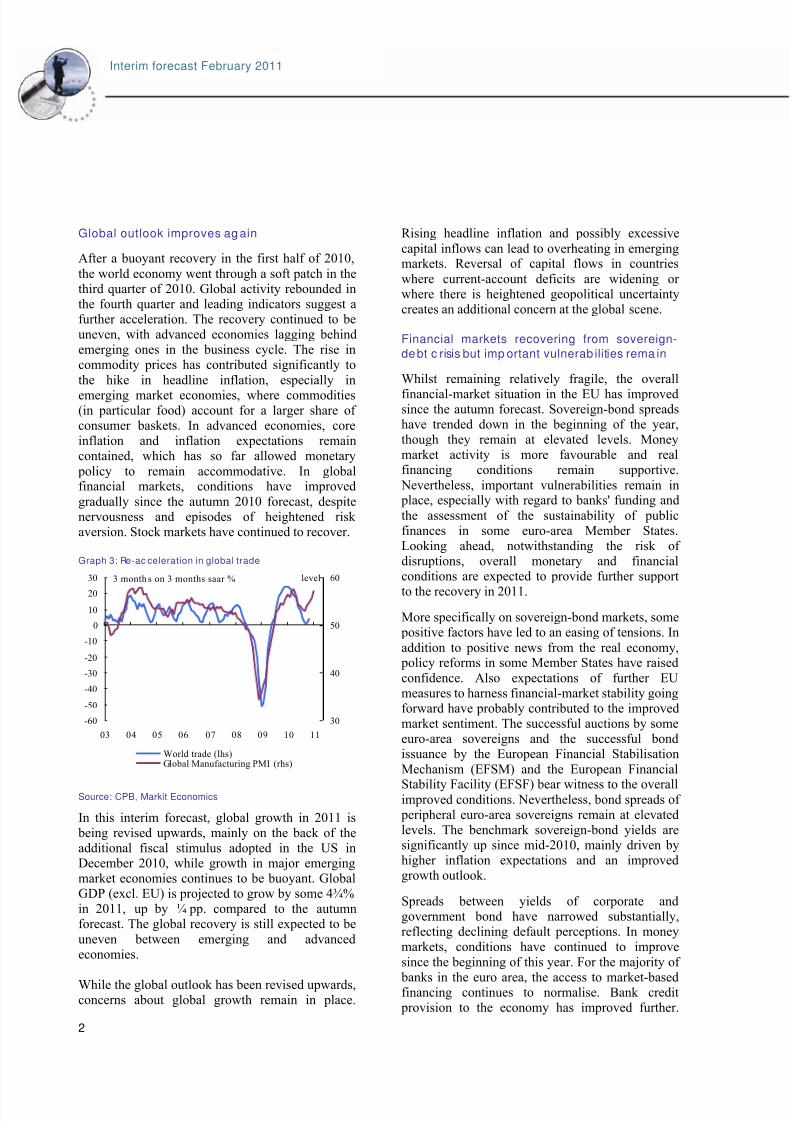
After a buoyant recovery in the first half of 2010,
the world economy went through a soft patch in thethird quarter of 2010. Global activity rebounded inthe fourth quarter and leading indicators suggest afurther acceleration. The recovery continued to beuneven, with advanced economies lagging behindemerging ones in the business cycle. The rise incommodity prices has contributed significantly to
the hike in headline inflation, especially in
emerging market economies, where commodities(in particular food) account for a larger share of consumer baskets. In advanced economies, coreinflation and inflation expectations remaincontained, which has so far allowed monetary
policy to remain accommodative. In globalfinancial markets, conditions have improved
gradually since the autumn 2010 forecast, despitenervousness and episodes of heightened risk aversion. Stock markets have continued to recover. Graph 3: Re-ac celeration in global trade
-60
-50
-40
-30
-20
-10
0
10
20
30
03 04 05 06 07 08 09 10 11
30
40
50
60
World trade (lhs)Global Manufacturing PMI (rhs)
3 month s on 3 months saar % level
Source: CPB, Markit Economics
In this interim forecast, global growth in 2011 isbeing revised upwards, mainly on the back of theadditional fiscal stimulus adopted in the US inDecember 2010, while growth in major emergingmarket economies continues to be buoyant. GlobalGDP (excl. EU) is projected to grow by some 4¾%in 2011, up by ¼ pp. compared to the autumnforecast. The global recovery is still expected to be
uneven between emerging and advancedeconomies.
While the global outlook has been revised upwards,concerns about global growth remain in place.
Rising headline inflation and possibly excessive
capital inflows can lead to overheating in emergingmarkets. Reversal of capital flows in countries
where current-account deficits are widening or where there is heightened geopolitical uncertaintycreates an additional concern at the global scene.
Financial markets recovering from sovereign-
debt c risis but imp ortant vulnerab ilities rema in
Whilst remaining relatively fragile, the overall
financial-market situation in the EU has improvedsince the autumn forecast. Sovereign-bond spreadshave trended down in the beginning of the year,though they remain at elevated levels. Moneymarket activity is more favourable and realfinancing conditions remain supportive.
Nevertheless, important vulnerabilities remain inplace, especially with regard to banks' funding and
the assessment of the sustainability of publicfinances in some euro-area Member States.Looking ahead, notwithstanding the risk of disruptions, overall monetary and financialconditions are expected to provide further support
to the recovery in 2011.
More specifically on sovereign-bond markets, somepositive factors have led to an easing of tensions. In
addition to positive news from the real economy,policy reforms in some Member States have raised
confidence. Also expectations of further EUmeasures to harness financial-market stability goingforward have probably contributed to the improvedmarket sentiment. The successful auctions by someeuro-area sovereigns and the successful bondissuance by the European Financial Stabilisation
Mechanism (EFSM) and the European Financial
Stability Facility (EFSF) bear witness to the overallimproved conditions. Nevertheless, bond spreads of peripheral euro-area sovereigns remain at elevatedlevels. The benchmark sovereign-bond yields aresignificantly up since mid-2010, mainly driven byhigher inflation expectations and an improvedgrowth outlook.
Spreads between yields of corporate andgovernment bond have narrowed substantially,reflecting declining default perceptions. In moneymarkets, conditions have continued to improve
since the beginning of this year. For the majority of
banks in the euro area, the access to market-basedfinancing continues to normalise. Bank creditprovision to the economy has improved further.
8/7/2019 Prévisions intermédiaires de croissance pour 2011
http://slidepdf.com/reader/full/previsions-intermediaires-de-croissance-pour-2011 3/12
3
Interim forec ast Feb ruary 2011
Bank lending to households has continued to
increase, whilst remaining subdued. The volume of bank loans to the non-financial corporate sector
continued falling, but at lower rates. The latest ECBBank Lending Survey points to slightly tightening(house purchases) or stable (non-financial corporatesector) credit standards in parallel with stronger demand for lending, amid continued constraints onbanks' balance sheets. EU recove ry mak ing head way
As expected in autumn, the pace of EU economicactivity moderated in the second half of 2010. Thisreflected the phasing out of temporary supportmeasures and the slowdown in global activity,
which dampened EU export growth. In the thirdquarter of 2010, GDP growth in the euro area and
the EU softened to 0.3% and 0.5% respectively,compared to the previous quarter. In the finalquarter, according to Eurostat's Flash estimate,GDP expanded by 0.3% from the previous quarter in the euro area and by 0.2% in the EU. In a fewcountries, GDP growth in the fourth quarter was
negatively affected by the exceptionally harshwinter weather. Activity in these countries is
expected to bounce back in the first quarter of 2011.In 2010 as a whole, GDP is estimated to havegrown by 1.8% in the EU and 1.7% in the euroarea, in line with the autumn forecast.
Grap h 4: Imp roving prospec ts for EU eq uipme nt investme nt
-14
-12
-10
-8
-6
-4
-2
0
2
4
00 01 02 03 04 05 06 07 08 09 10 11
-7
-6
-5
-4
-3
-2
-1
0
1
2
3
Equipment investment (LHS)Industrial confidence (ma3, RHS)Order books (ma3, RHS)
q-o-q% balance (normalised)
*ma3=3 mo nths moving average
Source: European Commission
The economic outlook for the EU in 2011 hasslightly improved compared to the autumn forecast.
The upward revision to EU GDP growth issupported by slightly better prospects for the globaleconomy, in particular in the US, as well as by
stronger sentiment. Indeed, the elevated levels of
the Economic Sentiment Indicator as well as of thecomposite PMI suggest solid growth going forward.
The improved outlook for the external environmentwill provide a boost to EU exports, particularly in
the more export-oriented economies. In line withthis view, managers' assessment of export order books has improved strongly over the last threemonths.
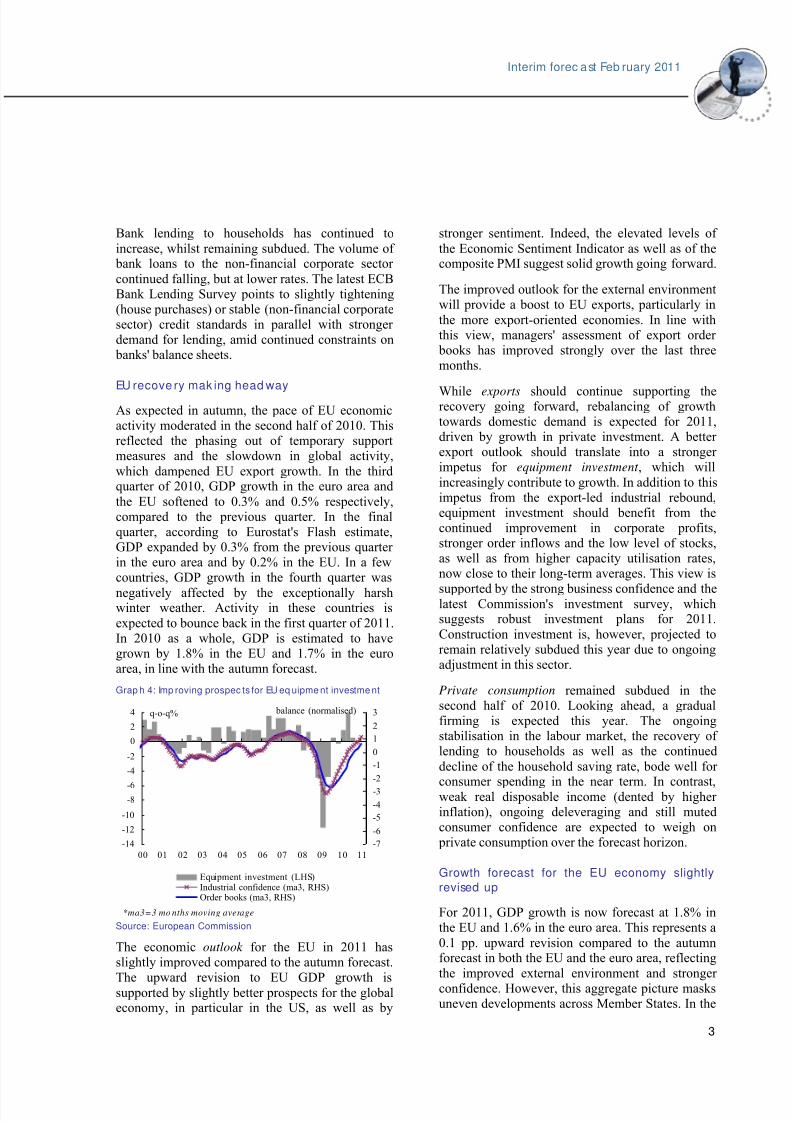
While exports should continue supporting therecovery going forward, rebalancing of growthtowards domestic demand is expected for 2011,driven by growth in private investment. A better export outlook should translate into a stronger impetus for equipment investment , which will
increasingly contribute to growth. In addition to thisimpetus from the export-led industrial rebound,equipment investment should benefit from thecontinued improvement in corporate profits,stronger order inflows and the low level of stocks,as well as from higher capacity utilisation rates,now close to their long-term averages. This view is
supported by the strong business confidence and thelatest Commission's investment survey, whichsuggests robust investment plans for 2011.
Construction investment is, however, projected toremain relatively subdued this year due to ongoingadjustment in this sector.
Private consumption remained subdued in thesecond half of 2010. Looking ahead, a gradualfirming is expected this year. The ongoingstabilisation in the labour market, the recovery of lending to households as well as the continued
decline of the household saving rate, bode well for
consumer spending in the near term. In contrast,weak real disposable income (dented by higher inflation), ongoing deleveraging and still mutedconsumer confidence are expected to weigh onprivate consumption over the forecast horizon. Growth forecast for the EU economy slightly
revised up
For 2011, GDP growth is now forecast at 1.8% inthe EU and 1.6% in the euro area. This represents a
0.1 pp. upward revision compared to the autumnforecast in both the EU and the euro area, reflecting
the improved external environment and stronger confidence. However, this aggregate picture masksuneven developments across Member States. In the
8/7/2019 Prévisions intermédiaires de croissance pour 2011
http://slidepdf.com/reader/full/previsions-intermediaires-de-croissance-pour-2011 4/12
4
Interim forecast February 2011
euro area, Germany is expected to lead the ongoing
recovery, with GDP growth projected at 2.4%,followed by France (1.7%) while Spain's recovery
remains muted (0.8%). Outside the euro area,growth in Poland and the UK is respectivelyprojected at 4.1% and 2.0%. All thesedevelopments confirm the Commission'sexpectation of a multi-speed recovery within theEU. As argued in previous forecast documents, this
is not surprising given differences in the scale of adjustment challenges and ongoing rebalancingwithin the EU and euro area.
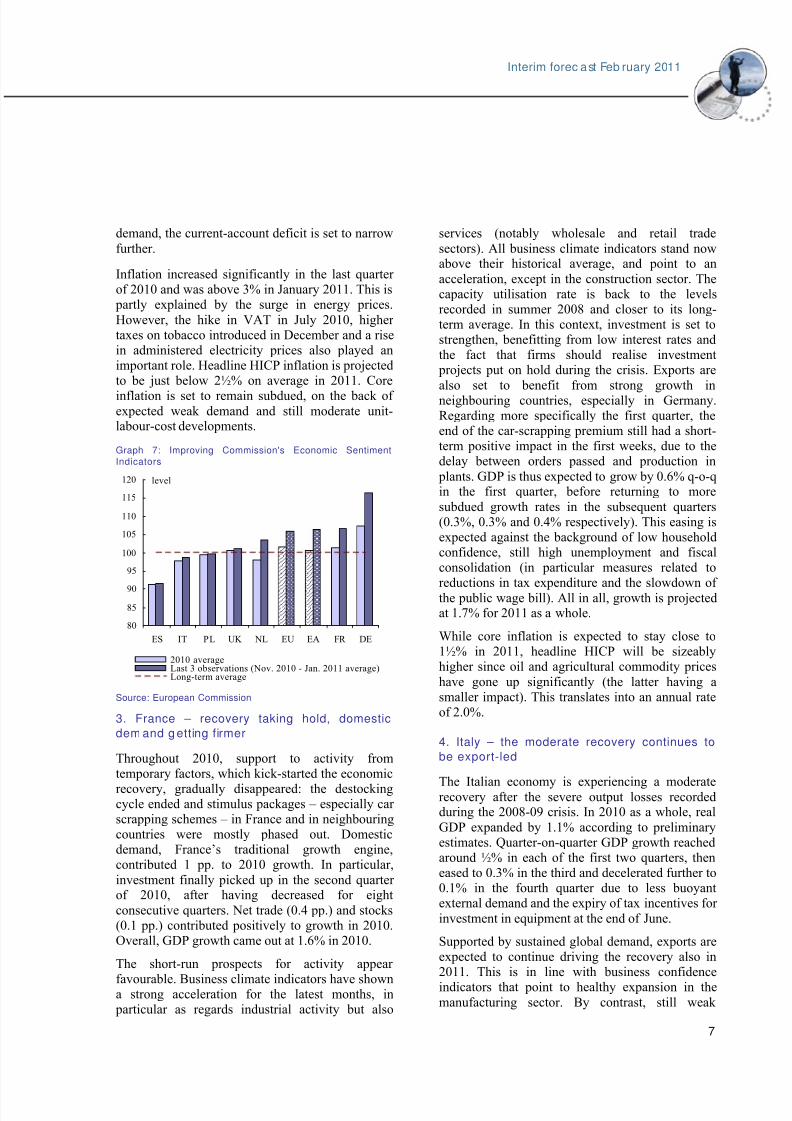
Hea dline inflation up while co re rem ains low
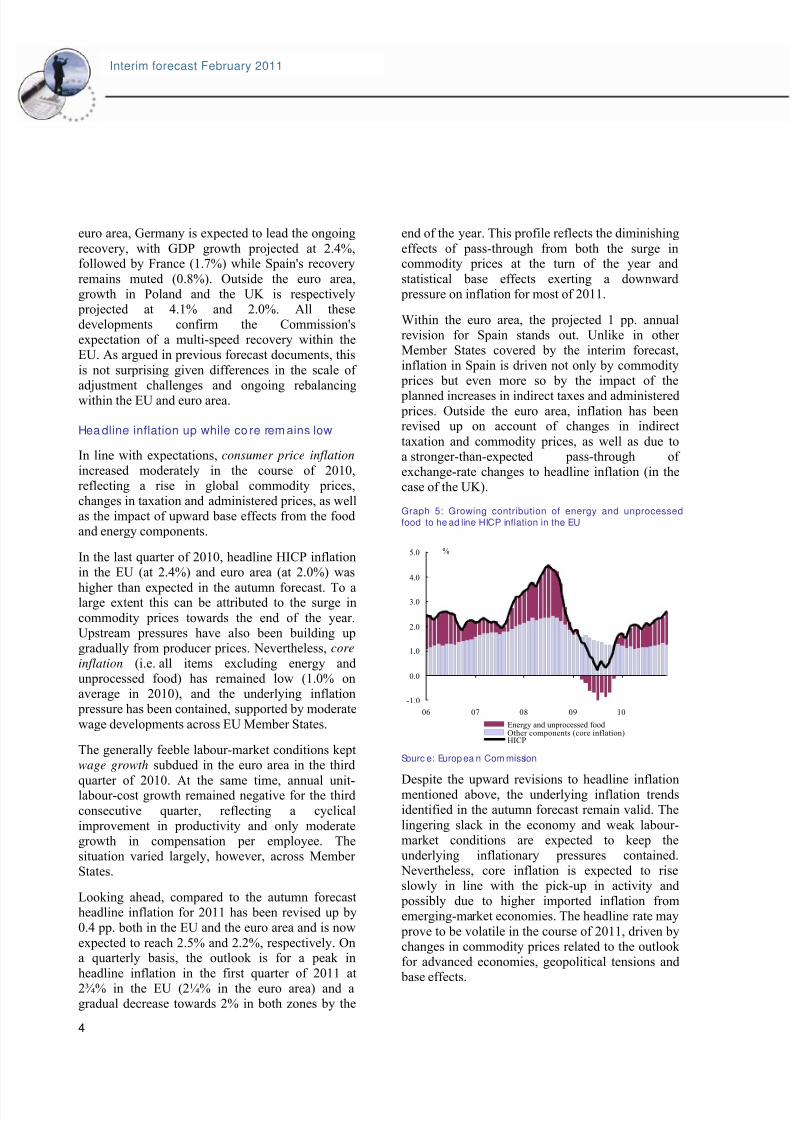
In line with expectations, consumer price inflation increased moderately in the course of 2010,reflecting a rise in global commodity prices,changes in taxation and administered prices, as wellas the impact of upward base effects from the foodand energy components.
In the last quarter of 2010, headline HICP inflationin the EU (at 2.4%) and euro area (at 2.0%) was
higher than expected in the autumn forecast. To alarge extent this can be attributed to the surge in
commodity prices towards the end of the year.Upstream pressures have also been building upgradually from producer prices. Nevertheless, core
inflation (i.e. all items excluding energy andunprocessed food) has remained low (1.0% onaverage in 2010), and the underlying inflationpressure has been contained, supported by moderate
wage developments across EU Member States.
The generally feeble labour-market conditions keptwage growth subdued in the euro area in the third
quarter of 2010. At the same time, annual unit-labour-cost growth remained negative for the third
consecutive quarter, reflecting a cyclicalimprovement in productivity and only moderategrowth in compensation per employee. Thesituation varied largely, however, across Member States.
Looking ahead, compared to the autumn forecastheadline inflation for 2011 has been revised up by0.4 pp. both in the EU and the euro area and is now
expected to reach 2.5% and 2.2%, respectively. Ona quarterly basis, the outlook is for a peak in
headline inflation in the first quarter of 2011 at2¾% in the EU (2¼% in the euro area) and agradual decrease towards 2% in both zones by the
end of the year. This profile reflects the diminishing
effects of pass-through from both the surge incommodity prices at the turn of the year and
statistical base effects exerting a downwardpressure on inflation for most of 2011.
Within the euro area, the projected 1 pp. annualrevision for Spain stands out. Unlike in other Member States covered by the interim forecast,inflation in Spain is driven not only by commodityprices but even more so by the impact of the
planned increases in indirect taxes and administeredprices. Outside the euro area, inflation has beenrevised up on account of changes in indirect
taxation and commodity prices, as well as due toa stronger-than-expected pass-through of exchange-rate changes to headline inflation (in thecase of the UK).
Graph 5: Growing contribution of energy and unprocessed
food to he ad line HICP inflation in the EU
-1.0
0.0
1.0
2.0
3.0
4.0
5.0
06 07 08 09 10
%
Energy and unprocessed foodOther components (core inflation)HICP
Sourc e: Europ ea n Com mission
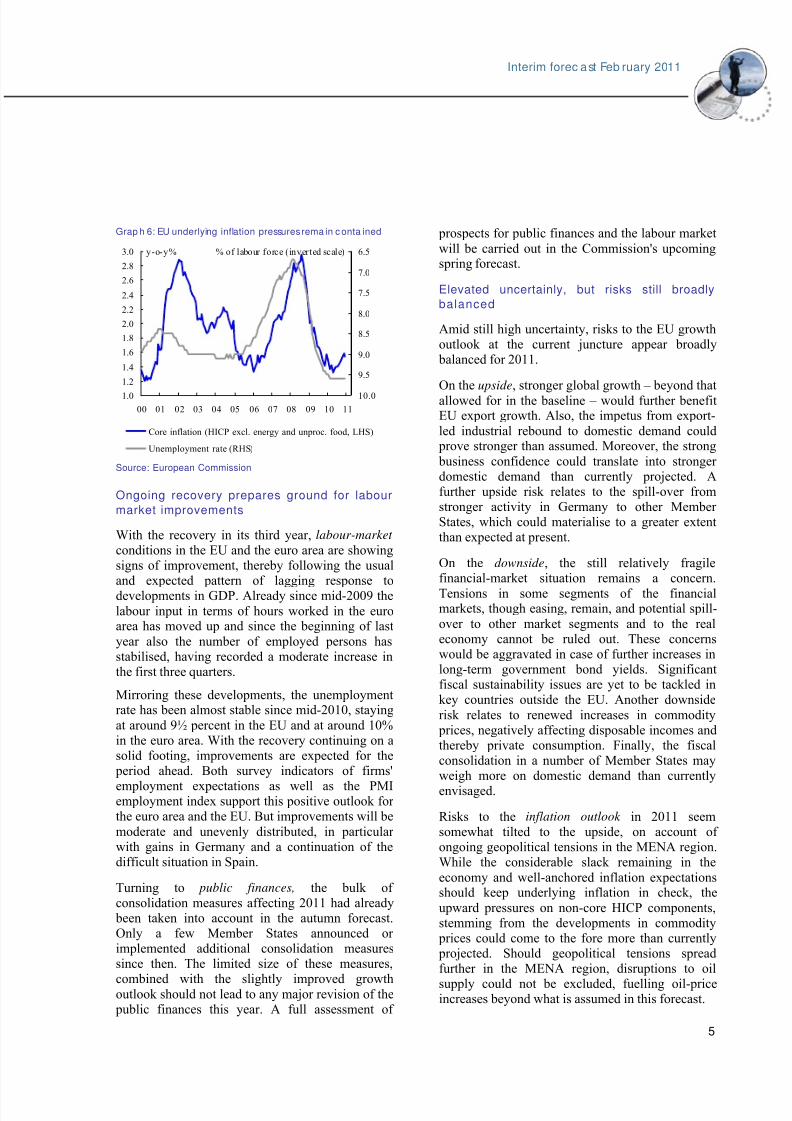
Despite the upward revisions to headline inflationmentioned above, the underlying inflation trendsidentified in the autumn forecast remain valid. The
lingering slack in the economy and weak labour-market conditions are expected to keep theunderlying inflationary pressures contained.Nevertheless, core inflation is expected to riseslowly in line with the pick-up in activity andpossibly due to higher imported inflation fromemerging-market economies. The headline rate may
prove to be volatile in the course of 2011, driven bychanges in commodity prices related to the outlook for advanced economies, geopolitical tensions and
base effects.
8/7/2019 Prévisions intermédiaires de croissance pour 2011
http://slidepdf.com/reader/full/previsions-intermediaires-de-croissance-pour-2011 5/12
5
Interim forec ast Feb ruary 2011
Grap h 6: EU underlying inflation pressures rema in c onta ined
1.0
1.2
1.4
1.6
1.8
2.0
2.2
2.4
2.6
2.8
3.0
00 01 02 03 04 05 06 07 08 09 10 11
6.5
7.0
7.5
8.0
8.5
9.0
9.5
10.0
Core inflation (HICP excl. energy and unproc. food, LHS)
Unemployment rate (RHS)
y-o-y% % of labour force (inverted scale)
Source: European Commission
Ongoing recovery prepares ground for labour
market improvements
With the recovery in its third year, labour-market conditions in the EU and the euro area are showingsigns of improvement, thereby following the usualand expected pattern of lagging response todevelopments in GDP. Already since mid-2009 the
labour input in terms of hours worked in the euroarea has moved up and since the beginning of last
year also the number of employed persons hasstabilised, having recorded a moderate increase inthe first three quarters.
Mirroring these developments, the unemploymentrate has been almost stable since mid-2010, staying
at around 9½ percent in the EU and at around 10%in the euro area. With the recovery continuing on asolid footing, improvements are expected for theperiod ahead. Both survey indicators of firms'
employment expectations as well as the PMIemployment index support this positive outlook for the euro area and the EU. But improvements will be
moderate and unevenly distributed, in particular with gains in Germany and a continuation of thedifficult situation in Spain.
Turning to public finances, the bulk of consolidation measures affecting 2011 had alreadybeen taken into account in the autumn forecast.Only a few Member States announced or implemented additional consolidation measuressince then. The limited size of these measures,
combined with the slightly improved growthoutlook should not lead to any major revision of thepublic finances this year. A full assessment of
prospects for public finances and the labour market
will be carried out in the Commission's upcomingspring forecast.
Elevated uncertainly, but risks still broadly
balanced
Amid still high uncertainty, risks to the EU growthoutlook at the current juncture appear broadlybalanced for 2011.
On the upside, stronger global growth – beyond that
allowed for in the baseline – would further benefitEU export growth. Also, the impetus from export-
led industrial rebound to domestic demand couldprove stronger than assumed. Moreover, the strong
business confidence could translate into stronger domestic demand than currently projected. Afurther upside risk relates to the spill-over fromstronger activity in Germany to other Member States, which could materialise to a greater extentthan expected at present.
On the downside, the still relatively fragilefinancial-market situation remains a concern.
Tensions in some segments of the financialmarkets, though easing, remain, and potential spill-
over to other market segments and to the realeconomy cannot be ruled out. These concernswould be aggravated in case of further increases inlong-term government bond yields. Significantfiscal sustainability issues are yet to be tackled inkey countries outside the EU. Another downside
risk relates to renewed increases in commodityprices, negatively affecting disposable incomes andthereby private consumption. Finally, the fiscalconsolidation in a number of Member States mayweigh more on domestic demand than currentlyenvisaged.
Risks to the inflation outlook in 2011 seemsomewhat tilted to the upside, on account of ongoing geopolitical tensions in the MENA region.While the considerable slack remaining in the
economy and well-anchored inflation expectationsshould keep underlying inflation in check, the
upward pressures on non-core HICP components,stemming from the developments in commodityprices could come to the fore more than currentlyprojected. Should geopolitical tensions spreadfurther in the MENA region, disruptions to oil
supply could not be excluded, fuelling oil-priceincreases beyond what is assumed in this forecast.
8/7/2019 Prévisions intermédiaires de croissance pour 2011
http://slidepdf.com/reader/full/previsions-intermediaires-de-croissance-pour-2011 6/12
6
Interim forecast February 2011
Growth and inflation prospects in the seven
largest Mem ber States
1. Germany – robust and broad-based
recovery continues
The German economy rebounded strongly from therecession, with real GDP estimated to haveincreased by 3.6% in 2010, the highest growth ratesince the early 1990s. Exports expanded buoyantly,
largely reversing the massive decline recorded in
2009 and paving the way for a broader-basedrecovery of the German economy. Indeed, thehighest growth contribution came from domesticdemand (2.5 pps., including inventories).Catching-up effects after the crisis, increased public
spending on infrastructure and rapidly increasingcapacity utilisation led to a rebound in investment,
while private consumption was supported by therobust performance of the labour market asevidenced by rising employment and hours worked.As expected in the autumn, the pace of economicexpansion slowed somewhat in the second half of the year, with real GDP expanding by 0.7% in the
third and 0.4% q-o-q in the fourth quarter. Theslightly stronger-than-expected slowdown in the
final quarter reflected the exceptionally harshweather conditions. These hit investment mostseverely, notably activity in the construction sector.
A marked technical rebound in the first quarter of
2011 is expected to reverse the latest development.In the following quarters, economic activity shouldcontinue to expand steadily, confirming the outlook for a broad-based recovery. Further gradualemployment gains and a pick-up in wage growthshould underpin the momentum of private
consumption. Likewise, full order books,favourable real interest rates and lower capital
exports after the end of asset booms abroadcontributing to the absence of credit supplybottlenecks, should further sustain domesticinvestment. While slowing somewhat compared to2010, exports should continue to benefit fromexpanding world trade.
The improved outlook for trading partnerscompared to the autumn forecast, record-highbusiness confidence and the technical rebound atthe beginning of the year, imply that real GDP isnow projected to expand by 2.4% in 2011, despite
the statistical carry-over from 2010 being slightlylower than previously forecast.
HICP inflation surprised on the upside in the last
quarter of 2010 and in January 2011, essentiallyreflecting higher-than-expected energy prices. High
oil prices should continue to exert upward pressurein 2011, with headline inflation now expected at2.2% for the year as a whole. However, coreinflation should remain contained and, althoughwages are expected to grow more buoyantly, theimpact on unit labour costs should remain limited,given sound productivity growth.
2. Spain – external demand sustains economic
activity
Quarterly real GDP in Spain increased by 0.2% in
the fourth quarter of 2010, after having remainedflat in the third quarter. For the year as a whole,
economic activity is estimated to have contractedby 0.1%, slightly less than expected in the autumnforecast. Domestic demand is set to have draggeddown GDP growth by 1¼ pps., while net externaldemand contributed positively by around 1 pp.
Annual real GDP growth is projected at 0.8% in
2011. Net exports will continue to provide asignificant positive contribution to growth, while
the drag from domestic demand will be smaller thanin 2010. Domestic demand is expected to remain
weak this year as unemployment remains at arecord high, residential construction adjusts further,the deleveraging of households and firms continues,and the public sector restraints consumption andinvestment expenditures. Progress in fiscalconsolidation and structural reforms in the labour market, pension system and banking sector has had
a positive impact on sentiment in the Spanishsovereign bond market. Nevertheless, overall credit
conditions in the private sector have becometighter. A further moderate decline in the householdsavings ratio from the 2009 peak will neverthelessallow modest growth of private consumption.Improvements in industry confidence and, morespecifically, in export order books, suggest that the
recovery of external demand at the end of 2010 willcontinue in 2011. This will provide some support toprivate investment.
Exports in 2011 are expected to grow faster thanpreviously forecast, in line with the improvedoutlook for global demand and some improvement
in cost competitiveness. With import growthprojected to remain subdued amidst weak domestic
8/7/2019 Prévisions intermédiaires de croissance pour 2011
http://slidepdf.com/reader/full/previsions-intermediaires-de-croissance-pour-2011 7/12
7
Interim forec ast Feb ruary 2011
demand, the current-account deficit is set to narrow
further.
Inflation increased significantly in the last quarter of 2010 and was above 3% in January 2011. This ispartly explained by the surge in energy prices.
However, the hike in VAT in July 2010, higher taxes on tobacco introduced in December and a risein administered electricity prices also played animportant role. Headline HICP inflation is projectedto be just below 2½% on average in 2011. Core
inflation is set to remain subdued, on the back of expected weak demand and still moderate unit-labour-cost developments.
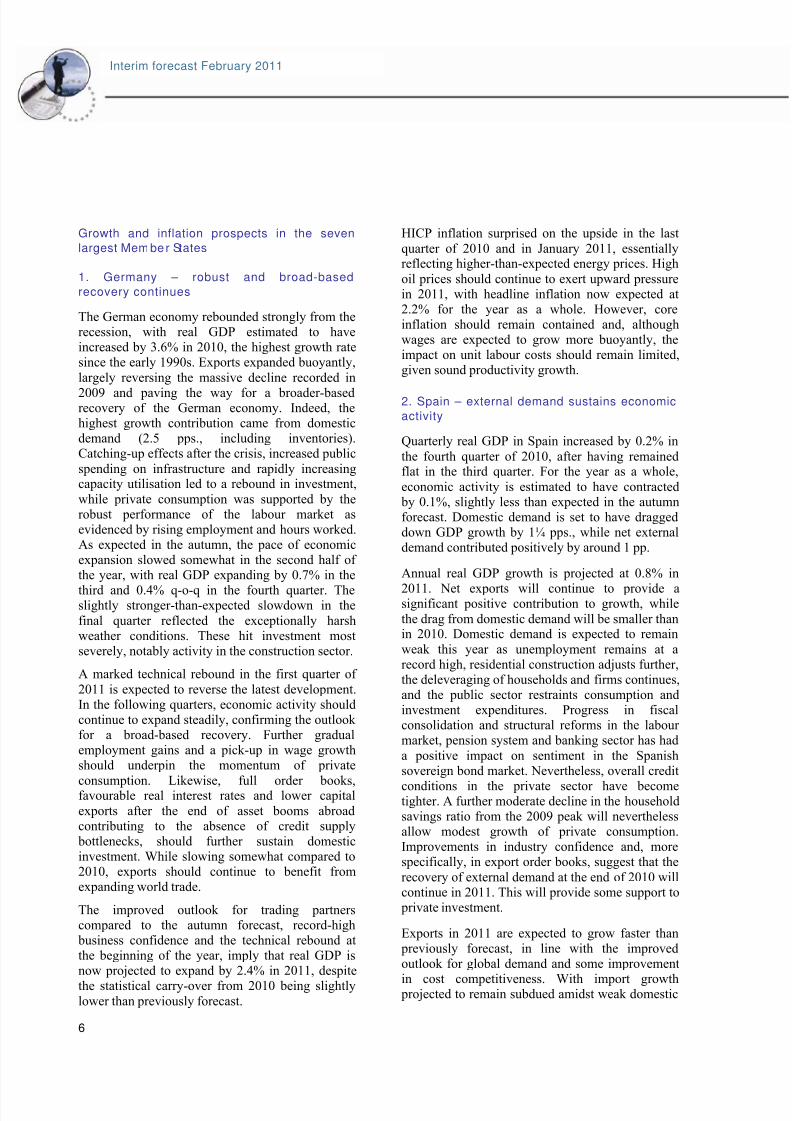
Graph 7: Improving Commission's Economic Sentiment
Indicators
80
85
90
95
100
105
110
115
120
ES IT PL UK NL EU EA FR DE
2010 averageLast 3 observations (Nov. 2010 - Jan. 2011 average)Long-term average
level
Source: European Commission
3. France – recovery taking hold, domestic
dem and g etting firmer
Throughout 2010, support to activity fromtemporary factors, which kick-started the economic
recovery, gradually disappeared: the destockingcycle ended and stimulus packages – especially car scrapping schemes – in France and in neighbouringcountries were mostly phased out. Domesticdemand, France’s traditional growth engine,contributed 1 pp. to 2010 growth. In particular,
investment finally picked up in the second quarter of 2010, after having decreased for eight
consecutive quarters. Net trade (0.4 pp.) and stocks(0.1 pp.) contributed positively to growth in 2010.Overall, GDP growth came out at 1.6% in 2010.
The short-run prospects for activity appear
favourable. Business climate indicators have showna strong acceleration for the latest months, inparticular as regards industrial activity but also
services (notably wholesale and retail trade
sectors). All business climate indicators stand nowabove their historical average, and point to an
acceleration, except in the construction sector. Thecapacity utilisation rate is back to the levelsrecorded in summer 2008 and closer to its long-term average. In this context, investment is set tostrengthen, benefitting from low interest rates andthe fact that firms should realise investmentprojects put on hold during the crisis. Exports are
also set to benefit from strong growth inneighbouring countries, especially in Germany.Regarding more specifically the first quarter, theend of the car-scrapping premium still had a short-term positive impact in the first weeks, due to thedelay between orders passed and production in
plants. GDP is thus expected to grow by 0.6% q-o-qin the first quarter, before returning to more
subdued growth rates in the subsequent quarters(0.3%, 0.3% and 0.4% respectively). This easing isexpected against the background of low householdconfidence, still high unemployment and fiscalconsolidation (in particular measures related to
reductions in tax expenditure and the slowdown of the public wage bill). All in all, growth is projectedat 1.7% for 2011 as a whole.
While core inflation is expected to stay close to1½% in 2011, headline HICP will be sizeablyhigher since oil and agricultural commodity prices
have gone up significantly (the latter having asmaller impact). This translates into an annual rateof 2.0%.
4. Italy – the moderate recovery continues to
be export-led
The Italian economy is experiencing a moderaterecovery after the severe output losses recordedduring the 2008-09 crisis. In 2010 as a whole, real
GDP expanded by 1.1% according to preliminaryestimates. Quarter-on-quarter GDP growth reachedaround ½% in each of the first two quarters, theneased to 0.3% in the third and decelerated further to0.1% in the fourth quarter due to less buoyantexternal demand and the expiry of tax incentives for
investment in equipment at the end of June.
Supported by sustained global demand, exports areexpected to continue driving the recovery also in2011. This is in line with business confidenceindicators that point to healthy expansion in the
manufacturing sector. By contrast, still weak
8/7/2019 Prévisions intermédiaires de croissance pour 2011
http://slidepdf.com/reader/full/previsions-intermediaires-de-croissance-pour-2011 8/12
8
Interim forecast February 2011
labour- market conditions and higher imported
inflation are set to dampen private consumptiondynamics. Investment is expected to grow
moderately. On the one hand, it is set to benefitfrom improved profitability and credit conditions.On the other hand, still low levels of capacityutilisation leave little scope for new investmentplans. Overall, GDP growth in 2011 is projected atthe same rate as in 2010 (1.1%), confirming the
autumn 2010 forecast, with quarter-on-quarter growth at around 0.3-0.4% throughout the year.
After a sizeable decline in 2009, HICP inflationincreased to 1.6% on average in 2010. The
acceleration of prices in the last quarter of 2010was mainly due to the dynamics of the energy
component, amplified by a base effect from 2009.In 2011, HICP inflation is expected to reach 2.2%on average. This is a 0.4 pp. upward revisioncompared to the autumn 2010 forecast attributableto the assumption of higher oil prices, while nomajor second-round effects are expected, mainly
thanks to the reformed wage bargaining framework that uses forecast HICP inflation excluding prices
of imported energy as a benchmark.
5. The Netherlands – consumption crucial for
continued recovery
The economic recovery that started in the secondhalf of 2009 came to a sudden halt in the third
quarter of 2010, largely due to a significantnegative contribution from stocks to real GDPgrowth. In the fourth quarter, the economy startedto grow again, with real GDP increasing by 0.6% q-o-q. In 2010 as a whole, economic growth isexpected to have reached 1.7%, with domestic
demand and net exports contributing by 0.7% and1.0% respectively.
For 2011, economic activity is forecast to continuegrowing at the modest pace of 1.7%. Exports, the
traditional driver of the Dutch economy, are likelyto contribute only moderately to growth in 2011.Furthermore, domestic demand growth, despitereturning to positive territory in 2011, is set to beslowed down by several factors. Firstly, from 2011on, the fiscal stimulus measures will be phased out.In addition, the government has embarked on an
ambitious consolidation strategy. For investment,the outlook remains rather weak. Despite strong
improvements in industrial sentiment, the capacityutilisation rate stabilised in recent quarters at
around 78%, still significantly below the pre-crisis
level of around 82%. This suggests that growth inprivate investment could be limited to replacement
investments, as there is no need yet to increase totalcapacity. Furthermore, the recent tightening of criteria for credit approval by banks to corporationsand the rise in long-term interest rates also do notsupport the outlook for private investment. In thiscontext, the continuation of the recovery willcrucially depend on developments in private
consumption. As modest wage increases and higher inflation put real disposable income under pressure,it is unlikely that consumption will be able to play apivotal role in this respect. However, a positiveimpact could come from the labour market, wheredevelopments, in particular in unemployment,
continue to outperform expectations.
The annual HICP inflation rate came in at 0.9% in2010 and is expected to rise to 1.7% in 2011. Theprojected increase mainly results from the recent
rise in oil and food prices, which are expected tomostly feed through in the HICP in the first half of 2011 as they tend to have lagged effects on
inflation in the Netherlands.
6. Poland – accelerating domestic demand
supp orts rebound
Economic activity accelerated in the third quarter of 2010, with real GDP growth reaching 1.3% q-o-q,while in the last quarter of 2010 it is estimated tohave increased by 0.9% q-o-q. Continued robustperformance in the second half of the year can beattributed to strong consumer spending, as
households brought forward some of their spendingfrom 2011 in fear of tax and price hikes.
For 2010 as a whole, real GDP grew by 3.8%, one
of the highest growth rates in the EU. This wasmainly due to a sharp rebound in world trade in the
first half of the year, fuelling manufacturing activityand resilient consumer spending, resulting fromimproving confidence as the labour market survivedthe crisis broadly unscathed. However, privateinvestment continued to suffer from uncertaintiesregarding the global recovery, despite the strong
financial position of the corporate sector andincreasing capacity utilisation levels. All in all, realGDP growth in 2010 was driven by domestic
demand, predominantly private consumption andinventories, while the contribution of net exportsremained broadly neutral throughout the year.
8/7/2019 Prévisions intermédiaires de croissance pour 2011
http://slidepdf.com/reader/full/previsions-intermediaires-de-croissance-pour-2011 9/12
9
Interim forec ast Feb ruary 2011
Quarterly real GDP growth is projected to ease
further to 0.8% q-o-q in the first quarter of 2011, asVAT increases and inflation pick-up are expected
to hamper temporarily private consumption. RealGDP growth is likely to remain stable at around 1%q-o-q thereafter, driven by improving domesticdemand. In particular, business climate indicators,rising above their historical recovery levels, suggestimproved outlook in the private sector. In addition
to the impact of strong public spending ininfrastructure, investment growth will also bepushed up by accelerating private investment.Moreover, moderate employment growth and thestronger-than-expected pick-up in wages are likelyto support consumer spending, despite levelling-off consumer confidence and higher inflation rates.
However, the inventory build-up is set to becomeless supportive after its strong contribution to
growth in 2010. For 2011 as a whole, GDP isprojected to grow by 4.1%.
HICP inflation reached 2.6% y-o-y in 2010, on theback of rising commodity prices. It is expected tohover around the upper bound of central bank's
inflation target of 3.5% in the first half of 2011,reflecting rising commodity prices and improvingdomestic demand, and gradually ease thereafter. 7. United Kingdom – negative shock in the last
quarter of 2010 but ec onom y should reco ver
In the fourth quarter of 2010, UK GDP fell by 0.5%q-o-q, following rapid growth earlier in the year of
1.1% in the second and 0.7% in the third quarter.The autumn forecast had predicted growth of 0.6%in the fourth quarter. December's bad weather was afactor in curtailing the small construction boom and
likely forced the contraction in distribution, hotelsand restaurants, and transport. However, businessservices and finance – less obviously weather-linked – also declined (-0.7%). The UK Office for
National Statistics estimated that GDP would havebeen "flattish" without the snow-effect. 2010 annualgrowth is estimated at 1.4%, with 1 pp. negativecontribution of net exports.
While the fourth quarter's poor performancereduces the expected level of 2011 output slightly,it improves growth prospects for the first half of 2011 as snow-hit sectors return to normal and
postponed construction activity catches up. Thegrowth forecasts for the first and second quarter
have therefore been revised up to 1.0% and 0.6%
respectively. Otherwise the quarterly profileremains unchanged, yielding 2011 annual growth of
2.0%, only slightly below the autumn forecastreflecting a lower carry-over from 2010. Growth in2011 should be driven by net exports and corporateinvestment, offsetting falling governmentconsumption. Private consumption growth is likelyto be weak but still positive, in spite of contractingreal wages, as consumers prop up spending by
reducing savings. Exports should improve givensterling's stability well below pre-crisis levels andstrength in some major export markets, particularlythe US. Stronger exports, a credible policyenvironment and investment levels well below pre-crisis peaks should support corporate investment,
expected to gather pace in 2011, financed by thehigh savings accumulated in the corporate sector.
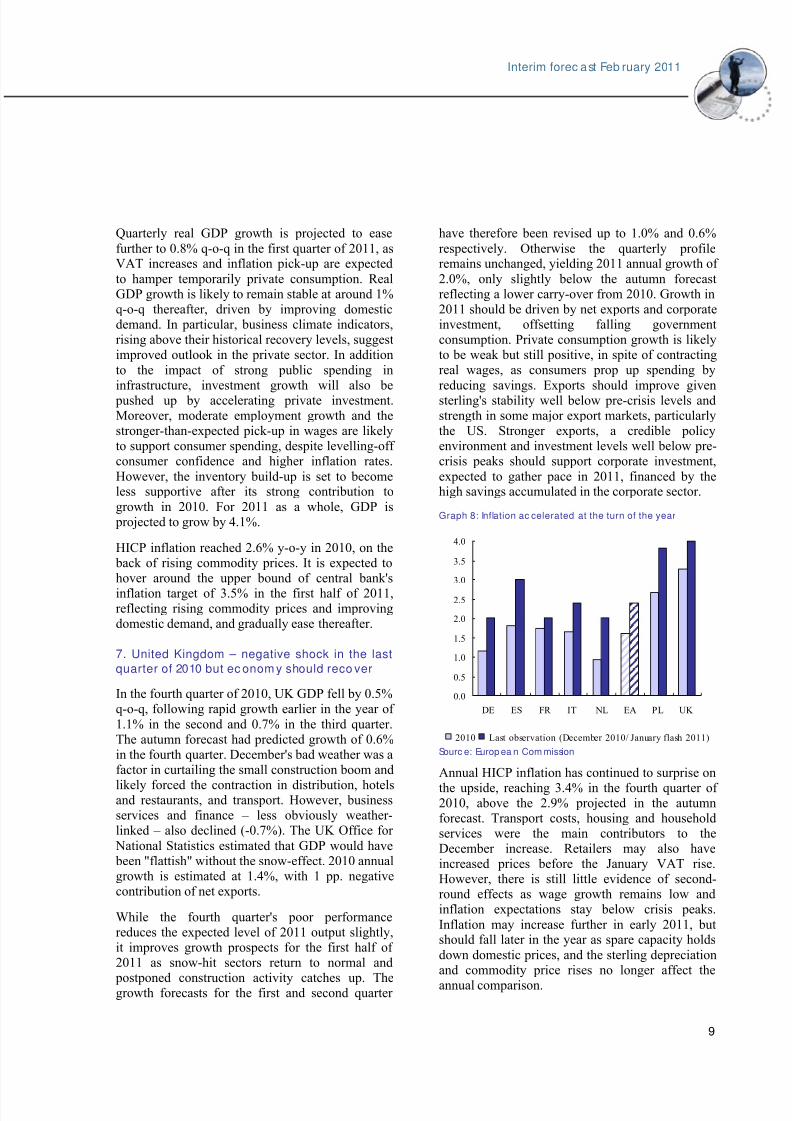
Graph 8: Inflation ac celerated at the turn of the year
0.0
0.5
1.0
1.5
2.0
2.5
3.0
3.5
4.0
DE ES FR IT NL EA PL UK
2010 Last observation (December 2010/ January flash 2011)
Sourc e: Europ ea n Com mission
Annual HICP inflation has continued to surprise on
the upside, reaching 3.4% in the fourth quarter of 2010, above the 2.9% projected in the autumnforecast. Transport costs, housing and householdservices were the main contributors to theDecember increase. Retailers may also haveincreased prices before the January VAT rise.However, there is still little evidence of second-round effects as wage growth remains low andinflation expectations stay below crisis peaks.
Inflation may increase further in early 2011, butshould fall later in the year as spare capacity holds
down domestic prices, and the sterling depreciationand commodity price rises no longer affect the
annual comparison.
8/7/2019 Prévisions intermédiaires de croissance pour 2011
http://slidepdf.com/reader/full/previsions-intermediaires-de-croissance-pour-2011 10/12
10
Interim forecast February 2011
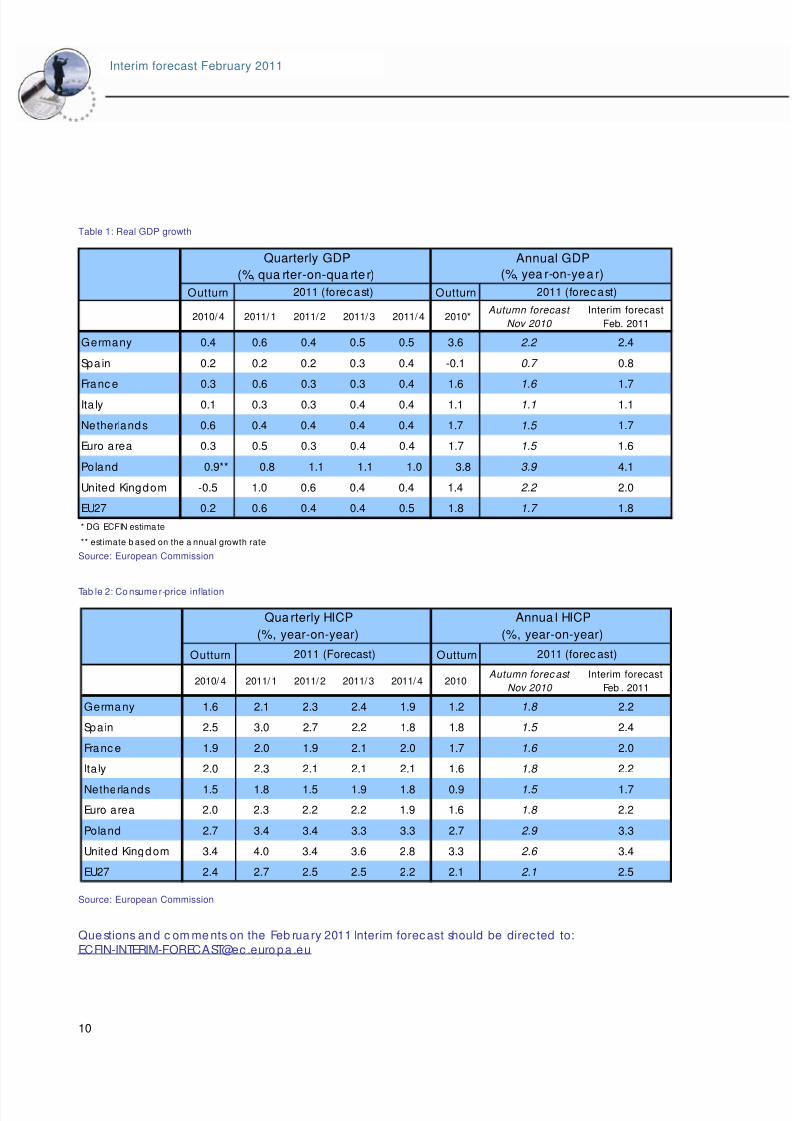
Table 1: Real GDP growth
Outturn Outturn
2010/4 2011/1 2011/2 2011/3 2011/4 2010*Autumn forecast
Nov 2010
Interim forecast
Feb. 2011
Germany 0.4 0.6 0.4 0.5 0.5 3.6 2.2 2.4
Spa in 0.2 0.2 0.2 0.3 0.4 -0.1 0.7 0.8
Franc e 0.3 0.6 0.3 0.3 0.4 1.6 1.6 1.7
Ita ly 0.1 0.3 0.3 0.4 0.4 1.1 1.1 1.1
Netherlands 0.6 0.4 0.4 0.4 0.4 1.7 1.5 1.7
Euro area 0.3 0.5 0.3 0.4 0.4 1.7 1.5 1.6
Poland 0.9** 0.8 1.1 1.1 1.0 3.8 3.9 4.1
United Kingdom -0.5 1.0 0.6 0.4 0.4 1.4 2.2 2.0
EU27 0.2 0.6 0.4 0.4 0.5 1.8 1.7 1.8
* DG ECFIN estima te
** estimate b ased on the a nnual growth rate
2011 (forecast) 2011 (forecast)
Quarterly GDP
(%, qua rter-on-qua rte r)
Annual GDP
(%, yea r-on-year)
Source: European Commission
Tab le 2: Co nsume r-price inflation
Outturn Outturn
2010/ 4 2011/ 1 2011/ 2 2011/ 3 2011/ 4 2010Autumn forec ast
Nov 2010
Interim forecast
Feb . 2011
Germany 1.6 2.1 2.3 2.4 1.9 1.2 1.8 2.2
Spain 2.5 3.0 2.7 2.2 1.8 1.8 1.5 2.4
Franc e 1.9 2.0 1.9 2.1 2.0 1.7 1.6 2.0
Ita ly 2.0 2.3 2.1 2.1 2.1 1.6 1.8 2.2
Netherlands 1.5 1.8 1.5 1.9 1.8 0.9 1.5 1.7
Euro area 2.0 2.3 2.2 2.2 1.9 1.6 1.8 2.2
Poland 2.7 3.4 3.4 3.3 3.3 2.7 2.9 3.3
United Kingdom 3.4 4.0 3.4 3.6 2.8 3.3 2.6 3.4
EU27 2.4 2.7 2.5 2.5 2.2 2.1 2.1 2.5
Qua rterly HICP
(%, year-on-year)
2011 (Forecast)
Annua l HICP
(%, year-on-year)
2011 (forec ast)
Source: European Commission
Que stions and c om me nts on the Feb rua ry 2011 Interim forecast should be direc ted to:
ECFIN-INTERIM-FORECAST@ec .euro pa .eu
8/7/2019 Prévisions intermédiaires de croissance pour 2011
http://slidepdf.com/reader/full/previsions-intermediaires-de-croissance-pour-2011 11/12
11
Interim forec ast Feb ruary 2011
BOX: TECHNICA L BACKGROUND TO THE INTERIM FORECA ST Tec hnical bac kground
In February 2006, the Commission presented the first of what are now twice-yearly interim forecasts with theobjective of updating its comprehensive spring and
autumn economic forecasts (with the next fully-fledgedforecast scheduled for 13 May 2011). This interimforecast updates the outlook of the autumn 2010
economic forecast of 29 November 2010. The cut-off date for this interim forecast to take new information on
board was 15 February 2011.
The interim forecast updates the outlook for the largestseven EU Member States, i.e. Germany, Spain, France,Italy, the Netherlands, Poland and the United Kingdom
(which are the largest in the EU based on an average of the ranking in terms of both population and nominal
GDP). The update covers real GDP growth and HICPinflation for the current year. These updates are prepared
using indicator-based forecasting models and/or judgemental forecasting techniques.
Estimates for the European Union and the euro area are
prepared using the nominal GDP-weighted updates for the largest Member States. In terms of nominal GDP,
these countries account for 79% of the European Union,while the five euro-area Member States account for 83%of the euro-area aggregate. The outlook for the smaller
Member States has not been individually updated. TheCommission has made projections for the euro area and
the EU using the updates for the five and seven largestMember States respectively, and assuming that therevisions to GDP and inflation for the smaller Member
States are proportionate to those of the larger ones.
Quarterly data are updated with the latest availableinformation. When comparing quarterly with annual GDP
growth it must be kept in mind that, whenever possible,quarterly data are adjusted for both seasonal influences
and the number of working days while annual data ispresented in unadjusted form. Calendar factors are,however, relatively small in 2011 and amount to -0.1 pp.
External c ond itions This forecast is based on a set of external assumptions.
Technical assumptions are used for interest rates, oil
prices and exchange rates. Except for the latter, theseassumptions are based on market expectations at the time
of the forecast. To shield these assumptions from possiblevolatility during one specific trading day, averages from a10-day reference period have been used.
The technical assumption as regards exchange rates has
been standardised using fixed nominal exchange rates for all currencies. They are kept constant based on the
averages from 10 working days up to 11 February,implying e.g. an annual average of USD/EUR of 1.36.
Interest-rate assumptions are, since spring 2007,market-based instead of expert-based. These assumptions
should be interpreted with caution, as market-basedassumptions do not only reflect policy rate expectations,
but also liquidity conditions in a period of marketuncertainty. Short-term interest rates for the euro area arederived from futures contracts. Long-term interest rates
for the euro area, as well as short- and long-term interestrates for Poland and the UK are calculated using implicit
forward swap rates, corrected for the spread between the3-month interbank interest rate and the 3-month
swap-rate. In this forecast, the euro-area short-term rate is
assumed to be at 1.5% and the long-term interest rates at3.4% in 2011.
The outlook for oil prices is based on futures prices. Theprice per barrel of Brent crude oil is projected at 101.6
USD/barrel in 2011 (corresponding to 74.7 EUR/barrel).This would be 12.7 USD/barrel higher (or 10.7EUR/barrel higher) than assumed in the autumn 2010
forecast.
Global demand in 2011 is revised upwards, following theimproved outlook for US growth and a rebound in world
trade and industrial production. Global GDP growth,excluding the EU, is now forecast to reach 4.8% in 2011,about ¼ pp. more than expected in the autumn forecast.
World trade is set to rise moderately in 2011, with growthin export and import volumes (excluding the EU)estimated at around 7½% (down from about 8% in the
autumn forecast).
Acknowledgements
This report was prepared in the Directorate-General for Economic and Financial Affairs under the direction of Marco Buti, Director-General,and Elena Flores Gual, Director of the "Policy strategy and coordination". Executive responsibilities were attached to Reinhard Felke, Head
of Unit for "Forecasts and economic situation", Moisés Orellana, Head of Sector for "Macro-economic forecasts & short-term economic
developments" and the forecast coordinators, Michał Narożny and Laura González Cabanillas.The report benefited from contributions by Piotr Bogumił, Chris Bosma, Mateo Capó Servera, Oliver Dieckmann, Pierre Ecochard,
Małgorzata Galar, Julien Genet, Laura González Cabanillas, Javier Jareño Morago, Bettina Kromen, Karolina Leib, Guy Lejeune, Olivia
Mollen, Marco Montanari, Michał Narożny, Moisés Orellana, Manuel Palazuelos Martínez, Vito Ernesto Reitano, Adriana Reut, Julien
Rousselon, Thomas Springbett, Jonathan van der Heijden and Norbert Wunner.Statistical and layout assistance was provided by Daniela Porubská.
8/7/2019 Prévisions intermédiaires de croissance pour 2011
http://slidepdf.com/reader/full/previsions-intermediaires-de-croissance-pour-2011 12/12
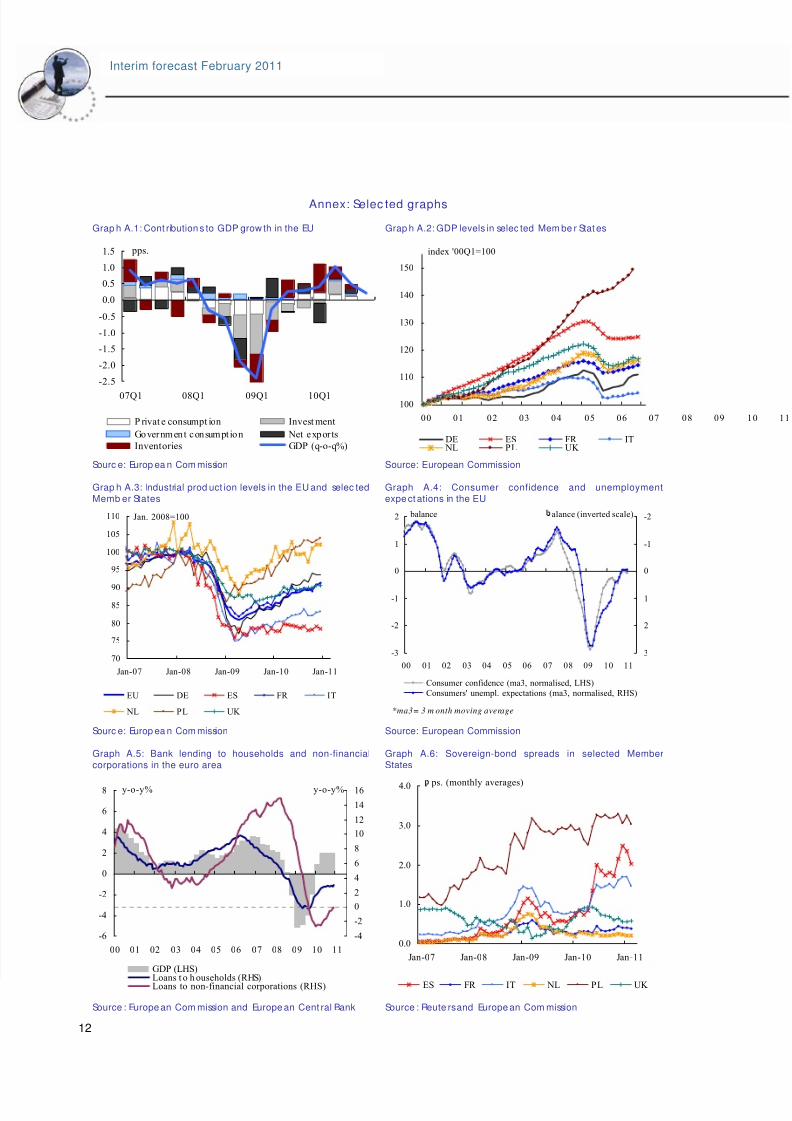
Annex: Selec ted graphs
12
Interim forecast February 2011
Grap h A.1: Cont ribution s to GDP grow th in the EU Grap h A.2: GDP levels in selec ted Mem be r Stat es
-2.5
-2.0
-1.5
-1.0
-0.5
0.0
0.5
1.0
1.5
07Q1 08Q1 09Q1 10Q1
P rivat e consumpt ion Invest ment
Government consumpt ion Net expor ts
Inventories GDP (q-o-q%)
pps.
100
110
120
130
140
150
00 01 02 03 04 05 06 07 08 09 10 11
DE ES FR ITNL PL UK
index '00Q1=100
Sourc e: Europ ea n Com mission
Source: European Commission
Grap h A.3: Industrial prod uct ion levels in the EU and selec ted
Memb er States
Graph A.4: Consumer confidence and unemployment
expe ct ations in the EU
70
75
80
85
90
95
100
105
110
Jan-07 Jan-08 Jan-09 Jan-10 Jan-11
EU DE ES FR IT
NL PL UK
Jan. 2008=100
-3
-2
-1
0
1
2
00 01 02 03 04 05 06 07 08 09 10 11
-2
-1
0
1
2
3
Consumer confidence (ma3, normalised, LHS)
Consumers' unempl. expectations (ma3, normalised, RHS)
alance (inverted scale)balance
*ma3= 3 m onth moving average
Sourc e: Europ ea n Com mission
Source: European Commission
Graph A.5: Bank lending to households and non-financial
corporations in the euro area
Graph A.6: Sovereign-bond spreads in selected Member
States
-6
-4
-2
0
2
4
6
8
00 01 02 03 04 05 06 07 08 09 10 11
-4
-2
0
2
4
6
8
10
12
14
16
GDP (LHS)
Loans t o h ouseholds (RHS)Loans to non-financial corporations (RHS)
y-o-y% y-o-y%
0.0
1.0
2.0
3.0
4.0
Jan-07 Jan-08 Jan-09 Jan-10 Jan-11
ES FR IT NL PL UK
ps. (monthly averages)
Source : Europe an Com mission and Europe an Cent ral Bank Source : Reute rs and Europe an Com mission