Embed Size (px)
Citation preview
Prices and availability of locally produced and imported medicines in Ethiopia
Report of a survey conducted in August 2013
Margaret Ewen, Health Action International Warren Kaplan, Boston University
Teferi Gedif, University of Addis Ababa
December 2016
Contents Executive summary ....................................................................................................................................... 3
Introduction .................................................................................................................................................. 4
Methodology ................................................................................................................................................. 6
Results ........................................................................................................................................................... 8
1. Public sector procurement prices and quantities ............................................................................. 8
2. Patient prices .................................................................................................................................. 12
2.1. Public sector patient prices ..................................................................................................... 12
2.2. Private sector patient prices ................................................................................................... 13
2.3. Other sector patient prices ..................................................................................................... 15
3. Analysis of public sector procurement prices and public sector patient prices ............................. 18
4. Availability ....................................................................................................................................... 18
4.1. Overall availability by sector ................................................................................................... 17
4.2. Availability by product type .................................................................................................... 20
5. Cross-regional analysis .................................................................................................................... 22
5.1. Availability ............................................................................................................................... 22
5.2. Patient prices .......................................................................................................................... 23
6. Country of manufacturer ................................................................................................................ 25
7. Price Components ........................................................................................................................... 26
Discussion.................................................................................................................................................... 29
Recommedations ........................................................................................................................................ 31
Annex 1: Government procurement prices ................................................................................................ 32
Annex 2: Patient prices in the public sector ............................................................................................... 30
Annex 3: Patient prices in the private sector .............................................................................................. 34
Annex 4: Patient prices in the combined other sector ............................................................................... 35
Annex 5: Paired analysis of public sector procurement prices and public sector patient prices ............... 36
Annex 6: Percentage availability of medicines by sector............................................................................ 36
Annex 7. Patient prices of products manufactured by Ethiopian companies, all sectors .......................... 38
2
Executive summary A survey was undertaken in Ethiopia in August 2013 to measure and compare the price and availability of locally produced and imported medicines. The survey used a draft methodology developed by Health Action International (HAI) and the World Health Organization (WHO). Dr. Teferi Gedif from the University of Addis Ababa was the lead investigator of the survey. Methodology: Price and availability data was collected for 25 medicines, both locally produced and imported, in a total of 34 public sector outlets, 30 private pharmacies, and 17 outlets in a mixed sector (municipality pharmacies and health facilities of the Red Cross, Family Guidance Association and NGO’s) across six areas of the country i.e. the capital Addis Ababa, Oromyya/Adama, Amhara, SNNPR, Harari and Afar. Each medicine was strength- and dosage-form specific. For each medicine, data was collected for all products in stock in each outlet on the day of the survey. Government procurement prices and quantities purchased were collected from the Pharmaceutical Fund and Supply Agency (PFSA). Wholesale procurement prices and selling prices were collected from a single private wholesaler in Addis Ababa. Key findings: Government procurement prices and quantities • More locally produced products were procured than imported products • Locally produced products were on average 45% higher priced than the imported products • For some medicines, the government’s 25% local preference policy was being exceeded • Significant savings would be possible if only imported medicines were procured for a few medicines Availability and patient prices in the public sector • Locally produced products had greater mean availability (48%) than imported products (19%).
Overall, availability was sub-optimal at 64%. • Overall, patient prices of locally produced products were 22% higher priced than imported products • The government was charging patients 17% more than the procurement price for locally produced
products, and 53% more for imported products • Locally produced branded generics were more available (37%) than imported branded generics
(10%) but 23% higher priced. INN generics had lower availability for locally produced products (19%) and imports (9%). For INN generics patient prices were similar for local products and imports. No originator brands were found.
Availability and patient prices in the private sector • Locally produced products had greater mean availability (54%) than imported products (35%).
Overall availability was 73%. • Overall, patients were paying 193% more for imported products than for locally produced products • Locally produced branded generics were more available (42%) than imported branded generics
(29%). Patients were paying 153% more for imported branded generics than those made in Ethiopia. • INN generics had low availability for locally produced products (13%) and imports (3%), but similar
patient prices. Originator brands were few in number but high in price. Availability and patient prices in the other sector (Red Cross,FGA,NGO,municipality pharmacies) • Locally produced products had greater mean availability (55%) than imported products (32%).
Overall availability was 76%.
3
• Overall, patients were paying 63% more for imported products than for locally produced products • Locally produced branded generics were more available (40%) than imported branded generics
(25%). Patients were paying 69% more for imported branded generics than those made locally. • Mean availability of locally produced and imported INN generics was 16% and 6%, respectively.
Locally produced INN generics were 30% lower priced than imports. Few originator brands were found. But where found, they were high priced.
Cross-regional analysis • In the public and private sectors, in all six survey regions the availability of locally produced products
was higher than for imported products • In the public sector, locally produced products had higher or similar patient prices to imported
products in all regions. In private pharmacies, the opposite was seen i.e. patient prices of locally produced products were lower than imported products in all regions.
Country of manufacture • Fifty-five percent (55%) of the products found were made in Ethiopia. Of these, all but a few were
made by Addis Pharmaceuticals Factory, EPHARM and Cadila Pharmaceuticals Ethiopia. Across all sectors, overall patient prices were similar across these three companies.
• The largest number of imported products were from India (17.6% of all products found), Cyprus (7.0%), Germany (5.1%) and France (2.8%)
• Across all sectors, patient prices of branded generics made in Ethiopia were 13% lower priced than Indian products, 60% lower than those from Cyprus, and over 90% lower than German products.
Recommendations: • Review government procurement prices and practices for all medicines to identify levels of local
preference, and ascertain the reasons where they exceed 25% • Review the local preference policy as savings would result if the level of local preference was
reduced or abolished • Pass on lower government procurement prices for imported medicines to patients buying medicines
in public sector outlets • Abolish import duties on active pharmaceutical ingredients and finished products, and ensure the
savings are passed onto patients. • Investigate price components in the supply chain to ascertain whether the manufacturer’s selling
prices or the add-on costs (duties, taxes, wholesalers and retailers mark-ups etc.) are making the largest contribution to the final patient price. If it is the add-ons, consideration should be given to regulating mark-ups bearing in mind the possible adverse effects on availability if mark-ups are reduced to a level at which it is no longer profitable to stock and sell that item.
Introduction Ensuring access to medicines is complex; it requires governments, through their policies, to balance the availability of quality assured medicines, whilst ensuring that they are affordable, and at the same time meeting the priority health needs of the population1. An increasing number of governments in middle-income and low-income countries (LMIC) are supporting local production of medicines in the expectation that it will result in increased medicine availability and lower medicine prices.
1 WHO Policy Brief Local production for access to medicinal products. Developing a framework to improve public health 2011; http://www.who.int/phi/publications/local_production/en/
4
This report summarizes the results of a pilot survey undertaken in Ethiopia to measure and compare the price and availability of locally produced and imported medicines. The survey used a draft methodology developed by Health Action International (HAI) and the World Health Organization (WHO), adapted from the WHO/HAI tool to measure medicine prices and availability2. Harvard Pilgrim Health Care Institute developed the Excel workbook for data entry and analysis.
The survey was undertaken in August 2013 by Dr. Teferi Gedif from the University of Addis Ababa. Technical support, which included data analysis, was provided by external consultants Margaret Ewen (HAI )and Warren Kaplan (Boston University). Richard Laing from Boston University reviewed the report. Funding was provided by the WHO Department for Public Health, Innovation, Intellectual Property and Trade.
The survey was designed to answer the following questions: • What price does the government pay for selected medicines that are imported and locally produced
and what quantities are procured? • What is the availability and patient price for selected medicines that are both locally produced and
imported in different sectors? • Do prices and availability for locally produced and imported medicines vary within sectors for
originator brands, branded generics and INN generics, and in different regions of the country? • How do government procurement prices for locally produced and imported medicines compare with
patient prices in the public sector? • How do prices compare with international reference prices? Ethiopian pharmaceutical sector Ethiopia which is classified by the World Bank as a low-income country, has a population of 91.73 million people, and the estimated GNP per capita was US$ 453 in 2012. Per capita public health spending was US$ 16.60, and of the total private expenditure on healthcare, 79.8% was out-of-pocket. The Food, Medicine and Health Care Administration and Control Authority (FMHACA) authorizes the marketing (registration) of medicines in Ethiopia. A list of registered products is published on the FMHACA website. Imported products are charged a higher fee (US$ 700-800) than locally produced products (400 Birr which is approx. US$22). Manufacturers are licensed; overseas manufacturers are inspected every five years against FMHACA GMP guidelines whereas local companies are inspected twice yearly. Importers, wholesalers/distributors, prescribers and pharmacies are also licensed. No active pharmaceutical ingredients (APIs) are manufactured in Ethiopia, however, there are 9 manufacturers of finished dose forms (medicines). The definition of ‘local production’ in Ethiopia refers to the manufacturing of finished dose forms. Medicine prices are not controlled in Ethiopia, nor are prices monitored. When procuring medicines, the government has a local preference of up to 25% i.e. the government will pay up to 25% more for locally produced medicines than for imports. Patients pay for medicines out-of-pocket in public sector outlets. Ethiopia does not apply value added tax (VAT) or goods and services tax/general sales tax (GST) on medicines. However, import duties of 5% are applied to all imported medicines. Import duties are also applied to API’s. Mark-ups in the supply chain are not regulated.
2 WHO/HAI Measuring medicine prices, availability, affordability and price components, 2008; http://haiweb.org/medicineprices/
5
The main agency for procuring and distributing pharmaceuticals in the public sector is the Pharmaceutical Fund and Supply Agency (PFSA). Medicines are procured via tenders and price negotiation. Procurement is based on the National Drug List. The government supply system department has a Central Medical Store. There are eight public warehouses (State/Regional/Provincial).
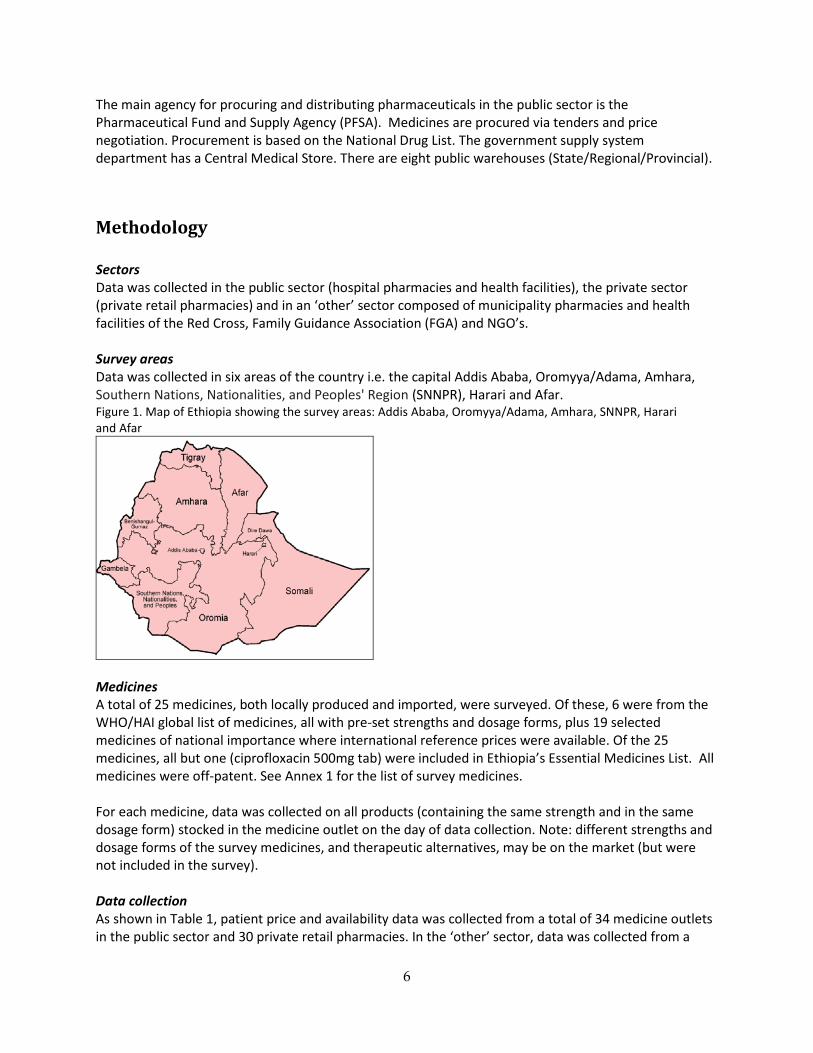
Methodology Sectors Data was collected in the public sector (hospital pharmacies and health facilities), the private sector (private retail pharmacies) and in an ‘other’ sector composed of municipality pharmacies and health facilities of the Red Cross, Family Guidance Association (FGA) and NGO’s. Survey areas Data was collected in six areas of the country i.e. the capital Addis Ababa, Oromyya/Adama, Amhara, Southern Nations, Nationalities, and Peoples' Region (SNNPR), Harari and Afar. Figure 1. Map of Ethiopia showing the survey areas: Addis Ababa, Oromyya/Adama, Amhara, SNNPR, Harari and Afar
Medicines A total of 25 medicines, both locally produced and imported, were surveyed. Of these, 6 were from the WHO/HAI global list of medicines, all with pre-set strengths and dosage forms, plus 19 selected medicines of national importance where international reference prices were available. Of the 25 medicines, all but one (ciprofloxacin 500mg tab) were included in Ethiopia’s Essential Medicines List. All medicines were off-patent. See Annex 1 for the list of survey medicines. For each medicine, data was collected on all products (containing the same strength and in the same dosage form) stocked in the medicine outlet on the day of data collection. Note: different strengths and dosage forms of the survey medicines, and therapeutic alternatives, may be on the market (but were not included in the survey). Data collection As shown in Table 1, patient price and availability data was collected from a total of 34 medicine outlets in the public sector and 30 private retail pharmacies. In the ‘other’ sector, data was collected from a
6
total of 17 outlets; 5 municipality pharmacies, 9 Red Cross health facilities, 1 Family Guidance Association health facility and 2 NGO health facilities. Public sector procurement prices (tender prices for 2013) were collected from the Pharmaceutical Fund and Supply Agency (PFSA). Wholesale procurement prices and selling prices were collected from a single private wholesaler in Addis Ababa. The country of manufacture was identified from product labels. It was not possible to verify the country of manufacture, for each product found in the outlets, from the FMHACA. Table 1. Measurements in each sector
Measurement Public sector Private sector Other sector Availability to patients
Price to patients
Procurement price Wholesale procurement and selling prices 1 (Addis Ababa) Number of medicine outlets sampled 34 30 17
Data collection and data quality assurance The survey manager was trained on use of the survey tool, by the consultants, in July 2013. This training included piloting data collection in a public hospital and a private pharmacy. In August the survey manager held a 2 day training workshop with all survey personnel, which also included piloting data collection. Data collectors worked in pairs. At the end of each day, area supervisors checked each data collection form. Data was validated by area supervisors in one public hospital pharmacy and 2 private retail pharmacies. No inconsistencies were found. Data was double-entered into an Excel spreadsheet designed for the survey, and then checked by the external consultants. The registration status (marketing authorization) of each product found in the survey was checked against the list of registered products on the FMHACA website (http://www.fmhaca.gov.et/). The registration of products not listed on the website was verified with the FMHACA. Data analysis Availability was based on whether the medicine was in the outlet on the day of data collection. For each medicine, where more than one locally produced product or imported product was found in an outlet, the median unit price was calculated and used in the analysis. Prices are expressed as median price ratios (MPR). An MPR is the ratio of the price in local currency (Birr) divided by an international reference price converted to Birr. At the time of the survey, 1 USD = 18.72 Birr. The use of reference prices serves as an external benchmark for price comparisons. An MPR of 1 means the Ethiopian price is equivalent to the reference price, whereas an MPR of 2 means the Ethiopian price is twice the reference price. The international reference prices used for this survey were taken from the 2012 Management Sciences for Health (MSH) International Drug Price Indicator Guide (http://erc.msh.org/). The MSH guide pulls together information from recent price lists of not-for-profit
7
and for-profit suppliers for multisource medicines, and thus reflects the prices governments could be expected to pay for medicines. For patient prices, an MPR was only calculated for a medicine when products were found in more than three outlets surveyed within a sector. Minimum MPRs and maximum MPRs represent the minimum and maximum values found in an outlet. Any products provided free of charge to patients where included in the availability analysis but not in the price analysis. For public sector procurement prices, an MPR was calculated when one or more products were procured. INCO terms were identified for all the products procured by the government. The procurement price for locally produced products covered all costs to the central store (delivered duty paid/DDP in INCO terms). For imported products, one product was found to be Free Carrier (FCA) i.e. the price includes delivery to the carrier or named place in the country of export. Eight products were Free on Board (FOB) i.e. the price includes transportation to the port of shipment in the export country and loading costs. Four products were Cost and Freight (CFR) i.e. the price includes freight charges to the port of entry in Ethiopia. Additional costs to the government to import these products were found to be 15% (on average) of the FOB price for freight costs, 0.5% for insurance, 1-2% for bank charges, and 5% import duty. It was not possible to identify clearance charges. To more accurately compare government procurement prices for imported and locally produced products, prices for imported products were adjusted as follows:
• FCA product (n=1): 22% was added to the tender price (15% freight, 0.5% insurance, 1.5% bank charges, 5% import duty)
• FOB products (n=8): 22% was added to the tender price (15% freight, 0.5% insurance, 1.5% bank charges, 5% import duty)
• CFR products (n=4): 7% was added to the tender price (0.5% insurance, 1.5% bank charges, 5% import duty)
Prices were analysed in various ways, including by product type i.e. originator brands, branded generics and INN generics. An originator brand is the product that was first authorized world-wide for marketing (usually as a patented product). It always has a brand name. A branded generic is a generic equivalent product marketed under a brand name. An INN generic is a generic equivalent product that is marketed under its International Non-proprietary Name (INN) rather than a brand name. For the analysis by product type, a median MPR was only calculated if data was available for more than 3 medicines.
Results
1. Public sector procurement prices and quantities For the 25 survey medicines, the government was procuring a total of 48 locally produced products (21 medicines) and 13 imported products (12 medicines). Overall, government procurement prices for locally produced and imported medicines were 1.20 and 0.84 times international reference prices respectively, as shown in Table 2. For locally produced products, half the medicines ranged from 0.99-1.33 times international reference prices, and for imported products half the medicines ranged from 0.77-1.26 times international reference prices. Note: data are not for a paired sample of medicines.
8
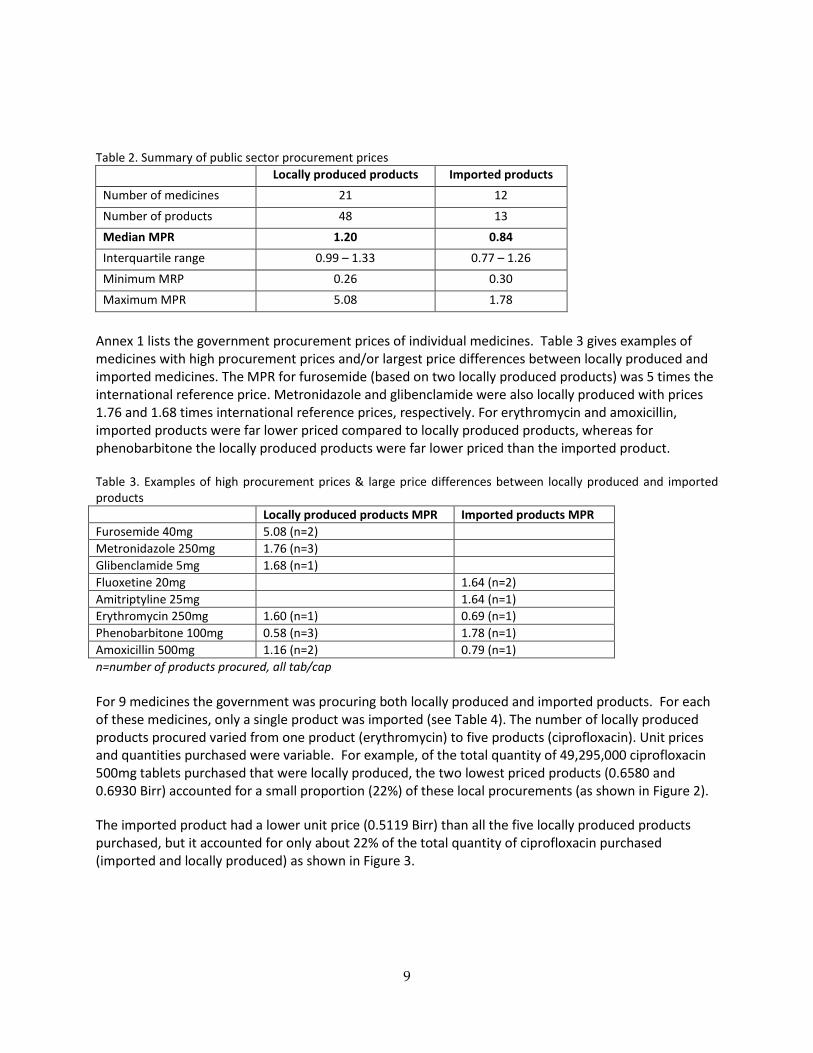
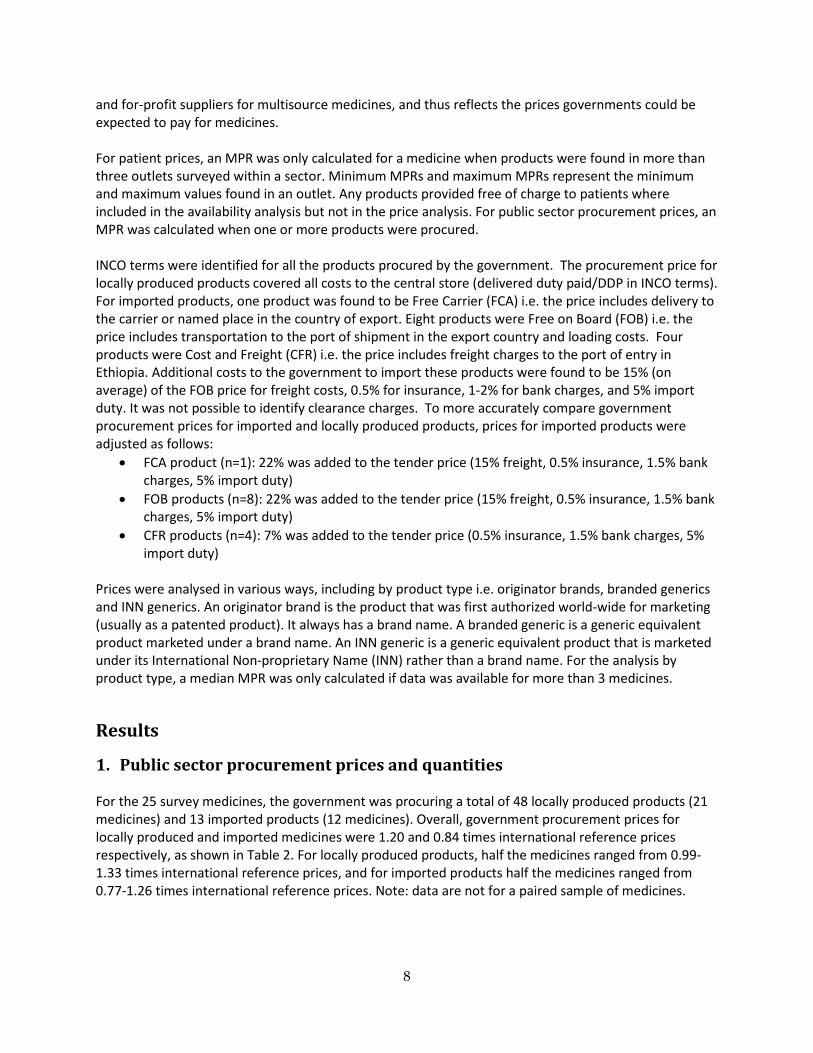
Table 2. Summary of public sector procurement prices
Locally produced products Imported products Number of medicines 21 12 Number of products 48 13 Median MPR 1.20 0.84 Interquartile range 0.99 – 1.33 0.77 – 1.26 Minimum MRP 0.26 0.30 Maximum MPR 5.08 1.78
Annex 1 lists the government procurement prices of individual medicines. Table 3 gives examples of medicines with high procurement prices and/or largest price differences between locally produced and imported medicines. The MPR for furosemide (based on two locally produced products) was 5 times the international reference price. Metronidazole and glibenclamide were also locally produced with prices 1.76 and 1.68 times international reference prices, respectively. For erythromycin and amoxicillin, imported products were far lower priced compared to locally produced products, whereas for phenobarbitone the locally produced products were far lower priced than the imported product. Table 3. Examples of high procurement prices & large price differences between locally produced and imported products Locally produced products MPR Imported products MPR Furosemide 40mg 5.08 (n=2) Metronidazole 250mg 1.76 (n=3) Glibenclamide 5mg 1.68 (n=1) Fluoxetine 20mg 1.64 (n=2) Amitriptyline 25mg 1.64 (n=1) Erythromycin 250mg 1.60 (n=1) 0.69 (n=1) Phenobarbitone 100mg 0.58 (n=3) 1.78 (n=1) Amoxicillin 500mg 1.16 (n=2) 0.79 (n=1) n=number of products procured, all tab/cap For 9 medicines the government was procuring both locally produced and imported products. For each of these medicines, only a single product was imported (see Table 4). The number of locally produced products procured varied from one product (erythromycin) to five products (ciprofloxacin). Unit prices and quantities purchased were variable. For example, of the total quantity of 49,295,000 ciprofloxacin 500mg tablets purchased that were locally produced, the two lowest priced products (0.6580 and 0.6930 Birr) accounted for a small proportion (22%) of these local procurements (as shown in Figure 2). The imported product had a lower unit price (0.5119 Birr) than all the five locally produced products purchased, but it accounted for only about 22% of the total quantity of ciprofloxacin purchased (imported and locally produced) as shown in Figure 3.
9
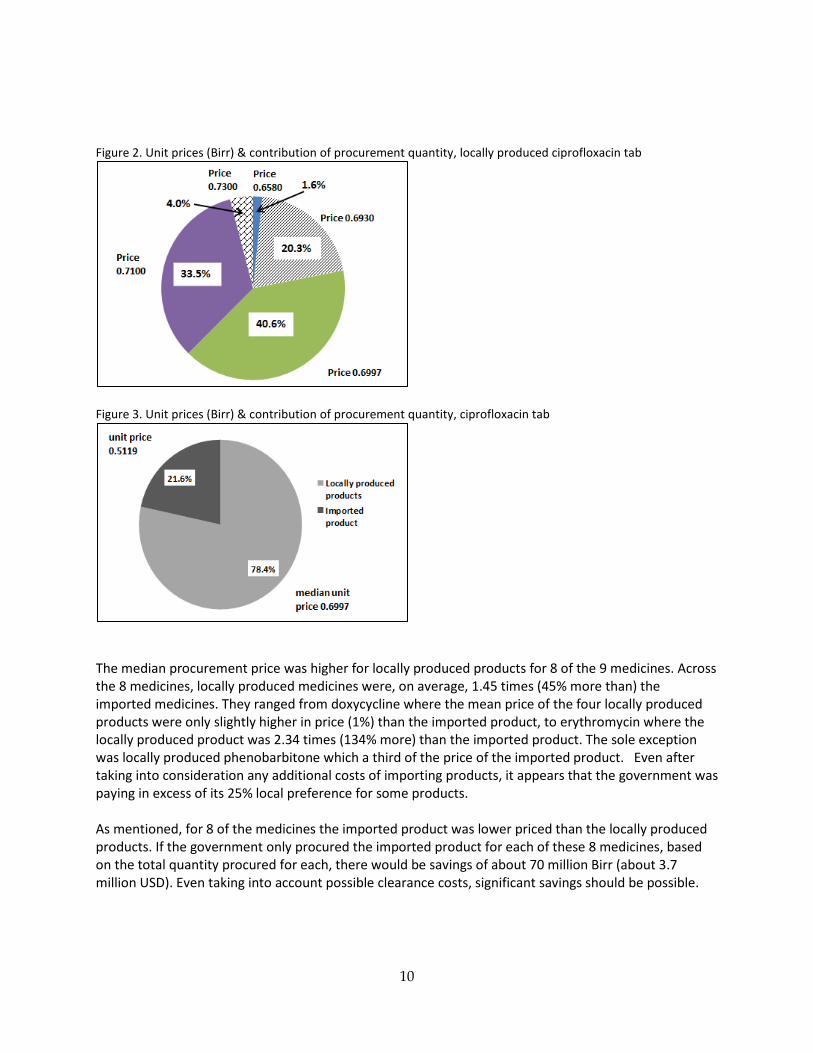
Figure 2. Unit prices (Birr) & contribution of procurement quantity, locally produced ciprofloxacin tab
Figure 3. Unit prices (Birr) & contribution of procurement quantity, ciprofloxacin tab
The median procurement price was higher for locally produced products for 8 of the 9 medicines. Across the 8 medicines, locally produced medicines were, on average, 1.45 times (45% more than) the imported medicines. They ranged from doxycycline where the mean price of the four locally produced products were only slightly higher in price (1%) than the imported product, to erythromycin where the locally produced product was 2.34 times (134% more) than the imported product. The sole exception was locally produced phenobarbitone which a third of the price of the imported product. Even after taking into consideration any additional costs of importing products, it appears that the government was paying in excess of its 25% local preference for some products. As mentioned, for 8 of the medicines the imported product was lower priced than the locally produced products. If the government only procured the imported product for each of these 8 medicines, based on the total quantity procured for each, there would be savings of about 70 million Birr (about 3.7 million USD). Even taking into account possible clearance costs, significant savings should be possible.
10
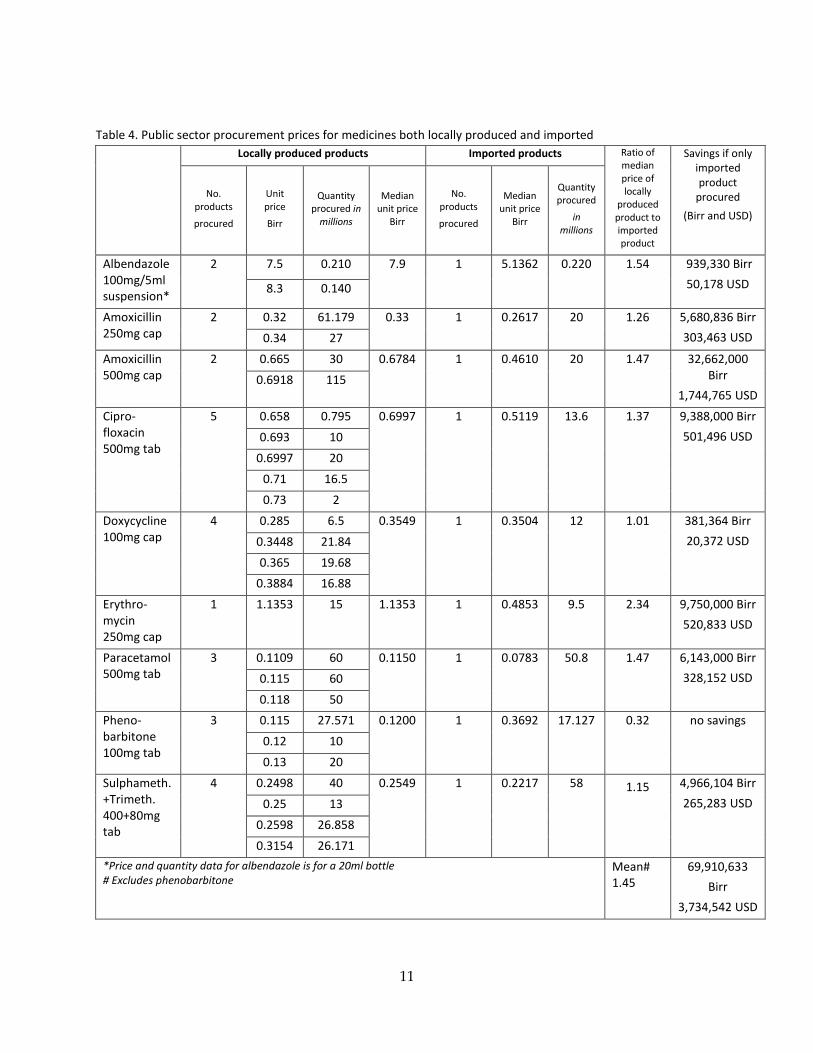
Table 4. Public sector procurement prices for medicines both locally produced and imported
Locally produced products Imported products Ratio of median price of locally
produced product to imported product
Savings if only imported product
procured (Birr and USD)
No. products
procured
Unit price
Birr
Quantity procured in
millions
Median unit price
Birr
No. products
procured
Median unit price
Birr
Quantity procured
in millions
Albendazole 100mg/5ml suspension*
2 7.5 0.210 7.9 1 5.1362 0.220 1.54 939,330 Birr 50,178 USD 8.3 0.140
Amoxicillin 250mg cap
2 0.32 61.179 0.33 1 0.2617 20 1.26 5,680,836 Birr 303,463 USD 0.34 27
Amoxicillin 500mg cap
2 0.665 30 0.6784 1 0.4610 20 1.47 32,662,000 Birr
1,744,765 USD 0.6918 115
Cipro-floxacin 500mg tab
5 0.658 0.795 0.6997 1 0.5119 13.6 1.37 9,388,000 Birr 501,496 USD 0.693 10
0.6997 20 0.71 16.5 0.73 2
Doxycycline 100mg cap
4 0.285 6.5 0.3549 1 0.3504 12 1.01 381,364 Birr 20,372 USD 0.3448 21.84
0.365 19.68 0.3884 16.88
Erythro-mycin 250mg cap
1 1.1353 15 1.1353 1 0.4853 9.5 2.34 9,750,000 Birr 520,833 USD
Paracetamol 500mg tab
3 0.1109 60 0.1150 1 0.0783 50.8 1.47 6,143,000 Birr 328,152 USD 0.115 60
0.118 50 Pheno-barbitone 100mg tab
3 0.115 27.571 0.1200 1 0.3692 17.127 0.32 no savings 0.12 10 0.13 20
Sulphameth.+Trimeth. 400+80mg tab
4 0.2498 40 0.2549 1 0.2217 58 1.15 4,966,104 Birr 265,283 USD 0.25 13
0.2598 26.858 0.3154 26.171
*Price and quantity data for albendazole is for a 20ml bottle # Excludes phenobarbitone
Mean# 1.45
69,910,633 Birr
3,734,542 USD
11
2. Patient prices
2.1 Public sector patient prices 2.1.1 Overall public sector patient prices Across the 34 public sector outlets surveyed, overall patient prices for locally produced products (456 products) and imported products (168 products) were 1.41 times and 1.23 times international reference prices, respectively (see Table 5). For both locally produced and imported products, patient prices were 1.39 times international reference prices. For locally produced products, half the medicines (25th-75th percentiles) were 1.01 – 1.69 times international reference prices, whereas for imported products, half the medicines were 0.96 – 1.59 times international reference prices. For both local and imported products the median MPR was 1.39. Table 5. Summary of public sector patient prices
Locally produced products Imported products Number of medicines 23 12 Number of products 456 168 Median MPR 1.41 1.23 Interquartile range (25th-75th percentiles)
1.01-1.69 0.96-1.59
Minimum MRP 0.28 0.20 Maximum MPR 5.01 5.45
Overall patient prices for locally produced products were higher than imported products across the 10 medicines where both locally produced and imported products where found (paired analysis), as shown in Table 6. The median MPRs of locally produced and imported products were 1.44 and 1.18 respectively. Thus overall, patients were paying 22% more when buying locally produced products. Table 6. Summary of public sector patient prices, paired analysis
Locally produced products Imported products Number of medicines 10 10 Number of products 177 129 Median of median MPR 1.44 1.18 Median of interquartile range (25th-75th percentiles)
1.08-1.56 1.02-1.42
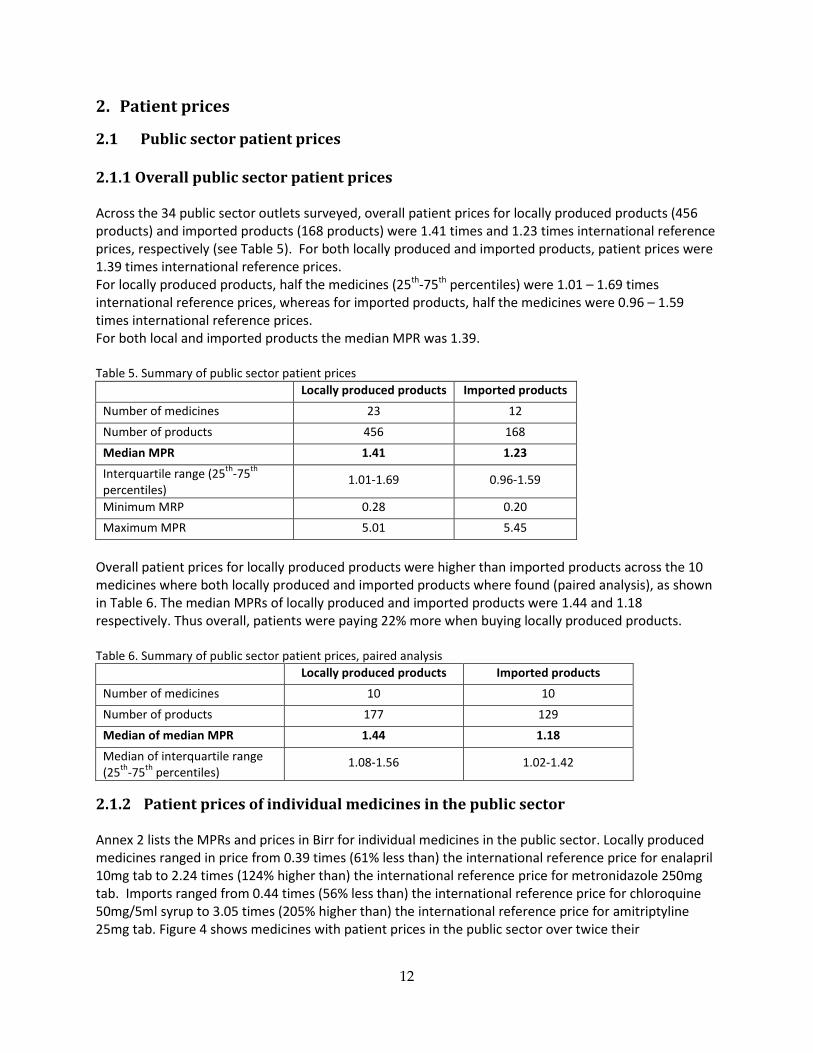
2.1.2 Patient prices of individual medicines in the public sector Annex 2 lists the MPRs and prices in Birr for individual medicines in the public sector. Locally produced medicines ranged in price from 0.39 times (61% less than) the international reference price for enalapril 10mg tab to 2.24 times (124% higher than) the international reference price for metronidazole 250mg tab. Imports ranged from 0.44 times (56% less than) the international reference price for chloroquine 50mg/5ml syrup to 3.05 times (205% higher than) the international reference price for amitriptyline 25mg tab. Figure 4 shows medicines with patient prices in the public sector over twice their
12
international reference prices and/or where price differences were greatest between locally produced and imported products. Figure 4. Patient prices (MPRs), public sector, individual medicines
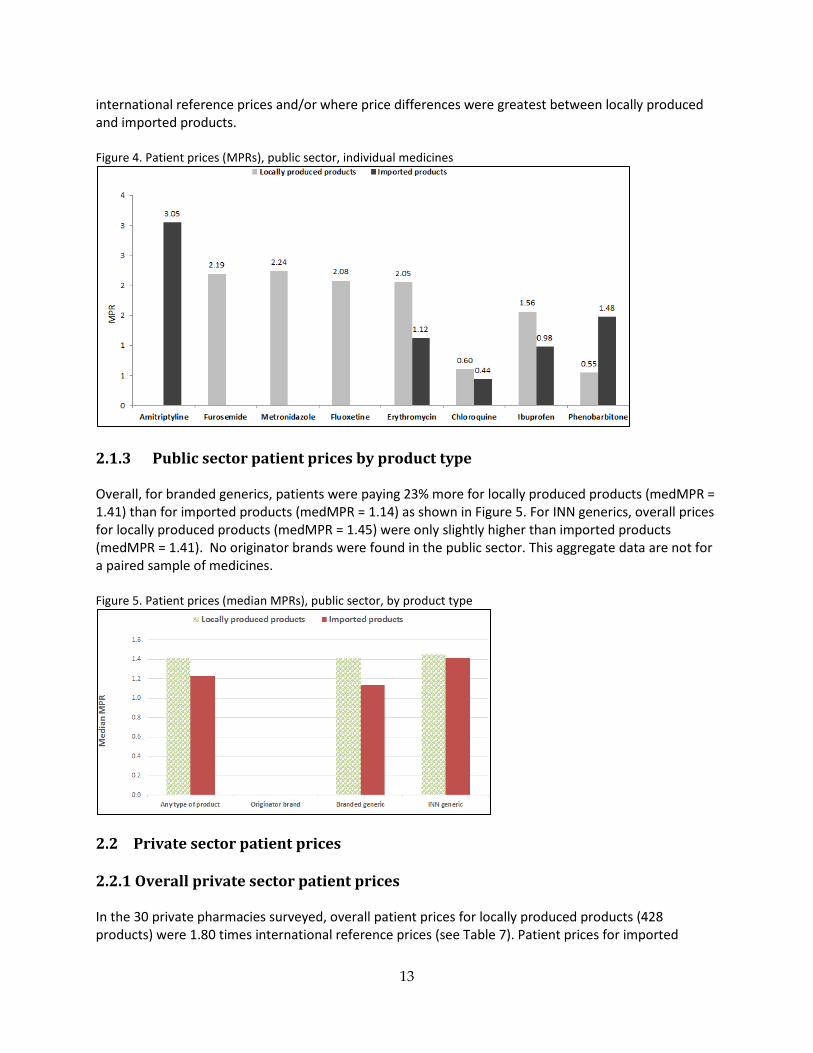
2.1.3 Public sector patient prices by product type Overall, for branded generics, patients were paying 23% more for locally produced products (medMPR = 1.41) than for imported products (medMPR = 1.14) as shown in Figure 5. For INN generics, overall prices for locally produced products (medMPR = 1.45) were only slightly higher than imported products (medMPR = 1.41). No originator brands were found in the public sector. This aggregate data are not for a paired sample of medicines. Figure 5. Patient prices (median MPRs), public sector, by product type
2.2 Private sector patient prices 2.2.1 Overall private sector patient prices In the 30 private pharmacies surveyed, overall patient prices for locally produced products (428 products) were 1.80 times international reference prices (see Table 7). Patient prices for imported
13
products (505 products) were 5.44 times international reference prices. For both locally produced and imported products, patient prices were 2.18 times international reference prices. For locally produced products, half the medicines were 1.39 – 2.54 times international reference prices, whereas for imported products there was a greater spread with half the medicines 2.08 – 10.90 times international reference prices. For both local and imported products the median MPR was 2.18. Table 7. Summary of private sector patient prices
Locally produced products Imported products Number of medicines 23 16 Number of products 428 505 Median MPR 1.80 5.44 Interquartile range (25th-75th percentiles)
1.39 – 2.54 2.08 – 10.90
Minimum MRP 0.51 1.41 Maximum MPR 4.58 73.56
In the paired analysis, across 15 medicines, patient prices for imported products were 193% higher (medianMPR = 5.42) than prices for locally produced products (medianMPR = 1.85) as shown in Table 8. Table 8. Summary of private sector patient prices, paired analysis
Locally produced products Imported products Number of medicines 15 15 Number of products 306 403 Median of median MPR 1.85 5.42 Median of interquartile range (25th-75th percentiles)
1.71-1.96 2.65-9.34
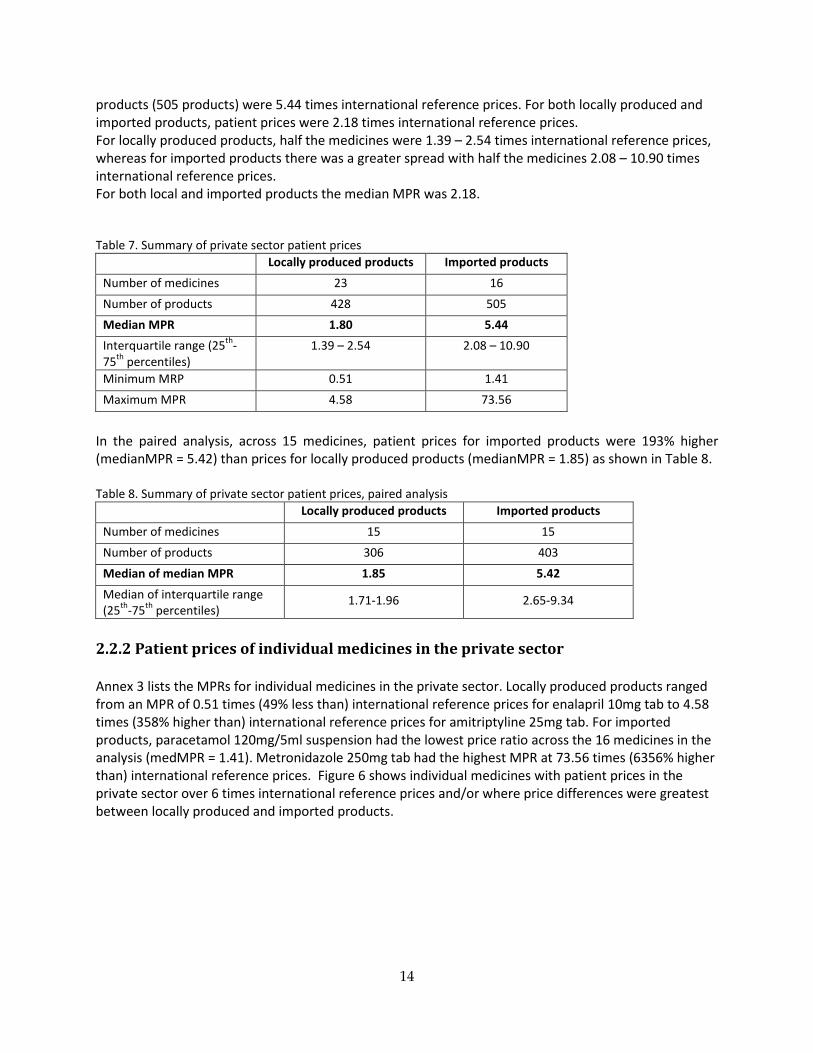
2.2.2 Patient prices of individual medicines in the private sector Annex 3 lists the MPRs for individual medicines in the private sector. Locally produced products ranged from an MPR of 0.51 times (49% less than) international reference prices for enalapril 10mg tab to 4.58 times (358% higher than) international reference prices for amitriptyline 25mg tab. For imported products, paracetamol 120mg/5ml suspension had the lowest price ratio across the 16 medicines in the analysis (medMPR = 1.41). Metronidazole 250mg tab had the highest MPR at 73.56 times (6356% higher than) international reference prices. Figure 6 shows individual medicines with patient prices in the private sector over 6 times international reference prices and/or where price differences were greatest between locally produced and imported products.
14
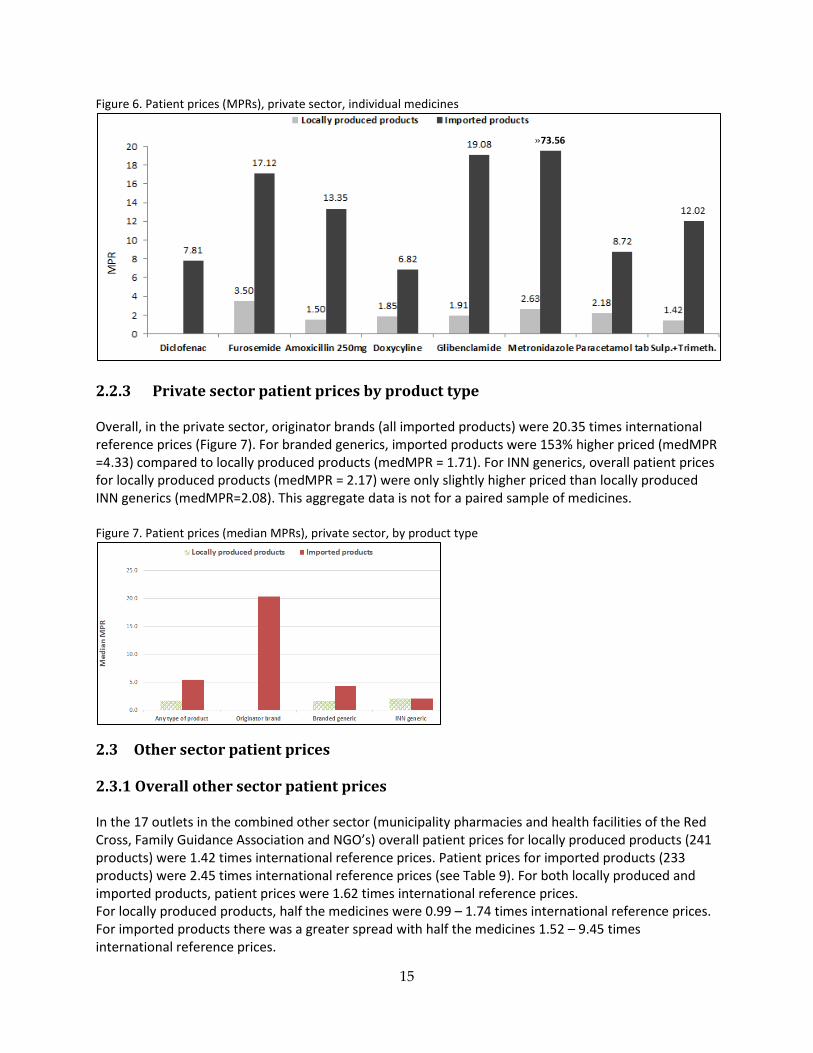
Figure 6. Patient prices (MPRs), private sector, individual medicines
2.2.3 Private sector patient prices by product type Overall, in the private sector, originator brands (all imported products) were 20.35 times international reference prices (Figure 7). For branded generics, imported products were 153% higher priced (medMPR =4.33) compared to locally produced products (medMPR = 1.71). For INN generics, overall patient prices for locally produced products (medMPR = 2.17) were only slightly higher priced than locally produced INN generics (medMPR=2.08). This aggregate data is not for a paired sample of medicines. Figure 7. Patient prices (median MPRs), private sector, by product type
2.3 Other sector patient prices 2.3.1 Overall other sector patient prices In the 17 outlets in the combined other sector (municipality pharmacies and health facilities of the Red Cross, Family Guidance Association and NGO’s) overall patient prices for locally produced products (241 products) were 1.42 times international reference prices. Patient prices for imported products (233 products) were 2.45 times international reference prices (see Table 9). For both locally produced and imported products, patient prices were 1.62 times international reference prices. For locally produced products, half the medicines were 0.99 – 1.74 times international reference prices. For imported products there was a greater spread with half the medicines 1.52 – 9.45 times international reference prices.
»73.56
15
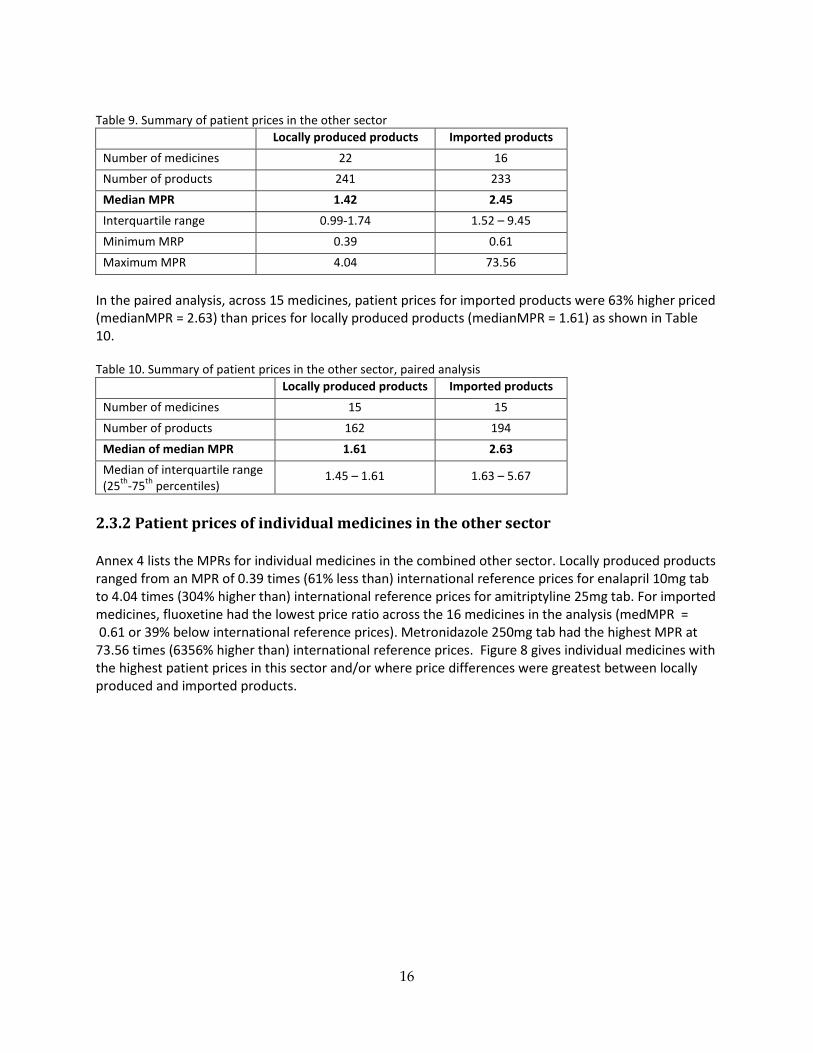
Table 9. Summary of patient prices in the other sector
Locally produced products Imported products Number of medicines 22 16 Number of products 241 233 Median MPR 1.42 2.45 Interquartile range 0.99-1.74 1.52 – 9.45 Minimum MRP 0.39 0.61 Maximum MPR 4.04 73.56
In the paired analysis, across 15 medicines, patient prices for imported products were 63% higher priced (medianMPR = 2.63) than prices for locally produced products (medianMPR = 1.61) as shown in Table 10. Table 10. Summary of patient prices in the other sector, paired analysis
Locally produced products Imported products Number of medicines 15 15 Number of products 162 194 Median of median MPR 1.61 2.63 Median of interquartile range (25th-75th percentiles)
1.45 – 1.61 1.63 – 5.67
2.3.2 Patient prices of individual medicines in the other sector Annex 4 lists the MPRs for individual medicines in the combined other sector. Locally produced products ranged from an MPR of 0.39 times (61% less than) international reference prices for enalapril 10mg tab to 4.04 times (304% higher than) international reference prices for amitriptyline 25mg tab. For imported medicines, fluoxetine had the lowest price ratio across the 16 medicines in the analysis (medMPR = 0.61 or 39% below international reference prices). Metronidazole 250mg tab had the highest MPR at 73.56 times (6356% higher than) international reference prices. Figure 8 gives individual medicines with the highest patient prices in this sector and/or where price differences were greatest between locally produced and imported products.
16
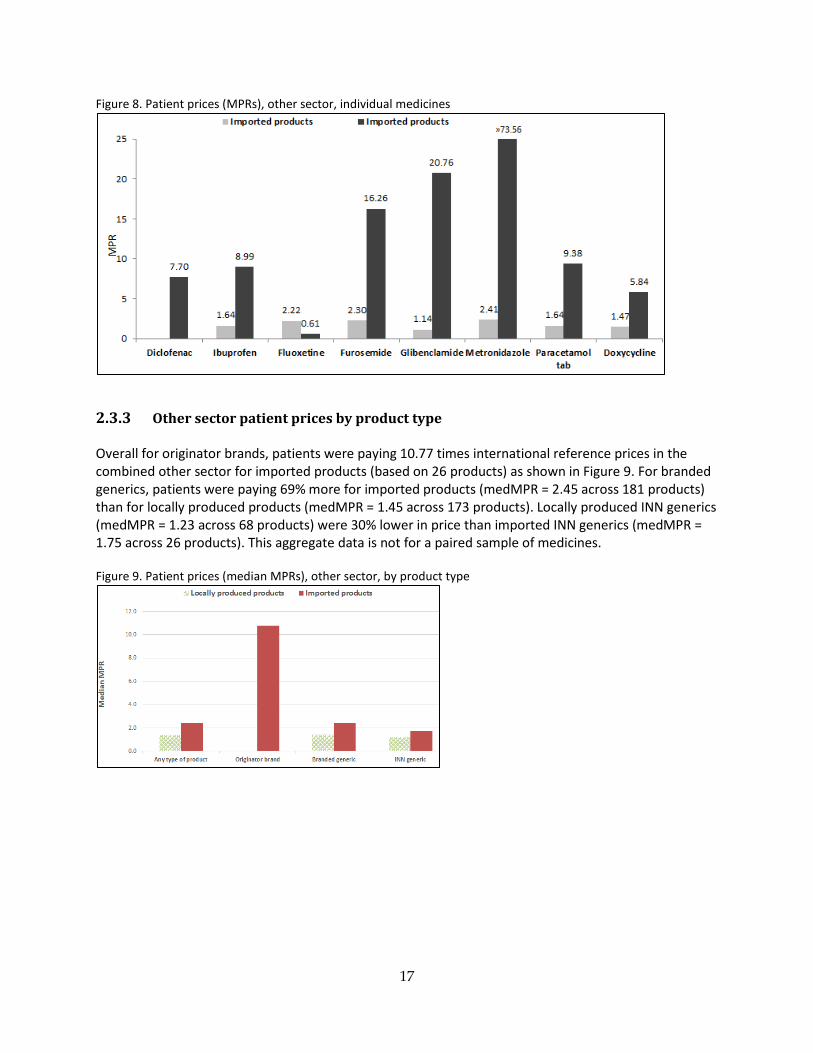
Figure 8. Patient prices (MPRs), other sector, individual medicines
2.3.3 Other sector patient prices by product type Overall for originator brands, patients were paying 10.77 times international reference prices in the combined other sector for imported products (based on 26 products) as shown in Figure 9. For branded generics, patients were paying 69% more for imported products (medMPR = 2.45 across 181 products) than for locally produced products (medMPR = 1.45 across 173 products). Locally produced INN generics (medMPR = 1.23 across 68 products) were 30% lower in price than imported INN generics (medMPR = 1.75 across 26 products). This aggregate data is not for a paired sample of medicines. Figure 9. Patient prices (median MPRs), other sector, by product type
17
3. Analysis of public sector procurement prices and public sector patient prices
For 20 medicines, locally produced products procured by the government where found in public sector outlets (i.e. matched pairs). For these products, patients were paying 1.17 times (17% more) than the procurement price. For 9 medicines, imported products procured by the government where found in public sector outlets. For these products, patients were paying 1.53 times (53% more) than the procurement price (Table 11). Price ratios between public sector procurement prices and public sector patient prices, for medicines both locally produced and imported (n=7), were similar at 1.13 and 1.53 times international reference prices for locally produced products and imported products, respectively. See Annex 5 for details on the paired analysis of public sector procurement prices and public sector patient prices. Table 11. Ratio of public sector procurement prices and public sector patient prices Number of paired
medicines Median Ratio between Public Sector Procurement Price MPR and Public Sector Patient Price MPR
Locally produced products 20 1.17 Imported products 9 1.53
4. Availability
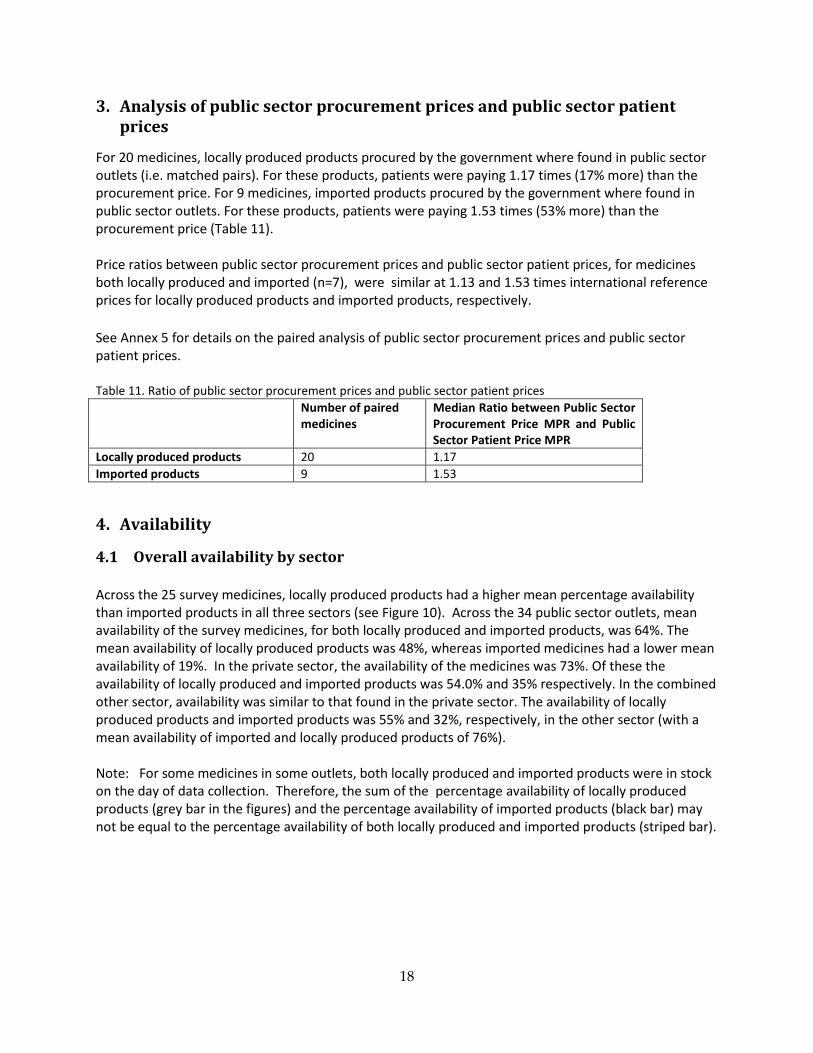
4.1 Overall availability by sector Across the 25 survey medicines, locally produced products had a higher mean percentage availability than imported products in all three sectors (see Figure 10). Across the 34 public sector outlets, mean availability of the survey medicines, for both locally produced and imported products, was 64%. The mean availability of locally produced products was 48%, whereas imported medicines had a lower mean availability of 19%. In the private sector, the availability of the medicines was 73%. Of these the availability of locally produced and imported products was 54.0% and 35% respectively. In the combined other sector, availability was similar to that found in the private sector. The availability of locally produced products and imported products was 55% and 32%, respectively, in the other sector (with a mean availability of imported and locally produced products of 76%). Note: For some medicines in some outlets, both locally produced and imported products were in stock on the day of data collection. Therefore, the sum of the percentage availability of locally produced products (grey bar in the figures) and the percentage availability of imported products (black bar) may not be equal to the percentage availability of both locally produced and imported products (striped bar).
18
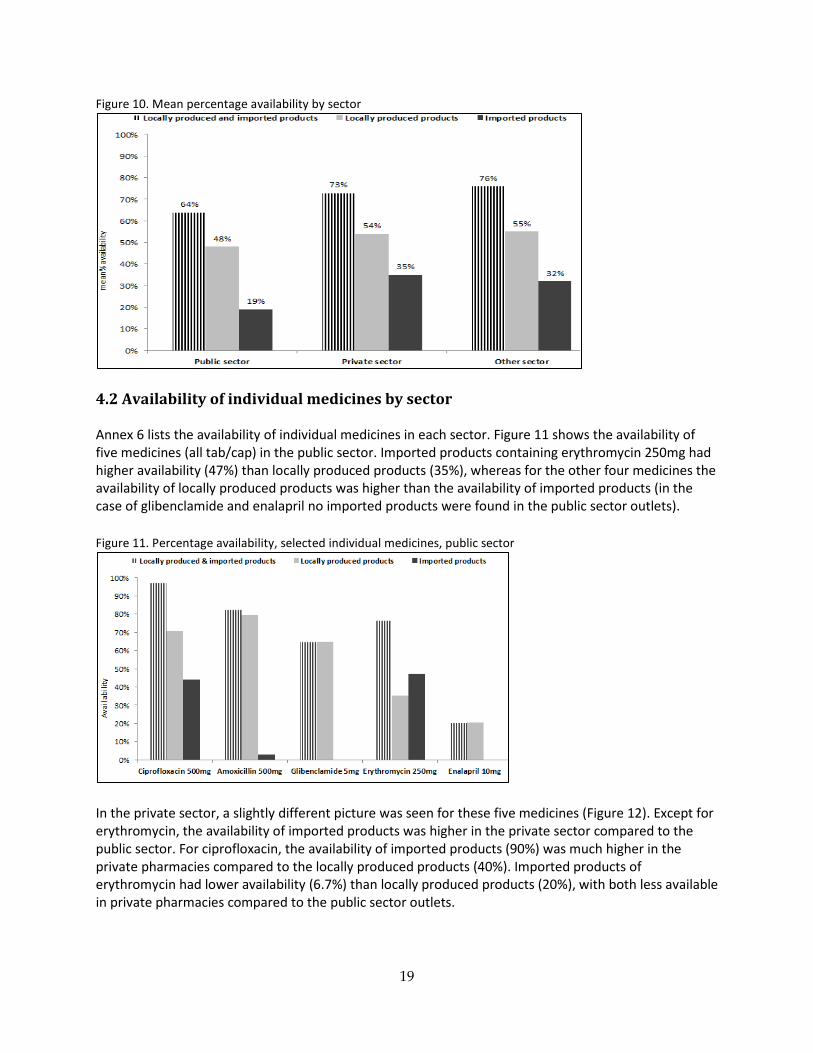
Figure 10. Mean percentage availability by sector
4.2 Availability of individual medicines by sector Annex 6 lists the availability of individual medicines in each sector. Figure 11 shows the availability of five medicines (all tab/cap) in the public sector. Imported products containing erythromycin 250mg had higher availability (47%) than locally produced products (35%), whereas for the other four medicines the availability of locally produced products was higher than the availability of imported products (in the case of glibenclamide and enalapril no imported products were found in the public sector outlets). Figure 11. Percentage availability, selected individual medicines, public sector
In the private sector, a slightly different picture was seen for these five medicines (Figure 12). Except for erythromycin, the availability of imported products was higher in the private sector compared to the public sector. For ciprofloxacin, the availability of imported products (90%) was much higher in the private pharmacies compared to the locally produced products (40%). Imported products of erythromycin had lower availability (6.7%) than locally produced products (20%), with both less available in private pharmacies compared to the public sector outlets.
19
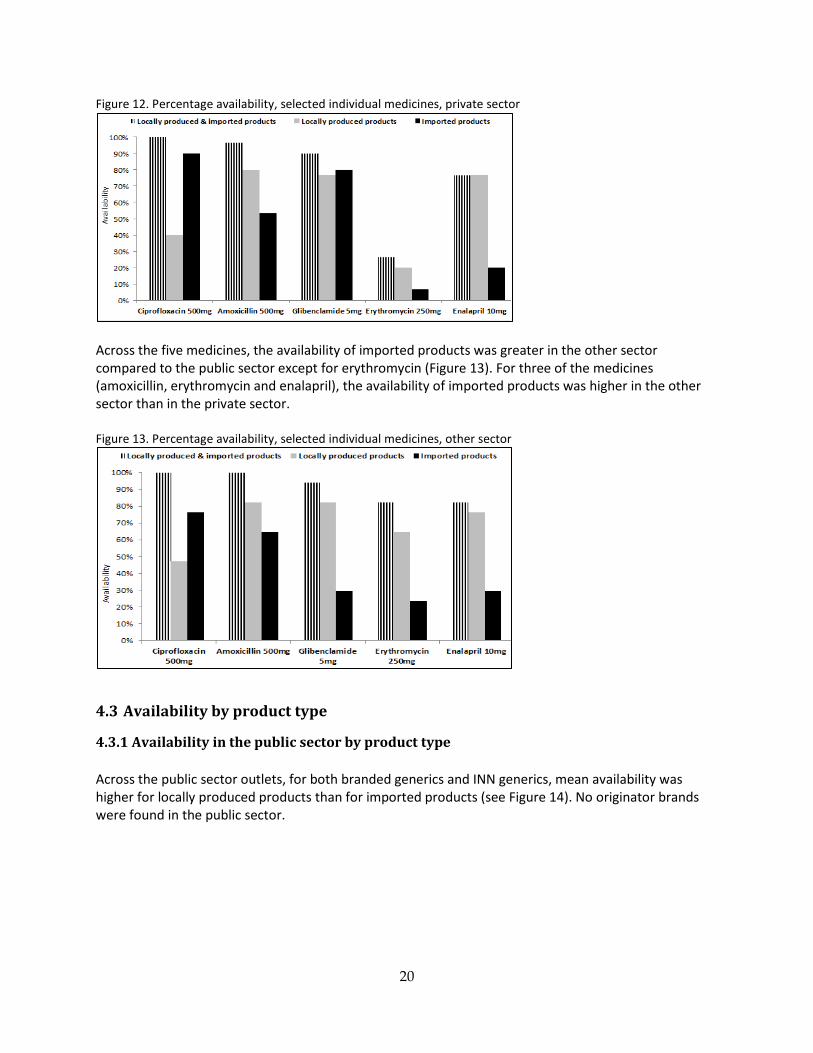
Figure 12. Percentage availability, selected individual medicines, private sector
Across the five medicines, the availability of imported products was greater in the other sector compared to the public sector except for erythromycin (Figure 13). For three of the medicines (amoxicillin, erythromycin and enalapril), the availability of imported products was higher in the other sector than in the private sector. Figure 13. Percentage availability, selected individual medicines, other sector
4.3 Availability by product type
4.3.1 Availability in the public sector by product type Across the public sector outlets, for both branded generics and INN generics, mean availability was higher for locally produced products than for imported products (see Figure 14). No originator brands were found in the public sector.
20
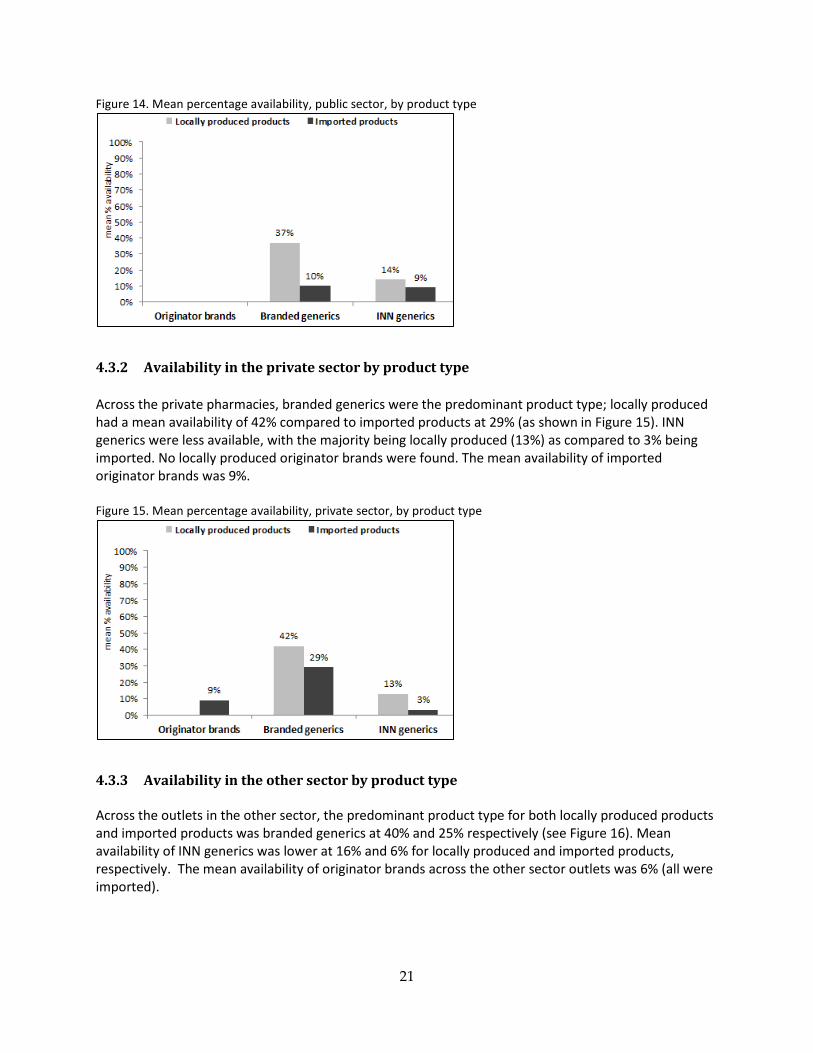
Figure 14. Mean percentage availability, public sector, by product type
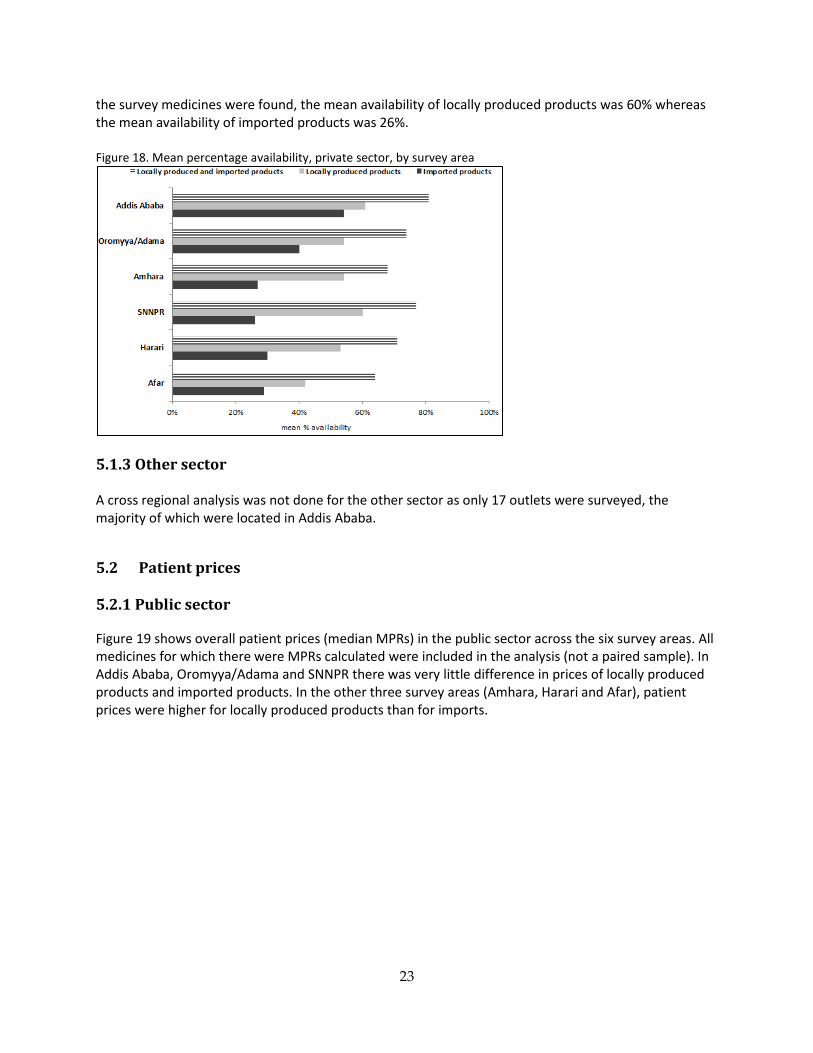
4.3.2 Availability in the private sector by product type Across the private pharmacies, branded generics were the predominant product type; locally produced had a mean availability of 42% compared to imported products at 29% (as shown in Figure 15). INN generics were less available, with the majority being locally produced (13%) as compared to 3% being imported. No locally produced originator brands were found. The mean availability of imported originator brands was 9%. Figure 15. Mean percentage availability, private sector, by product type
4.3.3 Availability in the other sector by product type Across the outlets in the other sector, the predominant product type for both locally produced products and imported products was branded generics at 40% and 25% respectively (see Figure 16). Mean availability of INN generics was lower at 16% and 6% for locally produced and imported products, respectively. The mean availability of originator brands across the other sector outlets was 6% (all were imported).
21
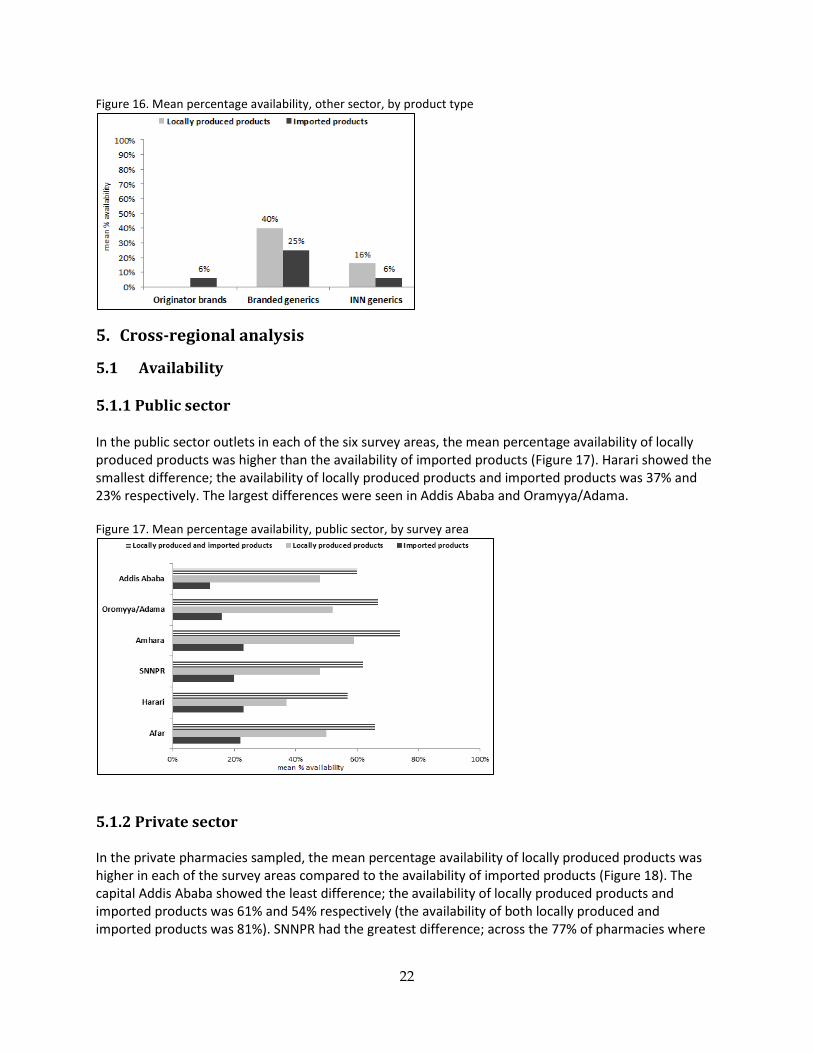
Figure 16. Mean percentage availability, other sector, by product type
5. Cross-regional analysis
5.1 Availability
5.1.1 Public sector In the public sector outlets in each of the six survey areas, the mean percentage availability of locally produced products was higher than the availability of imported products (Figure 17). Harari showed the smallest difference; the availability of locally produced products and imported products was 37% and 23% respectively. The largest differences were seen in Addis Ababa and Oramyya/Adama. Figure 17. Mean percentage availability, public sector, by survey area
5.1.2 Private sector In the private pharmacies sampled, the mean percentage availability of locally produced products was higher in each of the survey areas compared to the availability of imported products (Figure 18). The capital Addis Ababa showed the least difference; the availability of locally produced products and imported products was 61% and 54% respectively (the availability of both locally produced and imported products was 81%). SNNPR had the greatest difference; across the 77% of pharmacies where
22
the survey medicines were found, the mean availability of locally produced products was 60% whereas the mean availability of imported products was 26%. Figure 18. Mean percentage availability, private sector, by survey area
5.1.3 Other sector A cross regional analysis was not done for the other sector as only 17 outlets were surveyed, the majority of which were located in Addis Ababa.
5.2 Patient prices 5.2.1 Public sector Figure 19 shows overall patient prices (median MPRs) in the public sector across the six survey areas. All medicines for which there were MPRs calculated were included in the analysis (not a paired sample). In Addis Ababa, Oromyya/Adama and SNNPR there was very little difference in prices of locally produced products and imported products. In the other three survey areas (Amhara, Harari and Afar), patient prices were higher for locally produced products than for imports.
23
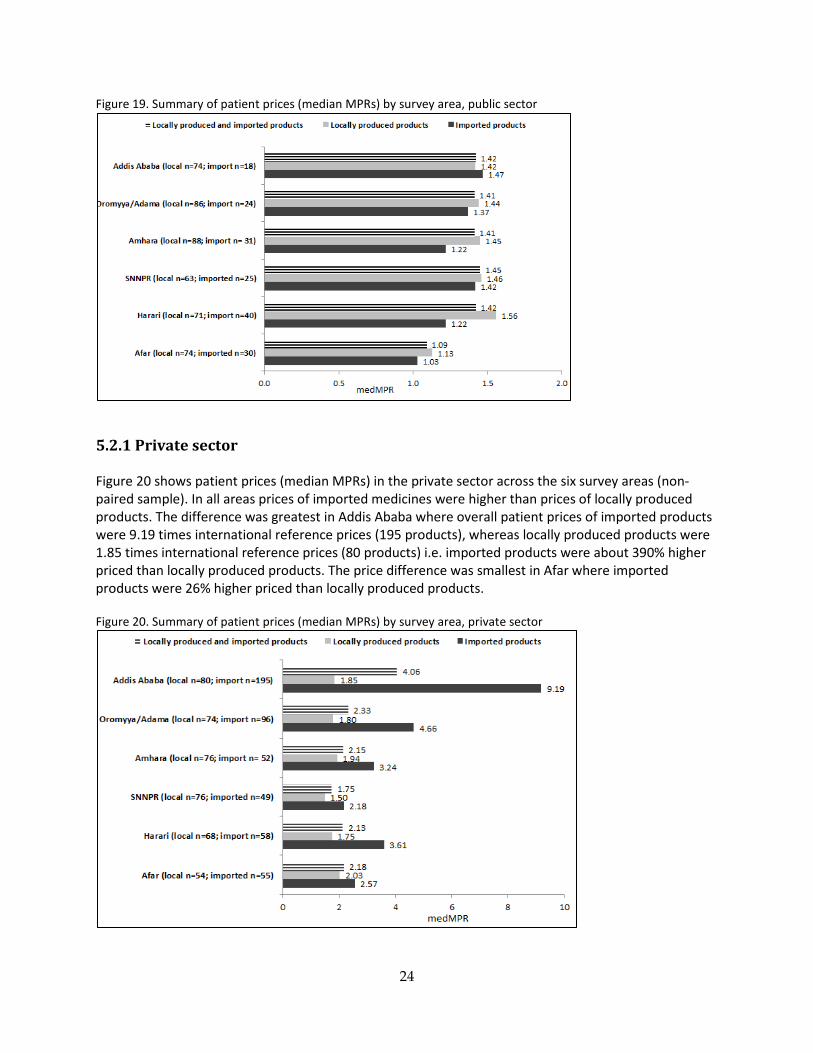
Figure 19. Summary of patient prices (median MPRs) by survey area, public sector
5.2.1 Private sector Figure 20 shows patient prices (median MPRs) in the private sector across the six survey areas (non-paired sample). In all areas prices of imported medicines were higher than prices of locally produced products. The difference was greatest in Addis Ababa where overall patient prices of imported products were 9.19 times international reference prices (195 products), whereas locally produced products were 1.85 times international reference prices (80 products) i.e. imported products were about 390% higher priced than locally produced products. The price difference was smallest in Afar where imported products were 26% higher priced than locally produced products. Figure 20. Summary of patient prices (median MPRs) by survey area, private sector
24
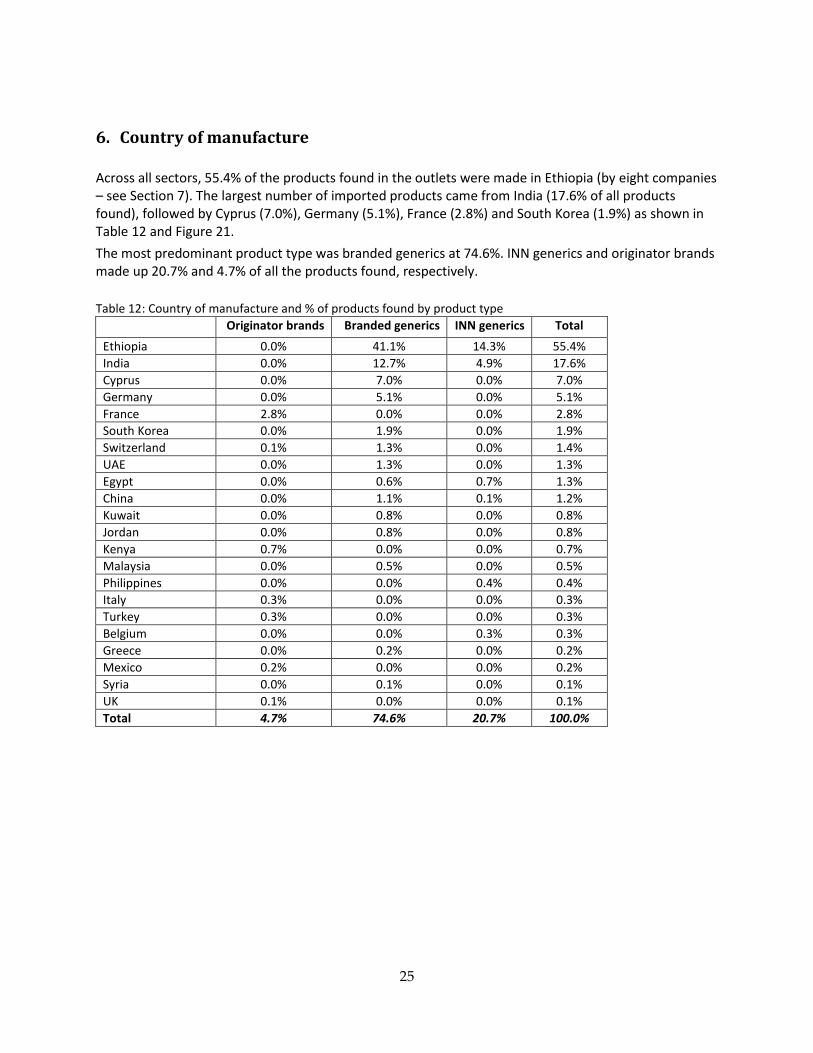
6. Country of manufacture Across all sectors, 55.4% of the products found in the outlets were made in Ethiopia (by eight companies – see Section 7). The largest number of imported products came from India (17.6% of all products found), followed by Cyprus (7.0%), Germany (5.1%), France (2.8%) and South Korea (1.9%) as shown in Table 12 and Figure 21. The most predominant product type was branded generics at 74.6%. INN generics and originator brands made up 20.7% and 4.7% of all the products found, respectively. Table 12: Country of manufacture and % of products found by product type
Originator brands Branded generics INN generics Total Ethiopia 0.0% 41.1% 14.3% 55.4% India 0.0% 12.7% 4.9% 17.6% Cyprus 0.0% 7.0% 0.0% 7.0% Germany 0.0% 5.1% 0.0% 5.1% France 2.8% 0.0% 0.0% 2.8% South Korea 0.0% 1.9% 0.0% 1.9% Switzerland 0.1% 1.3% 0.0% 1.4% UAE 0.0% 1.3% 0.0% 1.3% Egypt 0.0% 0.6% 0.7% 1.3% China 0.0% 1.1% 0.1% 1.2% Kuwait 0.0% 0.8% 0.0% 0.8% Jordan 0.0% 0.8% 0.0% 0.8% Kenya 0.7% 0.0% 0.0% 0.7% Malaysia 0.0% 0.5% 0.0% 0.5% Philippines 0.0% 0.0% 0.4% 0.4% Italy 0.3% 0.0% 0.0% 0.3% Turkey 0.3% 0.0% 0.0% 0.3% Belgium 0.0% 0.0% 0.3% 0.3% Greece 0.0% 0.2% 0.0% 0.2% Mexico 0.2% 0.0% 0.0% 0.2% Syria 0.0% 0.1% 0.0% 0.1% UK 0.1% 0.0% 0.0% 0.1% Total 4.7% 74.6% 20.7% 100.0%
25
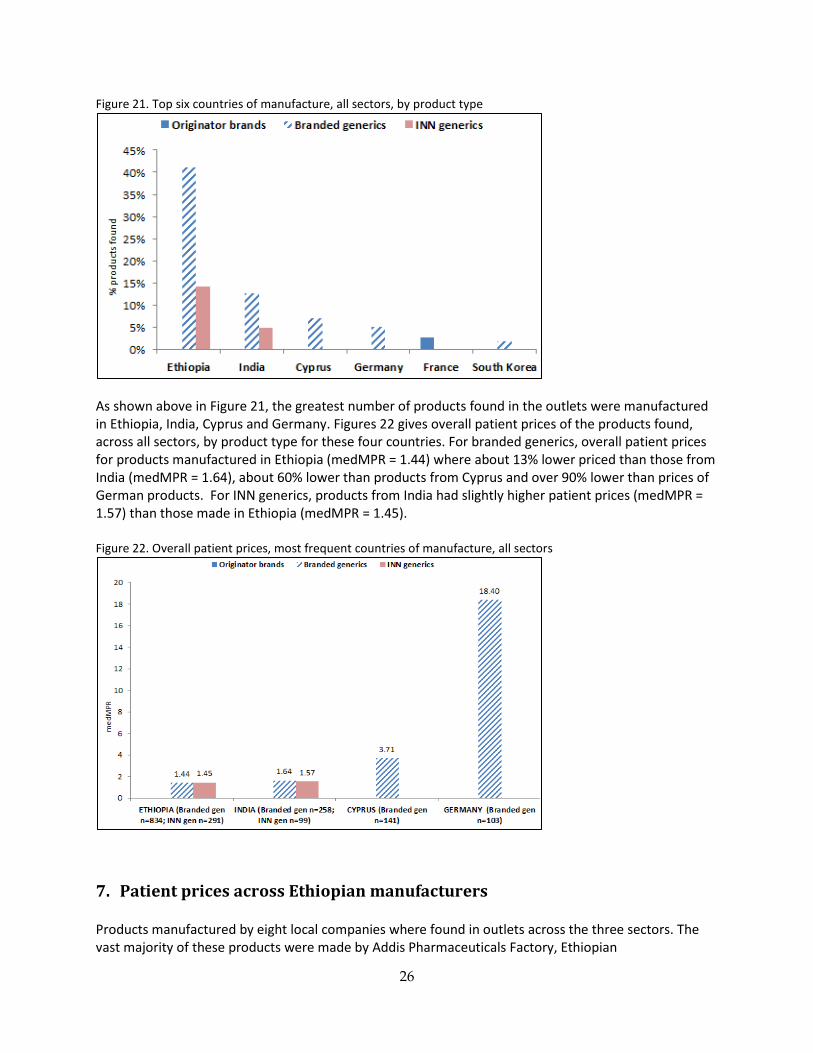
Figure 21. Top six countries of manufacture, all sectors, by product type
As shown above in Figure 21, the greatest number of products found in the outlets were manufactured in Ethiopia, India, Cyprus and Germany. Figures 22 gives overall patient prices of the products found, across all sectors, by product type for these four countries. For branded generics, overall patient prices for products manufactured in Ethiopia (medMPR = 1.44) where about 13% lower priced than those from India (medMPR = 1.64), about 60% lower than products from Cyprus and over 90% lower than prices of German products. For INN generics, products from India had slightly higher patient prices (medMPR = 1.57) than those made in Ethiopia (medMPR = 1.45). Figure 22. Overall patient prices, most frequent countries of manufacture, all sectors
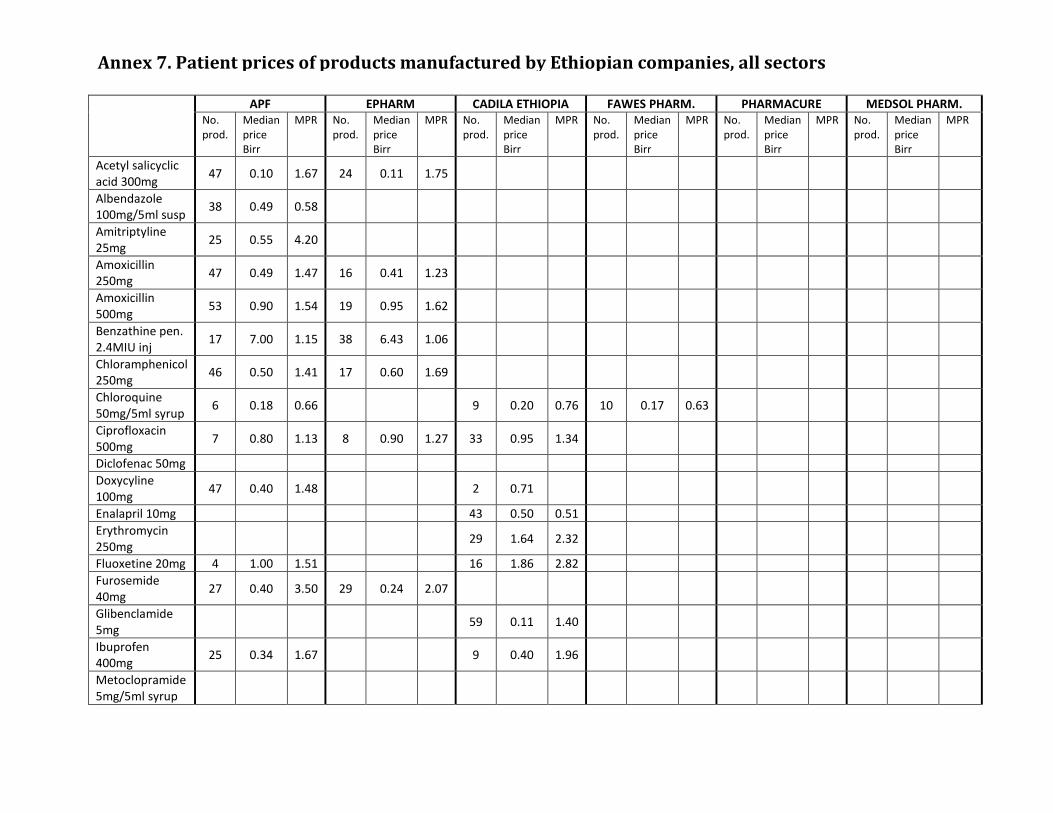
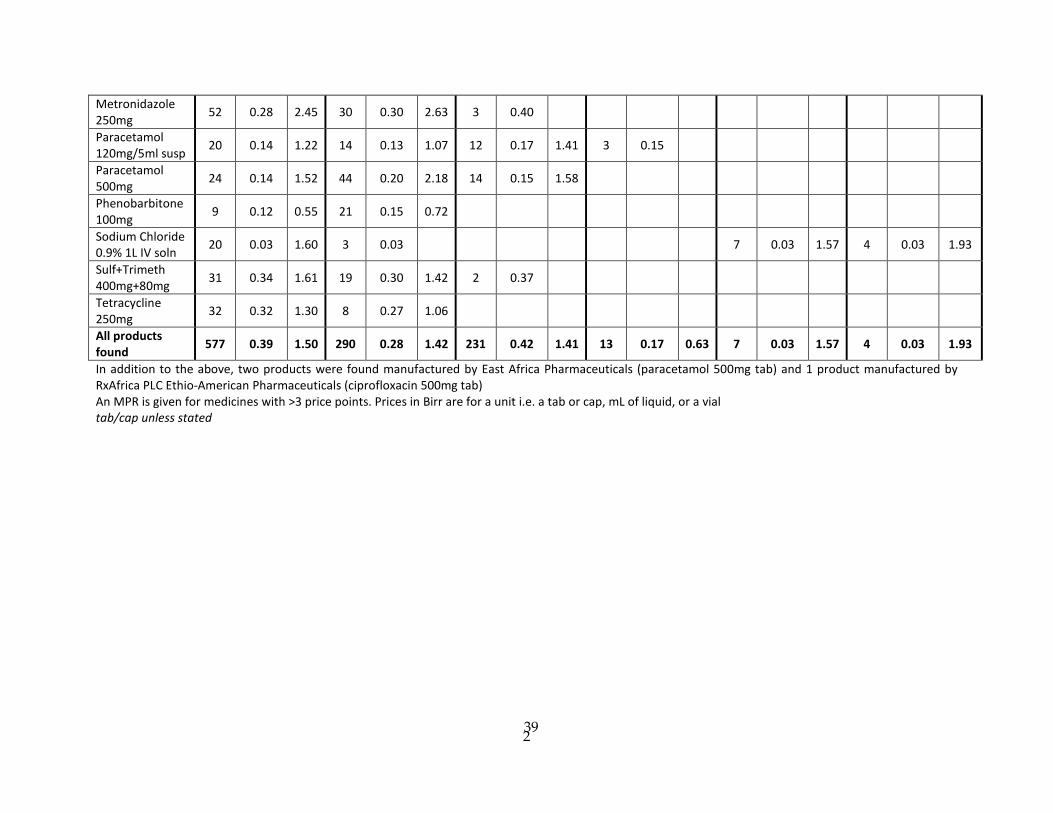
7. Patient prices across Ethiopian manufacturers Products manufactured by eight local companies where found in outlets across the three sectors. The vast majority of these products were made by Addis Pharmaceuticals Factory, Ethiopian
26
Pharmaceuticals Manufacturing Factory (EPHARM) and Cadila Pharmaceuticals Ethiopia as shown in Table 13. Overall price ratios were similar across these three companies i.e. medMPR =1.50 for Addis Pharmaceuticals Factory, medMPR=1.42 for EPHARM, and medMPR 1.41 for Cadila Pharmaceuticals Ethiopia. Table 13. Local manufacturers, number of products found and patient prices, all sectors
Company Number of products found
Median patient price
in Birr
Median MPR
Addis Pharmaceuticals Factory 577 0.39 1.50 EPHARM 290 0.28 1.42 Cadila Pharmaceuticals Ethiopia 231 0.42 1.41 Fawes Pharmaceuticals 13 0.17 0.63 Pharmacure Plc 7 0.03 1.57 MedSol Pharmaceuticals Plc 4 0.03 1.93 East Africa Pharmaceuticals 2 0.10 - Rx Africa P.L.C. Ethio-American Pharmaceuticals 1 1.00 -
total 1125
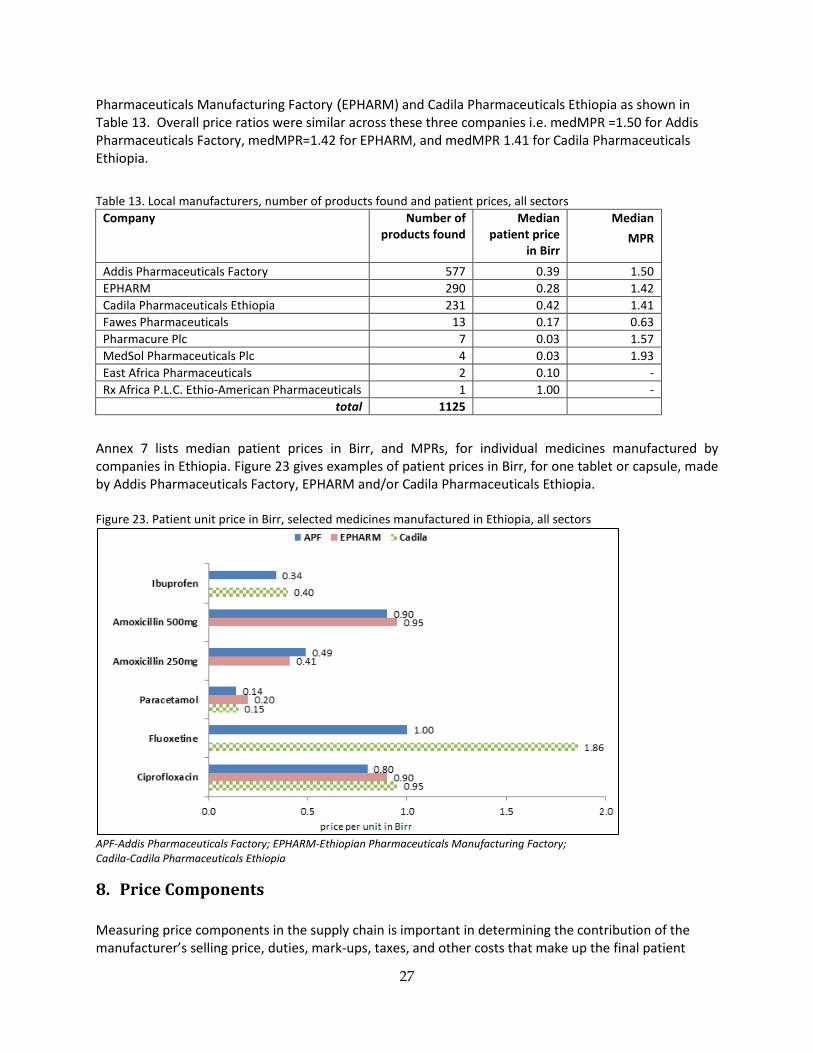
Annex 7 lists median patient prices in Birr, and MPRs, for individual medicines manufactured by companies in Ethiopia. Figure 23 gives examples of patient prices in Birr, for one tablet or capsule, made by Addis Pharmaceuticals Factory, EPHARM and/or Cadila Pharmaceuticals Ethiopia. Figure 23. Patient unit price in Birr, selected medicines manufactured in Ethiopia, all sectors
APF-Addis Pharmaceuticals Factory; EPHARM-Ethiopian Pharmaceuticals Manufacturing Factory; Cadila-Cadila Pharmaceuticals Ethiopia
8. Price Components Measuring price components in the supply chain is important in determining the contribution of the manufacturer’s selling price, duties, mark-ups, taxes, and other costs that make up the final patient
27
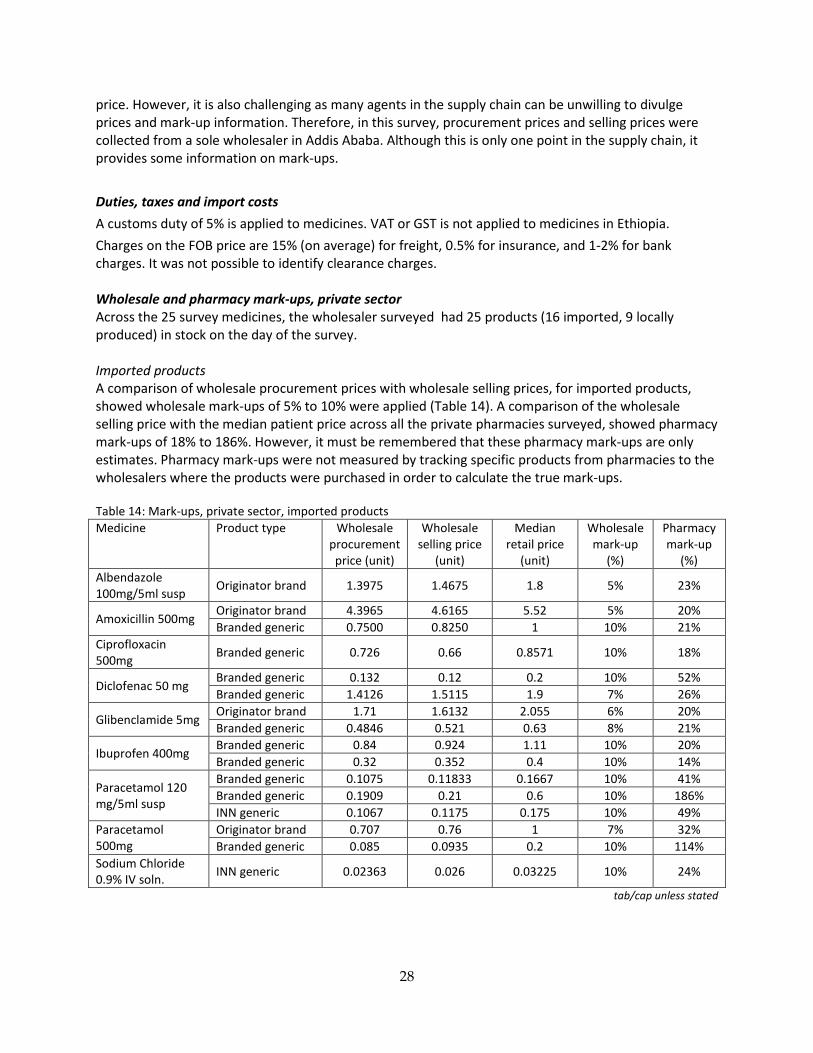
price. However, it is also challenging as many agents in the supply chain can be unwilling to divulge prices and mark-up information. Therefore, in this survey, procurement prices and selling prices were collected from a sole wholesaler in Addis Ababa. Although this is only one point in the supply chain, it provides some information on mark-ups. Duties, taxes and import costs A customs duty of 5% is applied to medicines. VAT or GST is not applied to medicines in Ethiopia. Charges on the FOB price are 15% (on average) for freight, 0.5% for insurance, and 1-2% for bank charges. It was not possible to identify clearance charges. Wholesale and pharmacy mark-ups, private sector Across the 25 survey medicines, the wholesaler surveyed had 25 products (16 imported, 9 locally produced) in stock on the day of the survey. Imported products A comparison of wholesale procurement prices with wholesale selling prices, for imported products, showed wholesale mark-ups of 5% to 10% were applied (Table 14). A comparison of the wholesale selling price with the median patient price across all the private pharmacies surveyed, showed pharmacy mark-ups of 18% to 186%. However, it must be remembered that these pharmacy mark-ups are only estimates. Pharmacy mark-ups were not measured by tracking specific products from pharmacies to the wholesalers where the products were purchased in order to calculate the true mark-ups. Table 14: Mark-ups, private sector, imported products Medicine Product type Wholesale
procurement price (unit)
Wholesale selling price
(unit)
Median retail price
(unit)
Wholesale mark-up
(%)
Pharmacy mark-up
(%) Albendazole 100mg/5ml susp Originator brand 1.3975 1.4675 1.8 5% 23%
Amoxicillin 500mg Originator brand 4.3965 4.6165 5.52 5% 20% Branded generic 0.7500 0.8250 1 10% 21%
Ciprofloxacin 500mg Branded generic 0.726 0.66 0.8571 10% 18%
Diclofenac 50 mg Branded generic 0.132 0.12 0.2 10% 52% Branded generic 1.4126 1.5115 1.9 7% 26%
Glibenclamide 5mg Originator brand 1.71 1.6132 2.055 6% 20% Branded generic 0.4846 0.521 0.63 8% 21%
Ibuprofen 400mg Branded generic 0.84 0.924 1.11 10% 20% Branded generic 0.32 0.352 0.4 10% 14%
Paracetamol 120 mg/5ml susp
Branded generic 0.1075 0.11833 0.1667 10% 41% Branded generic 0.1909 0.21 0.6 10% 186% INN generic 0.1067 0.1175 0.175 10% 49%
Paracetamol 500mg
Originator brand 0.707 0.76 1 7% 32% Branded generic 0.085 0.0935 0.2 10% 114%
Sodium Chloride 0.9% IV soln. INN generic 0.02363 0.026 0.03225 10% 24%
tab/cap unless stated
28
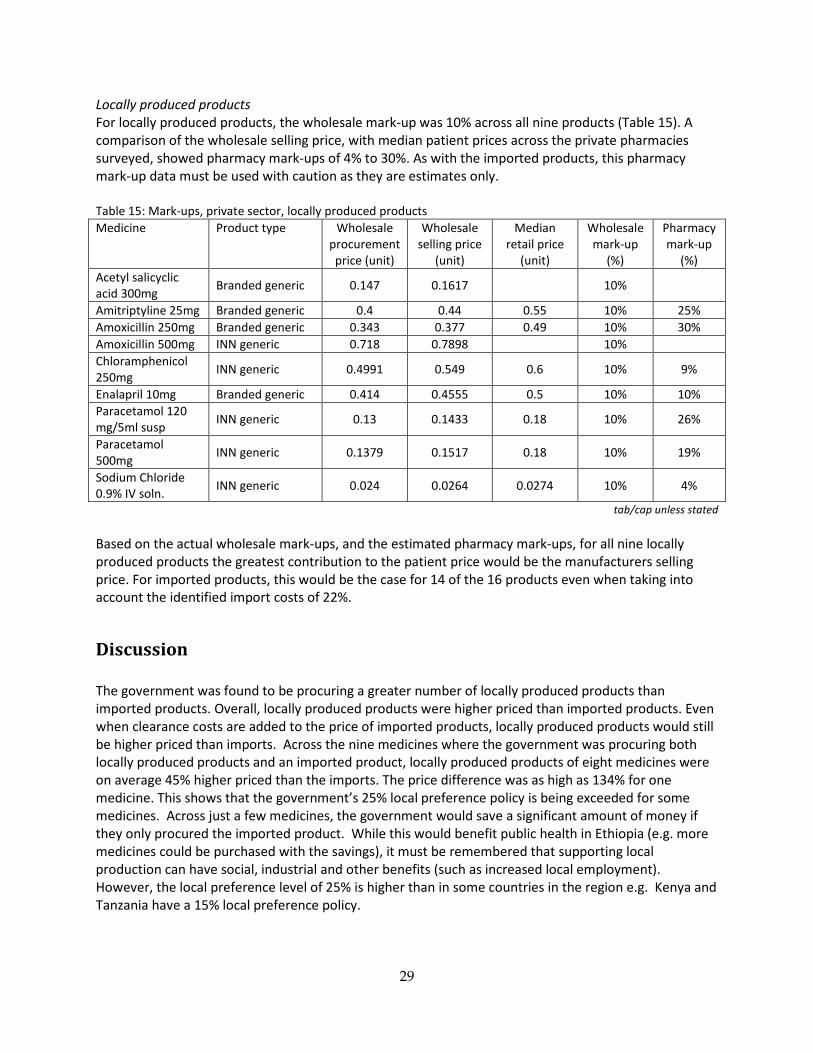
Locally produced products For locally produced products, the wholesale mark-up was 10% across all nine products (Table 15). A comparison of the wholesale selling price, with median patient prices across the private pharmacies surveyed, showed pharmacy mark-ups of 4% to 30%. As with the imported products, this pharmacy mark-up data must be used with caution as they are estimates only. Table 15: Mark-ups, private sector, locally produced products Medicine Product type Wholesale
procurement price (unit)
Wholesale selling price
(unit)
Median retail price
(unit)
Wholesale mark-up
(%)
Pharmacy mark-up
(%) Acetyl salicyclic acid 300mg Branded generic 0.147 0.1617 10%
Amitriptyline 25mg Branded generic 0.4 0.44 0.55 10% 25% Amoxicillin 250mg Branded generic 0.343 0.377 0.49 10% 30% Amoxicillin 500mg INN generic 0.718 0.7898 10% Chloramphenicol 250mg INN generic 0.4991 0.549 0.6 10% 9%
Enalapril 10mg Branded generic 0.414 0.4555 0.5 10% 10% Paracetamol 120 mg/5ml susp INN generic 0.13 0.1433 0.18 10% 26%
Paracetamol 500mg INN generic 0.1379 0.1517 0.18 10% 19%
Sodium Chloride 0.9% IV soln. INN generic 0.024 0.0264 0.0274 10% 4%
tab/cap unless stated Based on the actual wholesale mark-ups, and the estimated pharmacy mark-ups, for all nine locally produced products the greatest contribution to the patient price would be the manufacturers selling price. For imported products, this would be the case for 14 of the 16 products even when taking into account the identified import costs of 22%.
Discussion The government was found to be procuring a greater number of locally produced products than imported products. Overall, locally produced products were higher priced than imported products. Even when clearance costs are added to the price of imported products, locally produced products would still be higher priced than imports. Across the nine medicines where the government was procuring both locally produced products and an imported product, locally produced products of eight medicines were on average 45% higher priced than the imports. The price difference was as high as 134% for one medicine. This shows that the government’s 25% local preference policy is being exceeded for some medicines. Across just a few medicines, the government would save a significant amount of money if they only procured the imported product. While this would benefit public health in Ethiopia (e.g. more medicines could be purchased with the savings), it must be remembered that supporting local production can have social, industrial and other benefits (such as increased local employment). However, the local preference level of 25% is higher than in some countries in the region e.g. Kenya and Tanzania have a 15% local preference policy.
29
In general, public sector procurement prices of locally produced products and imported products were reasonable compared to international reference prices, however, some individual medicines were being purchased at very high prices e.g. locally produced furosemide 40mg tablets were procured at a price that was 5 times the international reference price. There were examples of medicines where lowest priced locally produced products were accounting for a fraction of the total volume purchased (as illustrated by the government’s procurement of 5 locally produced products containing ciprofloxacin 500mg at variable prices). This requires further investigation. It may be that the manufacturers are unable to supply greater quantities, or the government was buying from multiple local manufacturers (despite their higher prices) to support locally industry more broadly. In the public sector outlets, locally produced products were far more commonly stocked than imported products (48% compared to 19%). Patients were paying 22% more for locally produced than for imported medicines for the paired sample of 10 medicines (i.e. medicines that were both imported and locally produced). The analysis showed that the government was applying a smaller mark-up on locally produced products (17%), and a higher mark-up on imported products (53%). This illustrates another way in which the government is supporting local manufacturers. Applying the 53% mark-up on local products would result in higher patient prices for these products (compared to imports) which may reduce their market share. To improve access to medicines, especially for the poor, one option is for the government to purchase more lower priced imported products and pass on these lower procurement prices to patients in the public sector. In the private sector, outlets tended to stock more locally produced products (54%) compared to imported products (35%). Overall patients were paying 193% more for imported products compared to locally produced products for the paired sample of 15 medicines. Some individual medicines, locally produced and particularly imported products, were very high priced. These may not necessarily be affordable for Ethiopians on low-incomes when having to buy in the private sector. In the combined other sector, locally produced products were also more available than imported products. In this other sector, imported products were 63% higher priced locally produced products. Originator brands had low availability in the private sector and other sector and, unsurprisingly, were not found in the public sector. Where they were found in the private and other sectors, they were considerably higher priced than generics. In all three sectors, branded generics were more available than INN generics. In the public sector, locally produced branded generics were 23% higher prices than imported branded generics, whereas in the private sector the opposite was seen i.e. imported branded generics 153% higher priced than those made in Ethiopia. In all six survey regions the availability of locally produced products was higher than for imported products in the public and private sectors. Locally produced products had higher or similar patient prices than imported products in the public sector (all regions), but lower prices than imported products in the private sector. In Ethiopia, value-added tax (VAT) or goods and services tax (GST) is not applied to medicines, but a customs duty of 5% is applied to imported medicines (finished product). Import duties are also applied to active pharmaceutical ingredients. These import duties increase the price of medicines paid by patients so are a barrier to access.
30
Measuring price components in the supply chain has proven to be challenging in medicine price surveys undertaken using the WHO/HAI methodology. Therefore, in this survey, procurement prices and selling prices were collected from a single private wholesaler in Addis Ababa. This is only one point in the supply chain so has limited value. However, it showed the wholesaler was charging mark-ups of 5-10% for imported products, and 10% for local products. When the wholesale selling price was compared to median patient prices, pharmacy mark-ups of 18-186% for imported medicines, and 4-30% were estimated. If these mark-ups can be generalised, then the greatest contribution to the final patient price is likely to be the manufacturer’s selling prices although this warrants further investigation. Equally important is to look at the number of middle-men, and actual mark-ups and any other costs in the supply chain. While this survey measured differences between the price and availability of locally produced and imported products, it must be remembered that other factors can influence access to medicines (such as access to healthcare facilities, financing, health insurance systems). As well, it is crucial that all pharmaceutical products on the market are quality assured, whether imported or locally manufactured. Limitations in the methodology include the number of survey medicines (although it resulted in a large number of products in the analyses), not identifying clearance costs for imported medicines procured by the government (albeit they are unlikely to be large), not being able to verify the country of manufacture written on the product label with FMHACA, and not measuring all price components in the supply chain. Recommendations • Review government procurement prices and practices for all medicines to identify the level of local
preference. Where the 25% local preference is being exceeded, ascertain the reasons why. • Review the local preference policy as savings would result if the level of local preference was
reduced or abolished. • Pass on lower government procurement prices for imported medicines to patients buying medicines
in public sector outlets. • Abolish import duties on active pharmaceutical ingredients and finished products, and ensure the
savings are passed onto patients. • Investigate price components in the supply chain to ascertain whether the manufacturer’s selling
prices or the add-on costs (wholesalers and retailers mark-ups etc.) are making the largest contribution to the final patient price. If it is the add-ons, consideration should be given to regulating mark-ups bearing in mind the possible adverse effects on availability if mark-ups are reduced to a level at which it is no longer profitable to stock and sell that item.
31
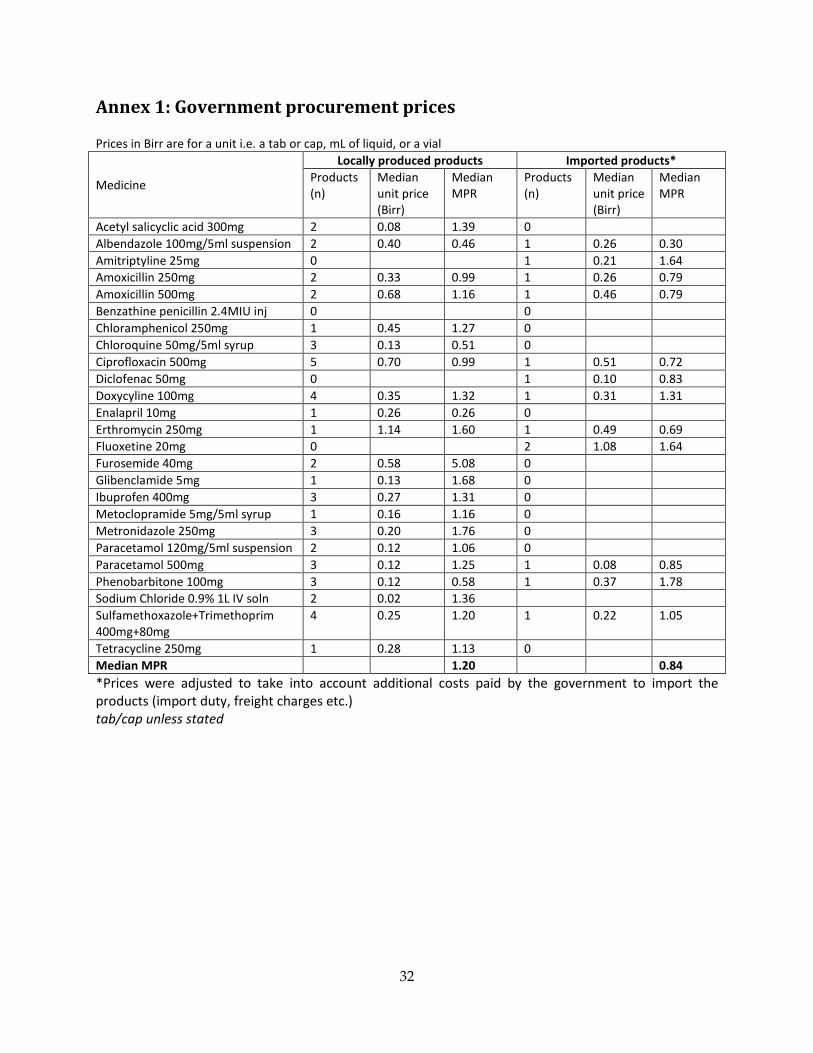
Annex 1: Government procurement prices Prices in Birr are for a unit i.e. a tab or cap, mL of liquid, or a vial
Medicine
Locally produced products Imported products* Products (n)
Median unit price (Birr)
Median MPR
Products (n)
Median unit price (Birr)
Median MPR
Acetyl salicyclic acid 300mg 2 0.08 1.39 0 Albendazole 100mg/5ml suspension 2 0.40 0.46 1 0.26 0.30 Amitriptyline 25mg 0 1 0.21 1.64 Amoxicillin 250mg 2 0.33 0.99 1 0.26 0.79 Amoxicillin 500mg 2 0.68 1.16 1 0.46 0.79 Benzathine penicillin 2.4MIU inj 0 0 Chloramphenicol 250mg 1 0.45 1.27 0 Chloroquine 50mg/5ml syrup 3 0.13 0.51 0 Ciprofloxacin 500mg 5 0.70 0.99 1 0.51 0.72 Diclofenac 50mg 0 1 0.10 0.83 Doxycyline 100mg 4 0.35 1.32 1 0.31 1.31 Enalapril 10mg 1 0.26 0.26 0 Erthromycin 250mg 1 1.14 1.60 1 0.49 0.69 Fluoxetine 20mg 0 2 1.08 1.64 Furosemide 40mg 2 0.58 5.08 0 Glibenclamide 5mg 1 0.13 1.68 0 Ibuprofen 400mg 3 0.27 1.31 0 Metoclopramide 5mg/5ml syrup 1 0.16 1.16 0 Metronidazole 250mg 3 0.20 1.76 0 Paracetamol 120mg/5ml suspension 2 0.12 1.06 0 Paracetamol 500mg 3 0.12 1.25 1 0.08 0.85 Phenobarbitone 100mg 3 0.12 0.58 1 0.37 1.78 Sodium Chloride 0.9% 1L IV soln 2 0.02 1.36 Sulfamethoxazole+Trimethoprim 400mg+80mg
4 0.25 1.20 1 0.22 1.05
Tetracycline 250mg 1 0.28 1.13 0 Median MPR 1.20 0.84 *Prices were adjusted to take into account additional costs paid by the government to import the products (import duty, freight charges etc.) tab/cap unless stated
32
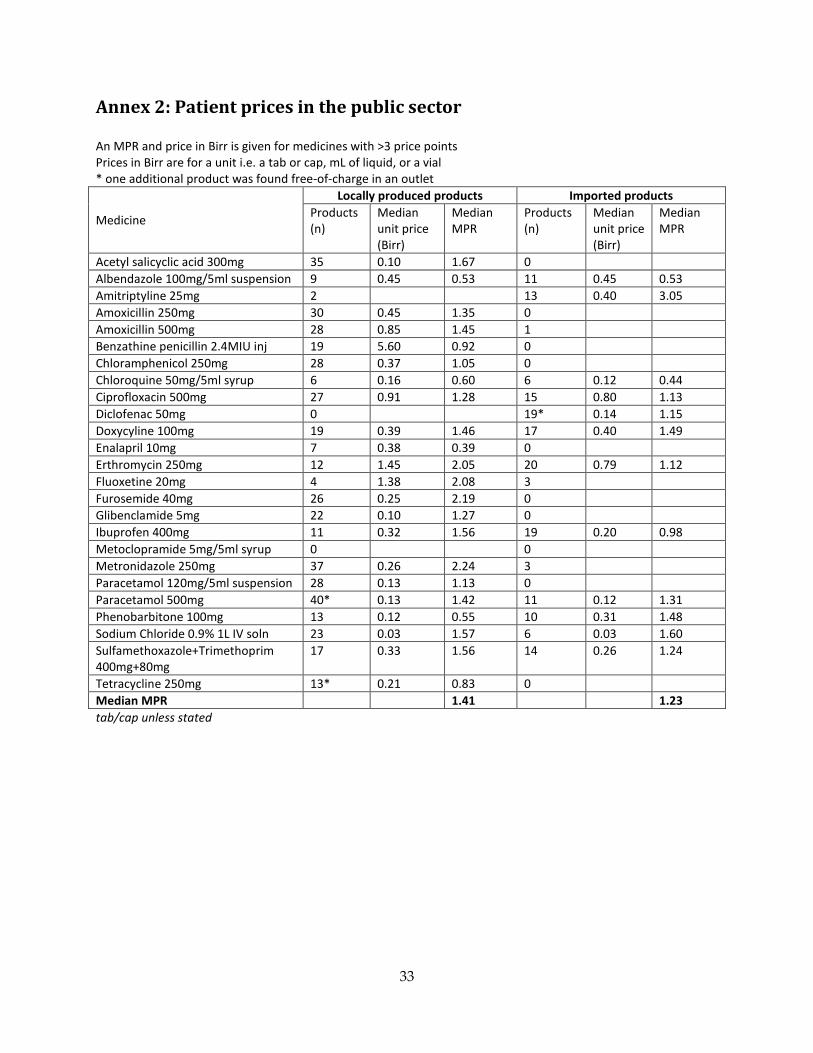
Annex 2: Patient prices in the public sector An MPR and price in Birr is given for medicines with >3 price points Prices in Birr are for a unit i.e. a tab or cap, mL of liquid, or a vial * one additional product was found free-of-charge in an outlet
Medicine
Locally produced products Imported products Products (n)
Median unit price (Birr)
Median MPR
Products (n)
Median unit price (Birr)
Median MPR
Acetyl salicyclic acid 300mg 35 0.10 1.67 0 Albendazole 100mg/5ml suspension 9 0.45 0.53 11 0.45 0.53 Amitriptyline 25mg 2 13 0.40 3.05 Amoxicillin 250mg 30 0.45 1.35 0 Amoxicillin 500mg 28 0.85 1.45 1 Benzathine penicillin 2.4MIU inj 19 5.60 0.92 0 Chloramphenicol 250mg 28 0.37 1.05 0 Chloroquine 50mg/5ml syrup 6 0.16 0.60 6 0.12 0.44 Ciprofloxacin 500mg 27 0.91 1.28 15 0.80 1.13 Diclofenac 50mg 0 19* 0.14 1.15 Doxycyline 100mg 19 0.39 1.46 17 0.40 1.49 Enalapril 10mg 7 0.38 0.39 0 Erthromycin 250mg 12 1.45 2.05 20 0.79 1.12 Fluoxetine 20mg 4 1.38 2.08 3 Furosemide 40mg 26 0.25 2.19 0 Glibenclamide 5mg 22 0.10 1.27 0 Ibuprofen 400mg 11 0.32 1.56 19 0.20 0.98 Metoclopramide 5mg/5ml syrup 0 0 Metronidazole 250mg 37 0.26 2.24 3 Paracetamol 120mg/5ml suspension 28 0.13 1.13 0 Paracetamol 500mg 40* 0.13 1.42 11 0.12 1.31 Phenobarbitone 100mg 13 0.12 0.55 10 0.31 1.48 Sodium Chloride 0.9% 1L IV soln 23 0.03 1.57 6 0.03 1.60 Sulfamethoxazole+Trimethoprim 400mg+80mg
17 0.33 1.56 14 0.26 1.24
Tetracycline 250mg 13* 0.21 0.83 0 Median MPR 1.41 1.23 tab/cap unless stated
33
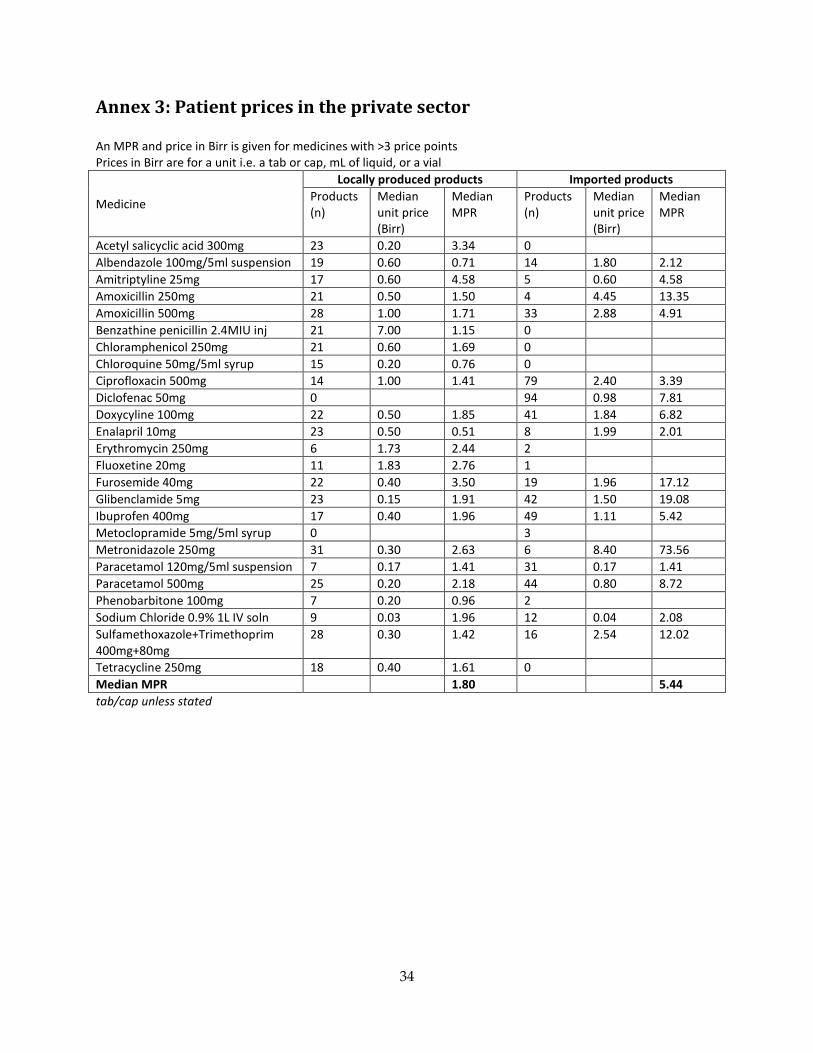
Annex 3: Patient prices in the private sector An MPR and price in Birr is given for medicines with >3 price points Prices in Birr are for a unit i.e. a tab or cap, mL of liquid, or a vial
Medicine
Locally produced products Imported products Products (n)
Median unit price (Birr)
Median MPR
Products (n)
Median unit price (Birr)
Median MPR
Acetyl salicyclic acid 300mg 23 0.20 3.34 0 Albendazole 100mg/5ml suspension 19 0.60 0.71 14 1.80 2.12 Amitriptyline 25mg 17 0.60 4.58 5 0.60 4.58 Amoxicillin 250mg 21 0.50 1.50 4 4.45 13.35 Amoxicillin 500mg 28 1.00 1.71 33 2.88 4.91 Benzathine penicillin 2.4MIU inj 21 7.00 1.15 0 Chloramphenicol 250mg 21 0.60 1.69 0 Chloroquine 50mg/5ml syrup 15 0.20 0.76 0 Ciprofloxacin 500mg 14 1.00 1.41 79 2.40 3.39 Diclofenac 50mg 0 94 0.98 7.81 Doxycyline 100mg 22 0.50 1.85 41 1.84 6.82 Enalapril 10mg 23 0.50 0.51 8 1.99 2.01 Erythromycin 250mg 6 1.73 2.44 2 Fluoxetine 20mg 11 1.83 2.76 1 Furosemide 40mg 22 0.40 3.50 19 1.96 17.12 Glibenclamide 5mg 23 0.15 1.91 42 1.50 19.08 Ibuprofen 400mg 17 0.40 1.96 49 1.11 5.42 Metoclopramide 5mg/5ml syrup 0 3 Metronidazole 250mg 31 0.30 2.63 6 8.40 73.56 Paracetamol 120mg/5ml suspension 7 0.17 1.41 31 0.17 1.41 Paracetamol 500mg 25 0.20 2.18 44 0.80 8.72 Phenobarbitone 100mg 7 0.20 0.96 2 Sodium Chloride 0.9% 1L IV soln 9 0.03 1.96 12 0.04 2.08 Sulfamethoxazole+Trimethoprim 400mg+80mg
28 0.30 1.42 16 2.54 12.02
Tetracycline 250mg 18 0.40 1.61 0 Median MPR 1.80 5.44 tab/cap unless stated
34
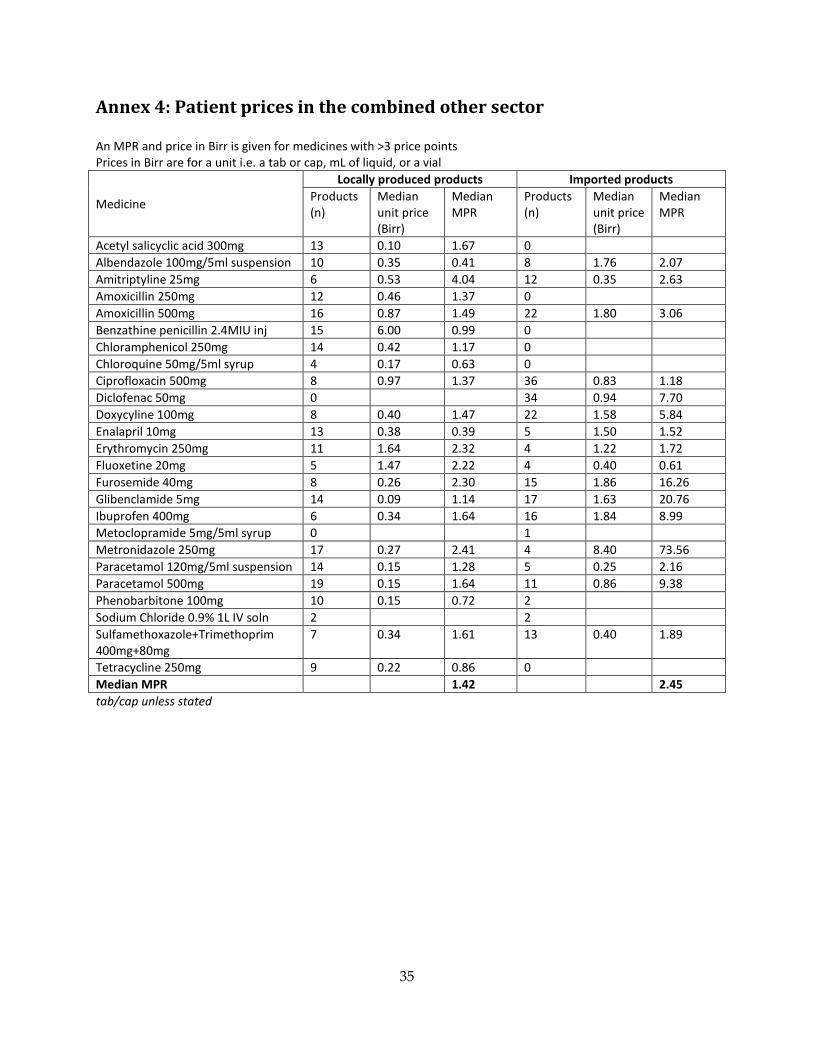
Annex 4: Patient prices in the combined other sector An MPR and price in Birr is given for medicines with >3 price points Prices in Birr are for a unit i.e. a tab or cap, mL of liquid, or a vial
Medicine
Locally produced products Imported products Products (n)
Median unit price (Birr)
Median MPR
Products (n)
Median unit price (Birr)
Median MPR
Acetyl salicyclic acid 300mg 13 0.10 1.67 0 Albendazole 100mg/5ml suspension 10 0.35 0.41 8 1.76 2.07 Amitriptyline 25mg 6 0.53 4.04 12 0.35 2.63 Amoxicillin 250mg 12 0.46 1.37 0 Amoxicillin 500mg 16 0.87 1.49 22 1.80 3.06 Benzathine penicillin 2.4MIU inj 15 6.00 0.99 0 Chloramphenicol 250mg 14 0.42 1.17 0 Chloroquine 50mg/5ml syrup 4 0.17 0.63 0 Ciprofloxacin 500mg 8 0.97 1.37 36 0.83 1.18 Diclofenac 50mg 0 34 0.94 7.70 Doxycyline 100mg 8 0.40 1.47 22 1.58 5.84 Enalapril 10mg 13 0.38 0.39 5 1.50 1.52 Erythromycin 250mg 11 1.64 2.32 4 1.22 1.72 Fluoxetine 20mg 5 1.47 2.22 4 0.40 0.61 Furosemide 40mg 8 0.26 2.30 15 1.86 16.26 Glibenclamide 5mg 14 0.09 1.14 17 1.63 20.76 Ibuprofen 400mg 6 0.34 1.64 16 1.84 8.99 Metoclopramide 5mg/5ml syrup 0 1 Metronidazole 250mg 17 0.27 2.41 4 8.40 73.56 Paracetamol 120mg/5ml suspension 14 0.15 1.28 5 0.25 2.16 Paracetamol 500mg 19 0.15 1.64 11 0.86 9.38 Phenobarbitone 100mg 10 0.15 0.72 2 Sodium Chloride 0.9% 1L IV soln 2 2 Sulfamethoxazole+Trimethoprim 400mg+80mg
7 0.34 1.61 13 0.40 1.89
Tetracycline 250mg 9 0.22 0.86 0 Median MPR 1.42 2.45 tab/cap unless stated
35
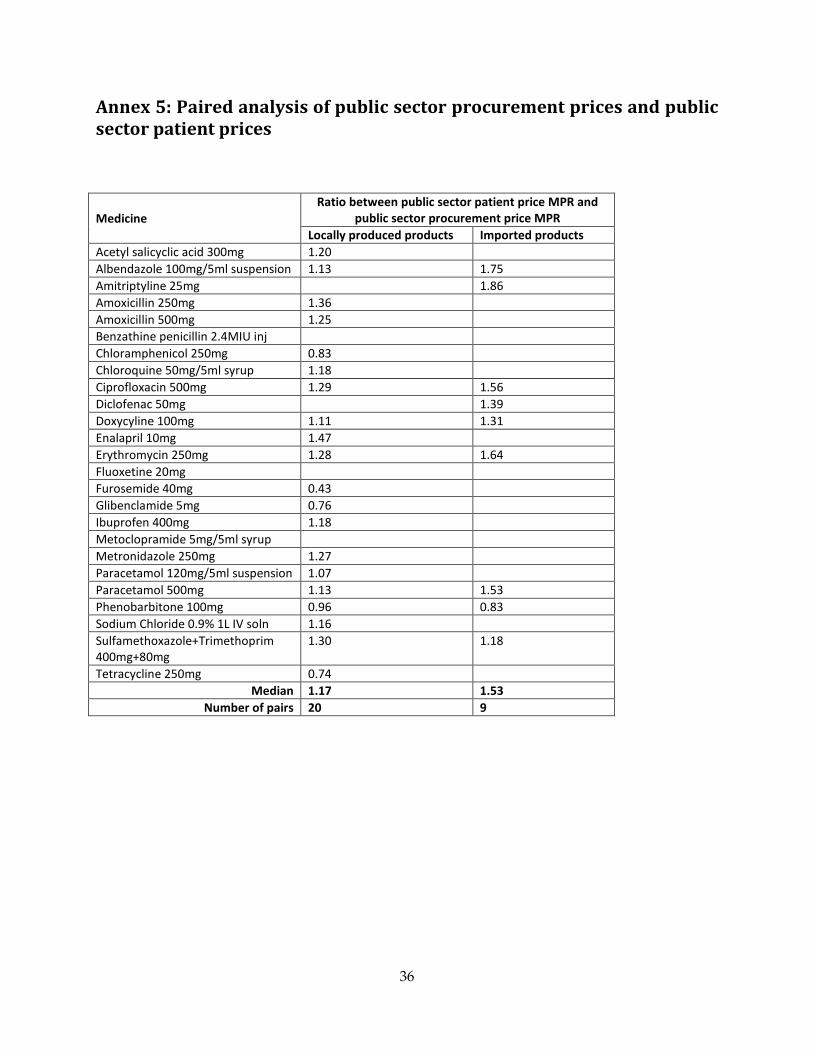
Annex 5: Paired analysis of public sector procurement prices and public sector patient prices
Medicine Ratio between public sector patient price MPR and
public sector procurement price MPR Locally produced products Imported products
Acetyl salicyclic acid 300mg 1.20 Albendazole 100mg/5ml suspension 1.13 1.75 Amitriptyline 25mg 1.86 Amoxicillin 250mg 1.36 Amoxicillin 500mg 1.25 Benzathine penicillin 2.4MIU inj Chloramphenicol 250mg 0.83 Chloroquine 50mg/5ml syrup 1.18 Ciprofloxacin 500mg 1.29 1.56 Diclofenac 50mg 1.39 Doxycyline 100mg 1.11 1.31 Enalapril 10mg 1.47 Erythromycin 250mg 1.28 1.64 Fluoxetine 20mg Furosemide 40mg 0.43 Glibenclamide 5mg 0.76 Ibuprofen 400mg 1.18 Metoclopramide 5mg/5ml syrup Metronidazole 250mg 1.27 Paracetamol 120mg/5ml suspension 1.07 Paracetamol 500mg 1.13 1.53 Phenobarbitone 100mg 0.96 0.83 Sodium Chloride 0.9% 1L IV soln 1.16 Sulfamethoxazole+Trimethoprim 400mg+80mg
1.30 1.18
Tetracycline 250mg 0.74 Median 1.17 1.53
Number of pairs 20 9
36
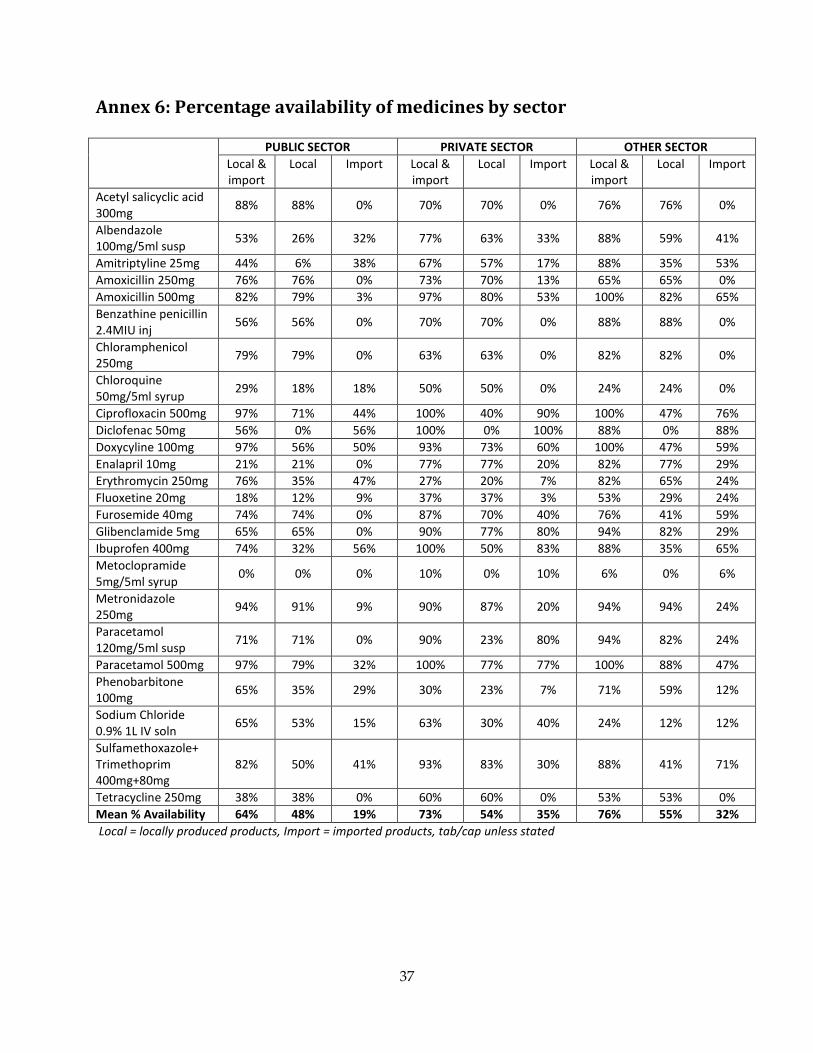
Annex 6: Percentage availability of medicines by sector PUBLIC SECTOR PRIVATE SECTOR OTHER SECTOR
Local & import
Local Import Local & import
Local Import Local & import
Local Import
Acetyl salicyclic acid 300mg 88% 88% 0% 70% 70% 0% 76% 76% 0%
Albendazole 100mg/5ml susp 53% 26% 32% 77% 63% 33% 88% 59% 41%
Amitriptyline 25mg 44% 6% 38% 67% 57% 17% 88% 35% 53% Amoxicillin 250mg 76% 76% 0% 73% 70% 13% 65% 65% 0% Amoxicillin 500mg 82% 79% 3% 97% 80% 53% 100% 82% 65% Benzathine penicillin 2.4MIU inj 56% 56% 0% 70% 70% 0% 88% 88% 0%
Chloramphenicol 250mg 79% 79% 0% 63% 63% 0% 82% 82% 0%
Chloroquine 50mg/5ml syrup 29% 18% 18% 50% 50% 0% 24% 24% 0%
Ciprofloxacin 500mg 97% 71% 44% 100% 40% 90% 100% 47% 76% Diclofenac 50mg 56% 0% 56% 100% 0% 100% 88% 0% 88% Doxycyline 100mg 97% 56% 50% 93% 73% 60% 100% 47% 59% Enalapril 10mg 21% 21% 0% 77% 77% 20% 82% 77% 29% Erythromycin 250mg 76% 35% 47% 27% 20% 7% 82% 65% 24% Fluoxetine 20mg 18% 12% 9% 37% 37% 3% 53% 29% 24% Furosemide 40mg 74% 74% 0% 87% 70% 40% 76% 41% 59% Glibenclamide 5mg 65% 65% 0% 90% 77% 80% 94% 82% 29% Ibuprofen 400mg 74% 32% 56% 100% 50% 83% 88% 35% 65% Metoclopramide 5mg/5ml syrup 0% 0% 0% 10% 0% 10% 6% 0% 6%
Metronidazole 250mg 94% 91% 9% 90% 87% 20% 94% 94% 24%
Paracetamol 120mg/5ml susp 71% 71% 0% 90% 23% 80% 94% 82% 24%
Paracetamol 500mg 97% 79% 32% 100% 77% 77% 100% 88% 47% Phenobarbitone 100mg 65% 35% 29% 30% 23% 7% 71% 59% 12%
Sodium Chloride 0.9% 1L IV soln 65% 53% 15% 63% 30% 40% 24% 12% 12%
Sulfamethoxazole+ Trimethoprim 400mg+80mg
82% 50% 41% 93% 83% 30% 88% 41% 71%
Tetracycline 250mg 38% 38% 0% 60% 60% 0% 53% 53% 0% Mean % Availability 64% 48% 19% 73% 54% 35% 76% 55% 32% Local = locally produced products, Import = imported products, tab/cap unless stated
37
APF EPHARM CADILA ETHIOPIA FAWES PHARM. PHARMACURE MEDSOL PHARM. No. prod.
Median price Birr
MPR No. prod.
Median price Birr
MPR No. prod.
Median price Birr
MPR No. prod.
Median price Birr
MPR No. prod.
Median price Birr
MPR No. prod.
Median price Birr
MPR
Acetyl salicyclic acid 300mg 47 0.10 1.67 24 0.11 1.75
Albendazole 100mg/5ml susp 38 0.49 0.58
Amitriptyline 25mg 25 0.55 4.20
Amoxicillin 250mg 47 0.49 1.47 16 0.41 1.23
Amoxicillin 500mg 53 0.90 1.54 19 0.95 1.62
Benzathine pen. 2.4MIU inj 17 7.00 1.15 38 6.43 1.06
Chloramphenicol 250mg 46 0.50 1.41 17 0.60 1.69
Chloroquine 50mg/5ml syrup 6 0.18 0.66 9 0.20 0.76 10 0.17 0.63
Ciprofloxacin 500mg 7 0.80 1.13 8 0.90 1.27 33 0.95 1.34
Diclofenac 50mg Doxycyline 100mg 47 0.40 1.48 2 0.71
Enalapril 10mg 43 0.50 0.51 Erythromycin 250mg 29 1.64 2.32
Fluoxetine 20mg 4 1.00 1.51 16 1.86 2.82 Furosemide 40mg 27 0.40 3.50 29 0.24 2.07
Glibenclamide 5mg 59 0.11 1.40
Ibuprofen 400mg 25 0.34 1.67 9 0.40 1.96
Metoclopramide 5mg/5ml syrup
Annex 7. Patient prices of products manufactured by Ethiopian companies, all sectors
Metronidazole 250mg 52 0.28 2.45 30 0.30 2.63 3 0.40
Paracetamol 120mg/5ml susp 20 0.14 1.22 14 0.13 1.07 12 0.17 1.41 3 0.15
Paracetamol 500mg 24 0.14 1.52 44 0.20 2.18 14 0.15 1.58
Phenobarbitone 100mg 9 0.12 0.55 21 0.15 0.72
Sodium Chloride 0.9% 1L IV soln 20 0.03 1.60 3 0.03 7 0.03 1.57 4 0.03 1.93
Sulf+Trimeth 400mg+80mg 31 0.34 1.61 19 0.30 1.42 2 0.37
Tetracycline 250mg 32 0.32 1.30 8 0.27 1.06
All products found 577 0.39 1.50 290 0.28 1.42 231 0.42 1.41 13 0.17 0.63 7 0.03 1.57 4 0.03 1.93
In addition to the above, two products were found manufactured by East Africa Pharmaceuticals (paracetamol 500mg tab) and 1 product manufactured by RxAfrica PLC Ethio-American Pharmaceuticals (ciprofloxacin 500mg tab) An MPR is given for medicines with >3 price points. Prices in Birr are for a unit i.e. a tab or cap, mL of liquid, or a vial tab/cap unless stated
39 2