Embed Size (px)
Citation preview
Pricing Terminal Illness – Is there no cost?
Francis Burgess & Brendon Gerding
Agenda
• Terminal Illness – UK vs Australia
• UK Survival Study
• Adapting the results to 24 Month TI
• When TI was initially introduced the proportion of death
claims was approximately 5% and rate guarantees were
typically 3 years or longer.
• Assumption was that overlap with TPD was extremely high.
• Cost mainly perceived as lost interest and lost premiums.
• Typically priced at less than 1% of death premiums in a
market that was increasing member benefits.
• TI proportion of death claims and contract terms are very
different now!
Hasn’t the cost of TI always been immaterial?
4
Terminal Illness UK vs Australia
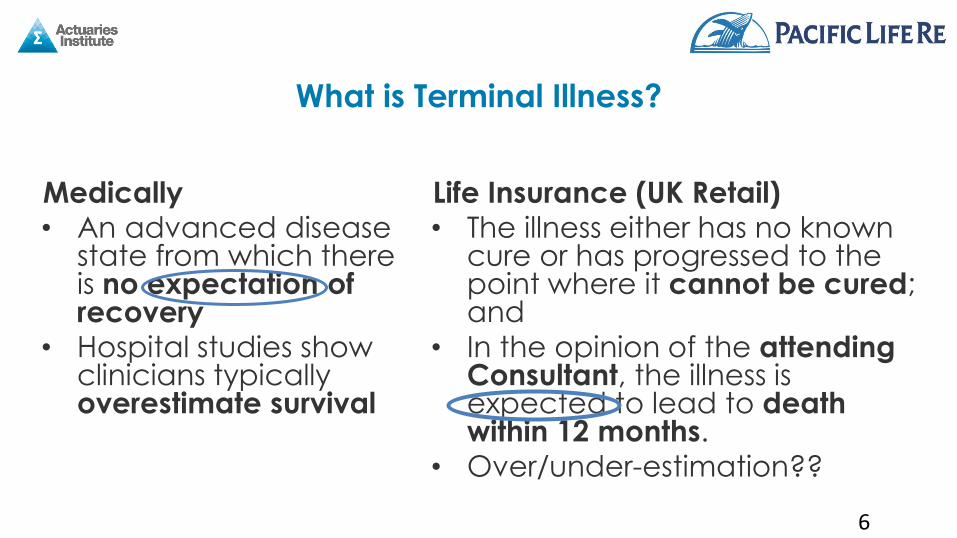
What is Terminal Illness?
Medically • An advanced disease
state from which there is no expectation of recovery
• Hospital studies show clinicians typically overestimate survival
Life Insurance (UK Retail) • The illness either has no known
cure or has progressed to the point where it cannot be cured; and
• In the opinion of the attending Consultant, the illness is expected to lead to death within 12 months.
• Over/under-estimation??
6
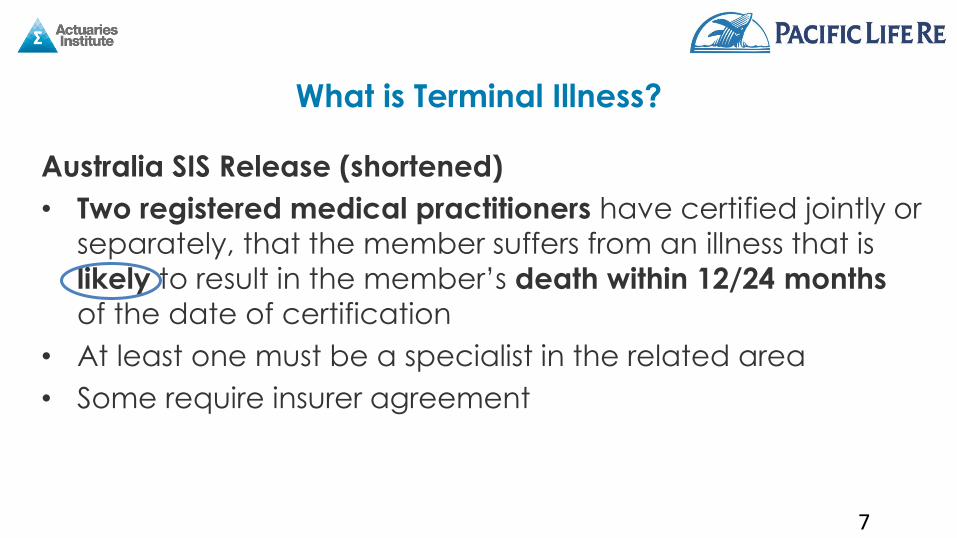
What is Terminal Illness?
Australia SIS Release (shortened)
• Two registered medical practitioners have certified jointly or
separately, that the member suffers from an illness that is
likely to result in the member’s death within 12/24 months
of the date of certification
• At least one must be a specialist in the related area
• Some require insurer agreement
7
0%
10%
20%
30%
40%
50%
60%
70%
80%
90%
100%
1 13 25 37 49 61 73 85 97 109
% S
urv
ivin
g
Months Since Diagnosis
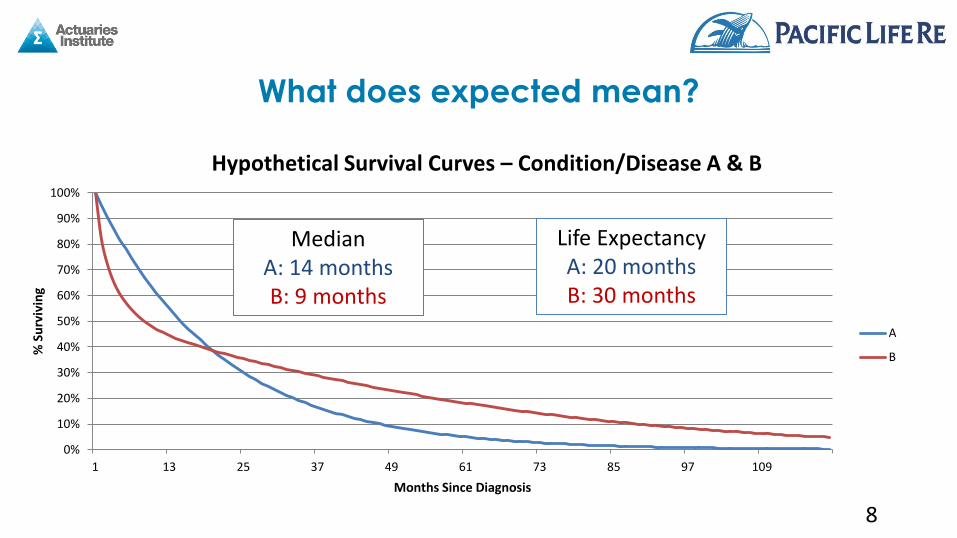
Hypothetical Survival Curves – Condition/Disease A & B
A
B
What does expected mean?
8
Median A: 14 months B: 9 months
Life Expectancy A: 20 months B: 30 months
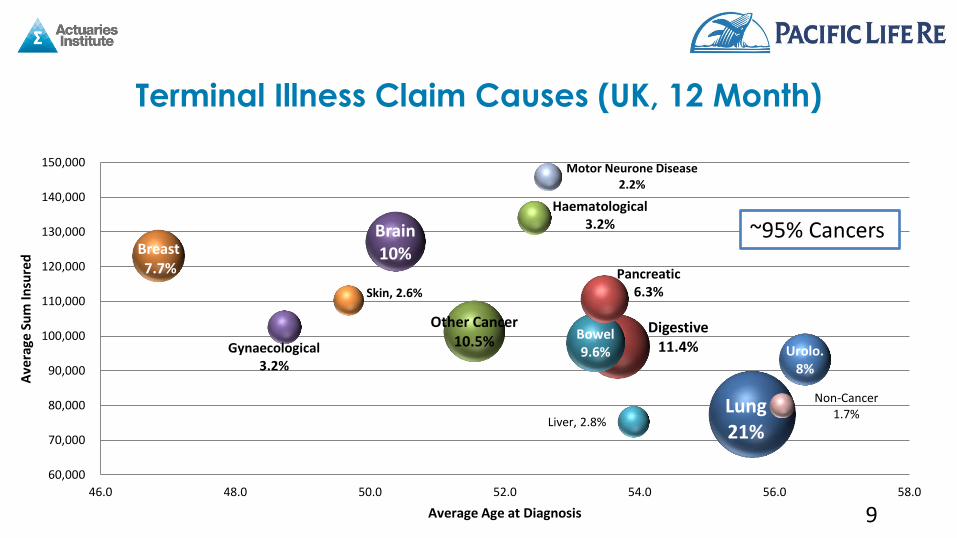
Terminal Illness Claim Causes (UK, 12 Month)
9
Lung 21%
Breast 7.7%
Digestive 11.4%
Other Cancer 10.5%
Brain 10%
Bowel 9.6% Urolo.
8%
Pancreatic 6.3%
Haematological 3.2%
Gynaecological 3.2%
Liver, 2.8%
Skin, 2.6%
Motor Neurone Disease 2.2%
Non-Cancer 1.7%
60,000
70,000
80,000
90,000
100,000
110,000
120,000
130,000
140,000
150,000
46.0 48.0 50.0 52.0 54.0 56.0 58.0
Ave
rage
Su
m In
sure
d
Average Age at Diagnosis
~95% Cancers
0%
5%
10%
15%
20%
25%
30%
35%
2005 2006 2007 2008 2009 2010 2011 2012 2013 2014 2015
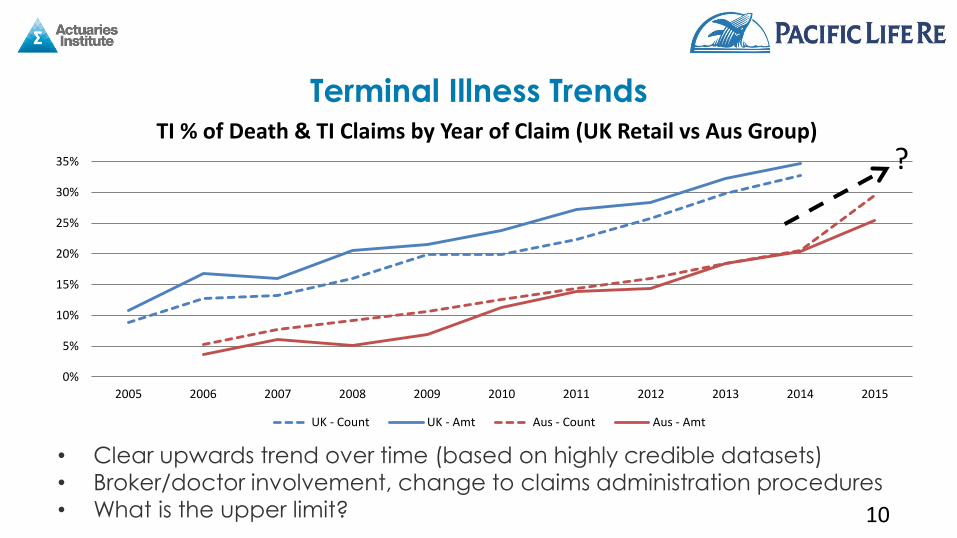
TI % of Death & TI Claims by Year of Claim (UK Retail vs Aus Group)
UK - Count UK - Amt Aus - Count Aus - Amt
• Clear upwards trend over time (based on highly credible datasets) • Broker/doctor involvement, change to claims administration procedures • What is the upper limit?
Terminal Illness Trends
10
?
11
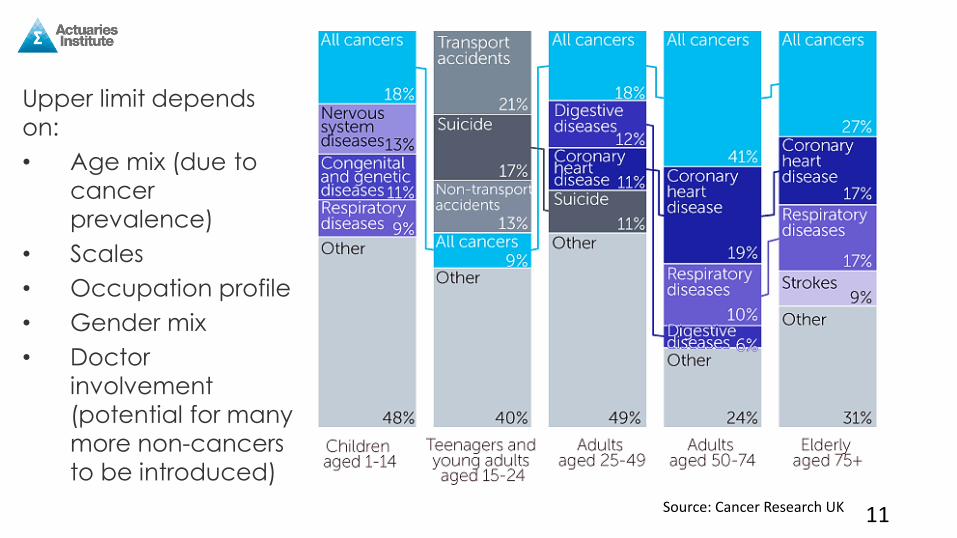
Upper limit depends
on:
• Age mix (due to
cancer
prevalence)
• Scales
• Occupation profile
• Gender mix
• Doctor
involvement
(potential for many
more non-cancers
to be introduced)
Source: Cancer Research UK
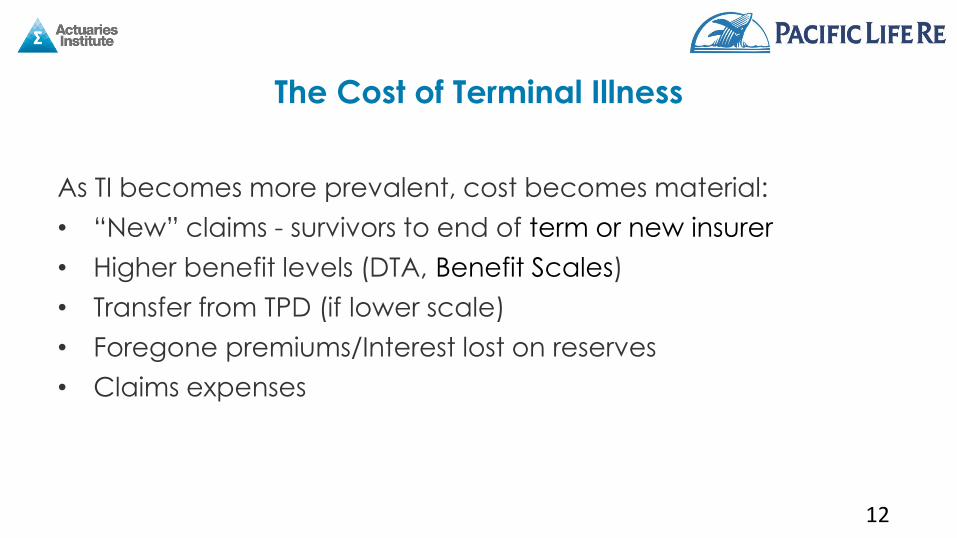
As TI becomes more prevalent, cost becomes material:
• “New” claims - survivors to end of term or new insurer
• Higher benefit levels (DTA, Benefit Scales)
• Transfer from TPD (if lower scale)
• Foregone premiums/Interest lost on reserves
• Claims expenses
The Cost of Terminal Illness
12

UK Survival Study
• Given the increasing trends, we wanted to find out what was
happening post-claim
• TI Claims data sourced from leading UK retail companies (12
month definition)
• ~3,500 TI claims over ~10 years
• Tracing exercise performed using our longevity tracing
systems
Study Overview
14
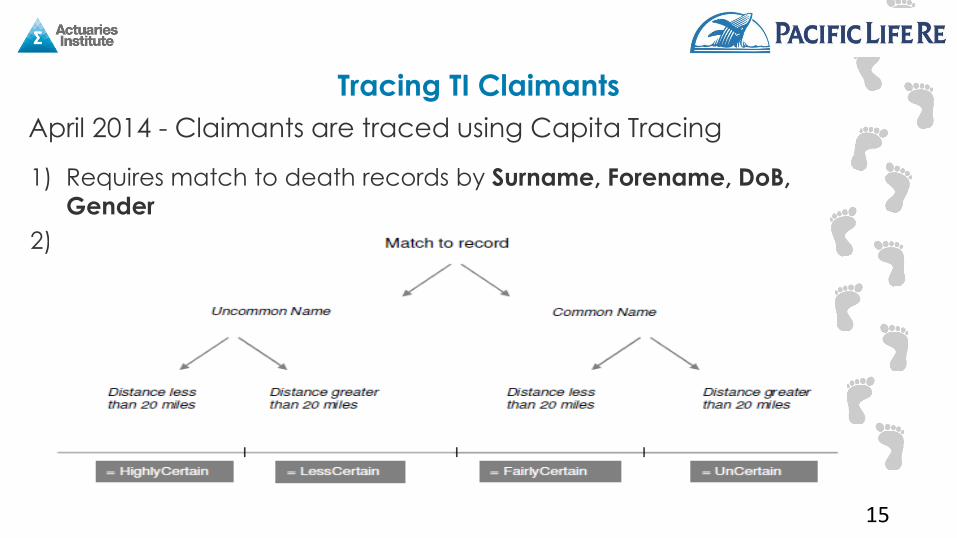
April 2014 - Claimants are traced using Capita Tracing
1) Requires match to death records by Surname, Forename, DoB,
Gender
2) Then assigns “grading” to the match as follows:
Tracing TI Claimants
15
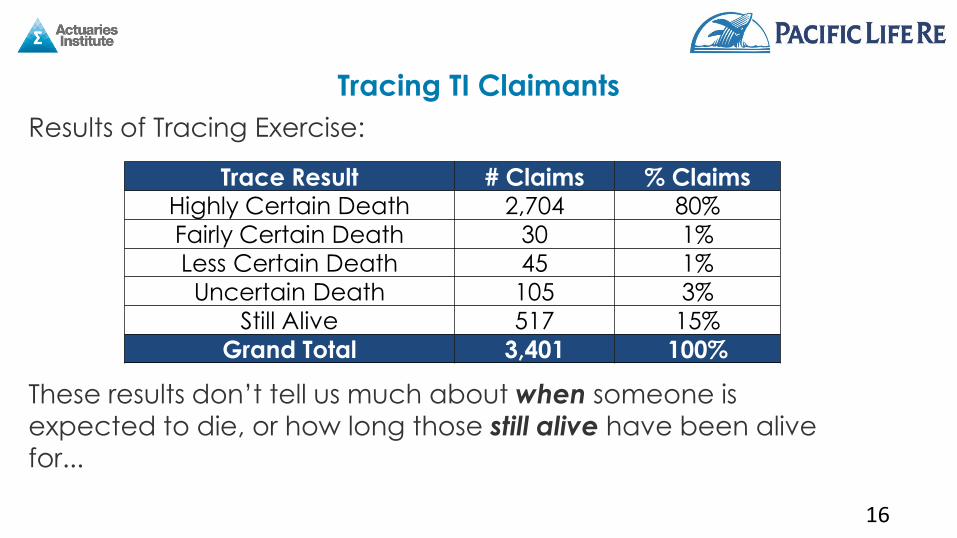
Results of Tracing Exercise:
These results don’t tell us much about when someone is
expected to die, or how long those still alive have been alive
for...
16
Trace Result # Claims % Claims Highly Certain Death 2,704 80%
Fairly Certain Death 30 1%
Less Certain Death 45 1%
Uncertain Death 105 3%
Still Alive 517 15%
Grand Total 3,401 100%
Tracing TI Claimants
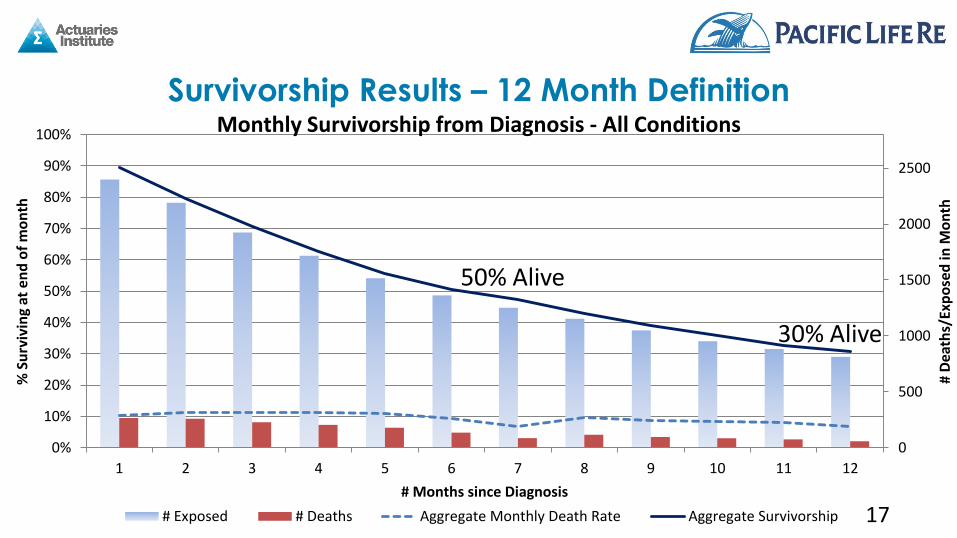
Survivorship Results – 12 Month Definition
17
0
500
1000
1500
2000
2500
0%
10%
20%
30%
40%
50%
60%
70%
80%
90%
100%
1 2 3 4 5 6 7 8 9 10 11 12
# D
eath
s/Ex
po
sed
in M
on
th
% S
urv
ivin
g at
en
d o
f m
on
th
# Months since Diagnosis
Monthly Survivorship from Diagnosis - All Conditions
# Exposed # Deaths Aggregate Monthly Death Rate Aggregate Survivorship
50% Alive
30% Alive
0
500
1000
1500
2000
2500
0.0%
10.0%
20.0%
30.0%
40.0%
50.0%
60.0%
70.0%
80.0%
90.0%
100.0%
1 7 13 19 25 31 37 43 49 55
# D
eath
s/Ex
po
sed
in M
on
th
% S
urv
ivin
g at
en
d o
f m
on
th
# Months since Diagnosis
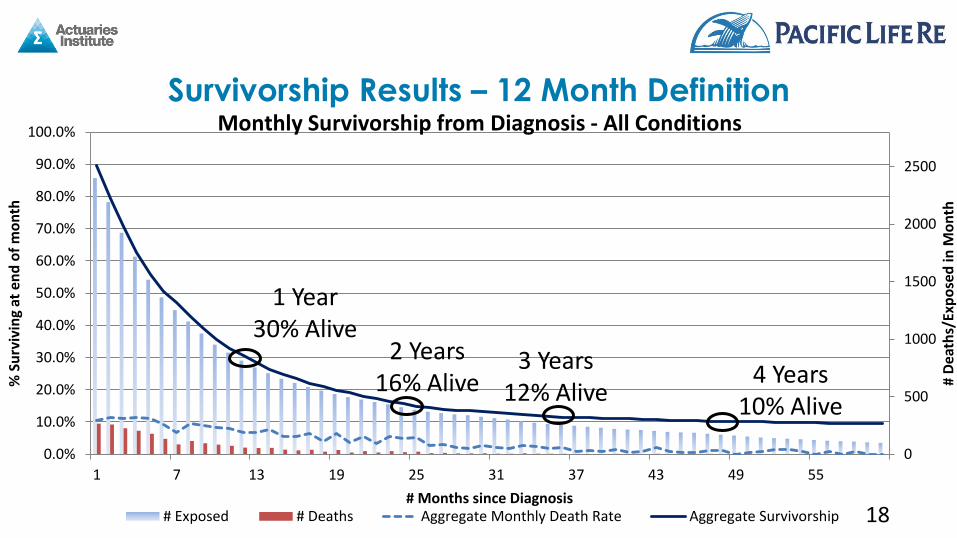
Monthly Survivorship from Diagnosis - All Conditions
# Exposed # Deaths Aggregate Monthly Death Rate Aggregate Survivorship 18
1 Year 30% Alive
2 Years 16% Alive 4 Years
10% Alive
3 Years 12% Alive
Survivorship Results – 12 Month Definition
0%
10%
20%
30%
40%
50%
60%
70%
80%
90%
100%
1 13 25 37 49 61 73 85 97 109 121 133 145 157 169
% S
uri
vivn
g (e
nd
of
mo
nth
)
# Months Since Diagnosis
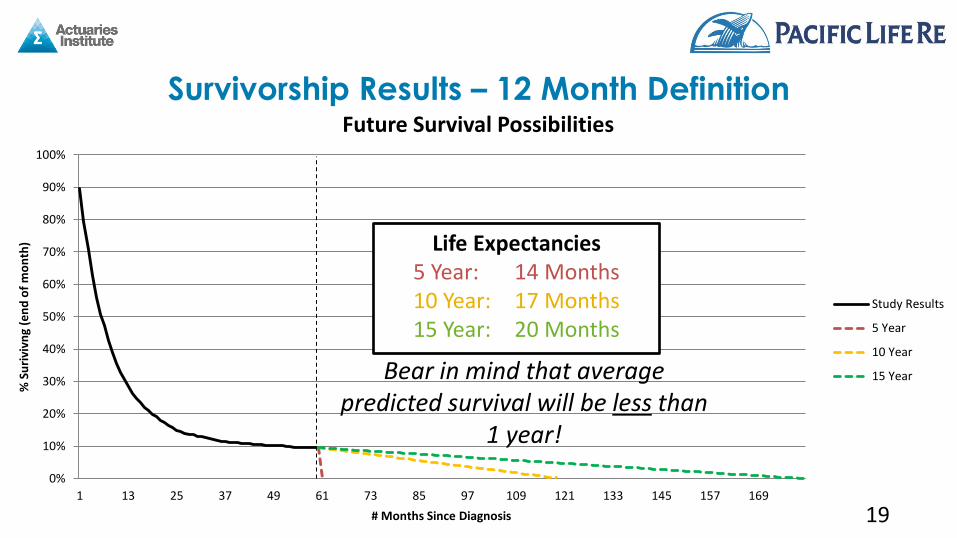
Future Survival Possibilities
Study Results
5 Year
10 Year
15 Year
Survivorship Results – 12 Month Definition
Life Expectancies 5 Year: 14 Months 10 Year: 17 Months 15 Year: 20 Months
Bear in mind that average predicted survival will be less than
1 year!
19
0
50
100
150
200
250
300
0.0%
2.0%
4.0%
6.0%
8.0%
10.0%
12.0%
1 3 5 7 9 11 13 15 17 19 21 23 25 27 29 31 33 35 37 39 41 43 45 47 49 51 53 55 57 59
# D
eath
s in
Mo
nth
% D
yin
g in
Mo
nth
# Months since Diagnosis
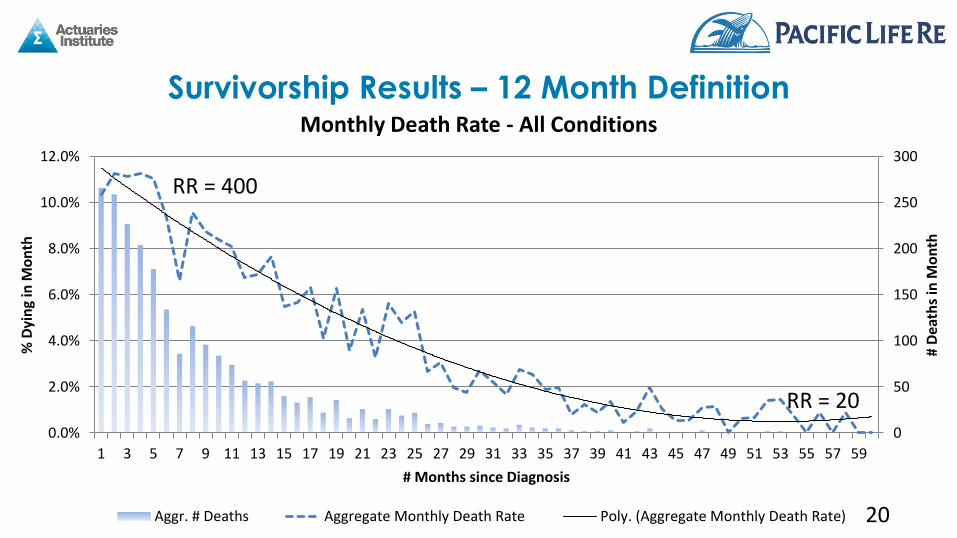
Monthly Death Rate - All Conditions
Aggr. # Deaths Aggregate Monthly Death Rate Poly. (Aggregate Monthly Death Rate)
Survivorship Results – 12 Month Definition
RR = 400
RR = 20
20
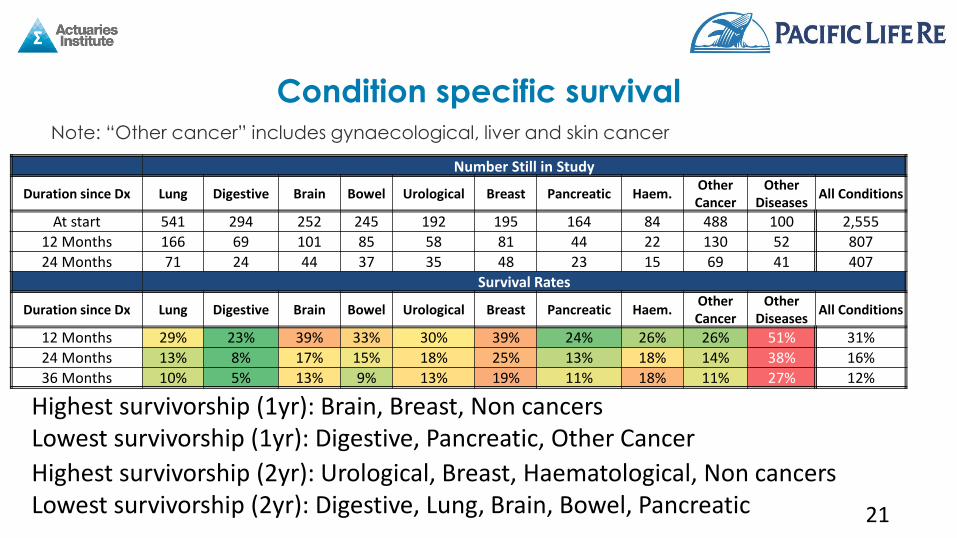
Condition specific survival Note: “Other cancer” includes gynaecological, liver and skin cancer
21
Number Still in Study
Duration since Dx Lung Digestive Brain Bowel Urological Breast Pancreatic Haem. Other Cancer
Other Diseases
All Conditions
At start 541 294 252 245 192 195 164 84 488 100 2,555
12 Months 166 69 101 85 58 81 44 22 130 52 807
24 Months 71 24 44 37 35 48 23 15 69 41 407
Survival Rates
Duration since Dx Lung Digestive Brain Bowel Urological Breast Pancreatic Haem. Other Cancer
Other Diseases
All Conditions
12 Months 29% 23% 39% 33% 30% 39% 24% 26% 26% 51% 31%
24 Months 13% 8% 17% 15% 18% 25% 13% 18% 14% 38% 16%
36 Months 10% 5% 13% 9% 13% 19% 11% 18% 11% 27% 12%
Highest survivorship (1yr): Brain, Breast, Non cancers Lowest survivorship (1yr): Digestive, Pancreatic, Other Cancer Highest survivorship (2yr): Urological, Breast, Haematological, Non cancers Lowest survivorship (2yr): Digestive, Lung, Brain, Bowel, Pancreatic
• TI Claims have increased materially, and no immediate sign of respite
• In the UK, people are living
longer than predicted, with 1
in 10 still alive after 5 years
• Life expectancy (mean) is a
more sensible measure of
“expected”, but median is the
more common approach
Key Takeaway – UK Study
22

Adapting the Results 24 Month TI
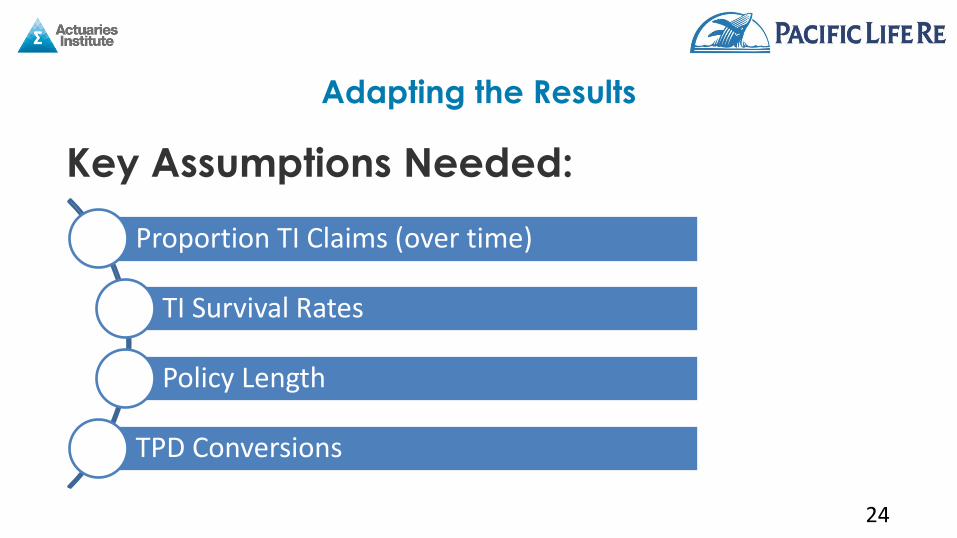
Key Assumptions Needed:
Adapting the Results
24
Proportion TI Claims (over time)
TI Survival Rates
Policy Length
TPD Conversions
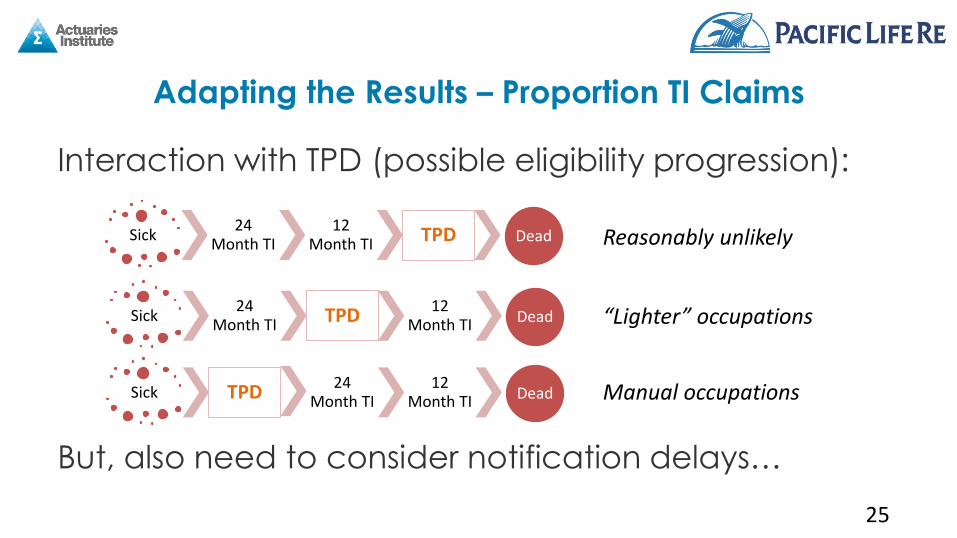
Interaction with TPD (possible eligibility progression):
But, also need to consider notification delays…
Adapting the Results – Proportion TI Claims
25
Sick 24
Month TI 12
Month TI TPD Dead
Sick 24
Month TI TPD 12
Month TI Dead
Sick TPD 24
Month TI 12
Month TI Dead
Reasonably unlikely
“Lighter” occupations
Manual occupations
• Day 1 – All those in the 13-24 period now eligible to claim
• Expect some awareness growth – “phasing in”
• Following initial peak, expect track back to 12 month
proportions (which are currently increasing)
• But, some permanent uplift will apply
– Recoveries, deaths
– Transfers from TPD
– Increased doctor error (or siding with patient)
Adapting the Results – Proportion TI Claims
26
0%
5%
10%
15%
20%
25%
30%
35%
40%
45%
50%
Jan-2014 Jan-2015 Jan-2016 Jan-2017 Jan-2018 Jan-2019
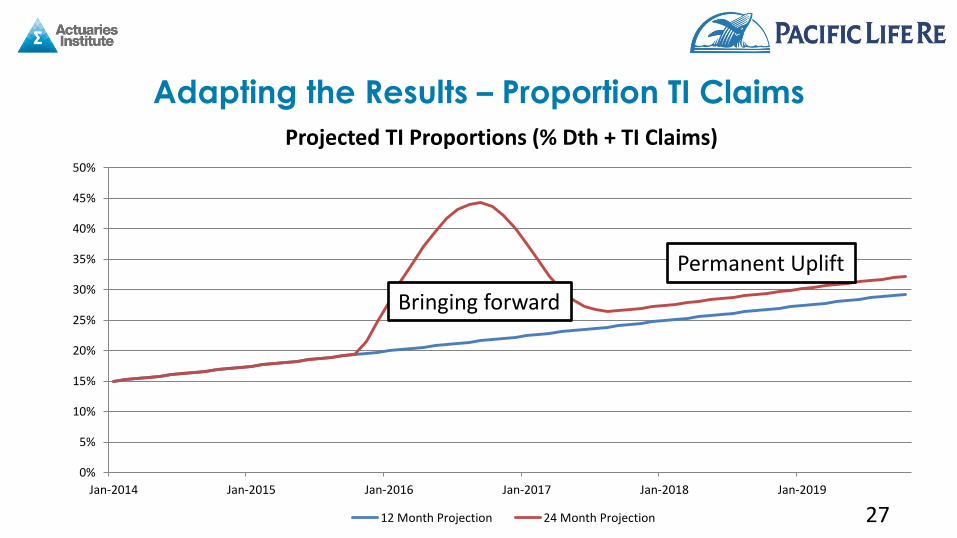
Projected TI Proportions (% Dth + TI Claims)
12 Month Projection 24 Month Projection
Adapting the Results – Proportion TI Claims
27
Bringing forward
Permanent Uplift
• UK Retail survival starting point
• Expect roughly +12 months life expectancy,
assuming accuracy stays the same
• But, accuracy ↓ as timeframe ↑
• Highly dependant on doctor behaviour
Adapting the Results – TI Survival Rates
28
0%
10%
20%
30%
40%
50%
60%
70%
80%
90%
100%
1 7 13 19 25 31 37 43 49 55
% S
urv
ival
(Eo
M)
Months Since Diagnosis
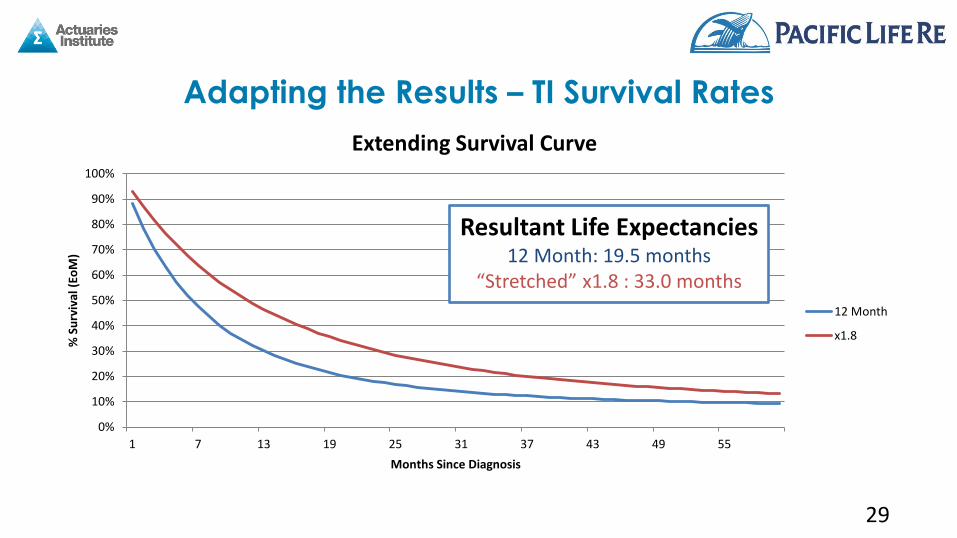
Extending Survival Curve
12 Month
x1.8
Adapting the Results – TI Survival Rates
29
Resultant Life Expectancies 12 Month: 19.5 months
“Stretched” x1.8 : 33.0 months
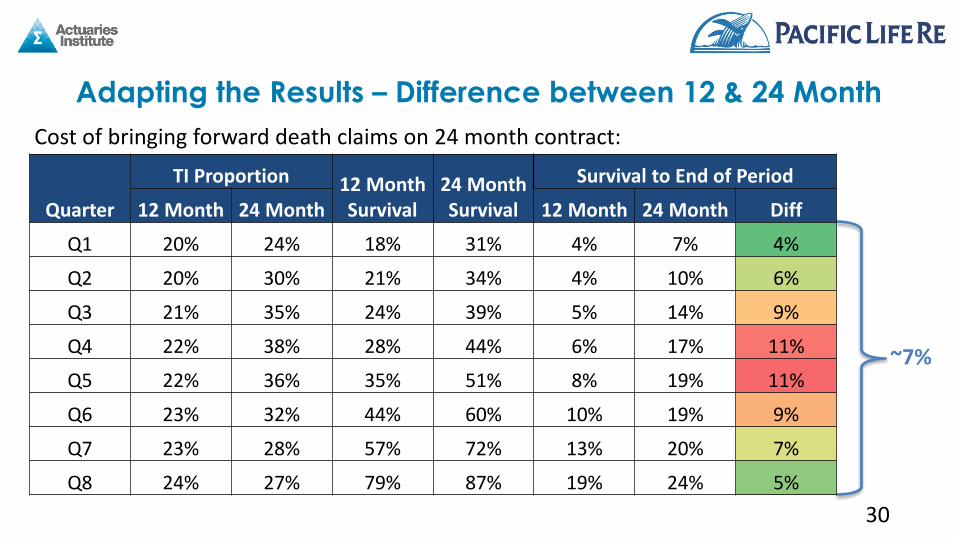
Adapting the Results – Difference between 12 & 24 Month
30
~7%
Quarter
TI Proportion 12 Month Survival
24 Month Survival
Survival to End of Period
12 Month 24 Month 12 Month 24 Month Diff
Q1 20% 24% 18% 31% 4% 7% 4%
Q2 20% 30% 21% 34% 4% 10% 6%
Q3 21% 35% 24% 39% 5% 14% 9%
Q4 22% 38% 28% 44% 6% 17% 11%
Q5 22% 36% 35% 51% 8% 19% 11%
Q6 23% 32% 44% 60% 10% 19% 9%
Q7 23% 28% 57% 72% 13% 20% 7%
Q8 24% 27% 79% 87% 19% 24% 5%
Cost of bringing forward death claims on 24 month contract:
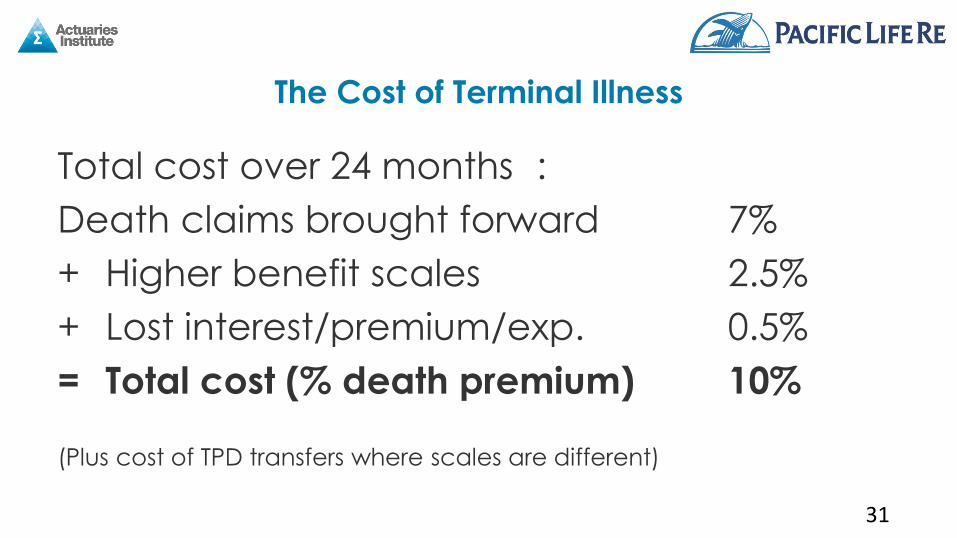
The Cost of Terminal Illness
31
Total cost over 24 months :
Death claims brought forward 7%
+ Higher benefit scales 2.5%
+ Lost interest/premium/exp. 0.5%
= Total cost (% death premium) 10%
(Plus cost of TPD transfers where scales are different)
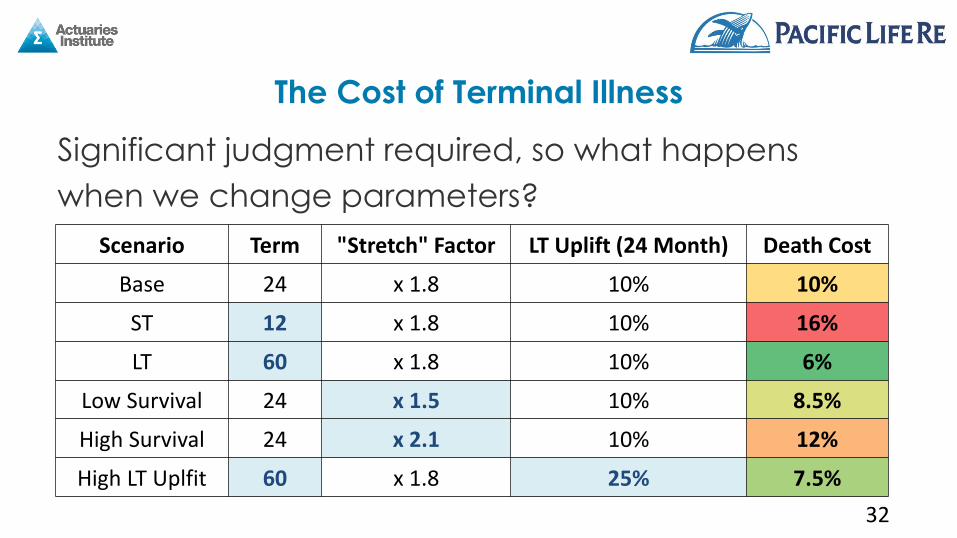
Significant judgment required, so what happens
when we change parameters?
The Cost of Terminal Illness
32
Scenario Term "Stretch" Factor LT Uplift (24 Month) Death Cost
Base 24 x 1.8 10% 10%
ST 12 x 1.8 10% 16%
LT 60 x 1.8 10% 6%
Low Survival 24 x 1.5 10% 8.5%
High Survival 24 x 2.1 10% 12%
High LT Uplfit 60 x 1.8 25% 7.5%

Concluding Thoughts
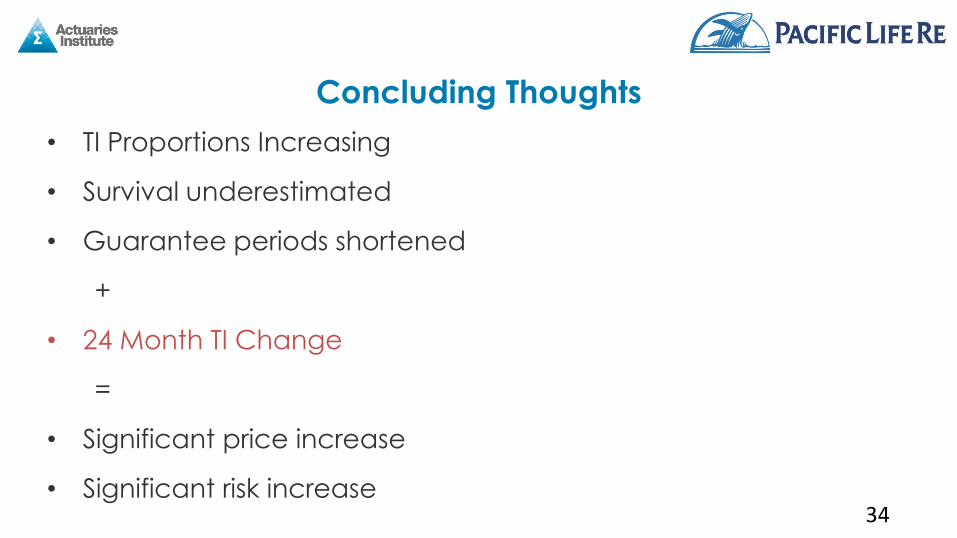
• TI Proportions Increasing
• Survival underestimated
• Guarantee periods shortened
+
• 24 Month TI Change
=
• Significant price increase
• Significant risk increase
Concluding Thoughts
34
Concluding Thoughts
35
Member Perspective
• Strong argument for alignment of insurance and SIS definitions.
• BUT arguments for different “burden of proof” for accessing member account balance compared to an insurance benefit.
• Consistency between different superannuation products (industry funds, master trusts and individual retail insurance policies).
Concluding Thoughts
36
Trustee Perspective
• Strong argument for alignment of insurance and SIS definitions.
• 24 month TI is predominately a one off transfer cost. Cost materially different for Industry Funds versus MT and retail policies.
• Implications for member equity as premium is being brought forward and issues of intergenerational equity.
• Timing of potential member premium increases. Equity and timing issues may be addresses by specific exit clauses by current insurer.
Concluding Thoughts
37
Alternative Product Designs
• Alignment of insurance and SIS definitions is NOT the only answer.
• Members could access their own money at 24 months and
insurance benefit at 12 months. Insurance cover would continue despite account balance being exhausted.
• Free cover would continue after SIS TI release for death / TI
insurance benefits.
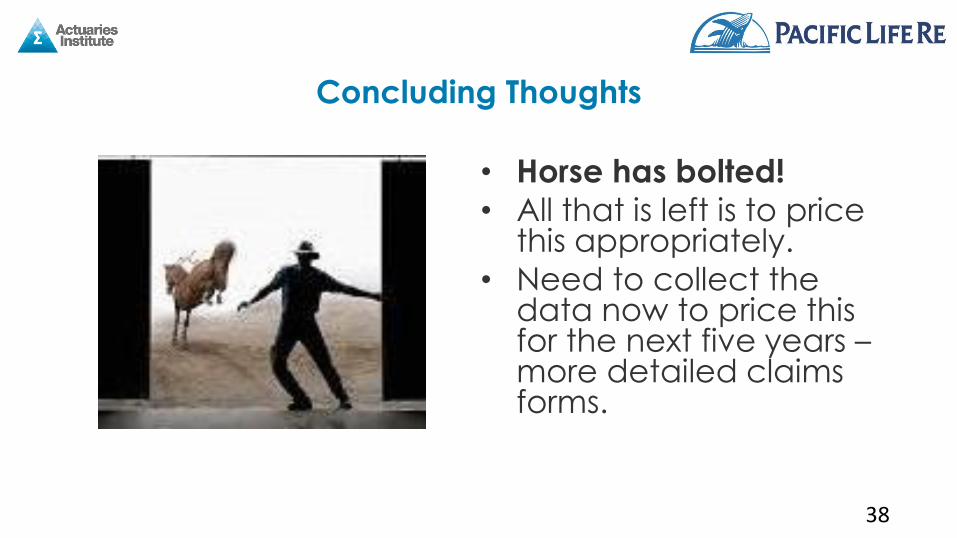
• Horse has bolted!
• All that is left is to price this appropriately.
• Need to collect the data now to price this for the next five years – more detailed claims forms.
Concluding Thoughts
38