Embed Size (px)
DESCRIPTION
Primary Productivity & Phytoplankton Growth. Provided by the SeaWiFS Project, NASA/Goddard Space Flight Center and ORBIMAGE. thanks to Tammi Richardson, Claudia Benitez-Nelson & Ron Benner for many of these slides. - PowerPoint PPT Presentation
Citation preview
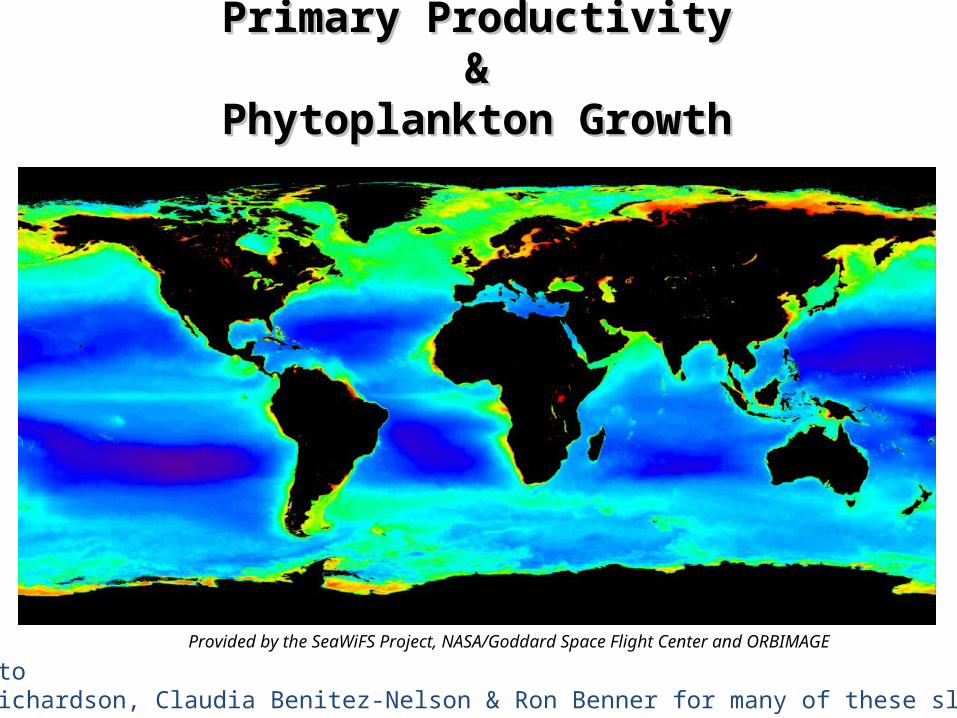
Primary ProductivityPrimary Productivity&&
Phytoplankton GrowthPhytoplankton Growth
Provided by the SeaWiFS Project, NASA/Goddard Space Flight Center and ORBIMAGE
thanks to Tammi Richardson, Claudia Benitez-Nelson & Ron Benner for many of these slides
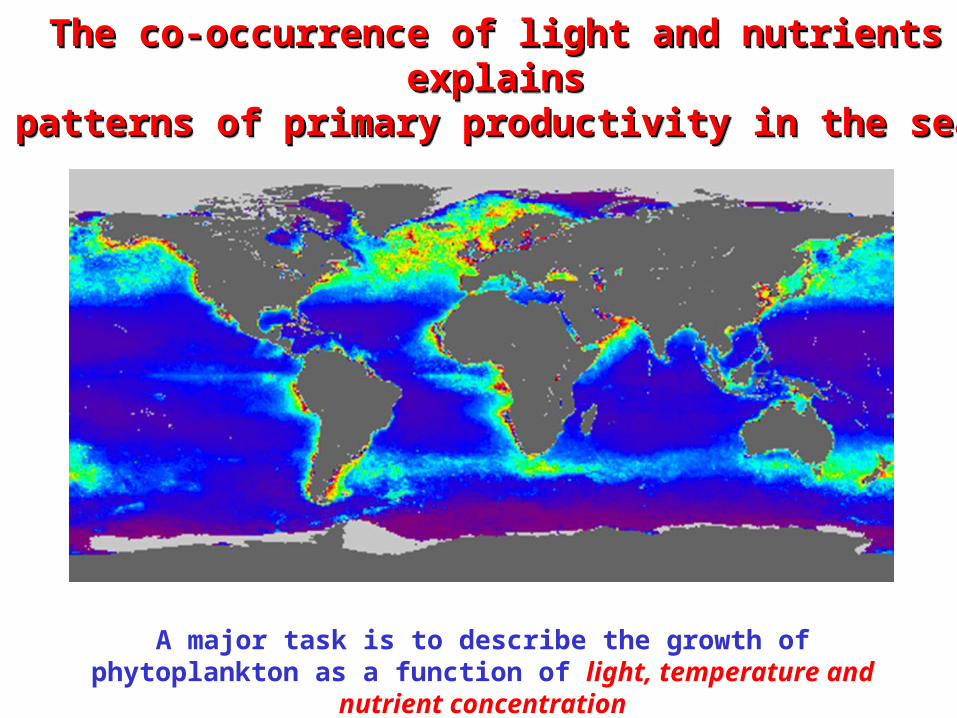
The co-occurrence of light and nutrients explainsThe co-occurrence of light and nutrients explainspatterns of primary productivity in the seapatterns of primary productivity in the sea
The co-occurrence of light and nutrients explainsThe co-occurrence of light and nutrients explainspatterns of primary productivity in the seapatterns of primary productivity in the sea
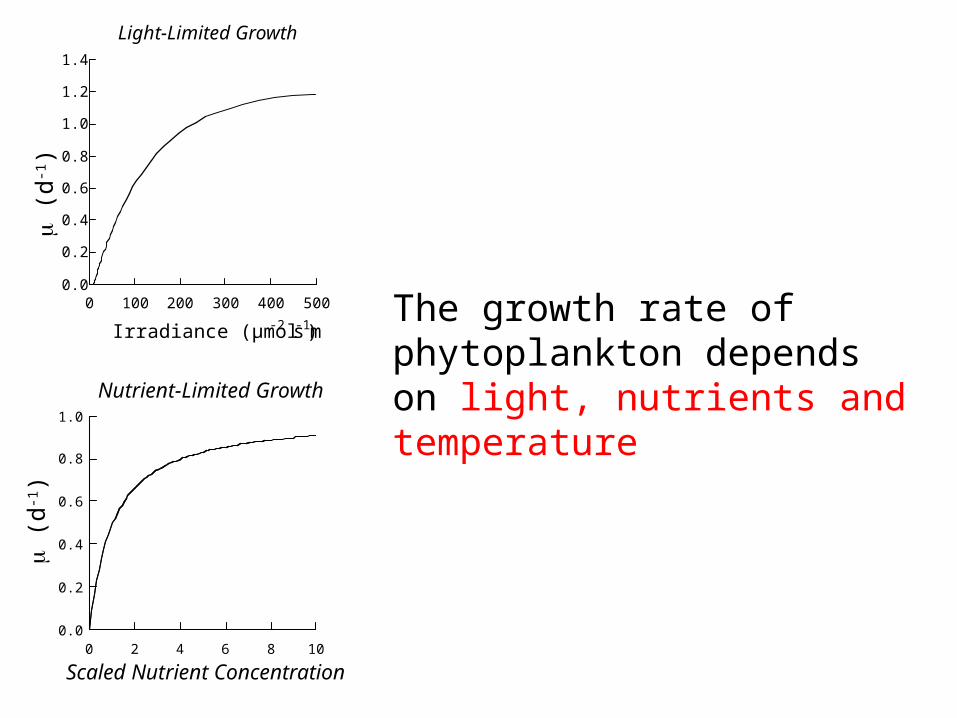
A major task is to describe the growth of phytoplankton as a function of light, temperature and nutrient concentration
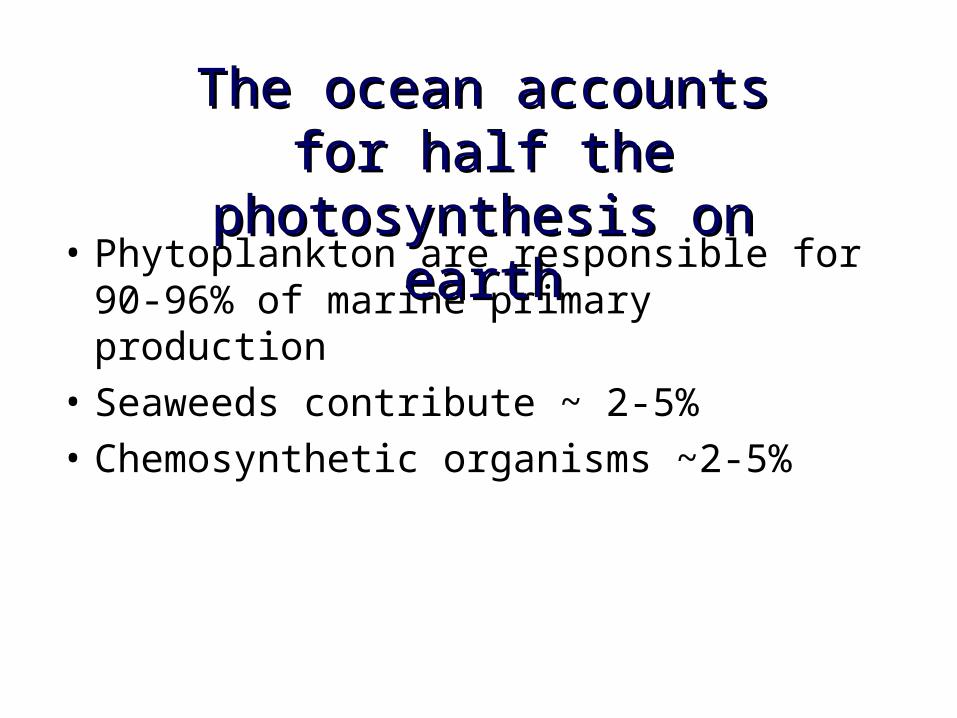
• Phytoplankton are responsible for 90-96% of marine primary production
• Seaweeds contribute ~ 2-5%
• Chemosynthetic organisms ~2-5%
The ocean accounts for half The ocean accounts for half the photosynthesis on earththe photosynthesis on earth
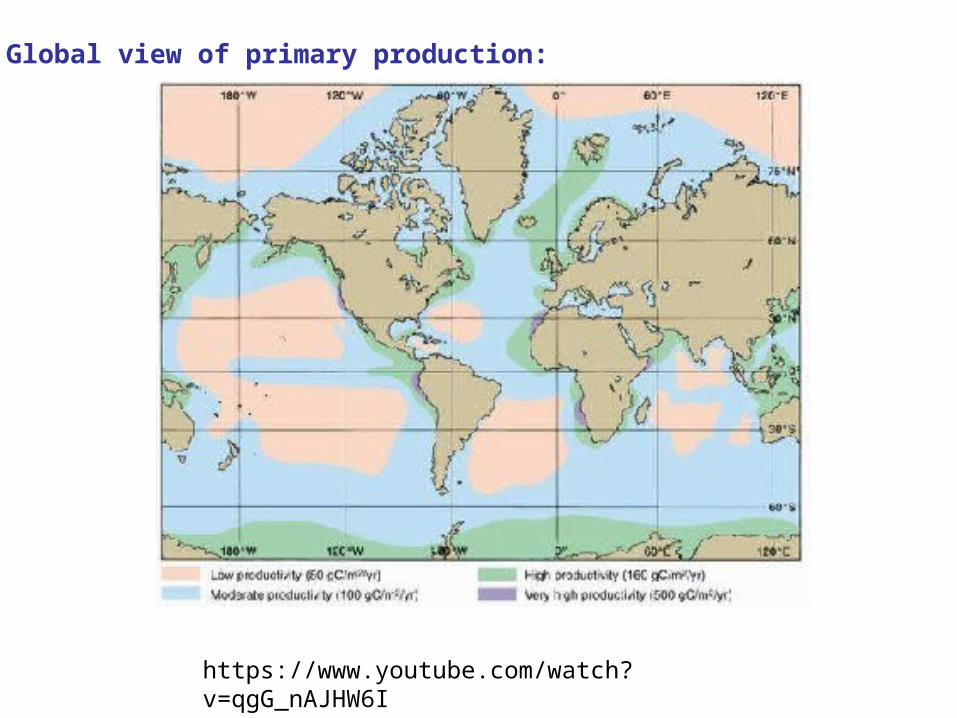
Global view of primary production:
https://www.youtube.com/watch?v=qgG_nAJHW6I
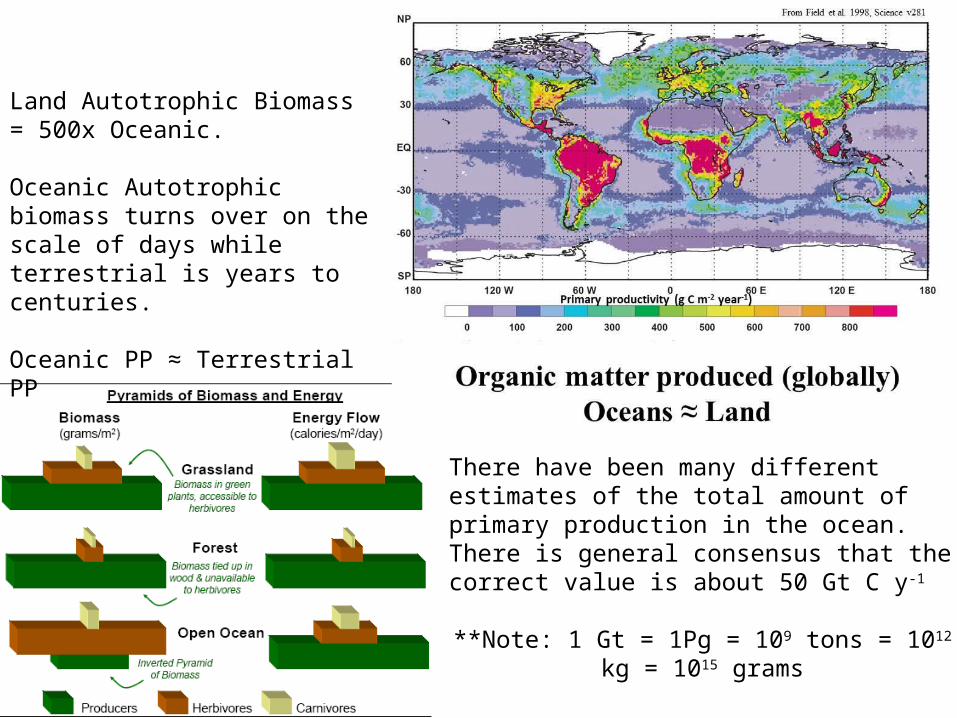
There have been many different estimates of the total amount of primary production in the ocean. There is general consensus that the correct value is about 50 Gt C y-1
**Note: 1 Gt = 1Pg = 109 tons = 1012 kg = 1015 grams
Land Autotrophic Biomass = 500x Oceanic.
Oceanic Autotrophic biomass turns over on the scale of days while terrestrial is years to centuries.
Oceanic PP ≈ Terrestrial PP
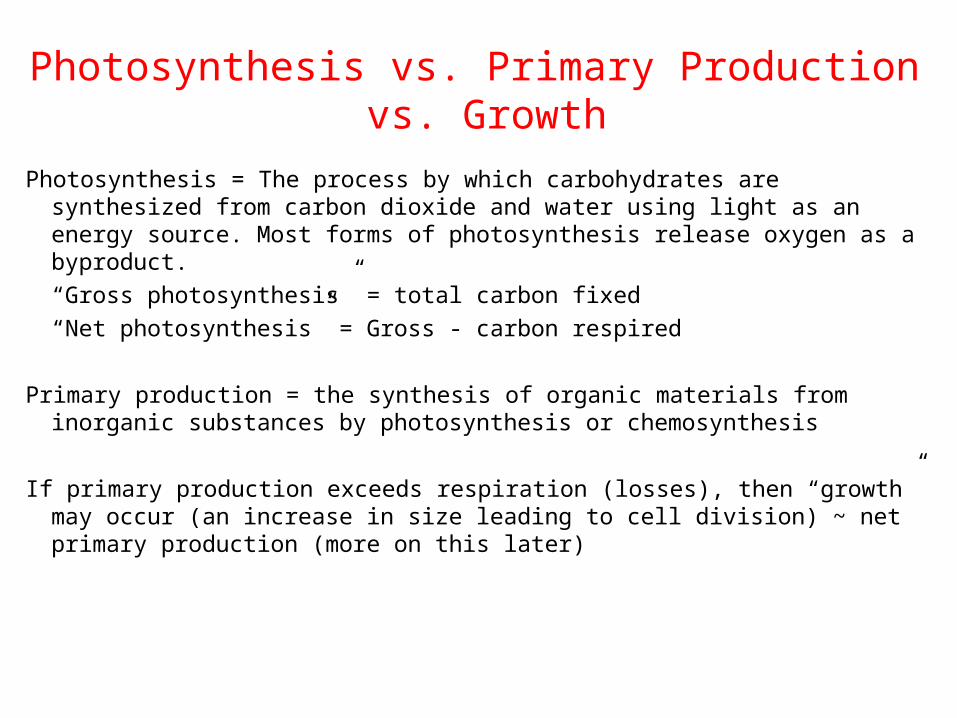
Photosynthesis vs. Primary Production vs. Growth
Photosynthesis = The process by which carbohydrates are synthesized from carbon dioxide and water using light as an energy source. Most forms of photosynthesis release oxygen as a byproduct.
“Gross photosynthesis” = total carbon fixed
“Net photosynthesis” = Gross - carbon respired
Primary production = the synthesis of organic materials from inorganic substances by photosynthesis or chemosynthesis
If primary production exceeds respiration (losses), then “growth” may occur (an increase in size leading to cell division) ~ net primary production (more on this later)
1min 30 - 6min 17
https://www.youtube.com/watch?v=joZ1EsA5_NY
Photosynthesis Info
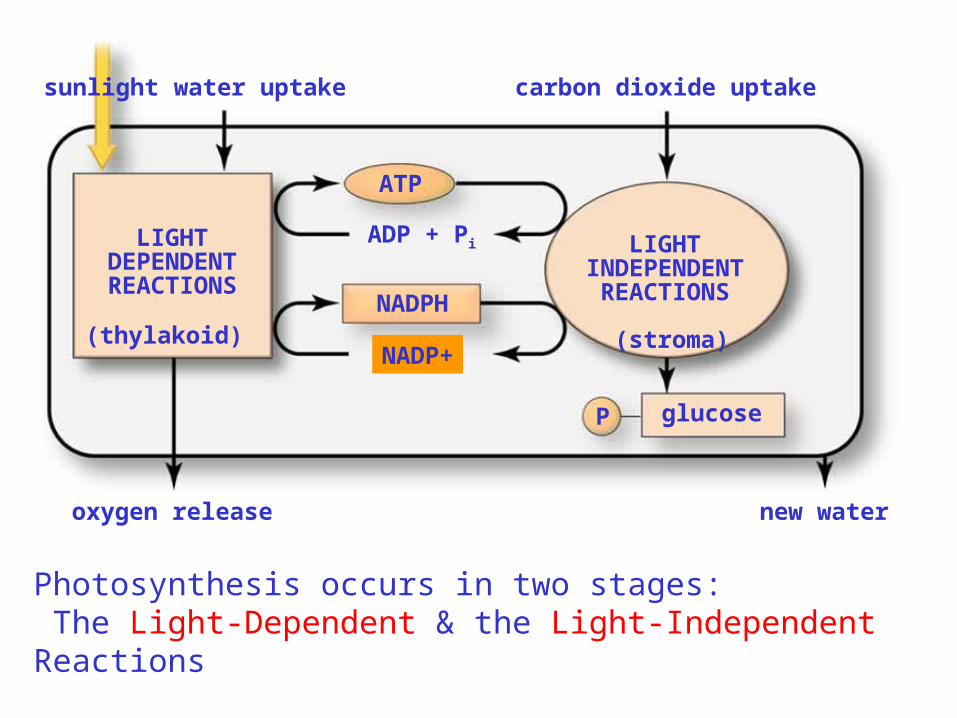
sunlight water uptake carbon dioxide uptake
ATP
ADP + Pi
NADPH
NAD+
glucoseP
oxygen release
LIGHT INDEPENDENT
REACTIONS
LIGHT DEPENDENT REACTIONS
new water
Photosynthesis occurs in two stages: The Light-Dependent & the Light-Independent Reactions
(thylakoid) (stroma)NADP+
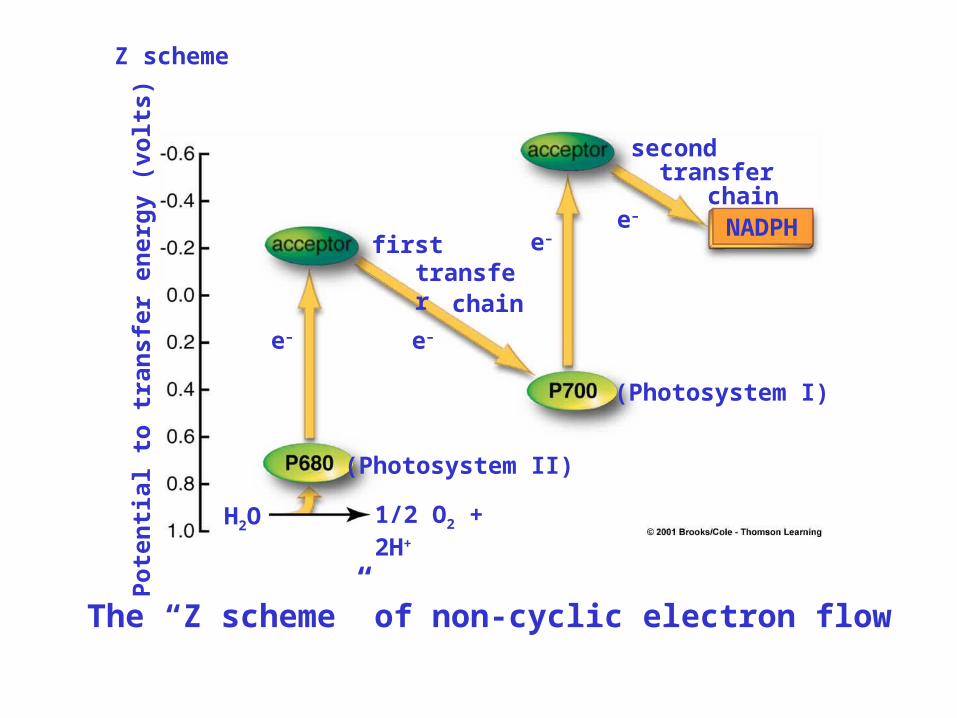
Z scheme
Po
ten
tial
to
tra
nsf
er e
ner
gy
(vo
lts)
H2O 1/2 O2 + 2H+
(Photosystem II)
(Photosystem I)
e– e–
e–e–
secondtransfer
chainNADPH
firsttransfer
chain
The “Z scheme” of non-cyclic electron flow
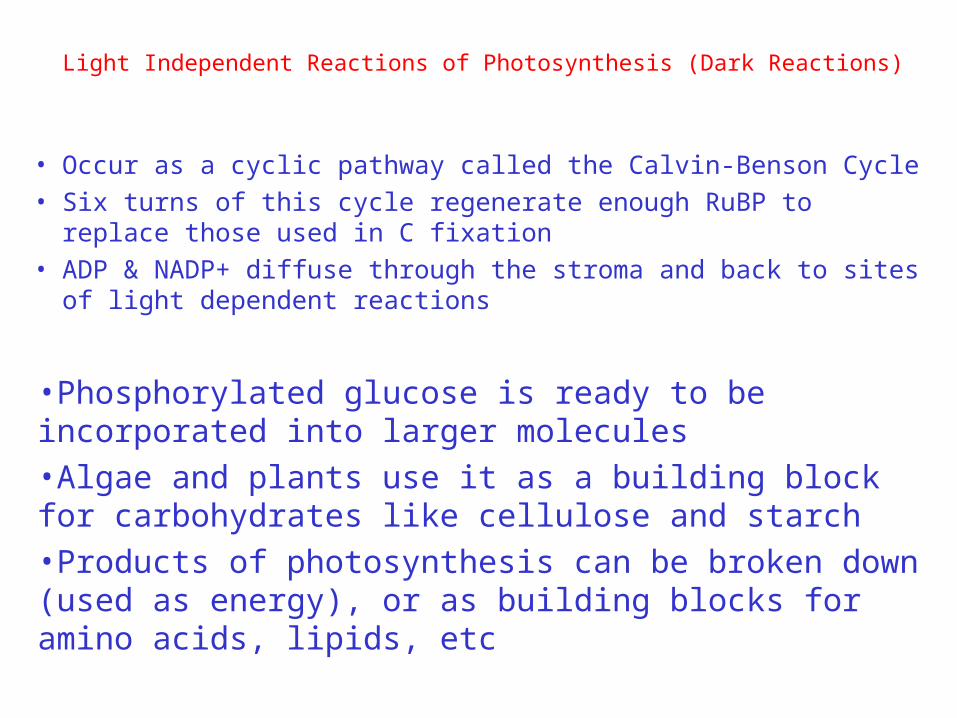
Light Independent Reactions of Photosynthesis (Dark Reactions)
• Occur as a cyclic pathway called the Calvin-Benson Cycle• Six turns of this cycle regenerate enough RuBP to replace those used
in C fixation• ADP & NADP+ diffuse through the stroma and back to sites of light
dependent reactions
•Phosphorylated glucose is ready to be incorporated into larger molecules•Algae and plants use it as a building block for carbohydrates like cellulose and starch•Products of photosynthesis can be broken down (used as energy), or as building blocks for amino acids, lipids, etc
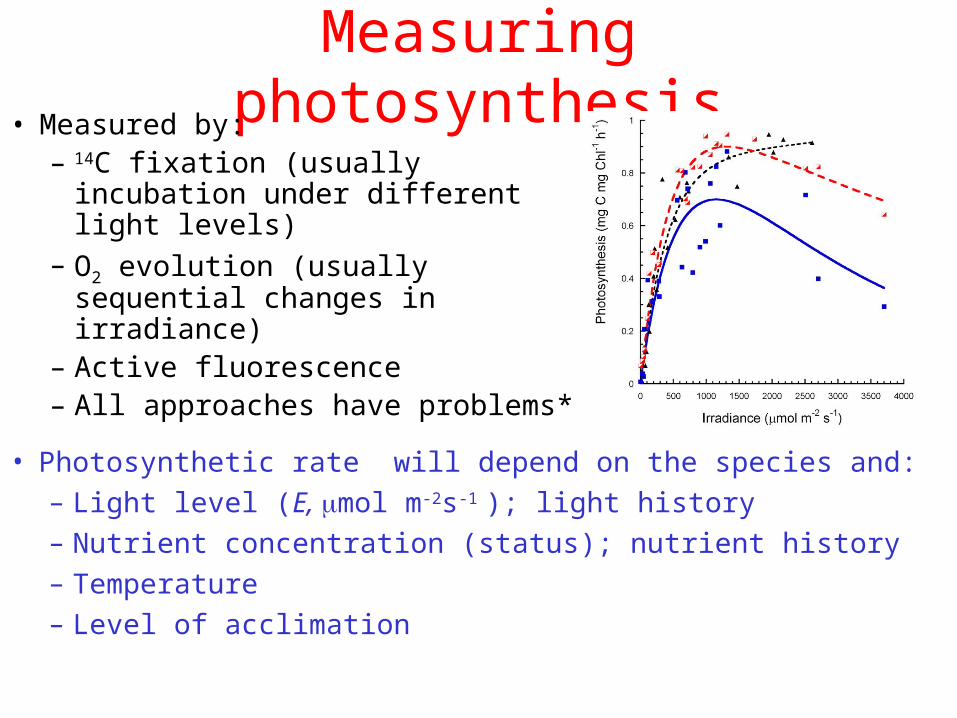
Measuring photosynthesis• Measured by:
– 14C fixation (usually incubation under different light levels)
– O2 evolution (usually sequential changes in irradiance)
– Active fluorescence – All approaches have problems*
• Photosynthetic rate will depend on the species and:
– Light level (E, mol m-2s-1 ); light history
– Nutrient concentration (status); nutrient history
– Temperature
– Level of acclimation
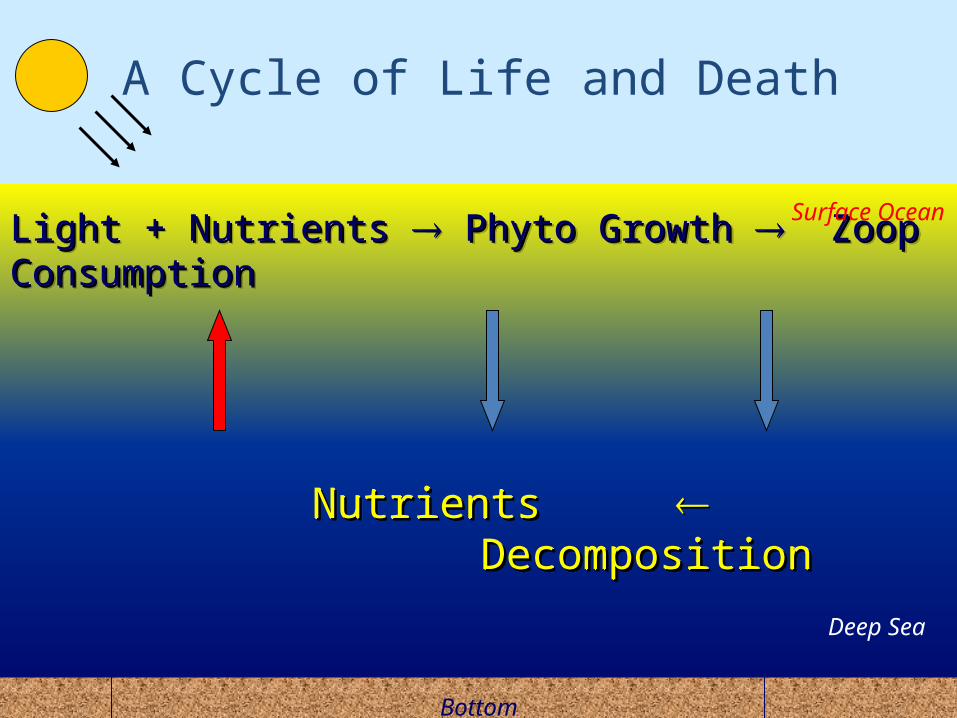
A Cycle of Life and Death
NutrientsNutrients Decomposition Decomposition NutrientsNutrients Decomposition Decomposition
Light + Nutrients Light + Nutrients Phyto Growth Phyto Growth Zoop Consumption Zoop ConsumptionLight + Nutrients Light + Nutrients Phyto Growth Phyto Growth Zoop Consumption Zoop Consumption
Bottom
Deep Sea
Surface Ocean
0.0
0.2
0.4
0.6
0.8
1.0
1.2
1.4
0 100 200 300 400 500
Light-Limited Growth
Gro
wth
rat
e (d
-1)
Irradiance (µmol m-2 s-1)
0.0
0.2
0.4
0.6
0.8
1.0
0 2 4 6 8 10
Gro
wth
Rat
e (d
-1 )
Scaled Nutrient Concentration
Nutrient-Limited Growth
The growth rate of phytoplankton depends on light, nutrients and temperature
(d
-1)
(d
-1)
14
What you REALLY need to know about What you REALLY need to know about light in the ocean:light in the ocean:
1. How much is there? (intensity)
2. What color is it? (spectral quality)
15
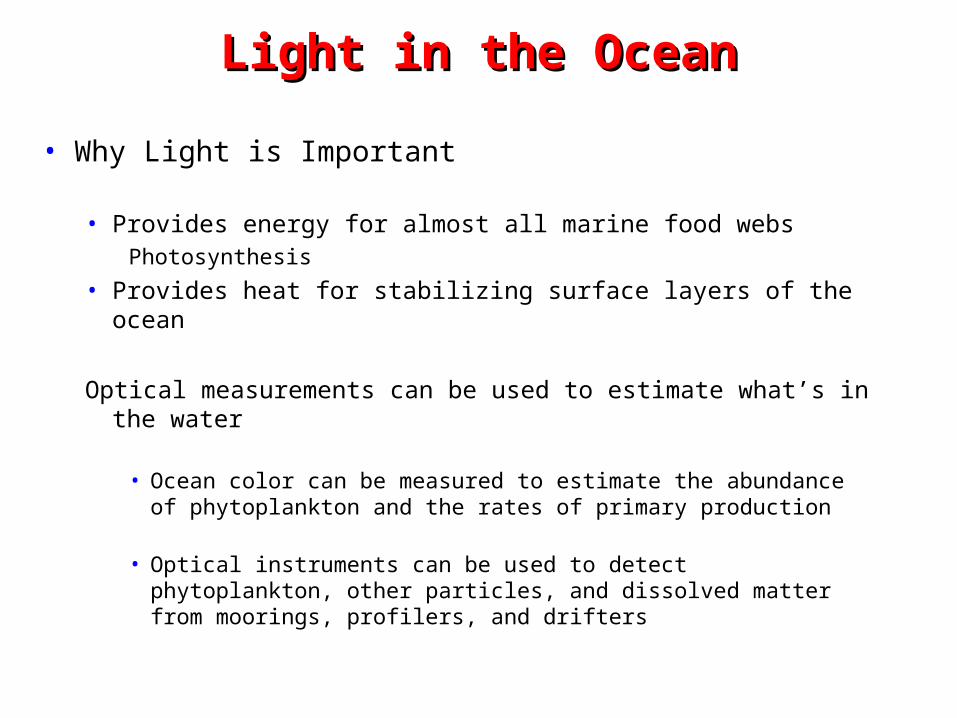
Light in the OceanLight in the Ocean
• Why Light is Important
• Provides energy for almost all marine food websPhotosynthesis
• Provides heat for stabilizing surface layers of the ocean
Optical measurements can be used to estimate what’s in the water
• Ocean color can be measured to estimate the abundance of phytoplankton and the rates of primary production
• Optical instruments can be used to detect phytoplankton, other particles, and dissolved matter from moorings, profilers, and drifters
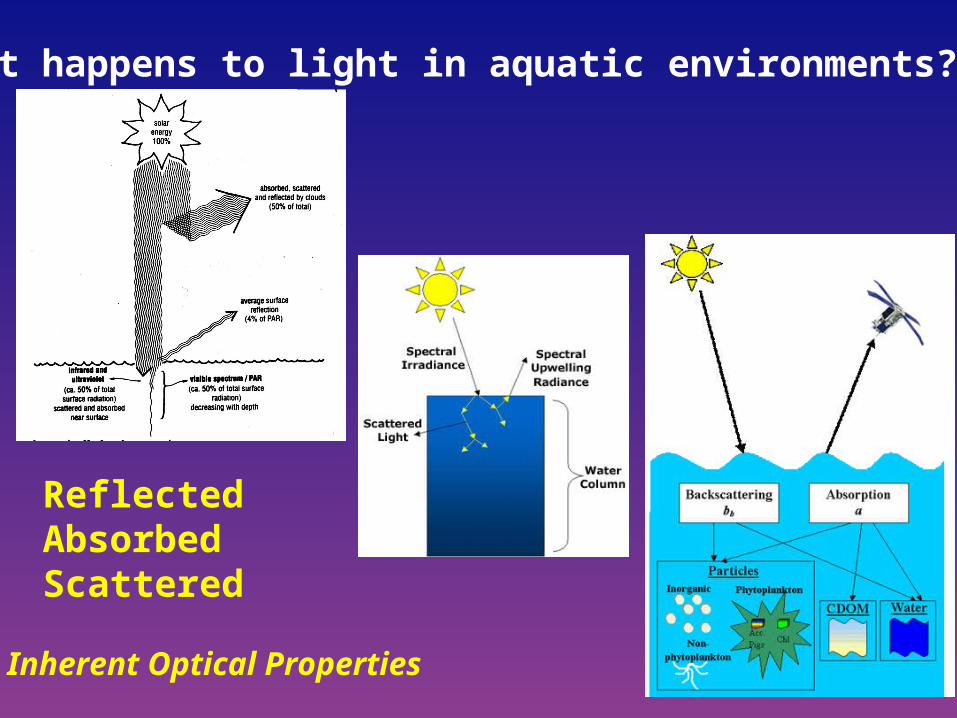
What happens to light in aquatic environments?
ReflectedAbsorbedScattered
Inherent Optical Properties
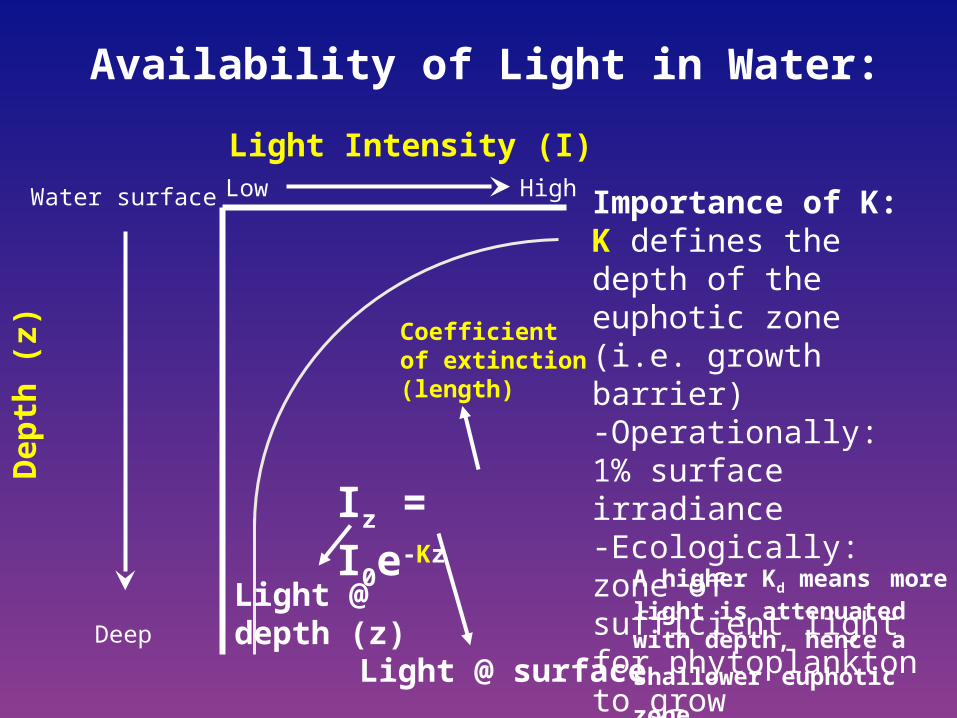
Availability of Light in Water:
Light Intensity (I)
Light @ depth (z)
Light @ surface
Coefficient of extinction (length)
Iz = I0e-Kz
Water surface
Deep
HighLow
Dep
th (
z)
Importance of K:K defines the depth of the euphotic zone (i.e. growth barrier) -Operationally: 1% surface irradiance-Ecologically: zone of sufficient light for phytoplankton to grow
A higher Kd means more light is attenuated with
depth, hence a shallower euphotic zone.
18
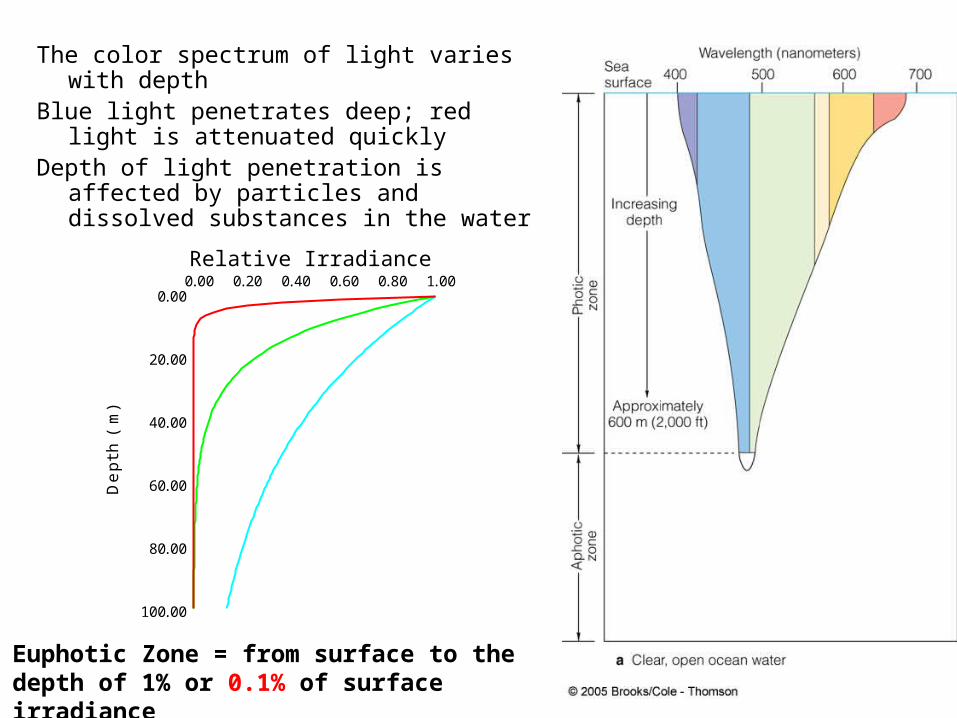
The color spectrum of light varies with depthBlue light penetrates deep; red light is
attenuated quicklyDepth of light penetration is affected by
particles and dissolved substances in the water
0.00 0.20 0.40 0.60 0.80 1.000.00
20.00
40.00
60.00
80.00
100.00
De
pth
(m
)
Relative Irradiance
Euphotic Zone = from surface to the depth of 1% or 0.1% of surface irradiance
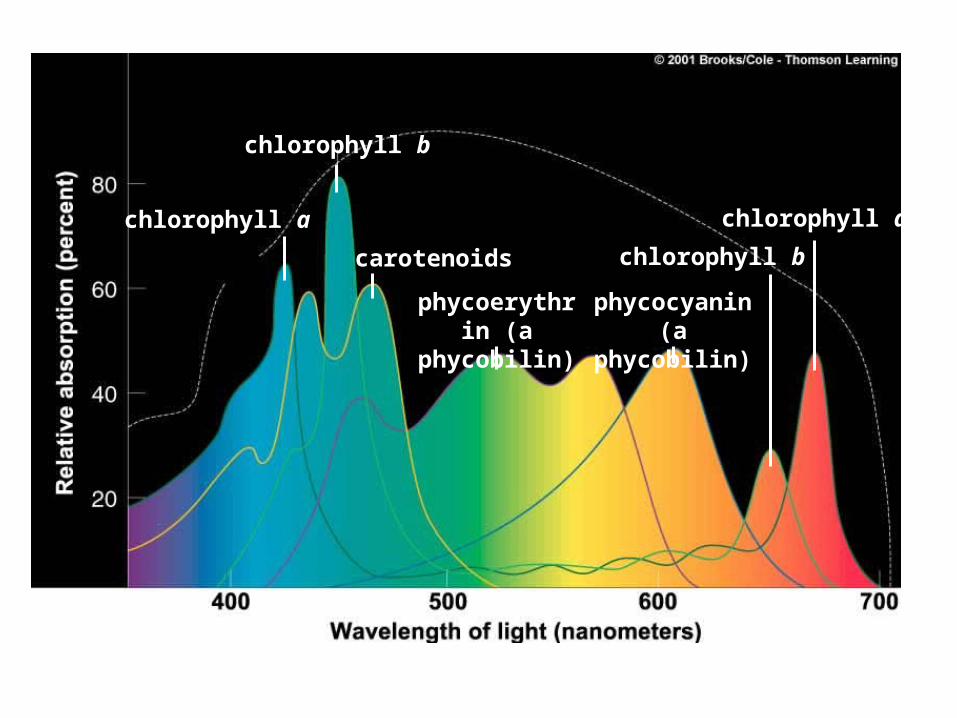
chlorophyll b
chlorophyll a
carotenoids
phycoerythrin (a phycobilin)
chlorophyll a
chlorophyll b
phycocyanin (a phycobilin)
Introduction to Biological Oceanography (3): John Cullen
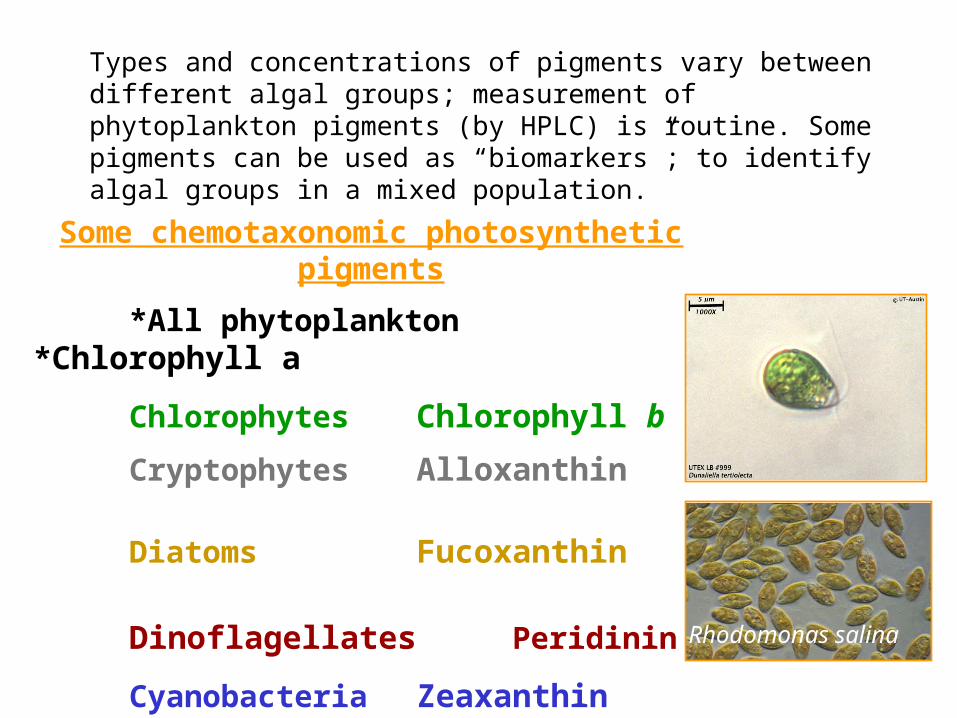
Some chemotaxonomic photosynthetic pigments
*All phytoplankton *Chlorophyll a
Chlorophytes Chlorophyll b
Cryptophytes Alloxanthin
Diatoms Fucoxanthin
Dinoflagellates Peridinin
Cyanobacteria Zeaxanthin
Types and concentrations of pigments vary between different algal groups; measurement of phytoplankton pigments (by HPLC) is routine. Some pigments can be used as “biomarkers”; to identify algal groups in a mixed population.
Rhodomonas salina
Photoacclimation
• Short term (minutes – hours) response to changes in light quantity or quality
• Light intensity: response to light decreases or increases
• Within a species, acclimation responses may include 1) increases in the kinds or amounts of photosynthetic (or photoprotective) pigments, 2) changes in the number and/or size of PSUs
6
70 mC
0
1
2
3
4
5
6
0 500 1000 1500 2000
Surface
25m
100 m
75 m
B
PB (
g C
g C
hl-1
h-1)
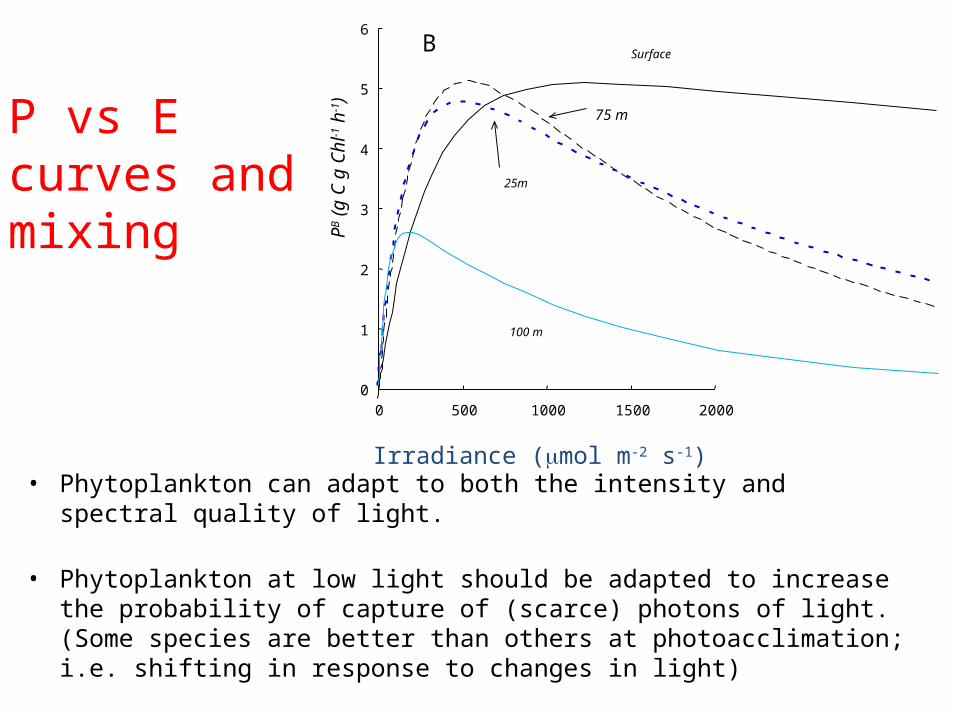
Irradiance (mol m-2 s-1)• Phytoplankton can adapt to both the intensity and spectral quality of
light.
• Phytoplankton at low light should be adapted to increase the probability of capture of (scarce) photons of light. (Some species are better than others at photoacclimation; i.e. shifting in response to changes in light)
P vs E curves and mixing
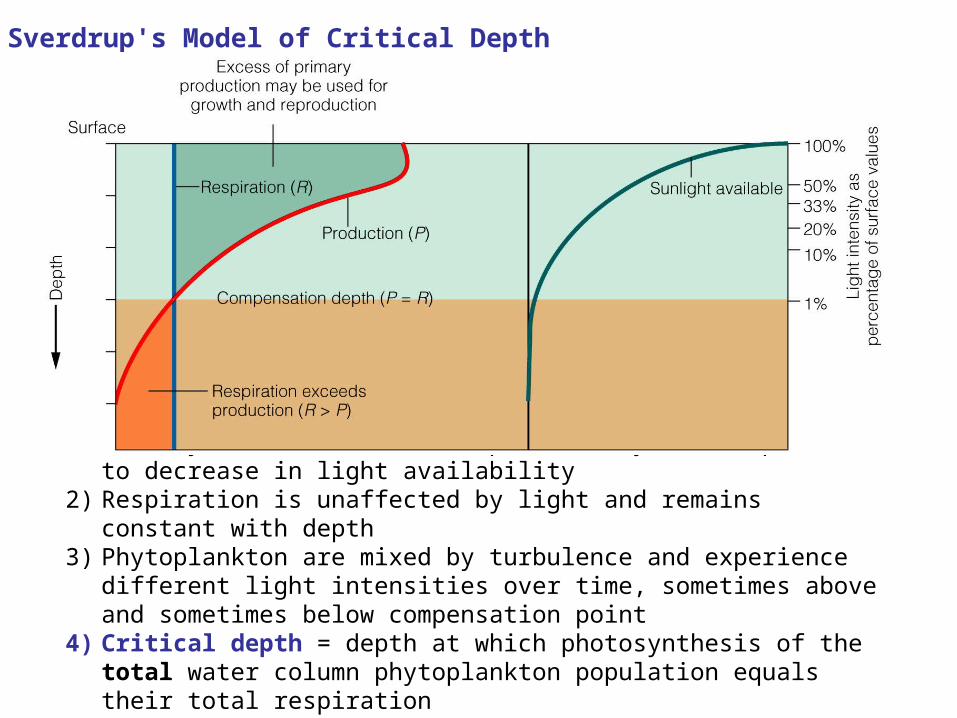
Sverdrup's Model of Critical Depth
1) Photosynthesis decreases exponentially with depth due to decrease in light availability
2) Respiration is unaffected by light and remains constant with depth 3) Phytoplankton are mixed by turbulence and experience different light
intensities over time, sometimes above and sometimes below compensation point
4) Critical depth = depth at which photosynthesis of the total water column phytoplankton population equals their total respiration
(no net community production)
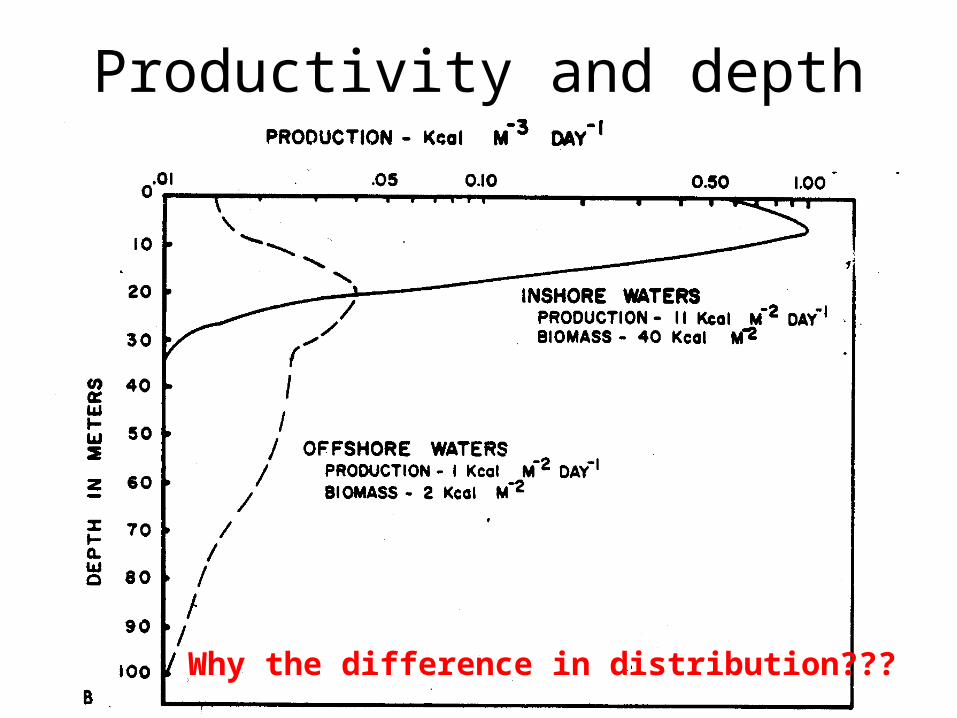
Productivity and depth
Why the difference in distribution???
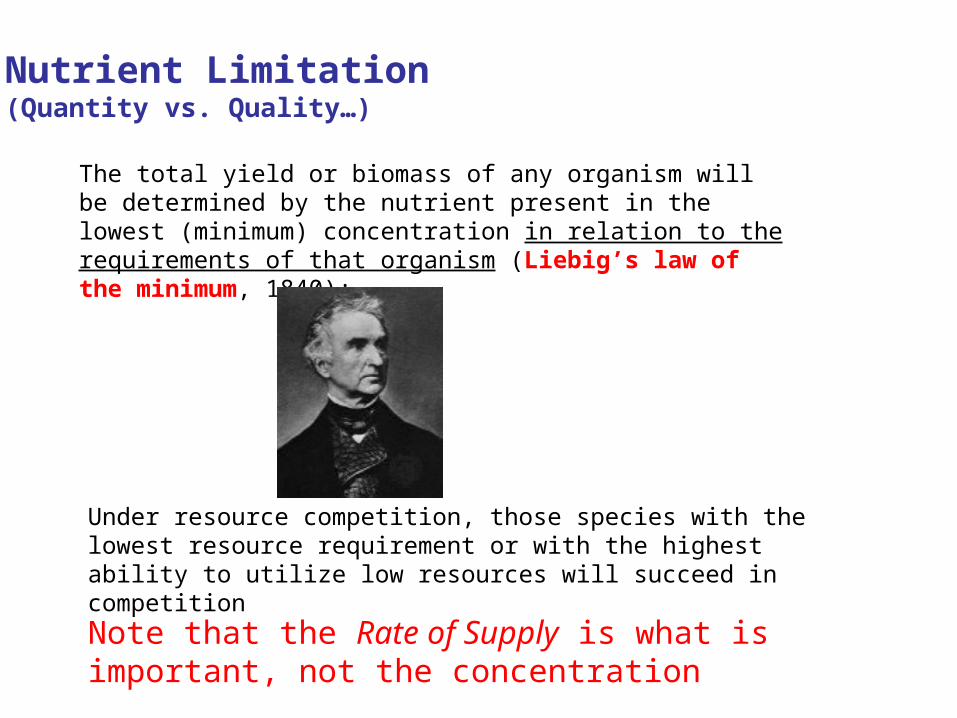
Nutrient Limitation (Quantity vs. Quality…)
The total yield or biomass of any organism will be determined by the nutrient present in the lowest (minimum) concentration in relation to the requirements of that organism (Liebig’s law of the minimum, 1840);
Under resource competition, those species with the lowest resource requirement or with the highest ability to utilize low resources will succeed in competition
Note that the Rate of Supply is what is important, not the concentration
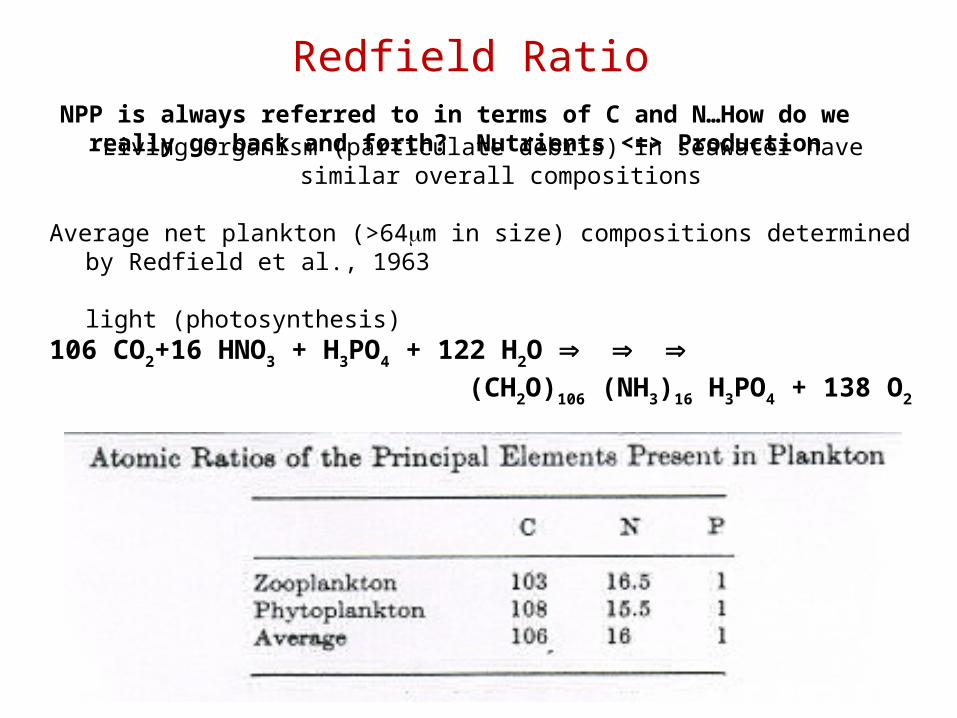
Living organism (particulate debris) in seawater have similar overall compositions
Average net plankton (>64m in size) compositions determined by Redfield et al., 1963
light (photosynthesis) 106 CO2+16 HNO3 + H3PO4 + 122 H2O
(CH2O)106 (NH3)16 H3PO4 + 138 O2
NPP is always referred to in terms of C and N…How do we really go back and forth? Nutrients <=> Production
Redfield Ratio
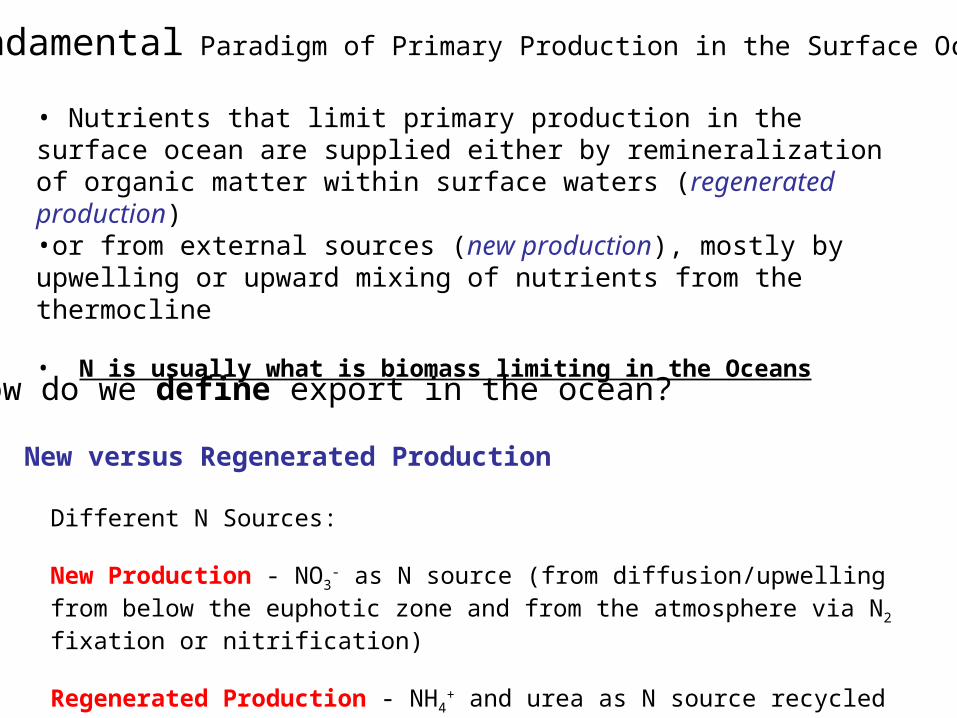
New versus Regenerated Production
Different N Sources:
New Production - NO3- as N source (from diffusion/upwelling from below the
euphotic zone and from the atmosphere via N2 fixation or nitrification)
Regenerated Production - NH4+ and urea as N source recycled in the EZ
How do we define export in the ocean?
• Nutrients that limit primary production in the surface ocean are supplied either by remineralization of organic matter within surface waters (regenerated production) •or from external sources (new production), mostly by upwelling or upward mixing of nutrients from the thermocline
• N is usually what is biomass limiting in the Oceans
Fundamental Paradigm of Primary Production in the Surface Ocean
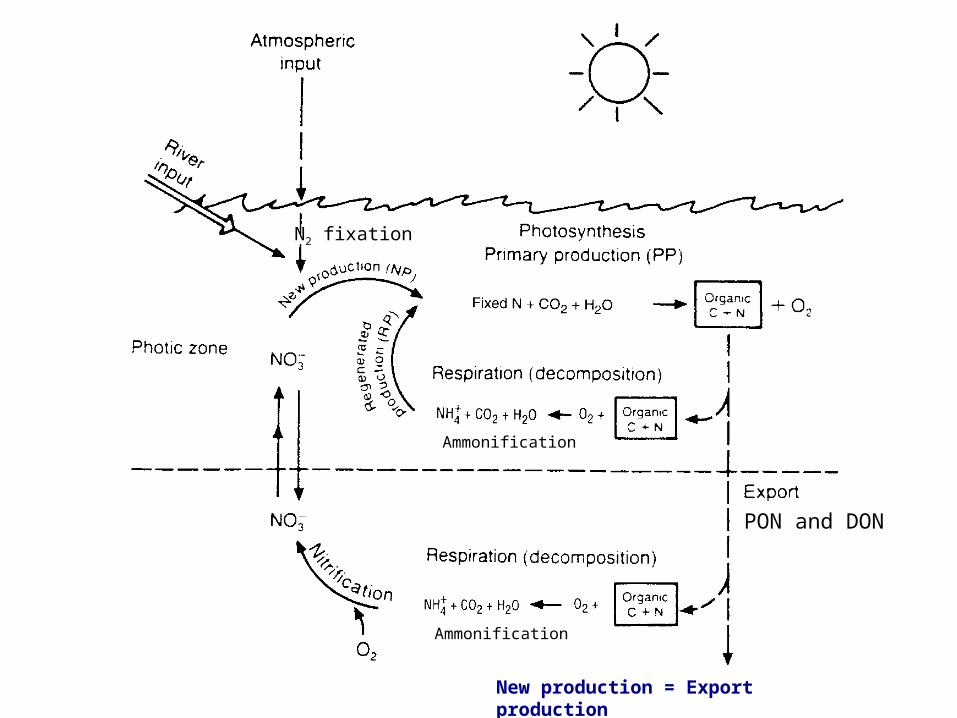
N2 fixation
New production = Export production
PON and DON
Ammonification
Ammonification
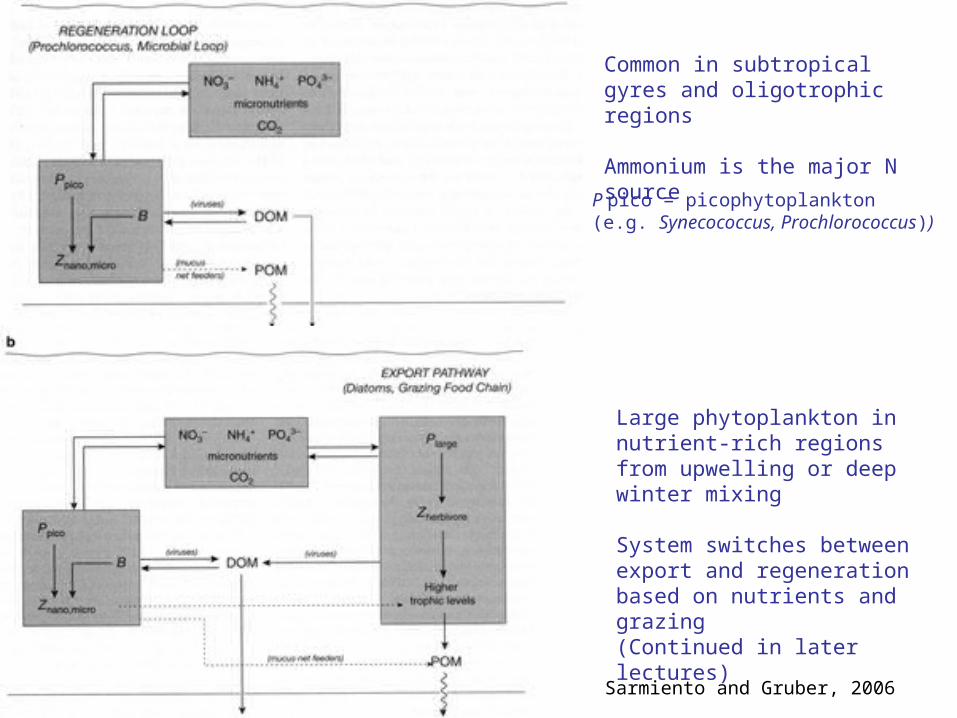
Sarmiento and Gruber, 2006
Common in subtropical gyres and oligotrophic regions
Ammonium is the major N source
Large phytoplankton in nutrient-rich regions from upwelling or deep winter mixing
System switches between export and regeneration based on nutrients and grazing(Continued in later lectures)
P pico = picophytoplankton (e.g. Synecococcus, Prochlorococcus))
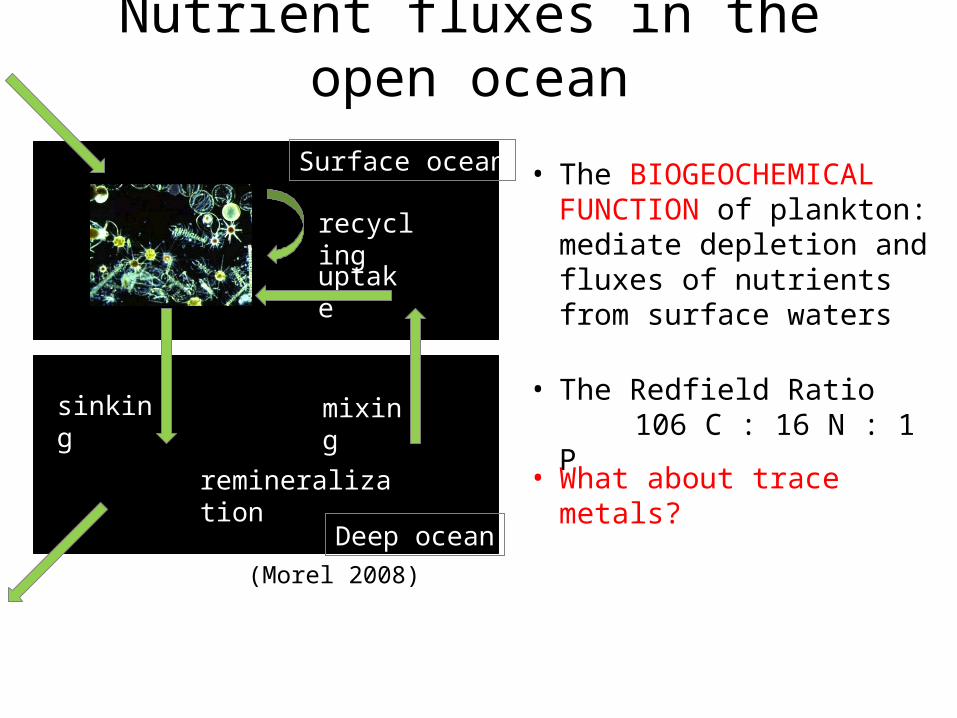
Nutrient fluxes in the open ocean
Biology uptake
sinking
recycling
remineralization
mixing
(Morel 2008)
Surface ocean
Deep ocean
• The BIOGEOCHEMICAL FUNCTION of plankton: mediate depletion and fluxes of nutrients from surface waters
• The Redfield Ratio 106 C : 16 N : 1 P
• What about trace metals?
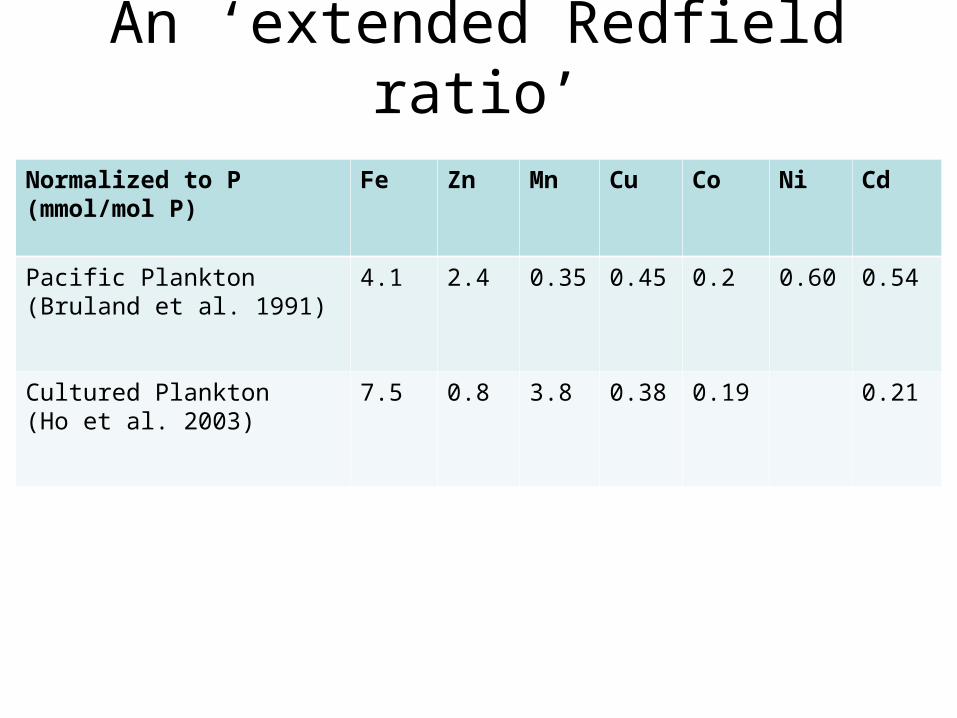
An ‘extended Redfield ratio’
Normalized to P(mmol/mol P)
Fe Zn Mn Cu Co Ni Cd
Pacific Plankton(Bruland et al. 1991)
4.1 2.4 0.35 0.45 0.2 0.60 0.54
Cultured Plankton(Ho et al. 2003)
7.5 0.8 3.8 0.38 0.19 0.21
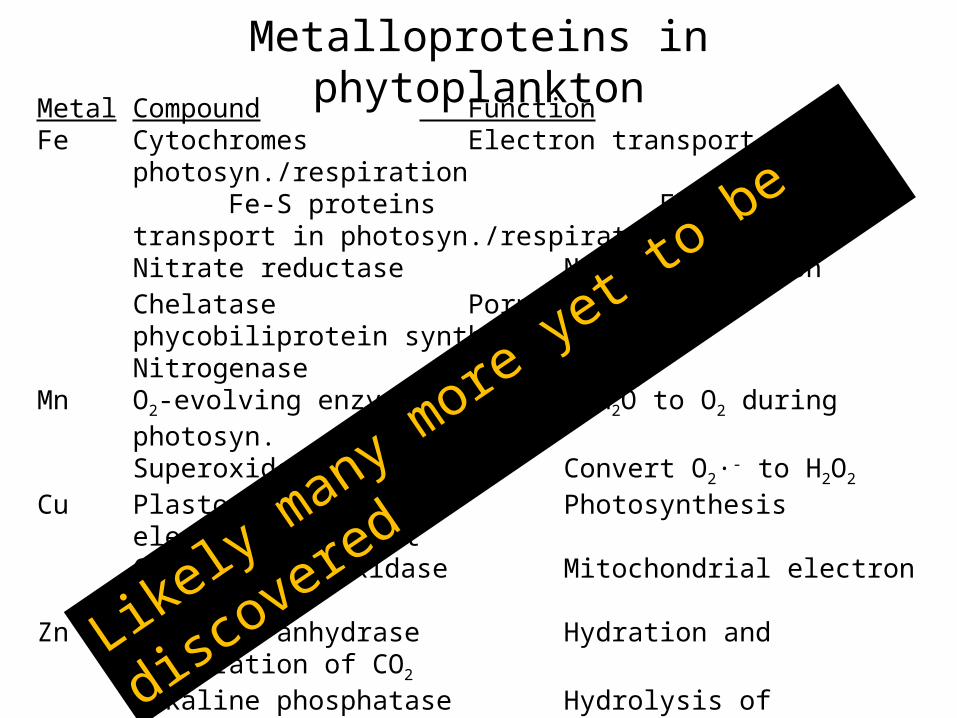
Metal Compound FunctionFe Cytochromes Electron transport in photosyn./respiration
Fe-S proteins Electron transport in photosyn./respirationNitrate reductase NO3
- assimilationChelatase Porphyrin and phycobiliprotein synthesisNitrogenase N fixation
Mn O2-evolving enzyme Oxidize H2O to O2 during photosyn.Superoxide dismutase Convert O2·- to H2O2
Cu Plastocyanin Photosynthesis electron transportCytochrome c oxidase Mitochondrial electron transport
Zn Carbonic anhydrase Hydration and dehydration of CO2
Alkaline phosphatase Hydrolysis of phosphate estersDNA/RNA polymerase Nucleic acid replication/transcription
Co Vitamin B12 Carbon and H transfer reactionsNi Urease Hydrolysis of urea
Superoxide dismutase Convert O2·- to H2O2
Hydrogenase Oxidation of H2
Mo Nitrogenase Nitrogen fixationNitrate reductase Nitrate reduction to ammonia
Metalloproteins in phytoplankton
Likely
many more ye
t to be disc
overed
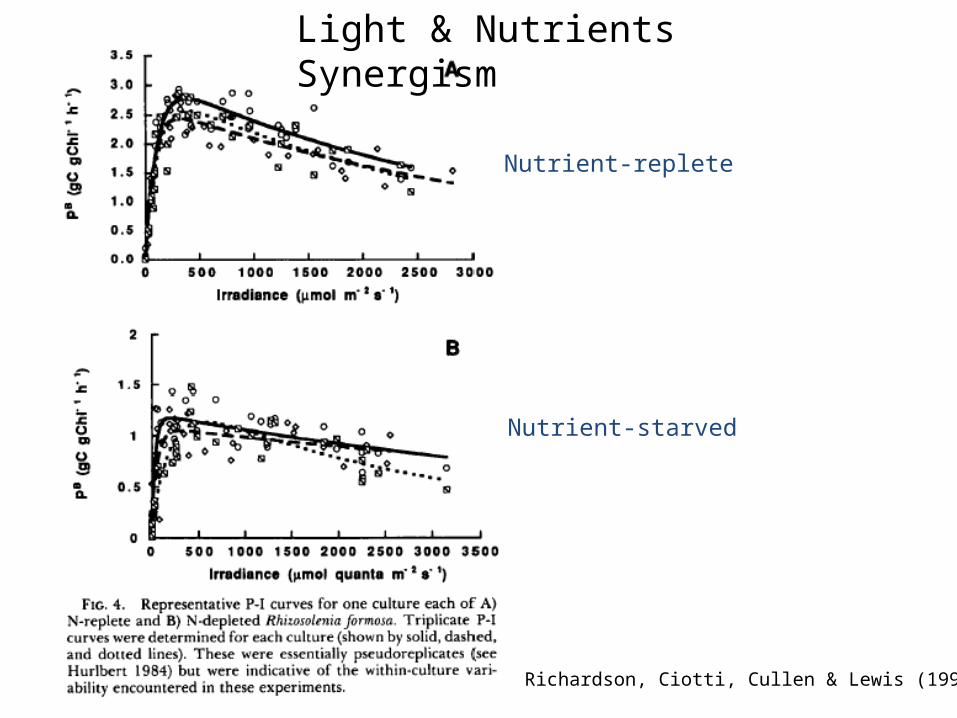
Richardson, Ciotti, Cullen & Lewis (1996)
Nutrient-replete
Nutrient-starved
Light & Nutrients Synergism
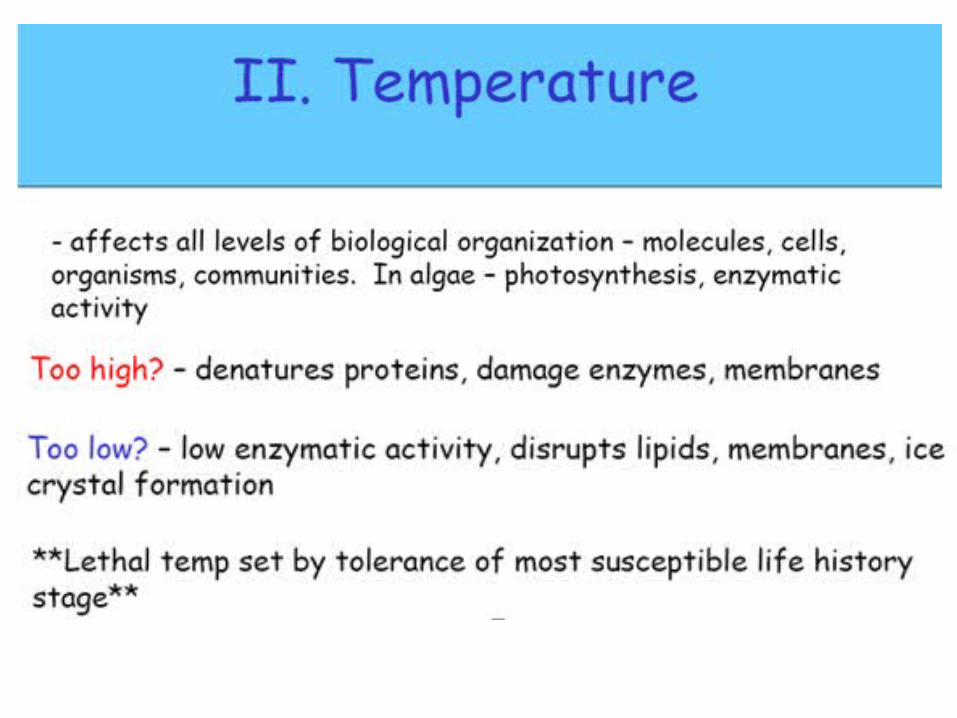
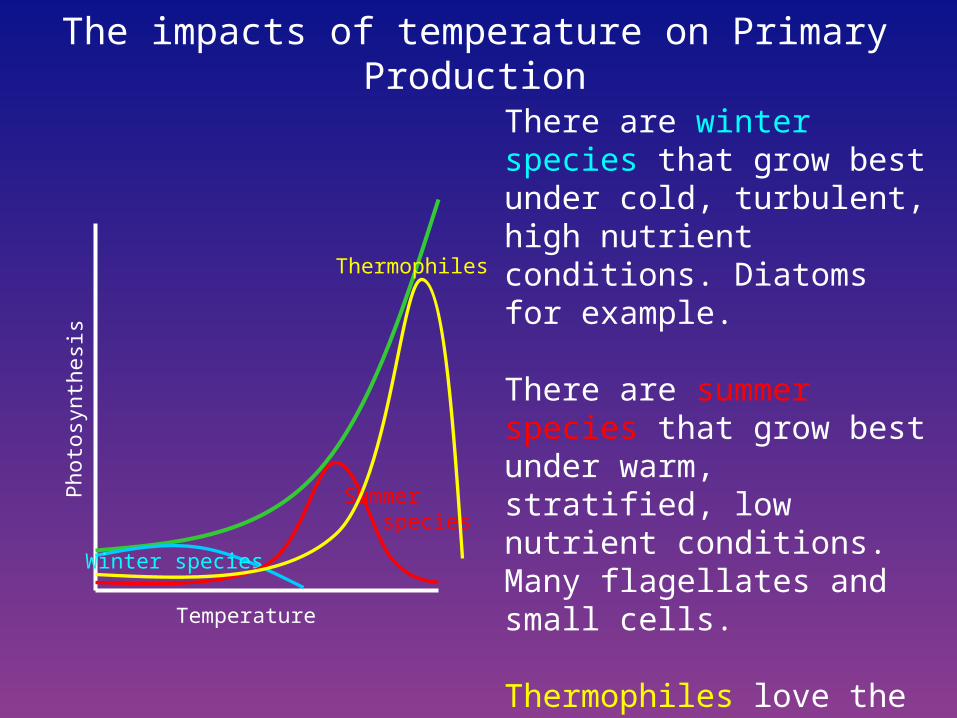
The impacts of temperature on Primary Production
Temperature
Pho
tosy
nthe
sis
Winter species
There are winter species that grow best under cold, turbulent, high nutrient conditions. Diatoms for example.
There are summer species that grow best under warm, stratified, low nutrient conditions. Many flagellates and small cells.
Thermophiles love the extreme temperatures. Mostly species that have been isolated from tide pools and other extreme environments.
Summer species
Thermophiles
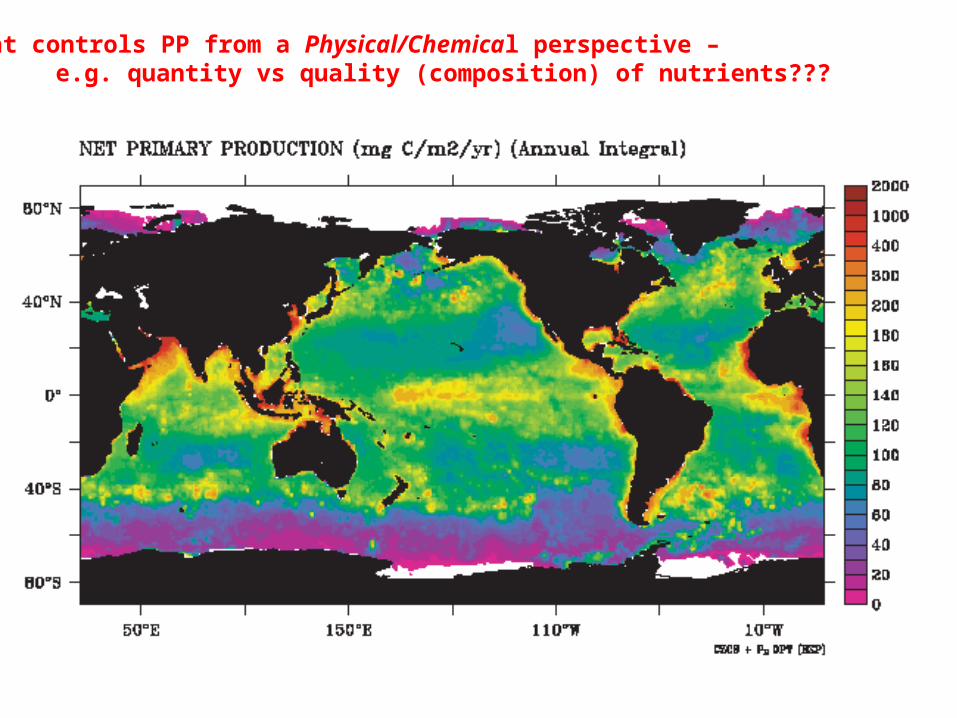
What controls PP from a Physical/Chemical perspective – e.g. quantity vs quality (composition) of nutrients???
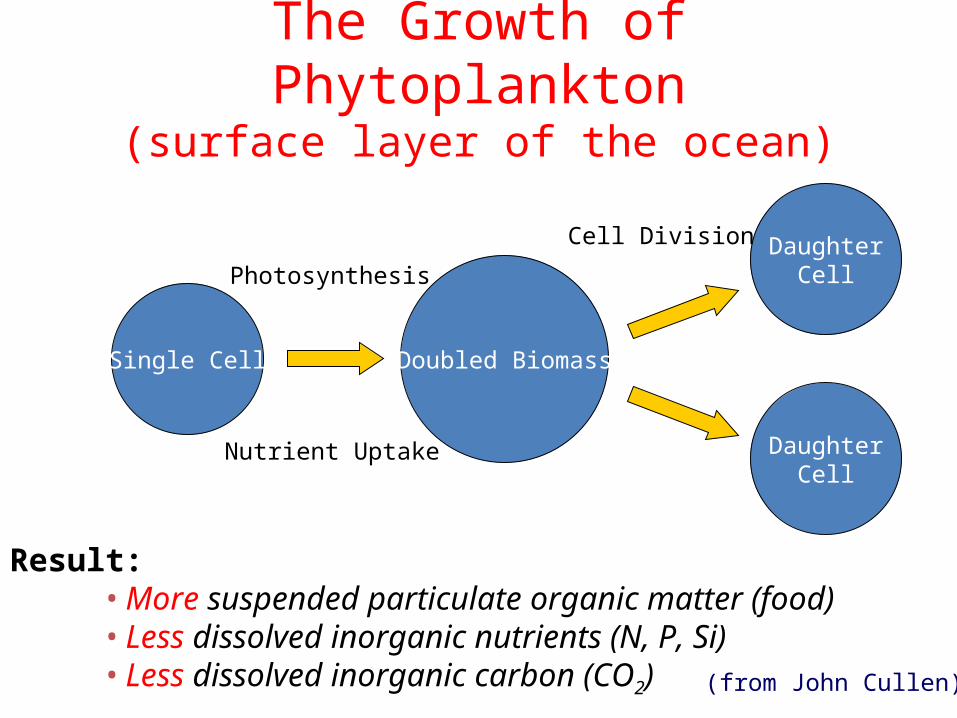
The Growth of Phytoplankton(surface layer of the ocean)
Single Cell Doubled Biomass
DaughterCell
DaughterCellPhotosynthesis
Nutrient Uptake
Cell Division
Result: • More suspended particulate organic matter (food)
• Less dissolved inorganic nutrients (N, P, Si)• Less dissolved inorganic carbon (CO2) (from John Cullen)
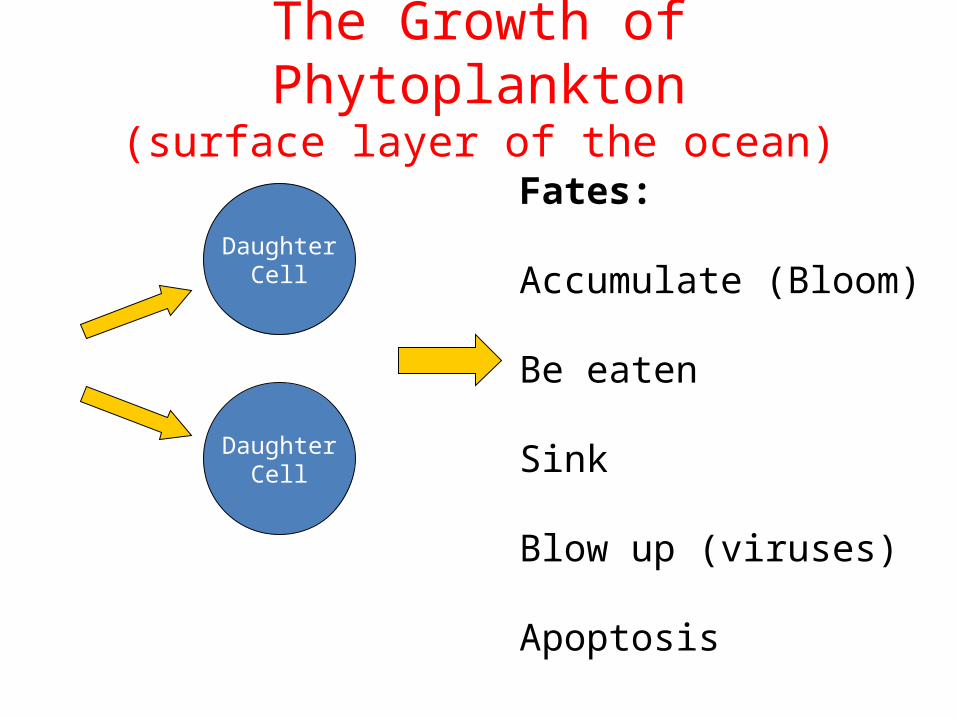
The Growth of Phytoplankton(surface layer of the ocean)
DaughterCell
DaughterCell
Fates:
Accumulate (Bloom)
Be eaten
Sink
Blow up (viruses)
Apoptosis
0
200
400
600
800
1000
0 2 4 6 8 10
Re
lativ
e N
um
be
rs (
bio
ma
ss)
Time (days)
Log Scale
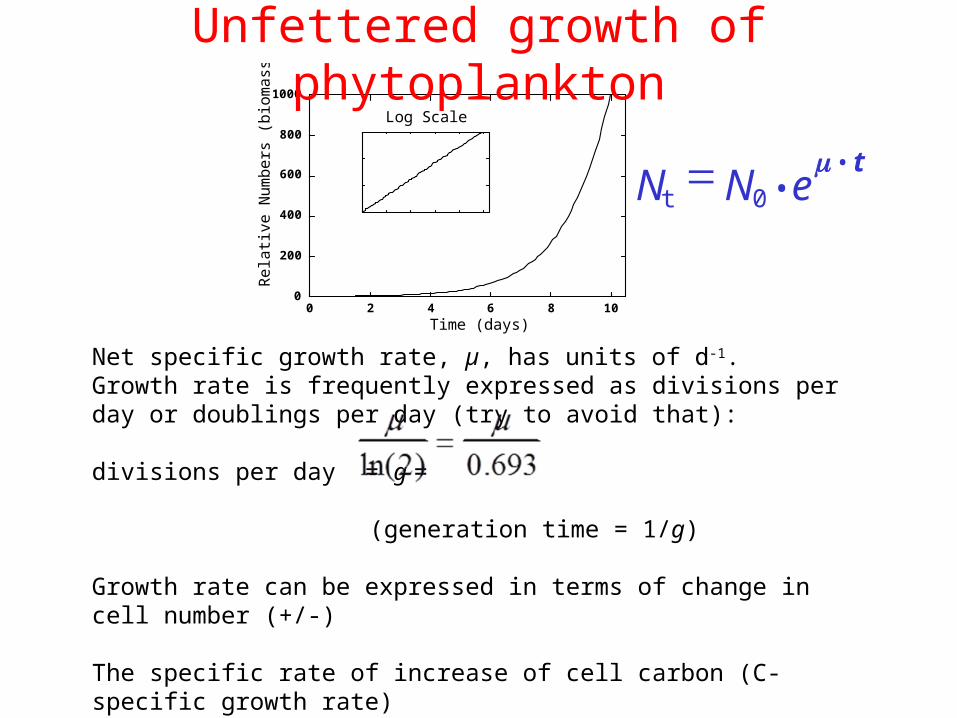
Nt N0 • e
• t
Net specific growth rate, µ, has units of d-1. Growth rate is frequently expressed as divisions per day or doublings per day (try to avoid that):
divisions per day = g =
(generation time = 1/g)
Growth rate can be expressed in terms of change in cell number (+/-) The specific rate of increase of cell carbon (C-specific growth rate)
The specific rate of increase of chlorophyll a (chl-specific growth rate)
Unfettered growth of phytoplankton
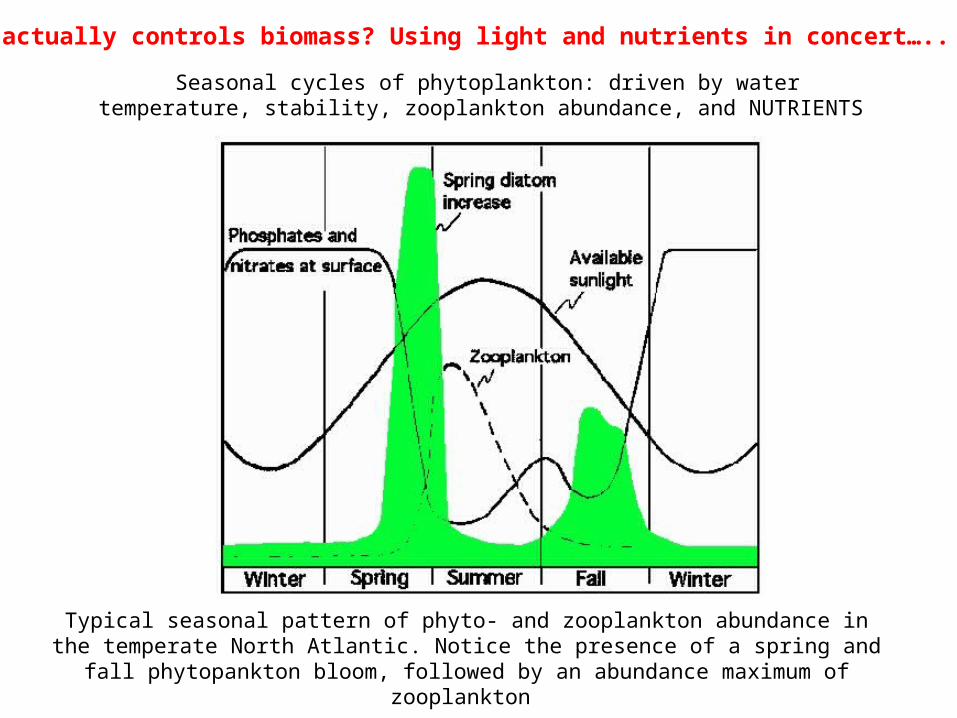
Seasonal cycles of phytoplankton: driven by water temperature, stability, zooplankton abundance, and NUTRIENTS
Typical seasonal pattern of phyto- and zooplankton abundance in the temperate North Atlantic. Notice the presence of a spring and fall phytopankton bloom, followed by an
abundance maximum of zooplankton
What actually controls biomass? Using light and nutrients in concert…..
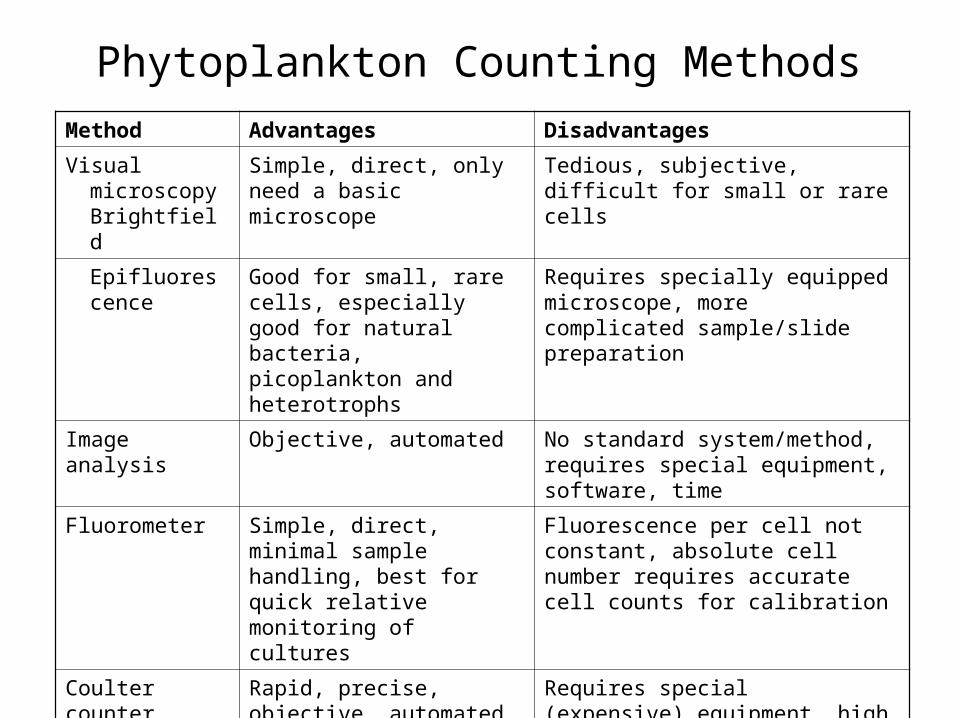
Phytoplankton Counting MethodsMethod Advantages Disadvantages
Visual microscopy Brightfield
Simple, direct, only need a basic microscope
Tedious, subjective, difficult for small or rare cells
Epifluorescence Good for small, rare cells, especially good for natural bacteria, picoplankton and heterotrophs
Requires specially equipped microscope, more complicated sample/slide preparation
Image analysis Objective, automated No standard system/method, requires special equipment, software, time
Fluorometer Simple, direct, minimal sample handling, best for quick relative monitoring of cultures
Fluorescence per cell not constant, absolute cell number requires accurate cell counts for calibration
Coulter counter Rapid, precise, objective, automated, produces size spectrum, good for cultures
Requires special (expensive) equipment, high maintenance
(clogging), counts all particles
Flow cytometry Rapid, precise, objective, automated, counts cells only
Expensive instrument, must accurately measure volume analyzed