Embed Size (px)
DESCRIPTION
Principles of Economics DBM1313 Chapter 3: Theory of Demand & Elasticity of Demand. Demand can be defined as the amount of a particular good or service that a consumer or group of consumers will want to purchase at a given price during a specific time, ceteris - PowerPoint PPT Presentation
Citation preview
ALL RIGHTS RESERVEDNo part of this document may be reproduced without written approval from Limkokwing University of Creative Technology
1-1
Principles of Economics DBM1313
Chapter 3:
Theory of Demand & Elasticity of Demand
ALL RIGHTS RESERVEDNo part of this document may be reproduced without written approval from Limkokwing University of Creative Technology
1-2
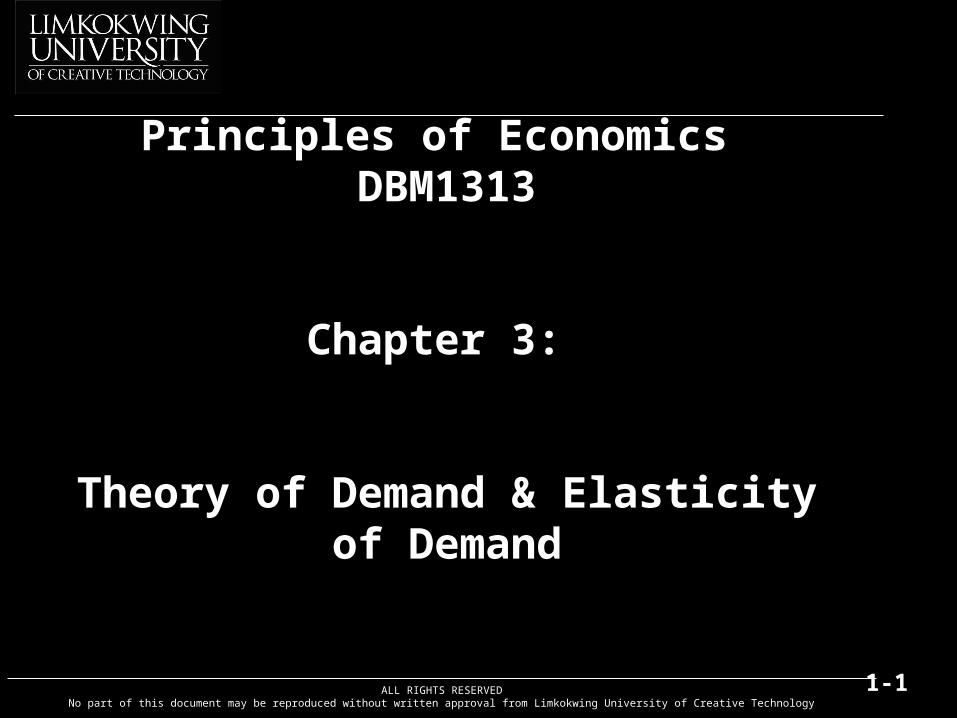
Demand can be defined as the amount of a particular good or service that a consumer or group of consumers will want to purchase at a given price during a specific time, ceteris
paribus (the Latin phrase that means all other things remain constant). It is a consumer's desire and willingness to pay for a good or service.
Demand exists only if the ability of buyers to purchase a given amount of goods or services, over a range of prices, over a given period of time. Think of demand as what you want. For example, market demand is the total of what everybody in the market wants.
DEFINITION
ALL RIGHTS RESERVEDNo part of this document may be reproduced without written approval from Limkokwing University of Creative Technology
1-3
Demand can be expressed as demand schedule or as a demand curve.
Demand curve is a graph showing the relationship between the price of a product and the quantity of the product demanded over a given period of time. The price is measured on the vertical axis; whereas quantity demanded (Qd) is measured on the horizontal axis
The demand curve shows the relationship between the Qd of a product and its price when all
other influences of the consumer buying intention remain the same.
ALL RIGHTS RESERVEDNo part of this document may be reproduced without written approval from Limkokwing University of Creative Technology
1-4
Price
Quantity
Demand
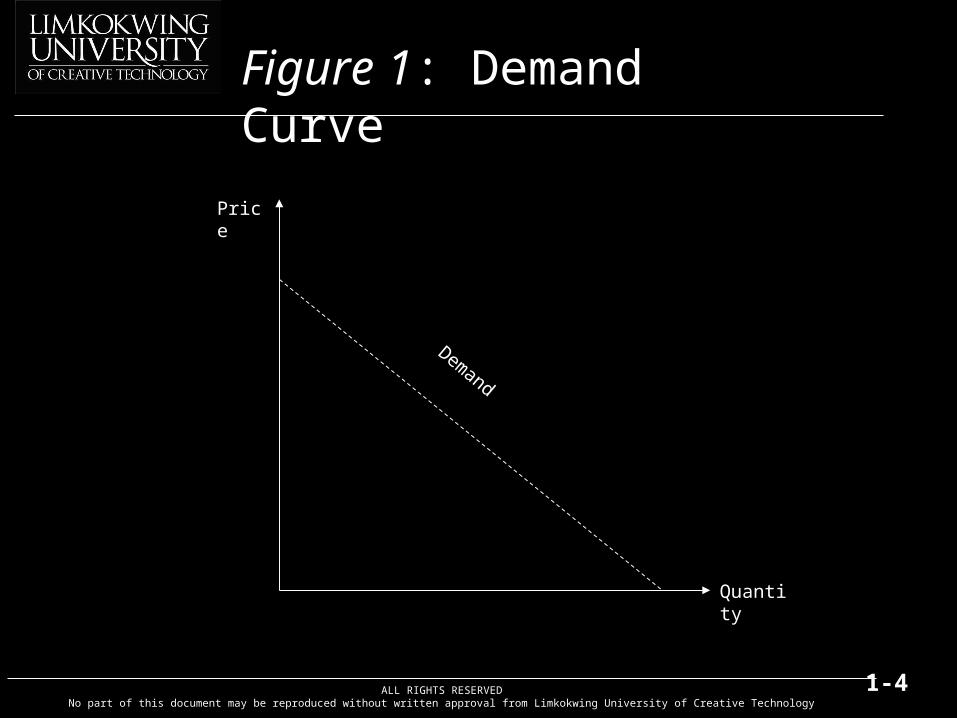
Figure 1: Demand Curve
ALL RIGHTS RESERVEDNo part of this document may be reproduced without written approval from Limkokwing University of Creative Technology
1-5
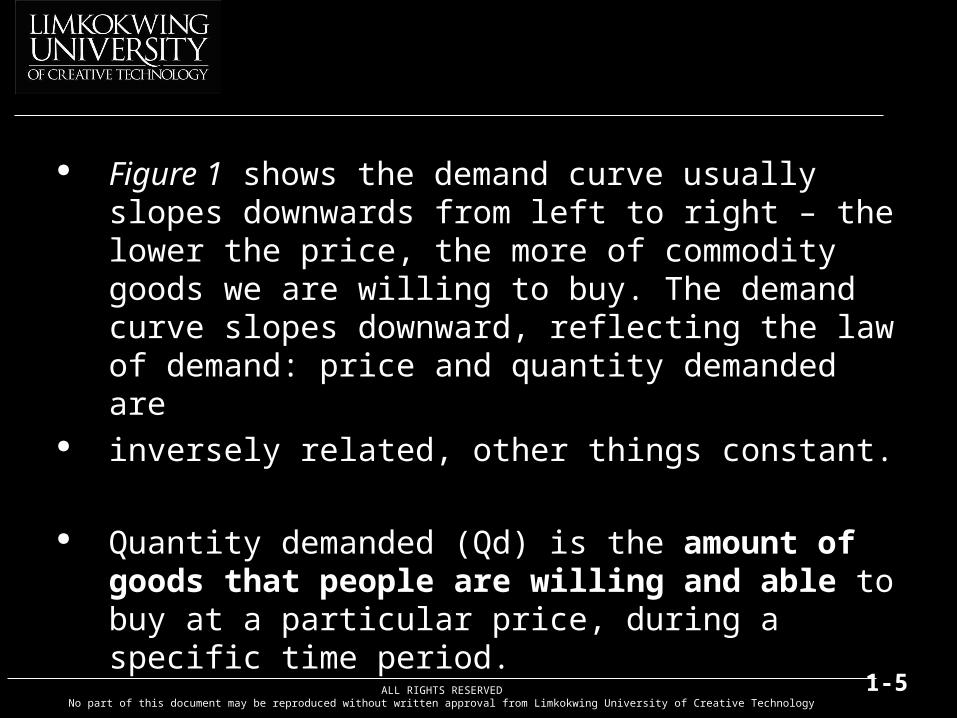
Figure 1 shows the demand curve usually slopes downwards from left to right – the lower the price, the more of commodity goods we are willing to buy. The demand curve slopes downward, reflecting the law of demand: price and quantity demanded are
inversely related, other things constant.
Quantity demanded (Qd) is the amount of goods that people are willing and able to buy at a particular price, during a specific time period.
ALL RIGHTS RESERVEDNo part of this document may be reproduced without written approval from Limkokwing University of Creative Technology
1-6
There are five factors that can influence demand.
1. Price
2. Income – normal goods and inferior goods
3. Prices of related goods – substitutes and complements
4. Tastes
5. Expectations
ALL RIGHTS RESERVEDNo part of this document may be reproduced without written approval from Limkokwing University of Creative Technology
1-7
D
D
Price
Qty
P0
P1
P2
Q2 Q1 Q0
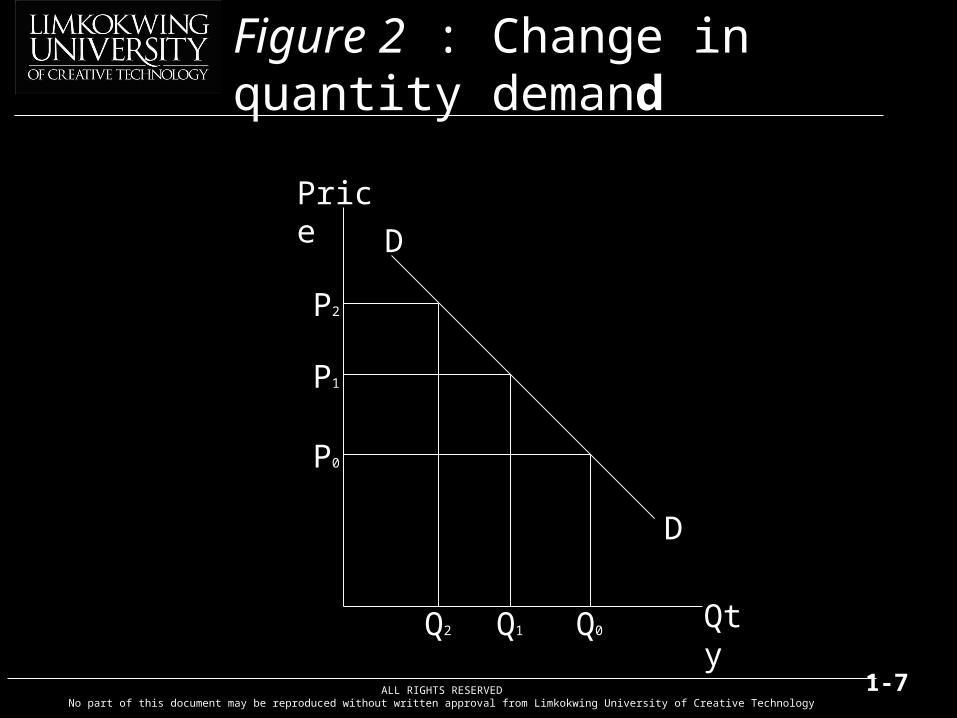
Figure 2 : Change in quantity demand
ALL RIGHTS RESERVEDNo part of this document may be reproduced without written approval from Limkokwing University of Creative Technology
1-8
1. This is caused by a change in the commodity’s own price alone, ceteris paribus.
2. There is only movement along the demand curve and not a shift of it. An upward movement along the curve would mean a fall in the quantity demanded and a downward movement along the curve means a rise in the quantity demanded.
3. Sometimes, the word expansion of demand will be used to show an increase in the amount demanded. A contraction of demand would refer to a fall in the quantity demanded.
Change in quantity demanded (Figure 2)
ALL RIGHTS RESERVEDNo part of this document may be reproduced without written approval from Limkokwing University of Creative Technology
1-9
Increases:1. The price of substitute rises2. The price of complement falls3. Income rises4. Population increases5. The price is expected to rise in future Decrease1. The price of substitute falls2. The price pf complement rises3. Income falls4. Population decreases5. The price is expected to fall in future
Changes in demand
ALL RIGHTS RESERVEDNo part of this document may be reproduced without written approval from Limkokwing University of Creative Technology
1-10
D
D
D1
D1
D2
D2
P1
Q2 Q1 Q0
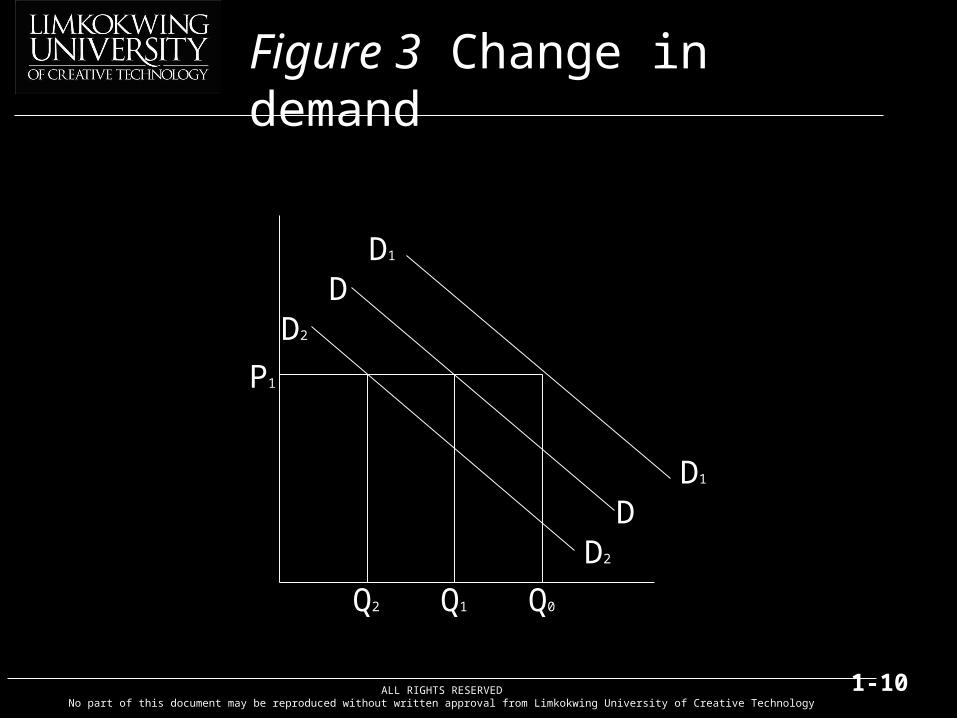
Figure 3 Change in demand
ALL RIGHTS RESERVEDNo part of this document may be reproduced without written approval from Limkokwing University of Creative Technology
1-11
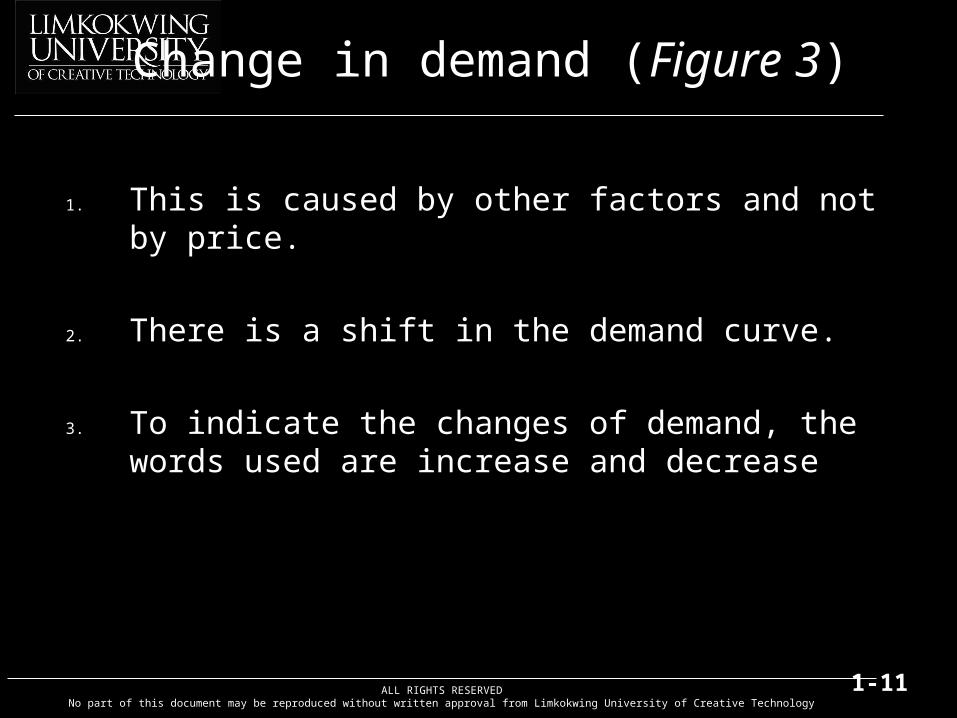
1. This is caused by other factors and not by price.
2. There is a shift in the demand curve.
3. To indicate the changes of demand, the words used are increase and decrease
Change in demand (Figure 3)
ALL RIGHTS RESERVEDNo part of this document may be reproduced without written approval from Limkokwing University of Creative Technology
1-12
Demand Elasticity- measures the responsiveness of demand
to changes in its determinants.
Price elasticity of demand- measures responsiveness of a good to a
change in price.
Demand Elasticity
ALL RIGHTS RESERVEDNo part of this document may be reproduced without written approval from Limkokwing University of Creative Technology
1-13
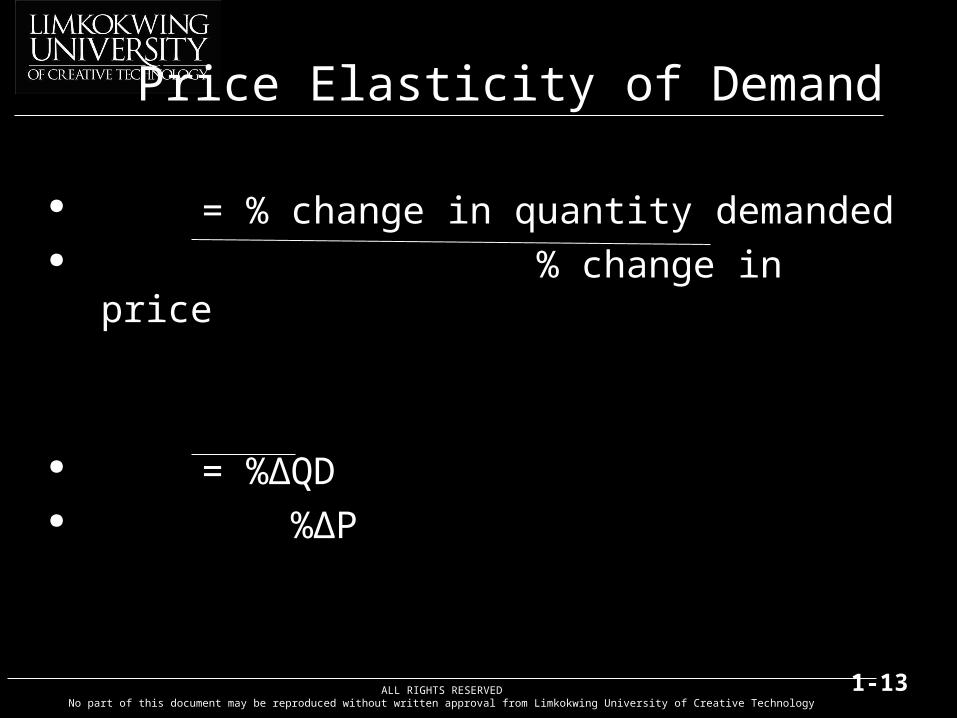
= % change in quantity demanded % change in price
= %ΔQD %ΔP
Price Elasticity of Demand
ALL RIGHTS RESERVEDNo part of this document may be reproduced without written approval from Limkokwing University of Creative Technology
1-14
Availability of substitutes Proportion of consumers’ income spent on a
good Degree of necessity Time dimension Income level Habits
Determinants of Price Elasticity of Demand
ALL RIGHTS RESERVEDNo part of this document may be reproduced without written approval from Limkokwing University of Creative Technology
1-15
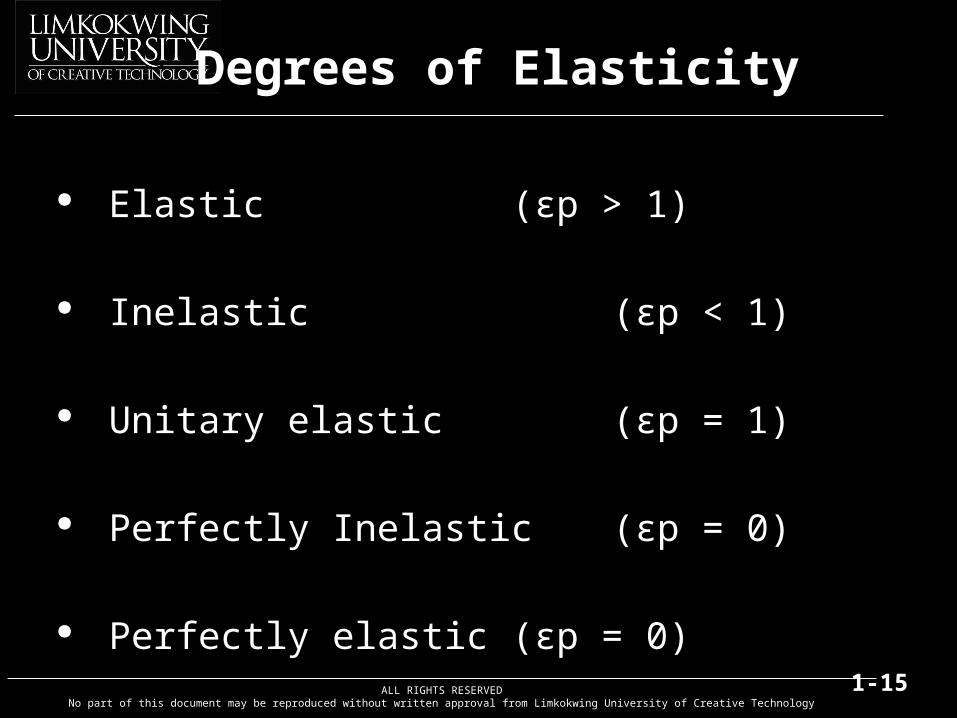
Elastic (εp > 1)
Inelastic (εp < 1)
Unitary elastic (εp = 1)
Perfectly Inelastic (εp = 0)
Perfectly elastic (εp = 0)
Degrees of Elasticity
ALL RIGHTS RESERVEDNo part of this document may be reproduced without written approval from Limkokwing University of Creative Technology
1-16
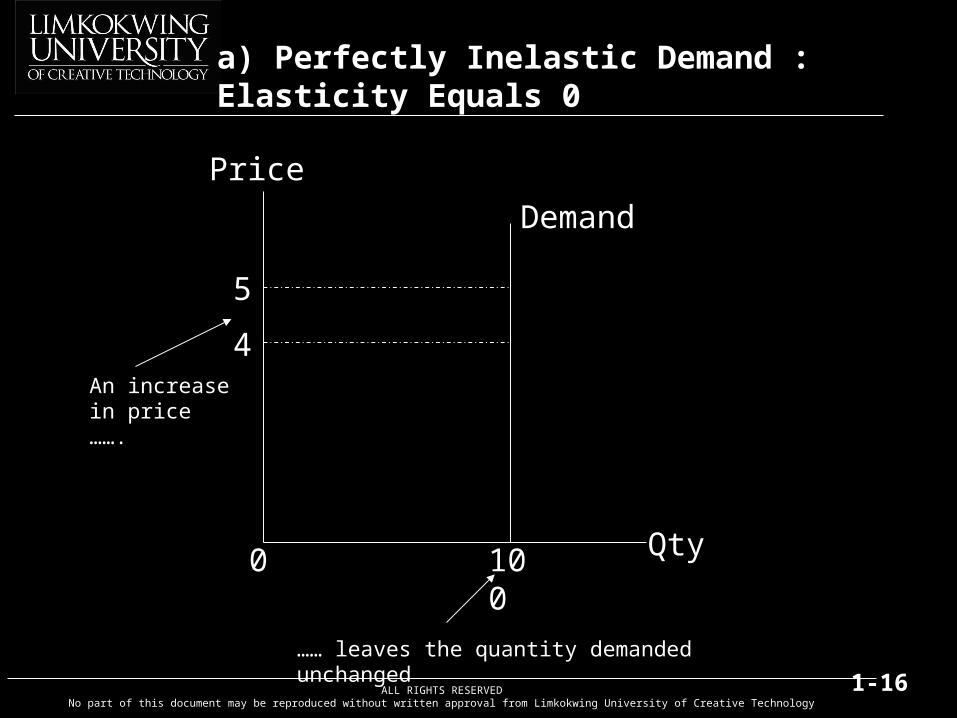
Price
Qty
5
4
0 100
Demand
An increase in price …….
…… leaves the quantity demanded unchanged
a) Perfectly Inelastic Demand : Elasticity Equals 0

ALL RIGHTS RESERVEDNo part of this document may be reproduced without written approval from Limkokwing University of Creative Technology
1-17
Price
Qty
5
4
0 100
A 25% increase in price …….
…… leads to an 10% decrease in quantity demanded
90
Demand
b) Inelastic Demand: Elasticity Is Less Than 1
ALL RIGHTS RESERVEDNo part of this document may be reproduced without written approval from Limkokwing University of Creative Technology
1-18
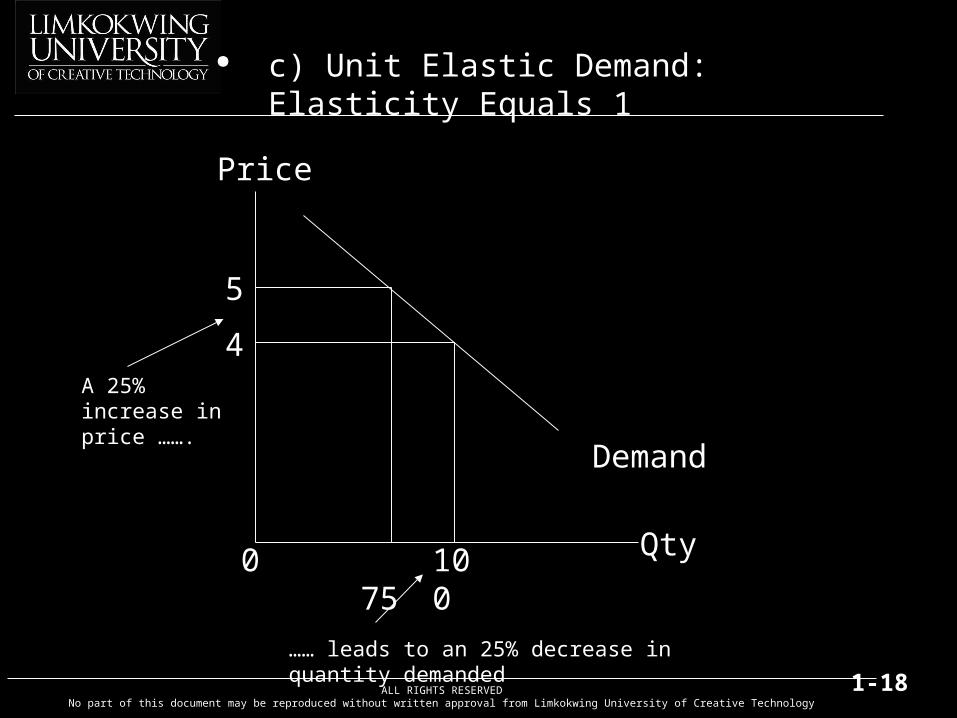
Price
Qty
5
4
0 100
A 25% increase in price …….
…… leads to an 25% decrease in quantity demanded
75
Demand
c) Unit Elastic Demand: Elasticity Equals 1
ALL RIGHTS RESERVEDNo part of this document may be reproduced without written approval from Limkokwing University of Creative Technology
1-19
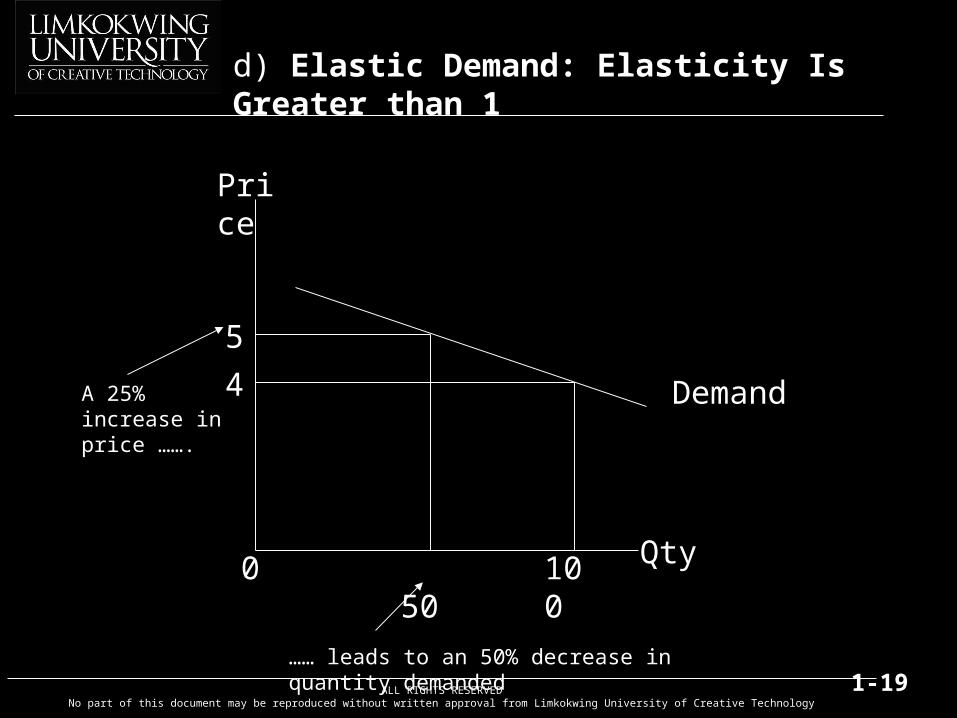
Qty
5
4
0 100
A 25% increase in price …….
…… leads to an 50% decrease in quantity demanded
50
Demand
d) Elastic Demand: Elasticity Is Greater than 1
Price
ALL RIGHTS RESERVEDNo part of this document may be reproduced without written approval from Limkokwing University of Creative Technology
1-20
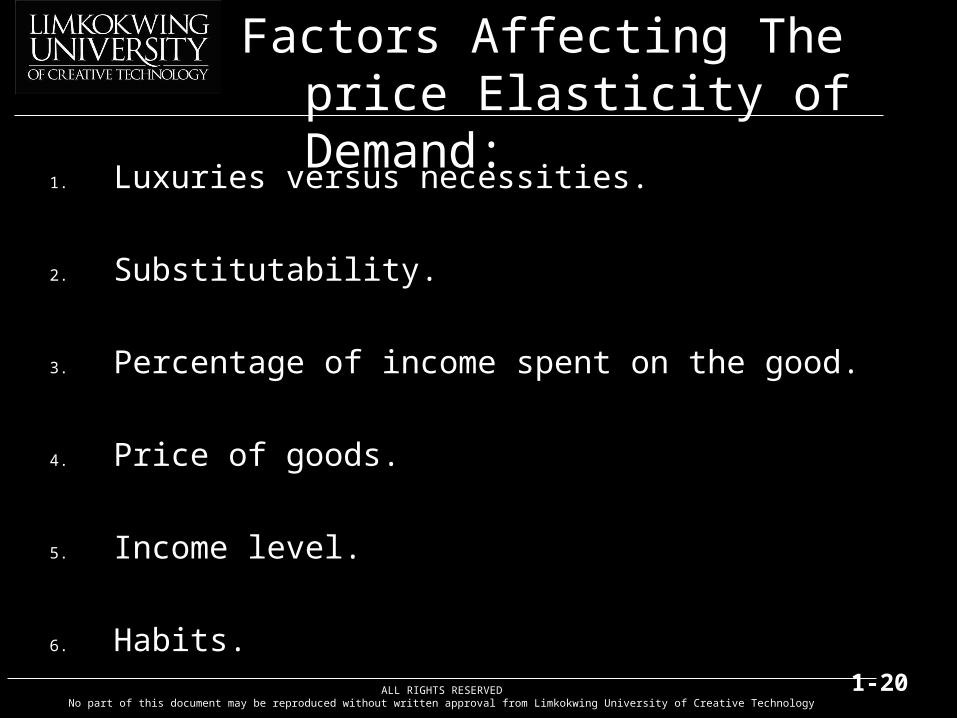
1. Luxuries versus necessities.
2. Substitutability.
3. Percentage of income spent on the good.
4. Price of goods.
5. Income level.
6. Habits.
Factors Affecting The price Elasticity of Demand:
ALL RIGHTS RESERVEDNo part of this document may be reproduced without written approval from Limkokwing University of Creative Technology
1-21
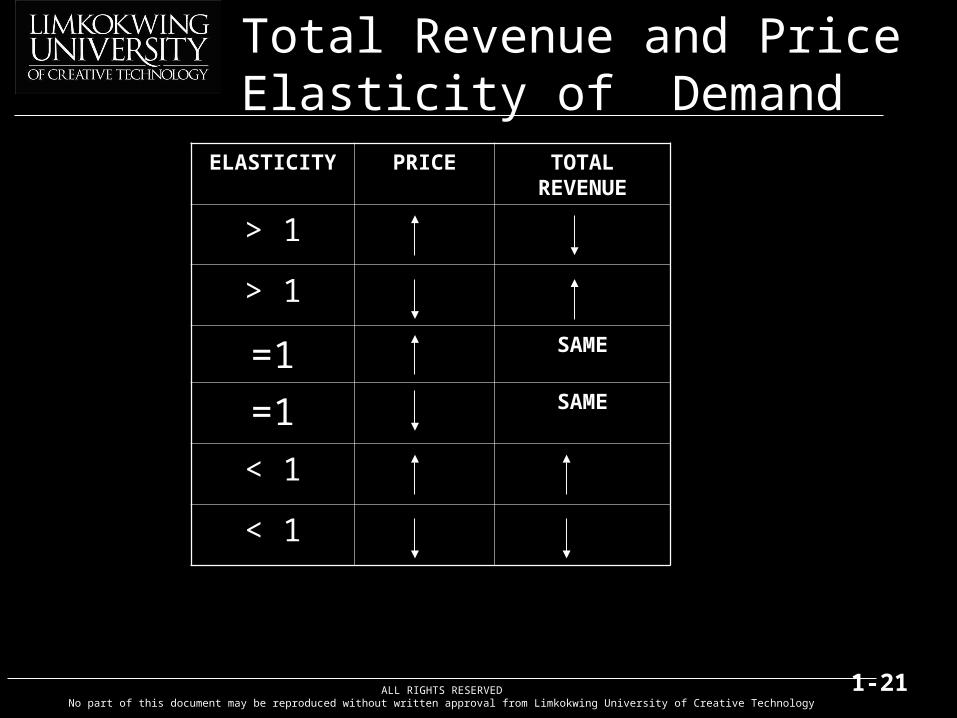
ELASTICITY PRICE TOTAL REVENUE
> 1
> 1
=1 SAME
=1 SAME
< 1
< 1
Total Revenue and Price Elasticity of Demand
ALL RIGHTS RESERVEDNo part of this document may be reproduced without written approval from Limkokwing University of Creative Technology
1-22
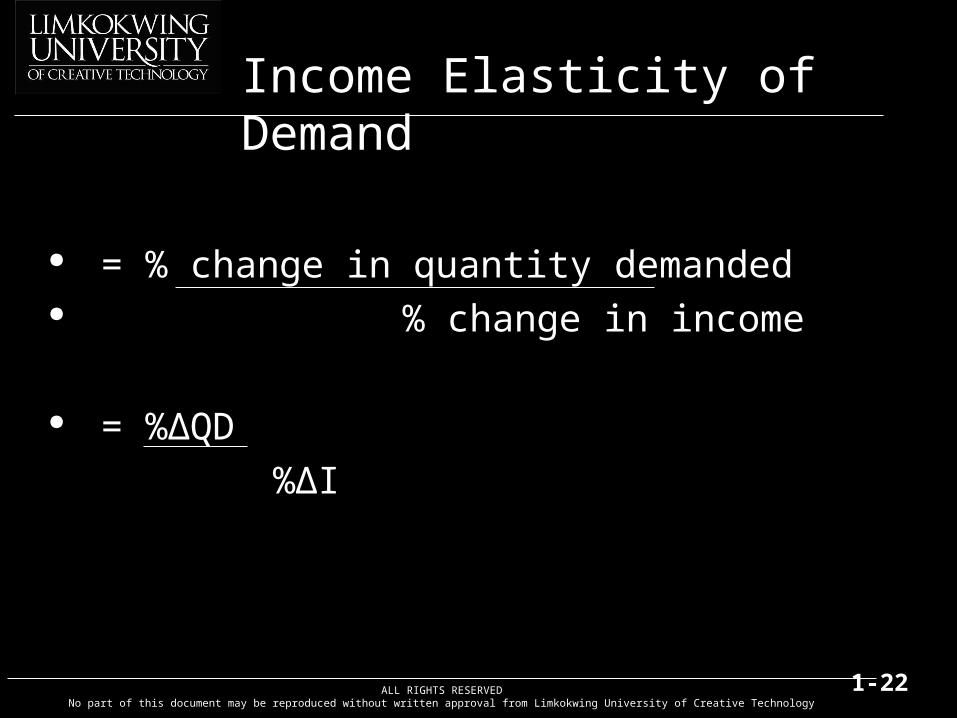
= % change in quantity demanded % change in income
= %ΔQD %ΔI
Income Elasticity of Demand
ALL RIGHTS RESERVEDNo part of this document may be reproduced without written approval from Limkokwing University of Creative Technology
1-23
Most goods are normal goods: Higher income raises quantity demanded and income move in the same direction, normal goods have positive income elasticities.
A few goods, such as bus rides, are inferior goods: Higher income lowers the quantity demanded. Because quantity demanded and income move in opposite directions, inferior goods have negative income elasticities.
ALL RIGHTS RESERVEDNo part of this document may be reproduced without written approval from Limkokwing University of Creative Technology
1-24
Cross elasticity of good 1
= % change in quantity demanded of good 1
% change in the price of good 2
Whether the cross-price elasticity is a positive or negative number depends on whether the two goods are substitutes or complements. The cross-price elasticity for substitutes good is positive and complements good is negative.
Cross Price Elasticities of Demand