Embed Size (px)
Citation preview

Principles of Economics
Session 10

Topics To Be Covered
Macroeconomics vs. MicroeconomicsHistory of MacroeconomicsMajor Concerns of MacroeconomicsObjectives of MacroeconomicsInstruments of MacroeconomicsMarkets and Players of Macroeconomics

Topics To Be Covered
Definition of Gross Domestic ProductMeasurement of GDPGDP, GNP, NNP, NI, PI, and DPIPrice IndexesAS, AD, and Macroeconomic Equilibrium

Macroeconomics vs. Microeconomics
Microeconomics is the study of how individual households and firms make decisions and how they interact with one another in markets.
Macroeconomics is the study of the economy as a whole. Its goal is to explain the economic changes that affect many households, firms, and markets at once.
History of Macroeconomics
The Great Depression was a period of severe economic contraction and high unemployment that began in 1929 and continued throughout the 1930s.
History of Macroeconomics
Classical economists applied microeconomic models, or “market clearing” models, to economy-wide problems.
The failure of simple classical models to explain the prolonged existence of high unemployment during the Great Depression provided the impetus for the development of macroeconomics.
History of Macroeconomics
In 1936, John Maynard Keynes published The General Theory of Employment, Interest, and Money.
Keynes believed governments could intervene in the economy and affect the level of output and employment.
Fine-tuning was the phrase used to refer to the government’s role in regulating inflation and unemployment.
History of Macroeconomics
The use of Keynesian policy to fine-tune the economy in the 1960s, led to disillusionment in the 1970s and early 1980s.
Stagflation occurs when the overall price level rises rapidly (inflation) during periods of recession or high and persistent unemployment (stagnation).

Major Concerns of Macroeconomics
Macroeconomics answers questions like:Why do production expand in some years
and contract in others? Why do prices rise rapidly in some time
periods while they are more stable in others? Why are some people unable to have the
opportunity to work although they do want to work?
Major Concerns of Macroeconomics
Output (GDP change)Price level (Inflation)Employment (Unemployment)
Objectives of Macroeconomics
Output growthStable pricesHigh employment
Instruments of Macroeconomics
Macroeconomic tools mainly consist of fiscal policy and monetary policy.Fiscal policy refers to government policies
concerning taxes and expenditures.Monetary policy consists of tools used by
the central bank to control the money supply.

Markets and Players of Macroeconomy
Markets and Players of Macroeconomy
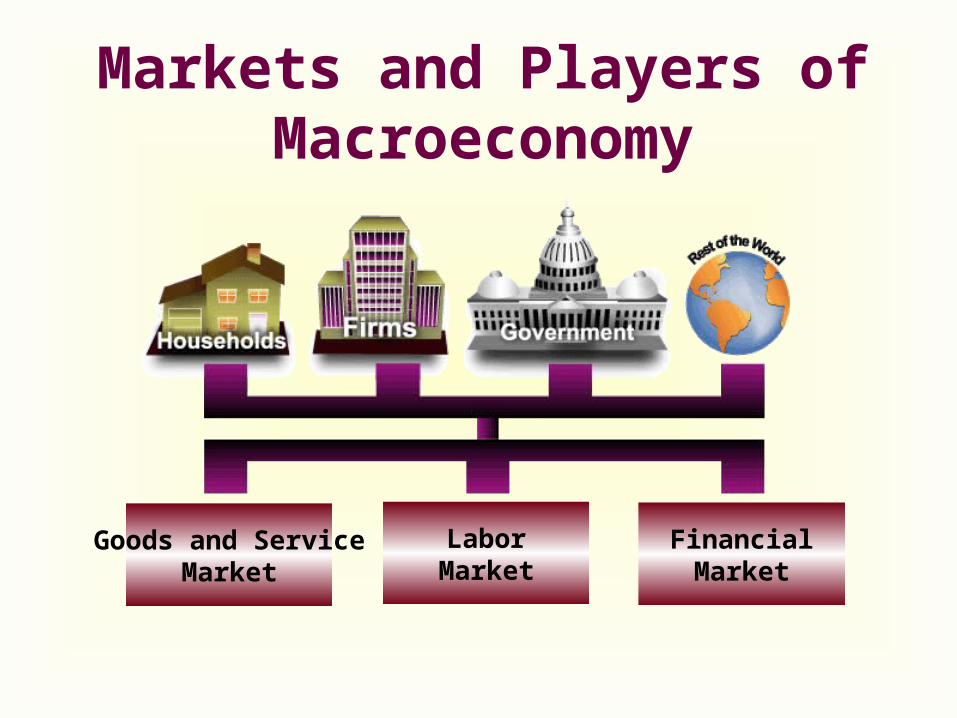
Goods and ServiceMarket
FinancialMarket
LaborMarket
Markets and Players of Macroeconomy
Households and the government purchase goods and services from firms in the goods-and services market, and firms supply to the goods and services market.
In the labor market, firms and government purchase labor from households.
Markets and Players of Macroeconomy
The financial market consists of money market, capital market, and foreign exchange market in the open economy.
In the money market, the government (central bank) supplies money and households and firms demand money for transaction and speculation.
Markets and Players of Macroeconomy
In the capital market, households purchase stocks and bonds from firms.
In the foreign exchange market, those who want to invest in foreign countries exchange domestic currency for foreign currencies, while those foreigners who want to invest in this country supply foreign currencies and demand domestic currencies.
Gross Domestic Product
GDP is the market value of all final goods and services
produced within a country in a given period of time.
Gross Domestic Product
GDP is the best single measure of the economic well-being of a society.
GDP per person tells us the income and expenditure of the average person in the economy.
Higher GDP per person indicates a higher standard of living.
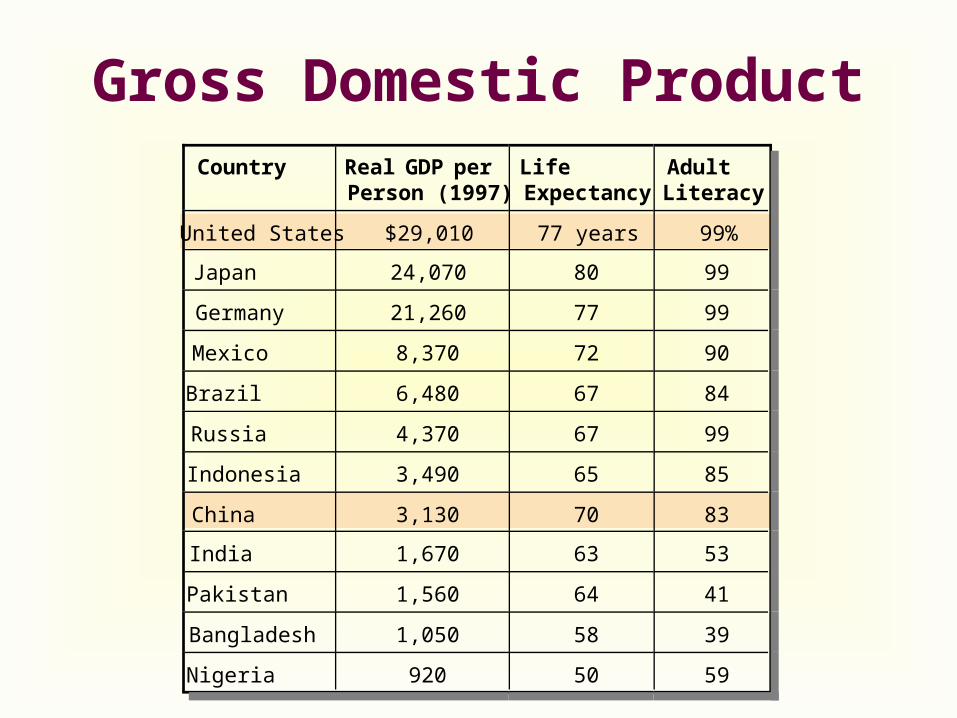
Gross Domestic ProductCountry Real GDP per
Person (1997)LifeExpectancy
AdultLiteracy
United States $29,010 77 years 99%
Japan 24,070 80 99
Germany 21,260 77 99
Mexico 8,370 72 90
Brazil 6,480 67 84
Russia 4,370 67 99
Indonesia 3,490 65 85
China 3,130 70 83
India 1,670 63 53
Pakistan 1,560 64 41
Bangladesh 1,050 58 39
Nigeria 920 50 59
Gross Domestic Product
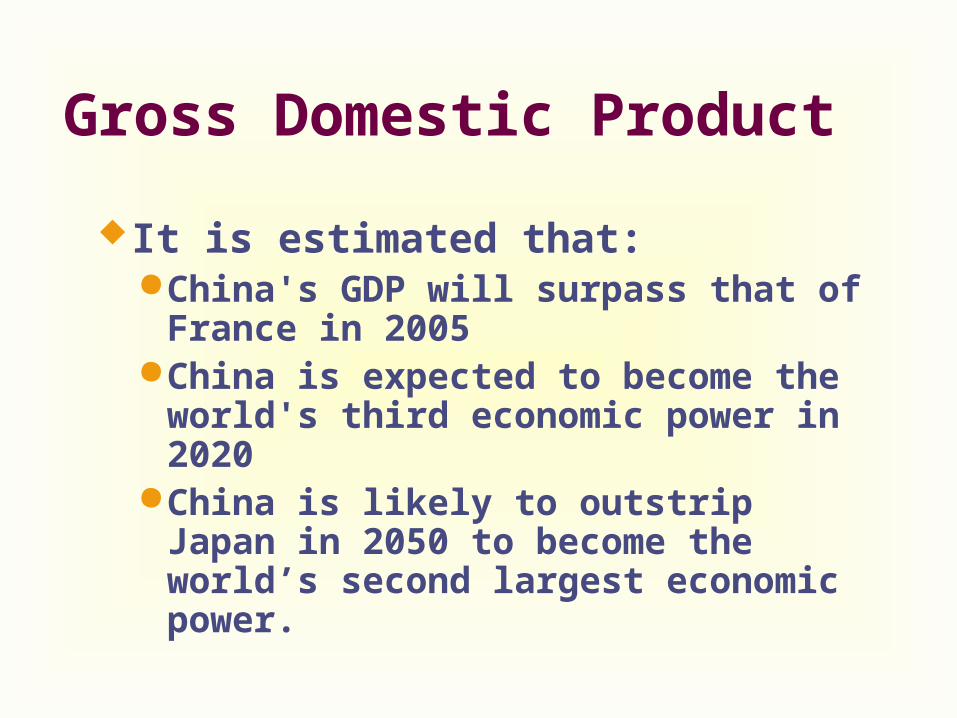
It is estimated that:China's GDP will surpass that of
France in 2005China is expected to become the
world's third economic power in 2020China is likely to outstrip Japan in
2050 to become the world’s second largest economic power.
Gross Domestic Product
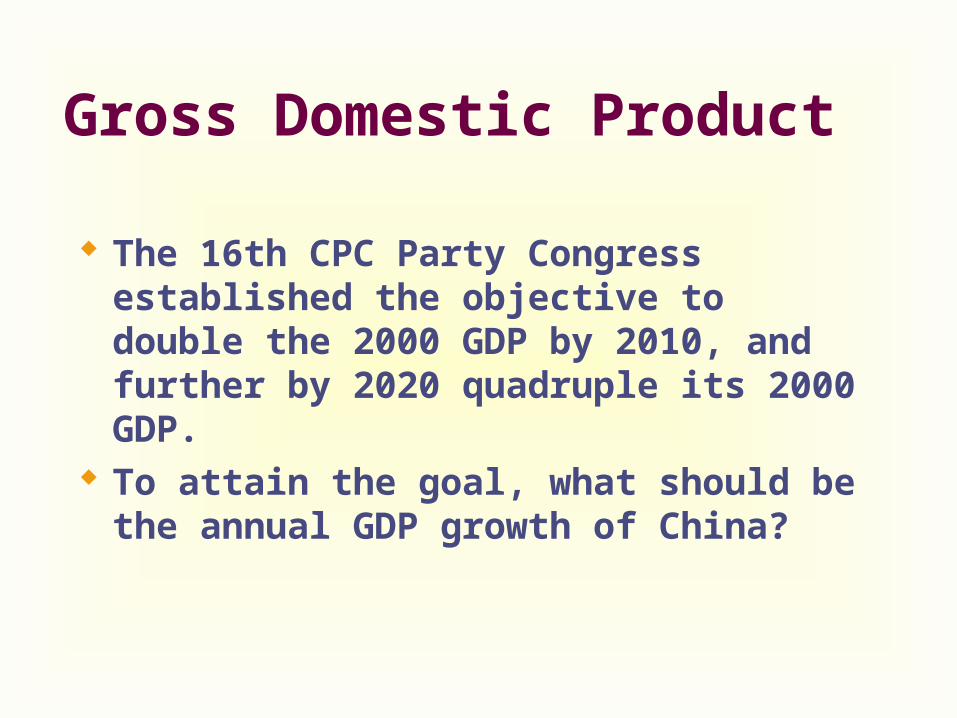
The 16th CPC Party Congress established the objective to double the 2000 GDP by 2010, and further by 2020 quadruple its 2000 GDP.
To attain the goal, what should be the annual GDP growth of China?
Gross Domestic Product
A rough solution to such issue can be resorted to the rule of 70.
According to the rule of 70, if some variable grows at a rate of x percent per year, then that variable doubles in approximately 70/x years.
For example, $5,000 invested at 7 percent interest per year, will approximately double in size in 10 years.
The Measurement of GDP
Output is valued at market prices. It records only the value of final goods,
not intermediate goods (the value is counted only once).
It includes both tangible goods (food, clothing, cars) and intangible services (haircuts, housecleaning, doctor visits).
The Measurement of GDP
It includes goods and services currently produced, not transactions involving goods produced in the past.
It measures the value of production within the geographic confines of a country.
It measures the value of production that takes place within a specific interval of time, usually a year or a quarter (three months).
The Measurement of GDP
The term final goods and services refers to goods and services produced for final use.
Intermediate goods are goods produced by one firm for use in further processing by another firm.
The Measurement of GDP
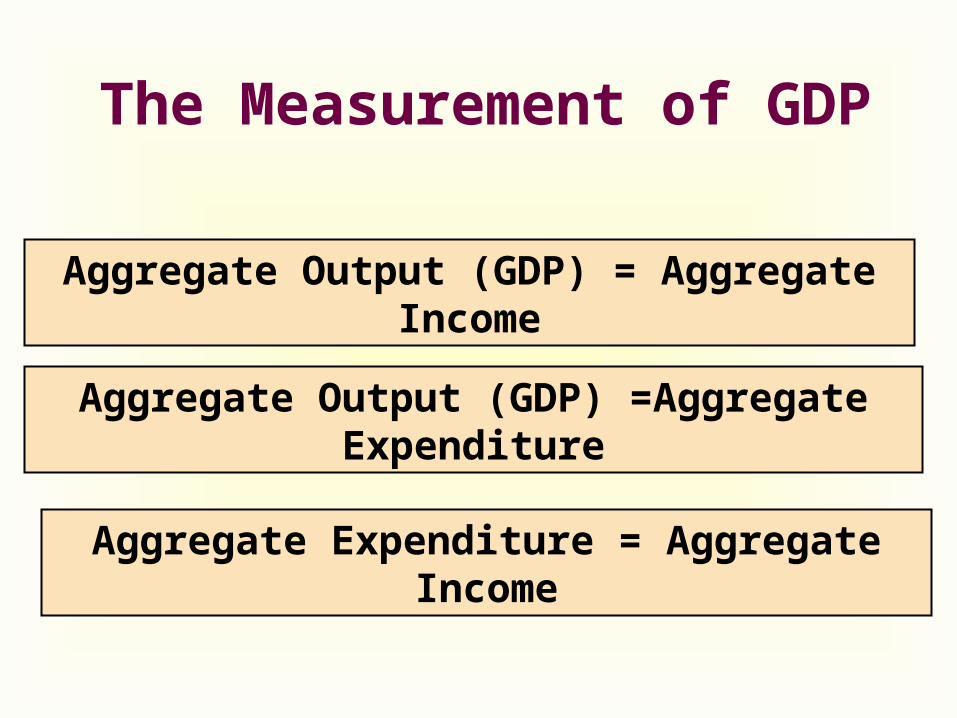
Aggregate Output (GDP) = Aggregate Income
Aggregate Output (GDP) =Aggregate Expenditure
Aggregate Expenditure = Aggregate Income
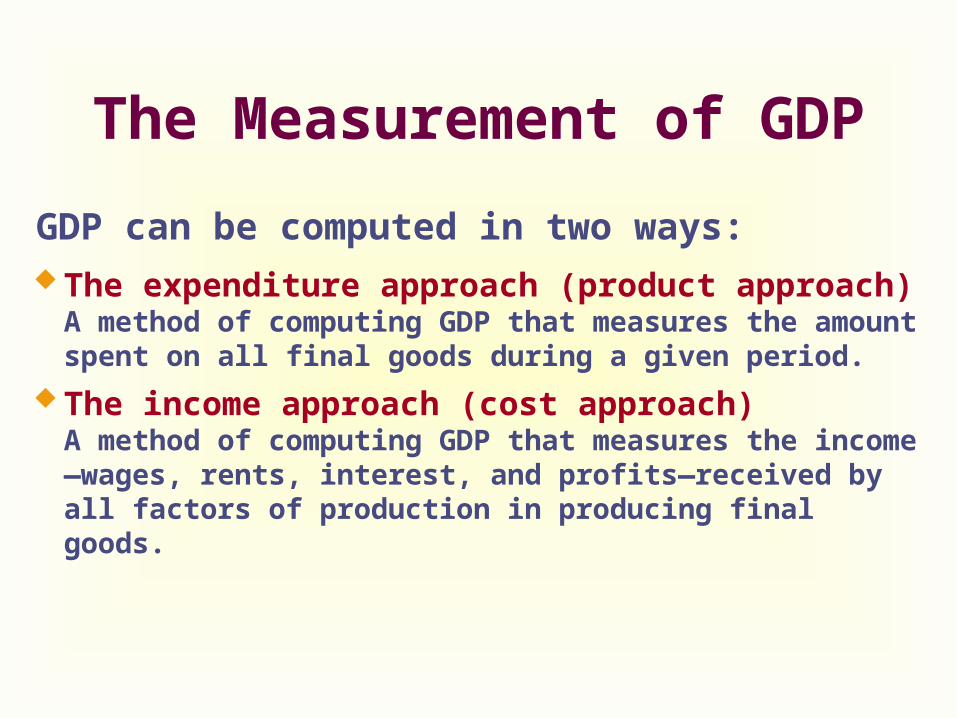
GDP can be computed in two ways:
The expenditure approach (product approach)A method of computing GDP that measures the amount spent on all final goods during a given period.
The income approach (cost approach)A method of computing GDP that measures the income—wages, rents, interest, and profits—received by all factors of production in producing final goods.
The Measurement of GDP
The Expenditure Approach
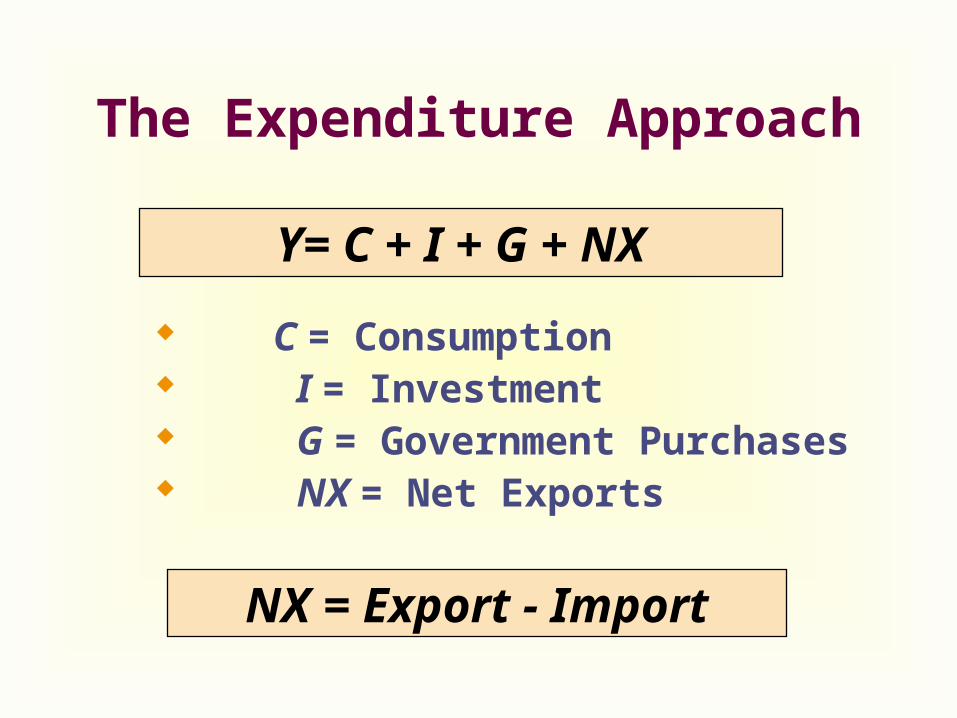
C = Consumption I = Investment G = Government Purchases NX = Net Exports
Y= C + I + G + NX
NX = Export - Import
The Expenditure Approach
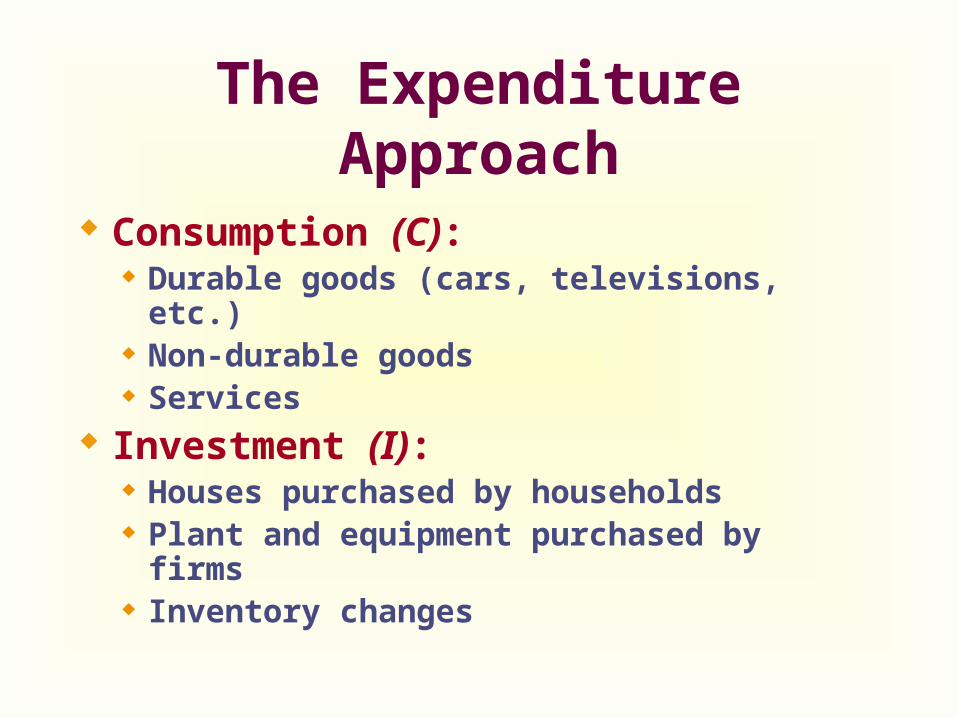
Consumption (C): Durable goods (cars, televisions, etc.) Non-durable goods Services
Investment (I): Houses purchased by households Plant and equipment purchased by firms Inventory changes
The Expenditure Approach
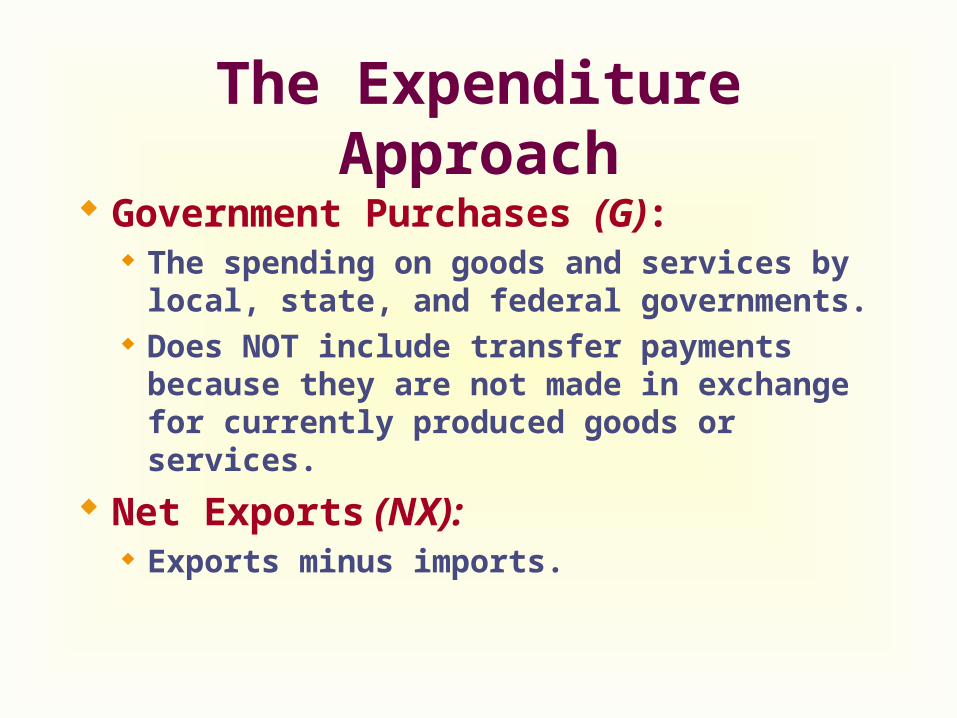
Government Purchases (G): The spending on goods and services by local,
state, and federal governments. Does NOT include transfer payments
because they are not made in exchange for currently produced goods or services.
Net Exports (NX): Exports minus imports.
The Income Approach
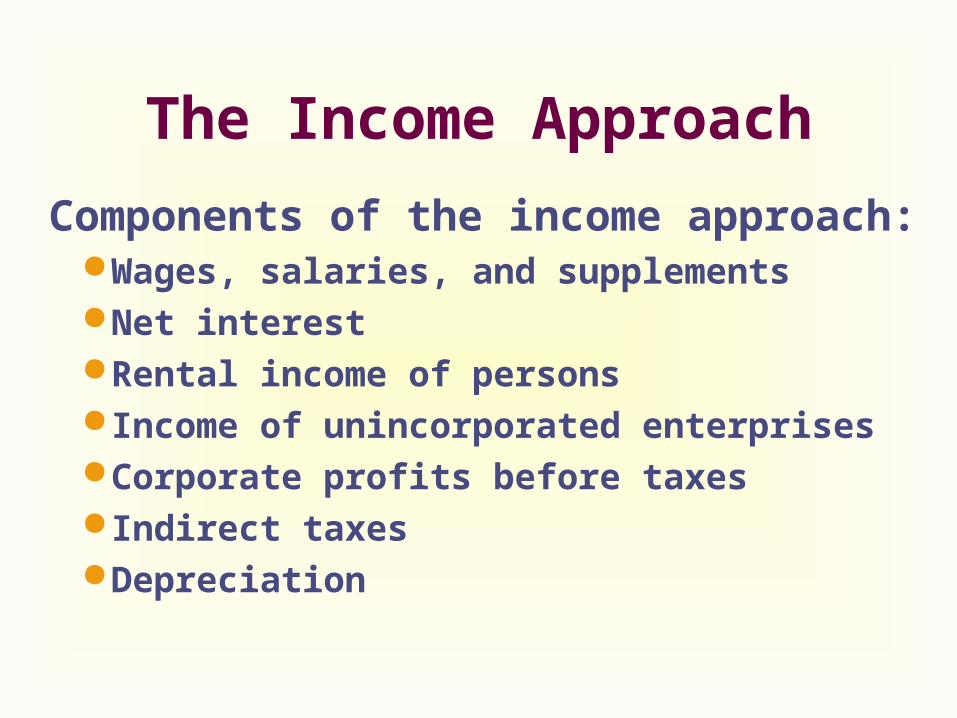
Components of the income approach:Wages, salaries, and supplementsNet interestRental income of personsIncome of unincorporated enterprisesCorporate profits before taxesIndirect taxesDepreciation
The Income Approach
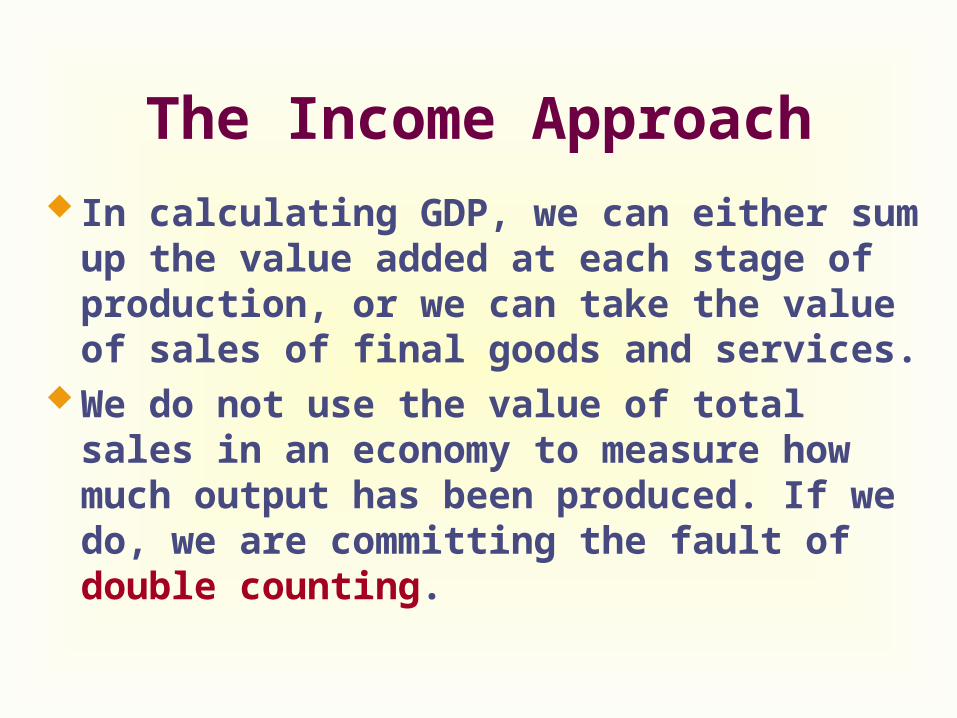
In calculating GDP, we can either sum up the value added at each stage of production, or we can take the value of sales of final goods and services.
We do not use the value of total sales in an economy to measure how much output has been produced. If we do, we are committing the fault of double counting.
The Income Approach
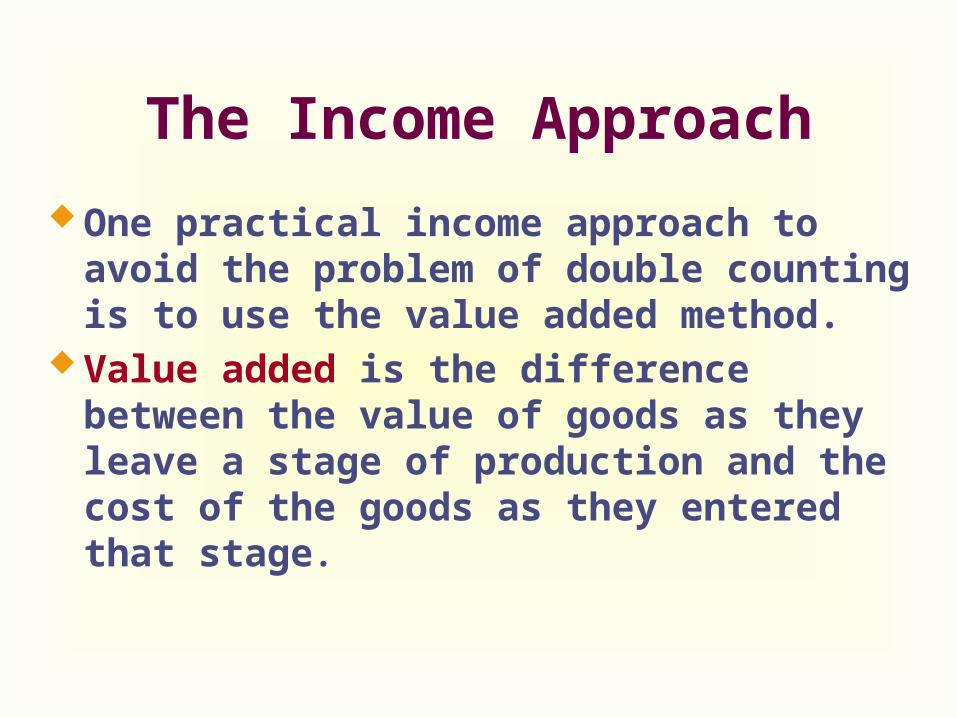
One practical income approach to avoid the problem of double counting is to use the value added method.
Value added is the difference between the value of goods as they leave a stage of production and the cost of the goods as they entered that stage.
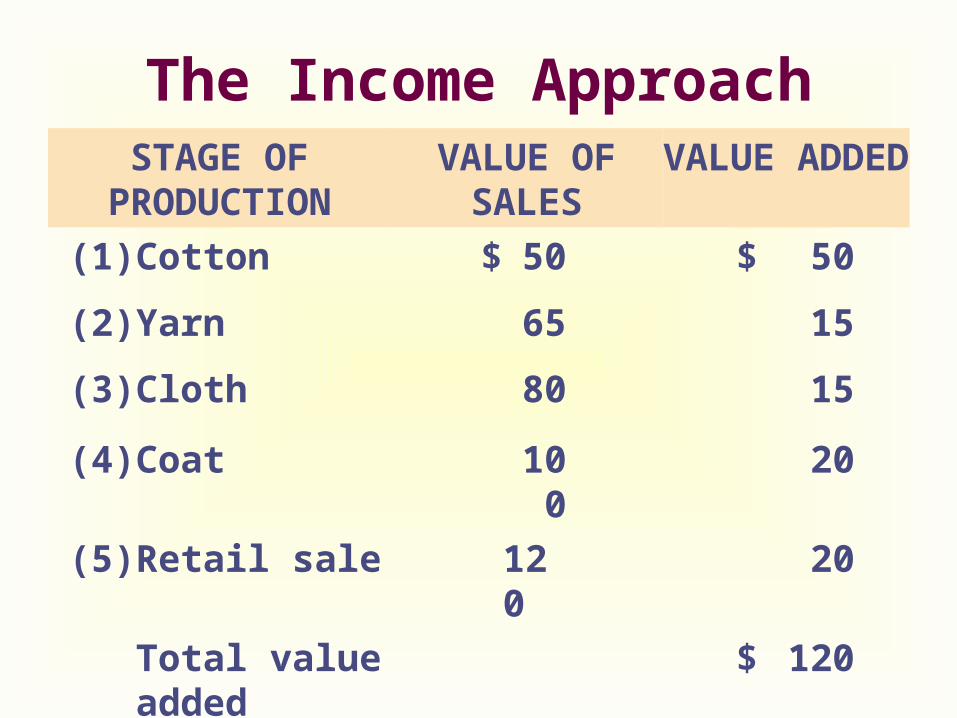
The Income ApproachSTAGE OF
PRODUCTIONVALUE OF
SALESVALUE ADDED
(1)Cotton $ 50 $ 50
(2)Yarn 65 15
(3)Cloth 80 15
(4)Coat 100 20
(5)Retail sale 120 20
Total value added
$ 120
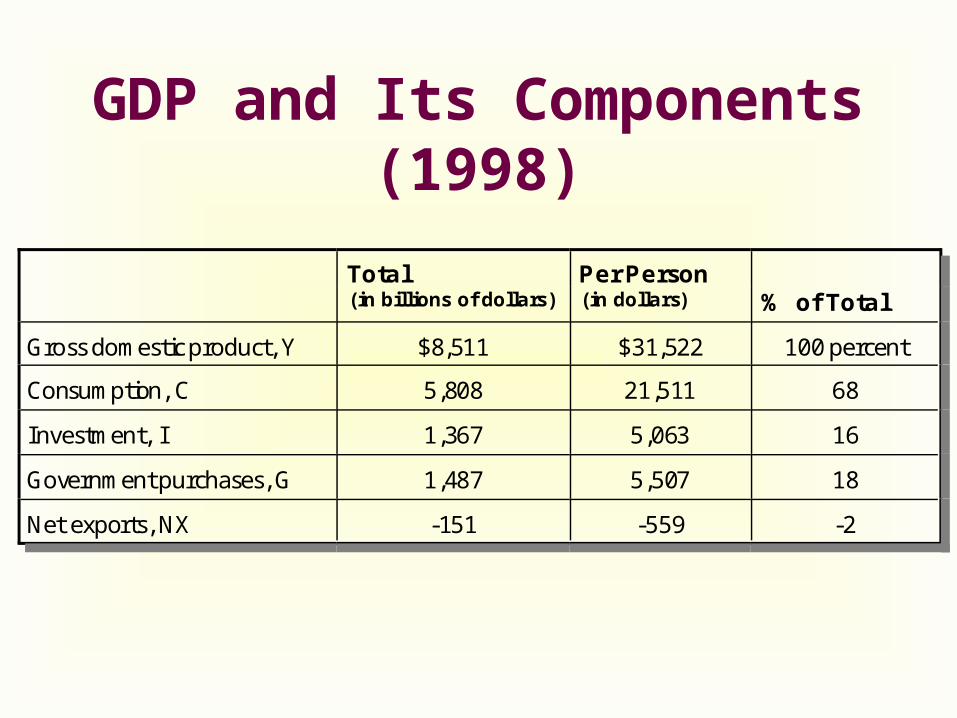
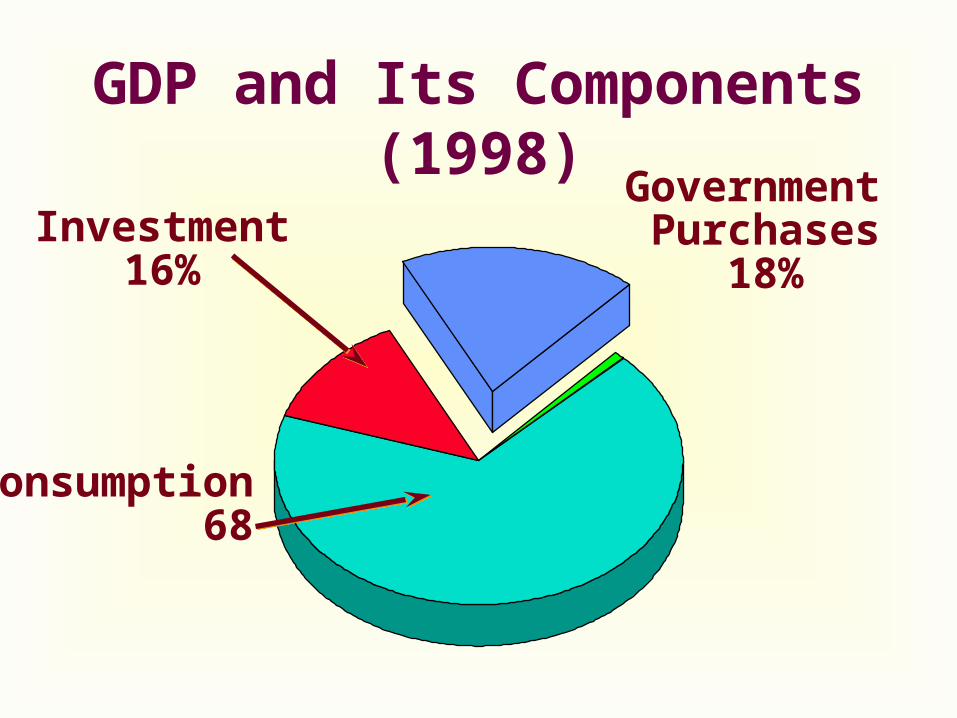
GDP and Its Components (1998)
Total(in billions of dollars)
Per Person(in dollars) % of Total
Gross domestic product, Y $8,511 $31,522 100 percent
Consumption, C 5,808 21,511 68
Investment, I 1,367 5,063 16
Government purchases, G 1,487 5,507 18
Net exports, NX -151 -559 -2
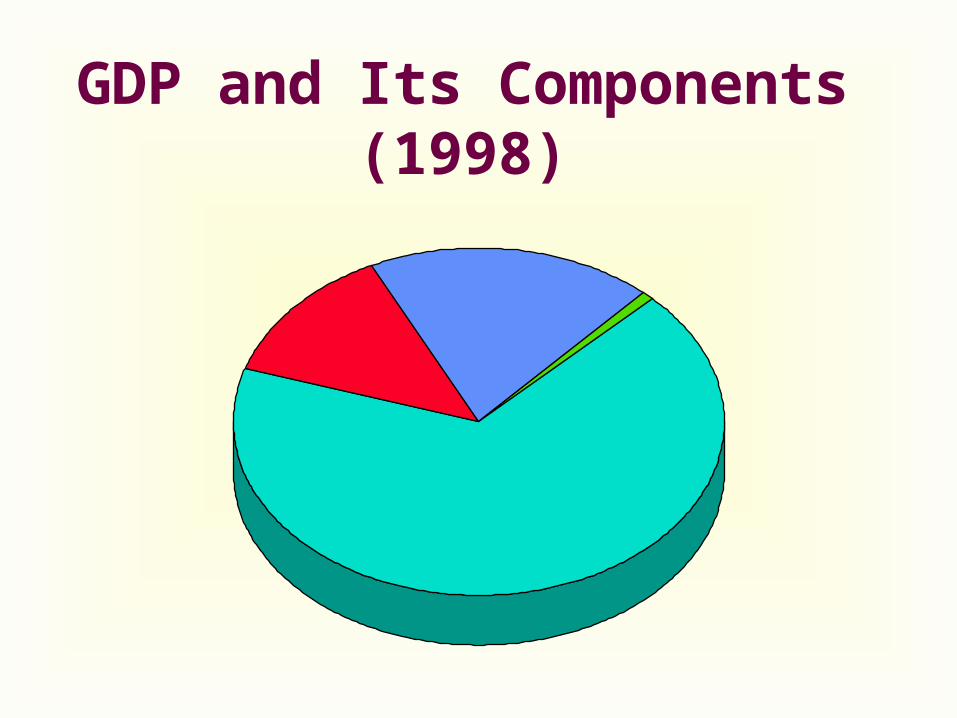
GDP and Its Components (1998)
GDP and Its Components (1998)
Consumption 68 %
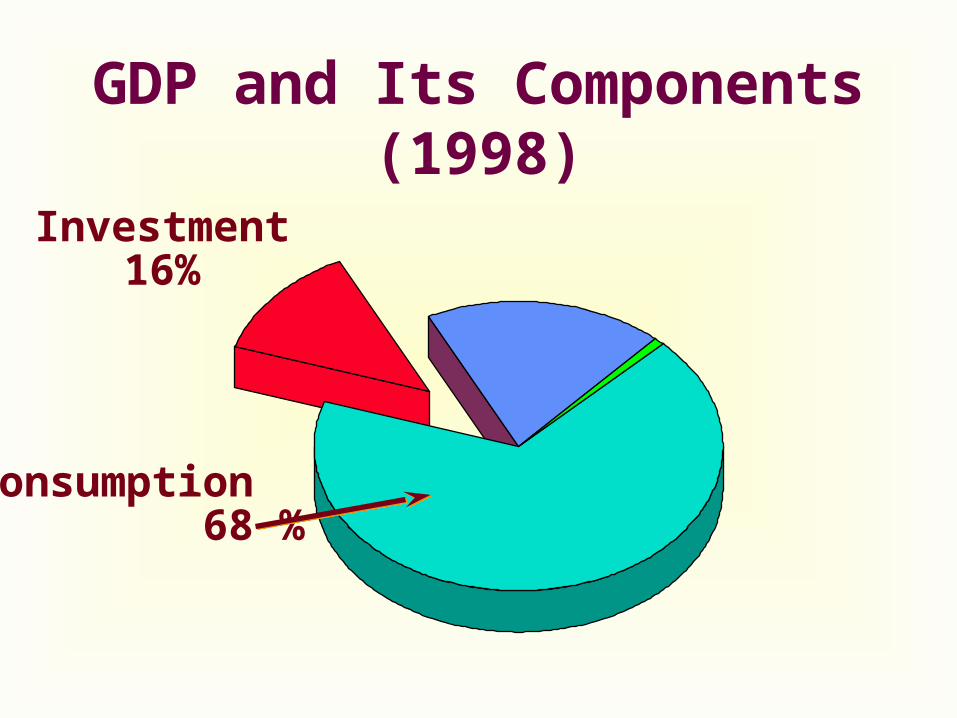
Investment16%
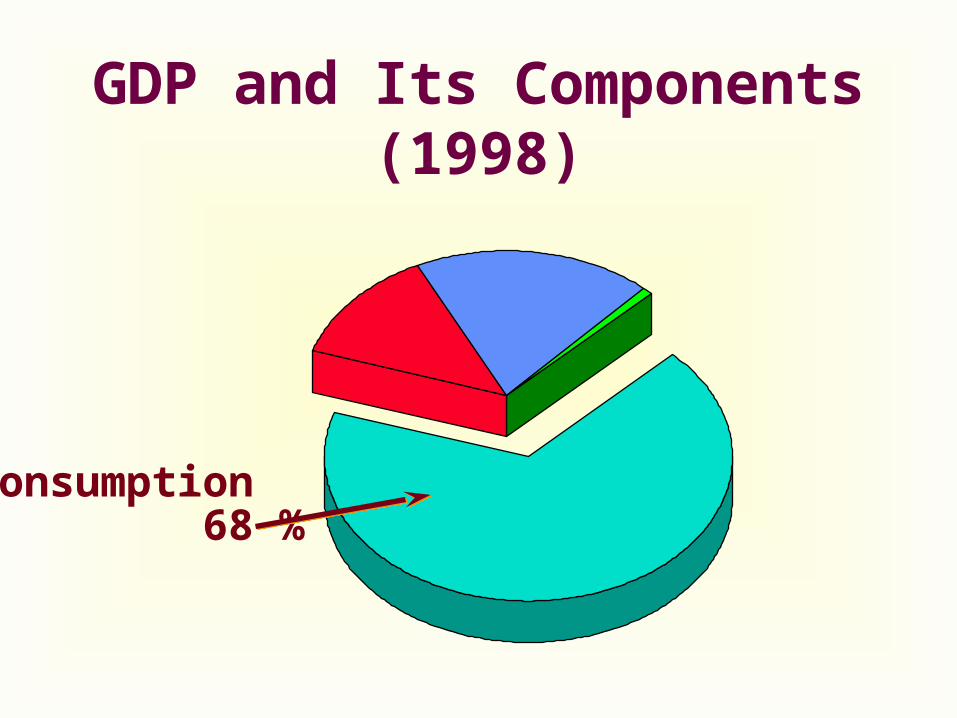
GDP and Its Components (1998)
Consumption 68 %
Consumption 68 %
Government Purchases
18%
GDP and Its Components (1998)
Investment16%
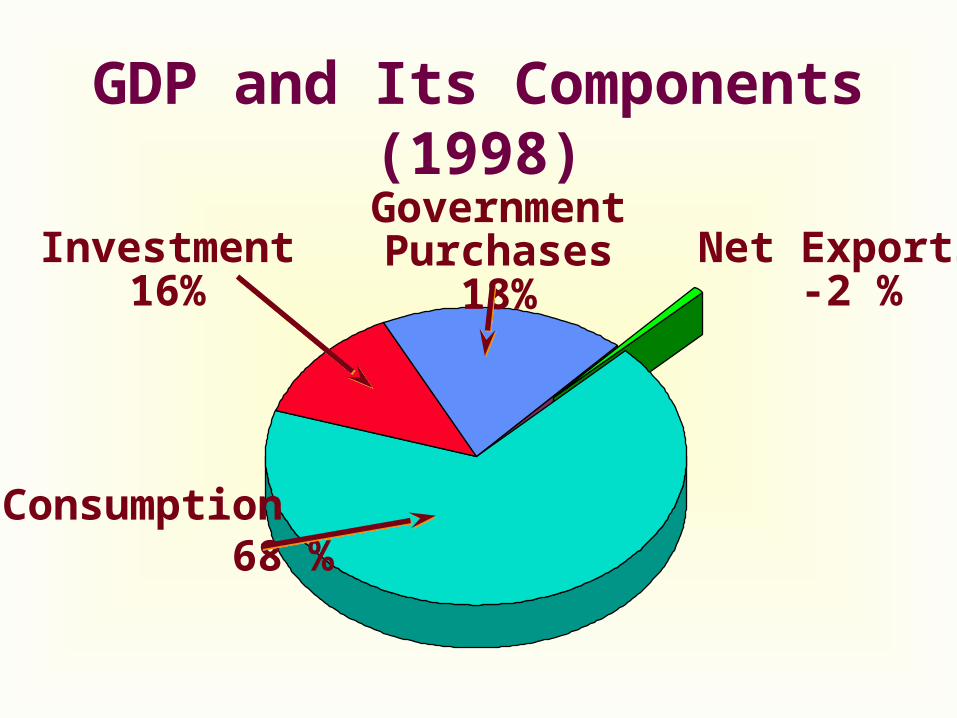
Net Exports -2 %
GDP and Its Components (1998)
Consumption 68 %
Investment16%
Government Purchases
18%
Inappropriateness of GDP
GDP excludes most items that are produced and consumed at home and that never enter the marketplace.
It excludes value of leisure and clean environment.
It excludes items produced and sold illicitly, such as illegal drugs.
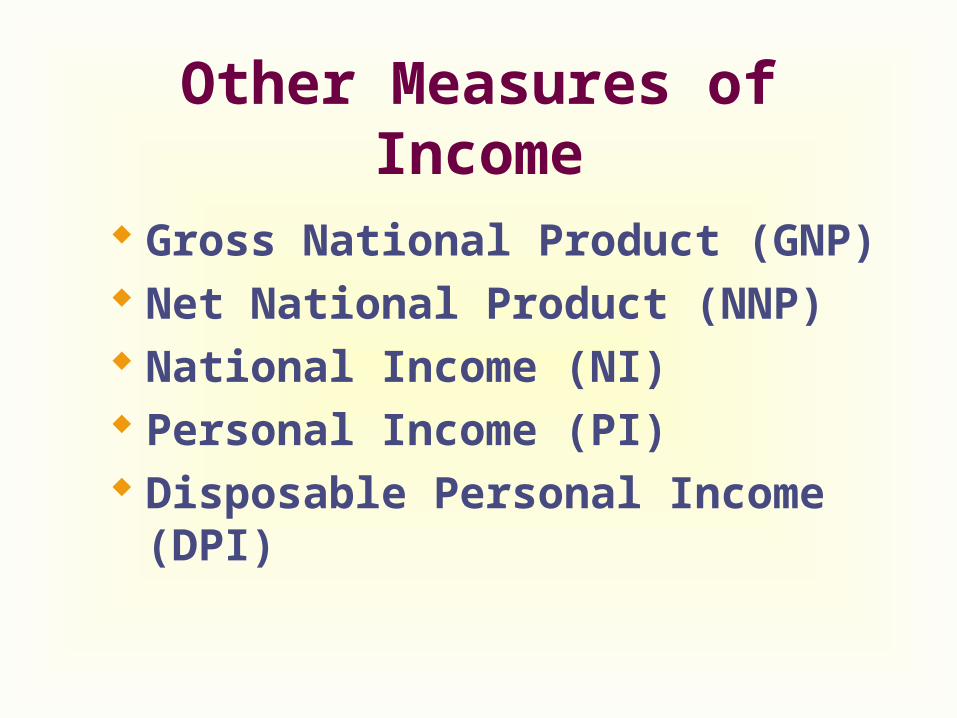
Other Measures of Income
Gross National Product (GNP) Net National Product (NNP) National Income (NI) Personal Income (PI) Disposable Personal Income (DPI)
Gross National Product
Gross national product (GNP) is the total income earned by a nation’s permanent residents (called nationals).
It differs from GDP by including income that our citizens earn abroad and excluding income that foreigners earn here.
Net National Product
Net National Product (NNP) is the total income of the nation’s residents (GNP) minus losses from depreciation.
Depreciation is the wear and tear on the economy’s stock of equipment and structures.
NNP=GNP– Depreciation
National Income National Income is the total income
earned by a nation’s residents in the production of goods and services.
It differs from NNP by excluding indirect business taxes (such as sales taxes).
NI=NNP – Indirect Taxes
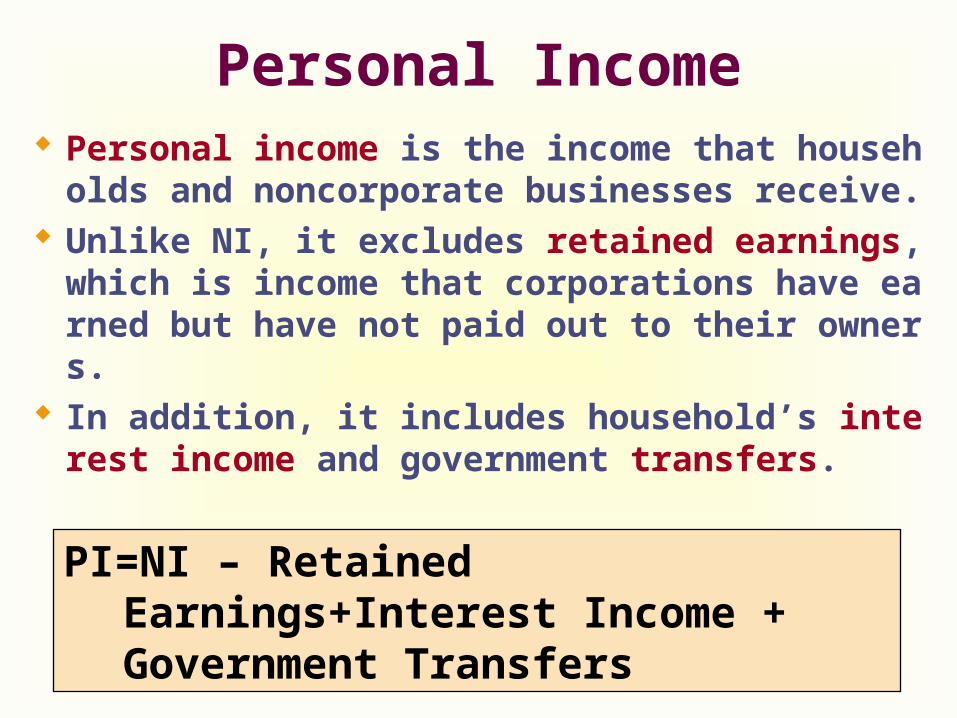
Personal Income Personal income is the income that households
and noncorporate businesses receive. Unlike NI, it excludes retained earnings, which
is income that corporations have earned but have not paid out to their owners.
In addition, it includes household’s interest income and government transfers.
PI=NI – Retained Earnings+Interest Income + Government Transfers
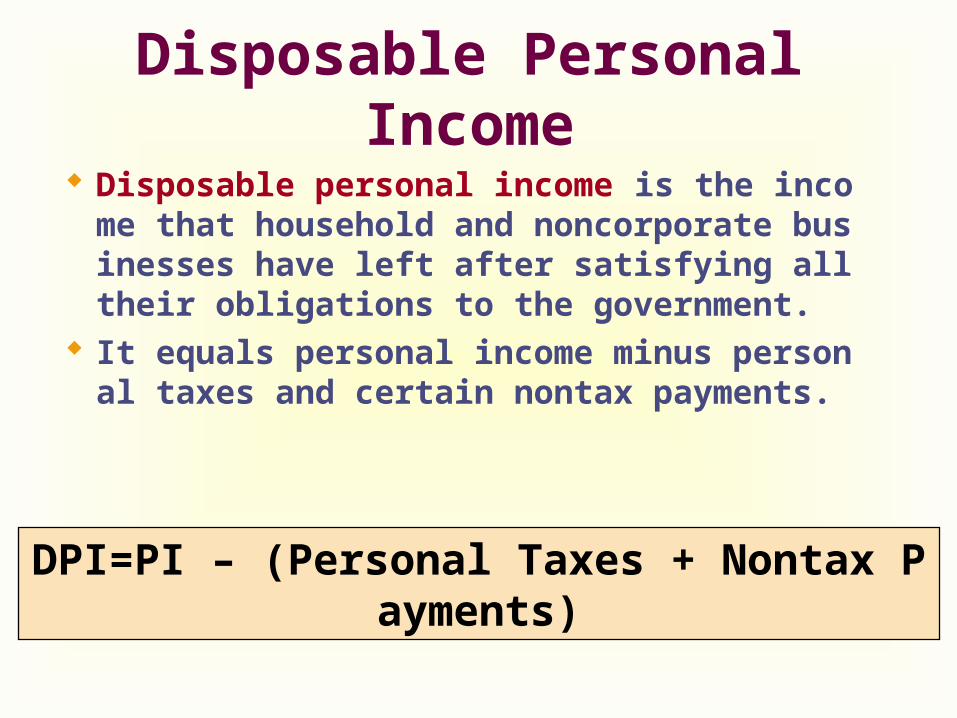
Disposable Personal Income
Disposable personal income is the income that household and noncorporate businesses have left after satisfying all their obligations to the government.
It equals personal income minus personal taxes and certain nontax payments.
DPI=PI – (Personal Taxes + Nontax Payments)
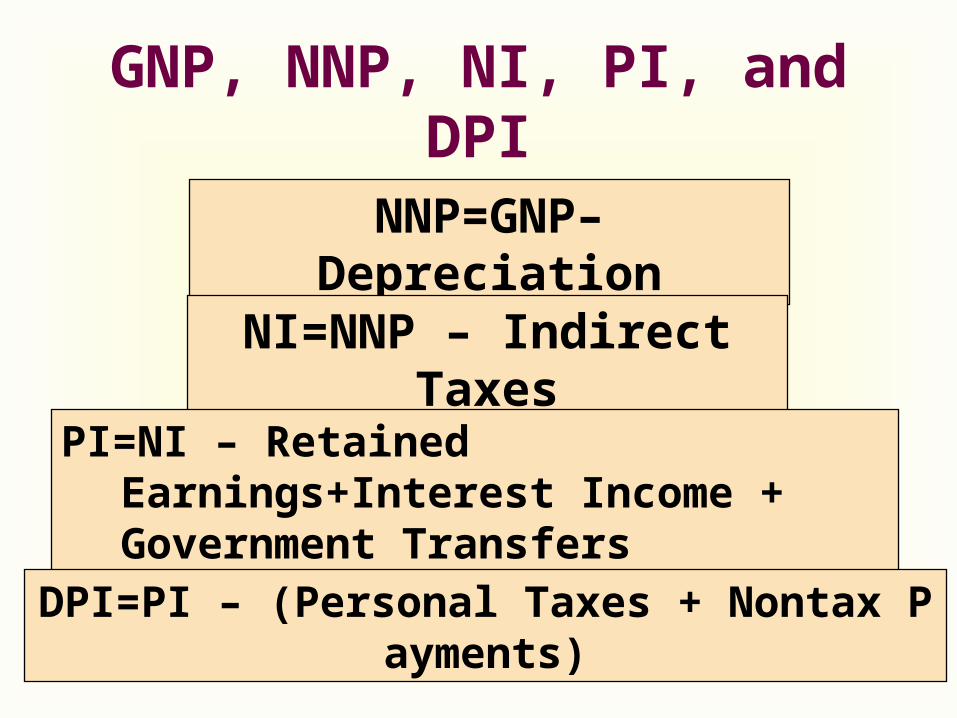
GNP, NNP, NI, PI, and DPI
NNP=GNP– Depreciation
NI=NNP – Indirect Taxes
PI=NI – Retained Earnings+Interest Income + Government Transfers
DPI=PI – (Personal Taxes + Nontax Payments)
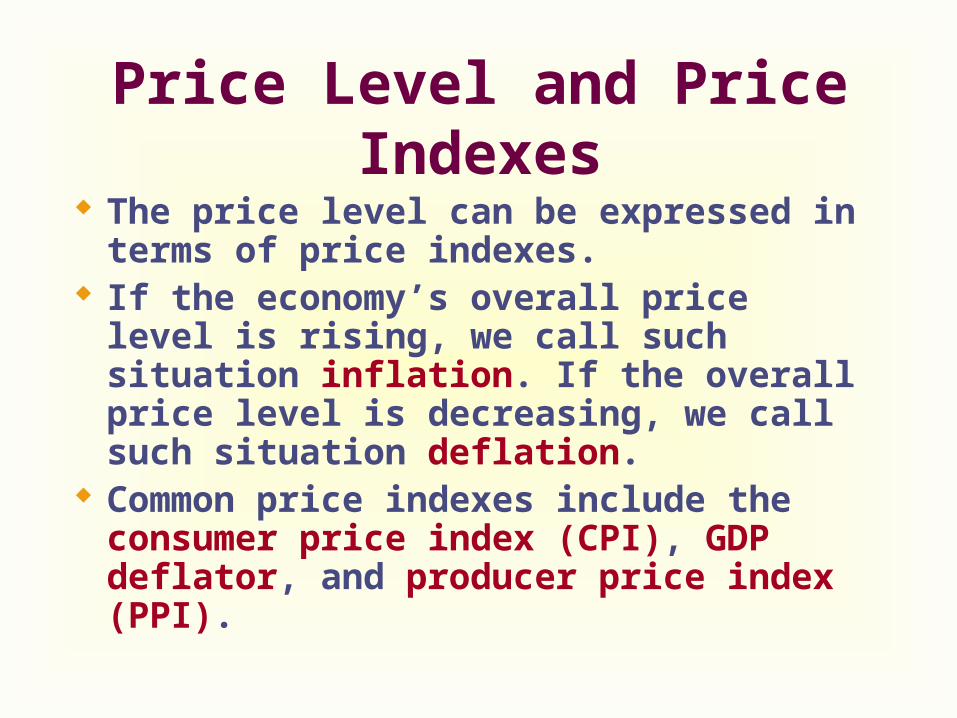
Price Level and Price Indexes The price level can be expressed in terms
of price indexes. If the economy’s overall price level is
rising, we call such situation inflation. If the overall price level is decreasing, we call such situation deflation.
Common price indexes include the consumer price index (CPI), GDP deflator, and producer price index (PPI).
The Consumer Price Index
The consumer price index (CPI) is a measure of the overall cost of the goods and services bought by a typical consumer.
It is used to monitor changes in the cost of living over time.
The Consumer Price Index
Steps to determine the CPI and the inflation rate:
Fix the basketFind the pricesCompute the basket’s costChoose a base yearCompute the indexCompute the inflation rate
The Consumer Price Index
Fix the Basket: Determine what prices are most important to the typical consumer. The Bureau of Labor Statistics (BLS)
identifies a market basket of goods and services the typical consumer buys.
The BLS conducts monthly consumer surveys to set the weights for the prices of those goods and services.
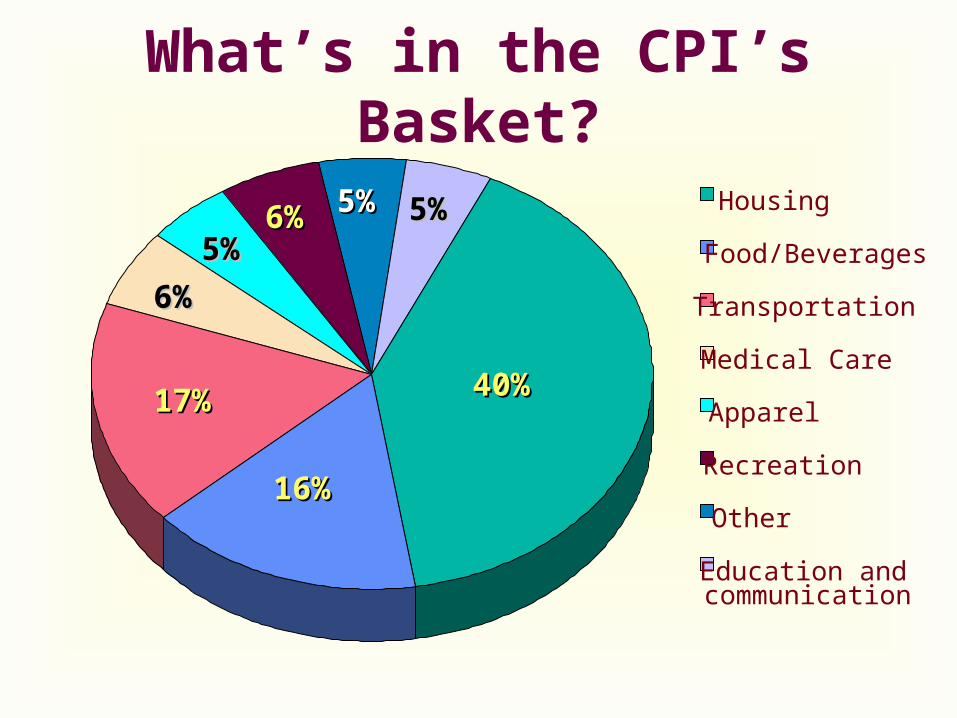
Housing
Food/Beverages
Transportation
Medical Care
Apparel
Recreation
Other
Education andcommunication
What’s in the CPI’s Basket?
40%40%
16%16%
17%17%
6%6%5%5%6%6% 5%5% 5%5%
The Consumer Price Index
Find the Prices: Find the prices of each of the goods and services in the basket for each point in time.
Compute the Basket’s Cost: Use the data on prices to calculate the cost of the basket of goods and services at different times.
The Consumer Price Index
Choose a Base Year and Compute the Index: Designate one year as the base year, making
it the benchmark against which other years are compared.
Compute the index by dividing the price of the basket in one year by the price in the base year and multiplying by 100.
The Consumer Price Index
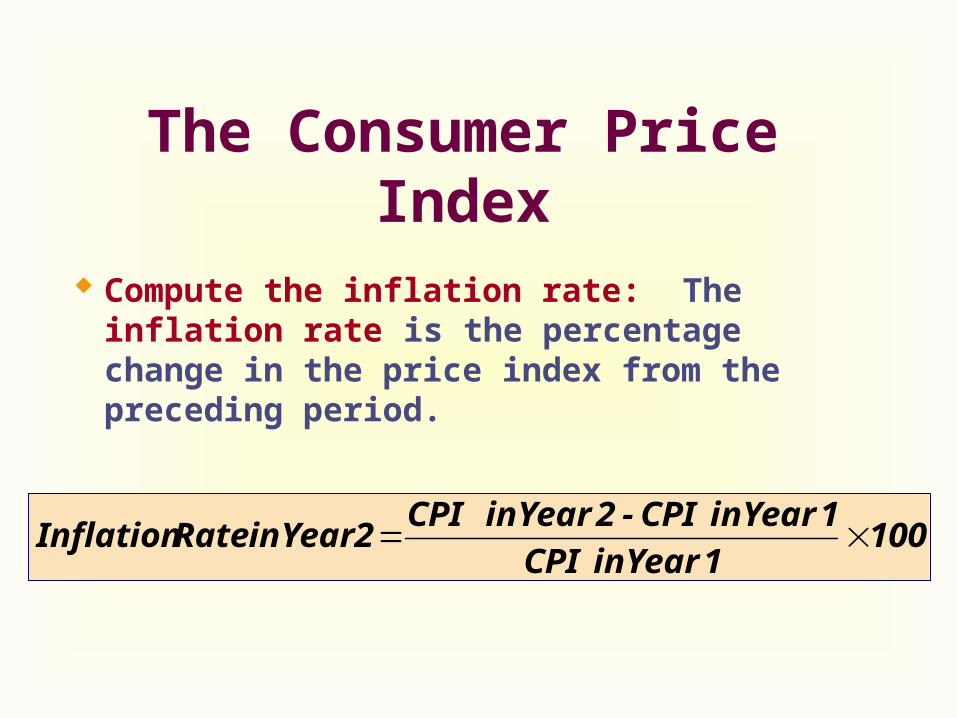
Compute the inflation rate: The inflation rate is the percentage change in the price index from the preceding period.
1001 Year in CPI
1 Year in CPI - 2Year in CPIYear2 inRate Inflation
The Consumer Price Index: An Example
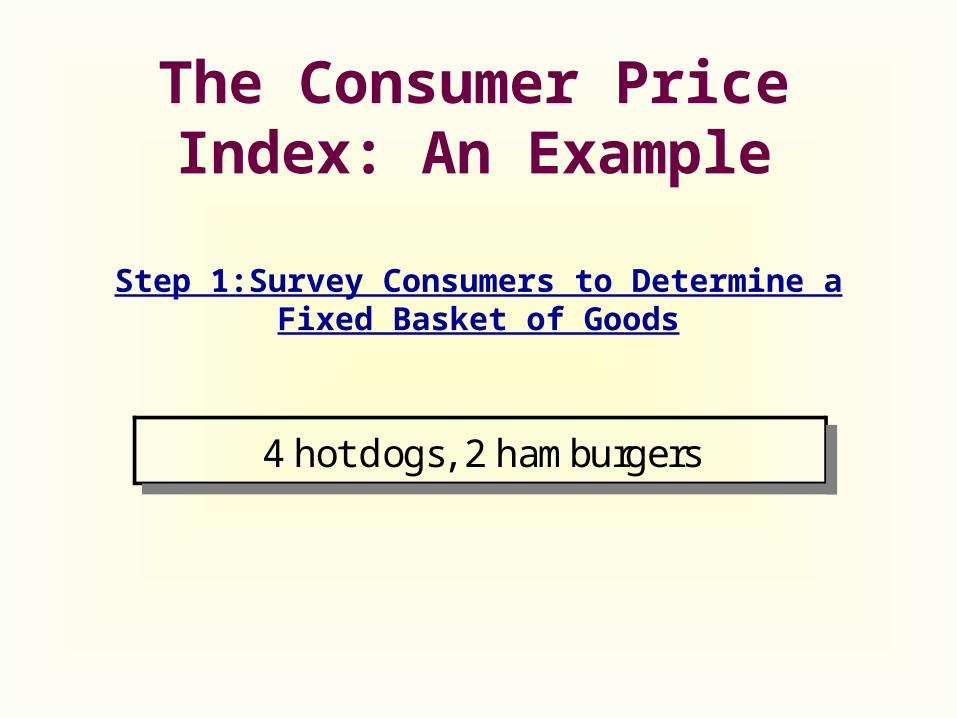
Step 1:Survey Consumers to Determine a Fixed Basket of Goods
4 hot dogs, 2 hamburgers
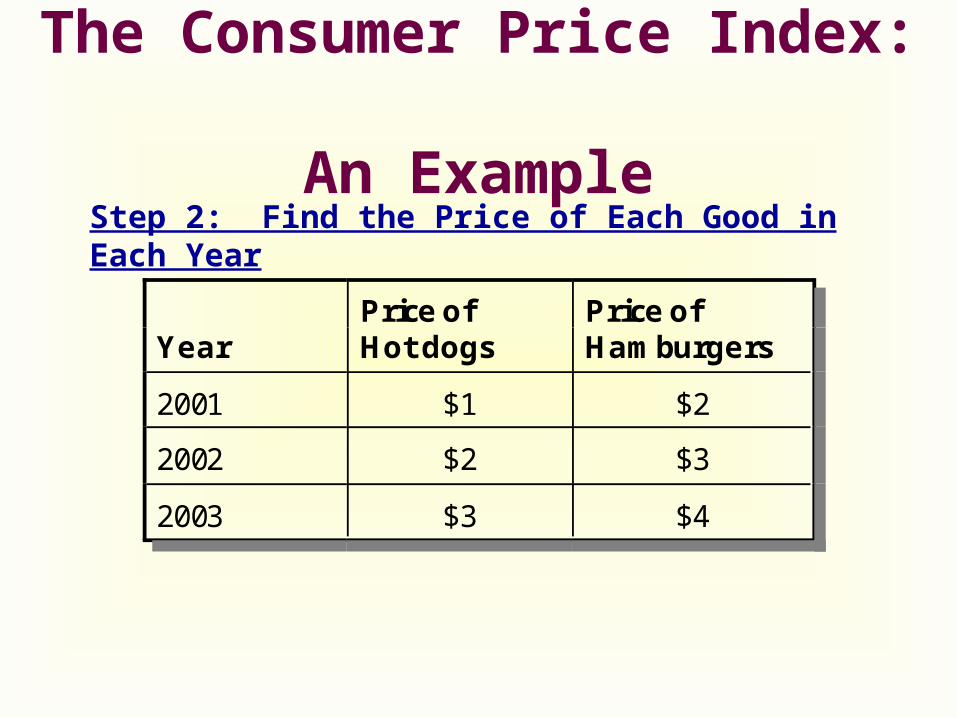
The Consumer Price Index: An Example
YearPrice ofHot dogs
Price of Hamburgers
2001 $1 $2
2002 $2 $3
2003 $3 $4
Step 2: Find the Price of Each Good in Each Year
The Consumer Price Index:An Example
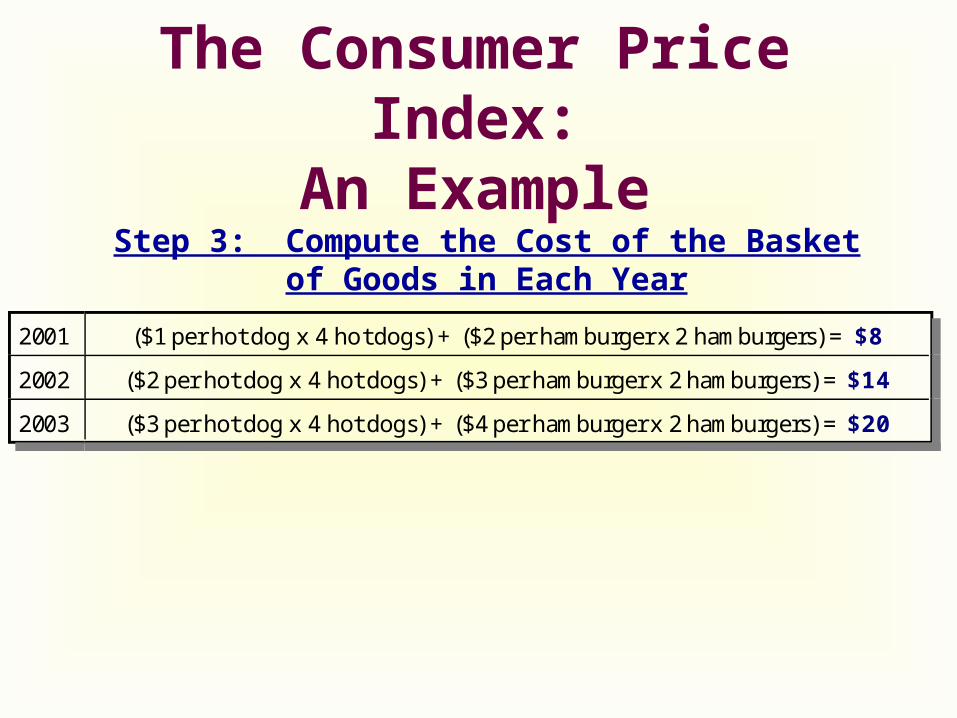
2001 ($1 per hot dog x 4 hot dogs) + ($2 per hamburger x 2 hamburgers) = $8
2002 ($2 per hot dog x 4 hot dogs) + ($3 per hamburger x 2 hamburgers) = $14
2003 ($3 per hot dog x 4 hot dogs) + ($4 per hamburger x 2 hamburgers) = $20
Step 3: Compute the Cost of the Basket of Goods in Each Year
The Consumer Price Index:An Example
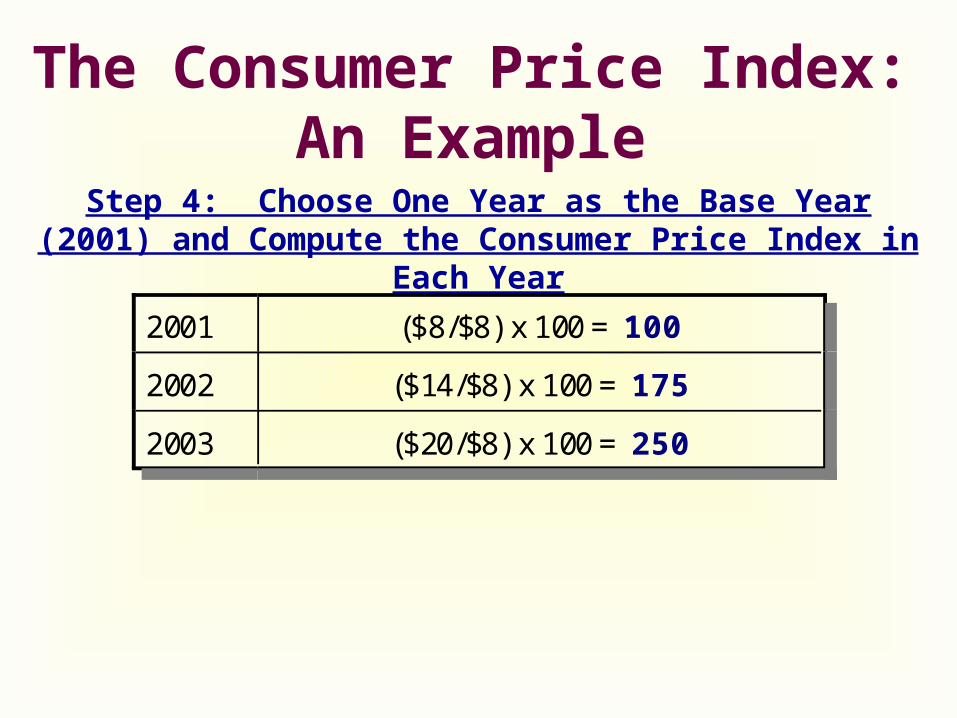
Step 4: Choose One Year as the Base Year (2001) and Compute the Consumer Price Index in Each Year
2001 ($8/$8) x 100 = 100
2002 ($14/$8) x 100 = 175
2003 ($20/$8) x 100 = 250
The Consumer Price Index:An Example
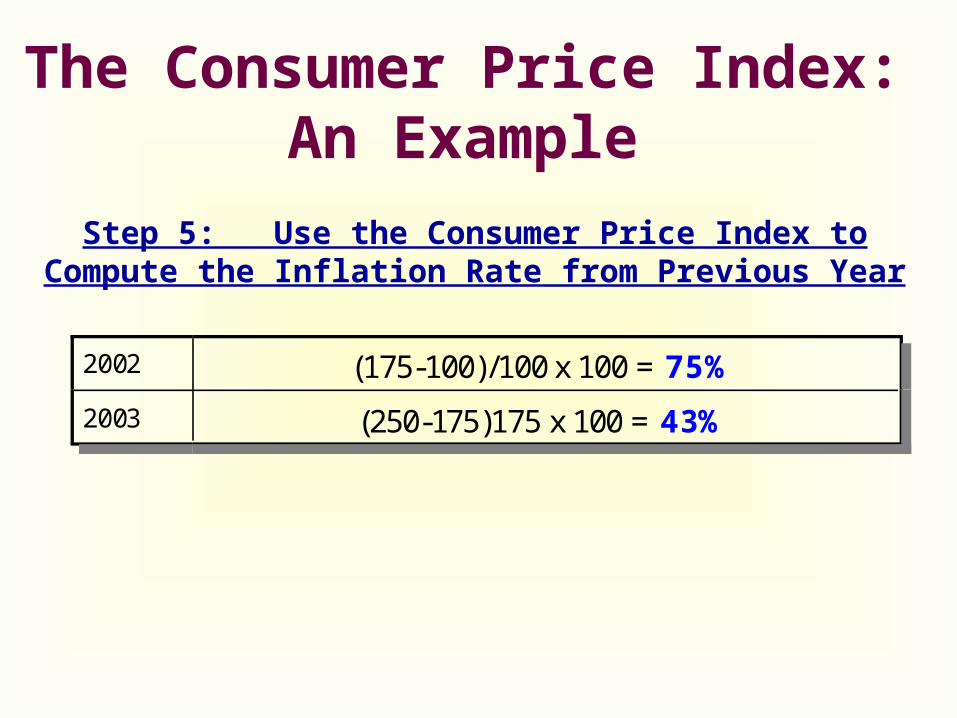
2002 (175-100)/100 x 100 = 75%
2003 (250-175)175 x 100 = 43%
Step 5: Use the Consumer Price Index to Compute the Inflation Rate from Previous Year
The Consumer Price Index: Another Example
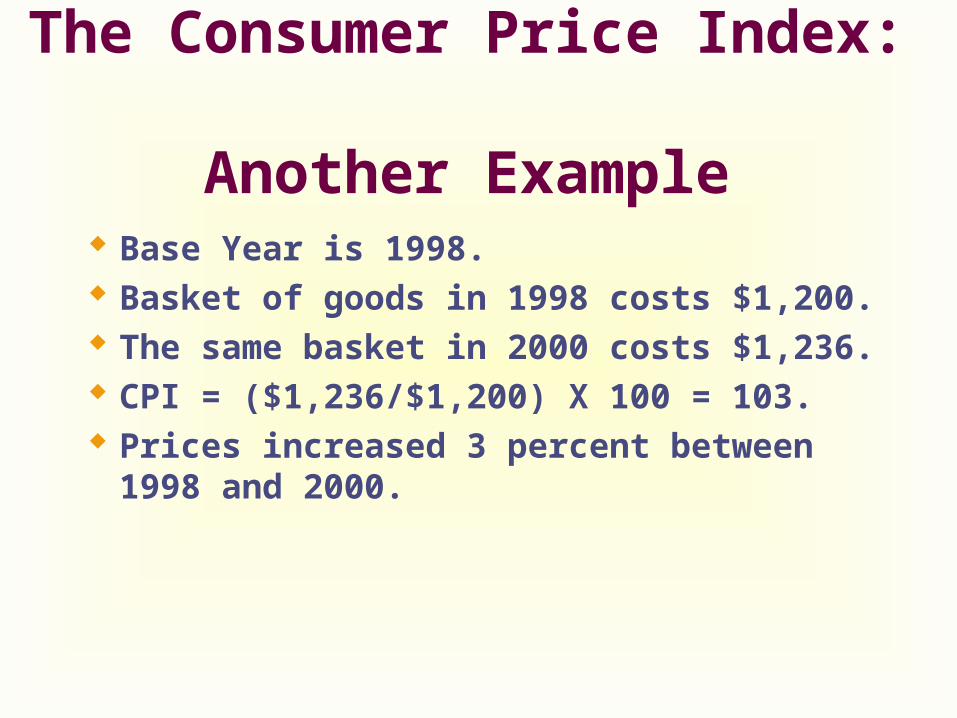
Base Year is 1998. Basket of goods in 1998 costs $1,200. The same basket in 2000 costs $1,236. CPI = ($1,236/$1,200) X 100 = 103. Prices increased 3 percent between 1998
and 2000.
Problems with CPI
The CPI is an accurate measure of the selected goods that make up the typical bundle, but it is not a perfect measure of the cost of living.
Problems with CPI
Substitution bias Introduction of new goods Unmeasured quality changes
Substitution Bias
The basket does not change to reflect consumer reaction to changes in relative prices. Consumers substitute toward goods that
have become relatively less expensive. The index overstates the increase in cost of
living by not considering consumer substitution.
Introduction of New Goods
The basket does not reflect the change in purchasing power brought on by the introduction of new products. New products result in greater variety,
which in turn makes each dollar more valuable.
Consumers need fewer dollars to maintain any given standard of living.
Unmeasured Quality Changes
If the quality of a good rises (falls) from one year to the next, the value of a dollar rises (falls), even if the price of the good stays the same.
The BLS tries to adjust the price for constant quality, but such differences are hard to measure.
Problems with CPI
The substitution bias, introduction of new goods, and unmeasured quality changes cause the CPI to overstate the true cost of living. The issue is important because many government
programs use the CPI to adjust for changes in the overall level of prices.
The CPI overstates inflation by about 1 percentage point per year.
GDP Deflator
The GDP deflator measures the current level of prices relative to the level of prices in the base year.
It tells us the rise in nominal GDP that is attributable to a rise in prices rather than a rise in the quantities produced.
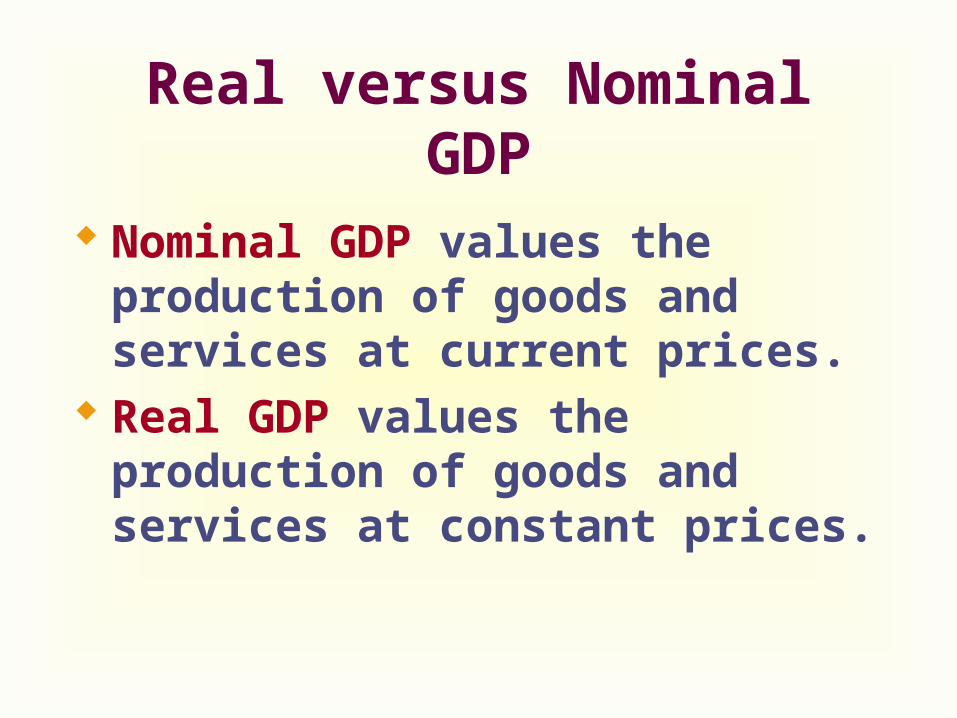
Real versus Nominal GDP
Nominal GDP values the production of goods and services at current prices.
Real GDP values the production of goods and services at constant prices.
GDP Deflator
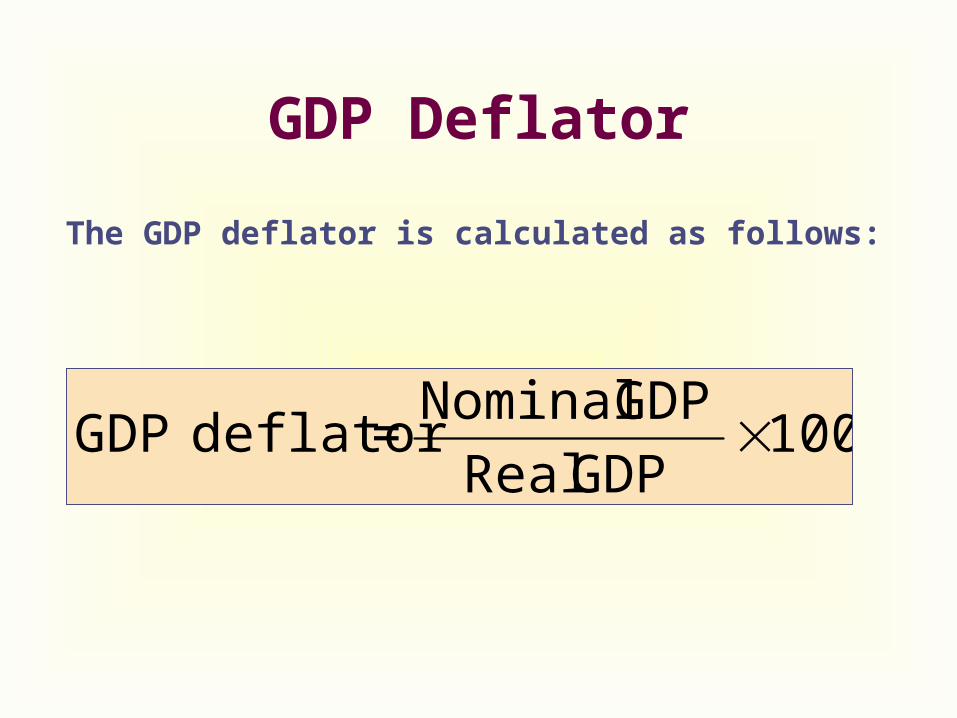
100GDP Real
GDP Nominal=deflator GDP
The GDP deflator is calculated as follows:
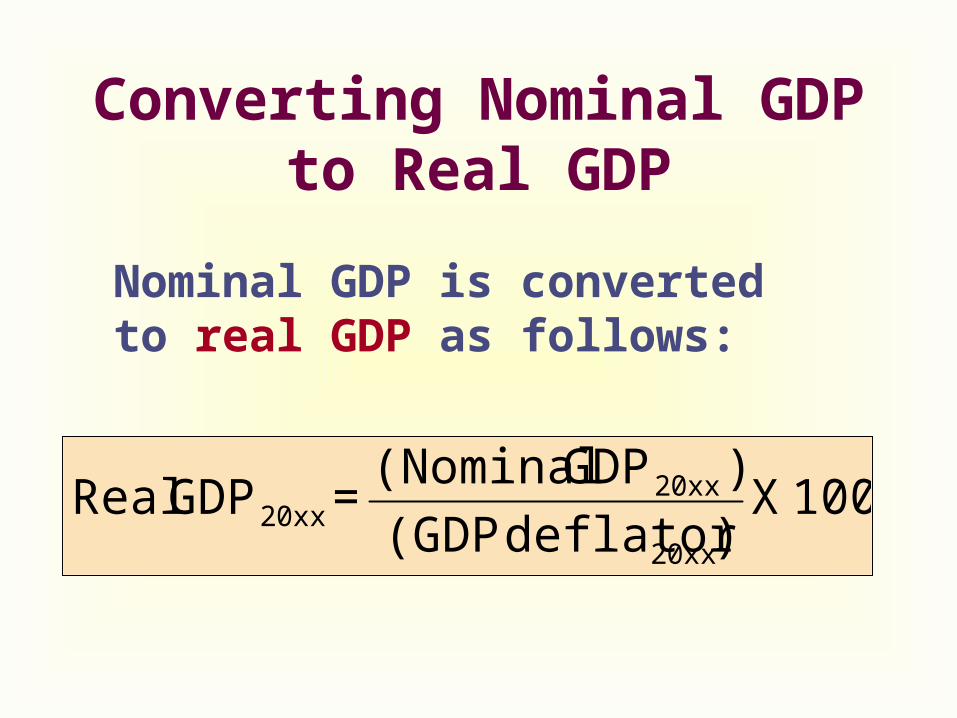
100 X)deflator (GDP
) GDP (Nominal =GDP Real
20xx
20xx20xx
Converting Nominal GDP to Real GDP
Nominal GDP is converted to real GDP as follows:
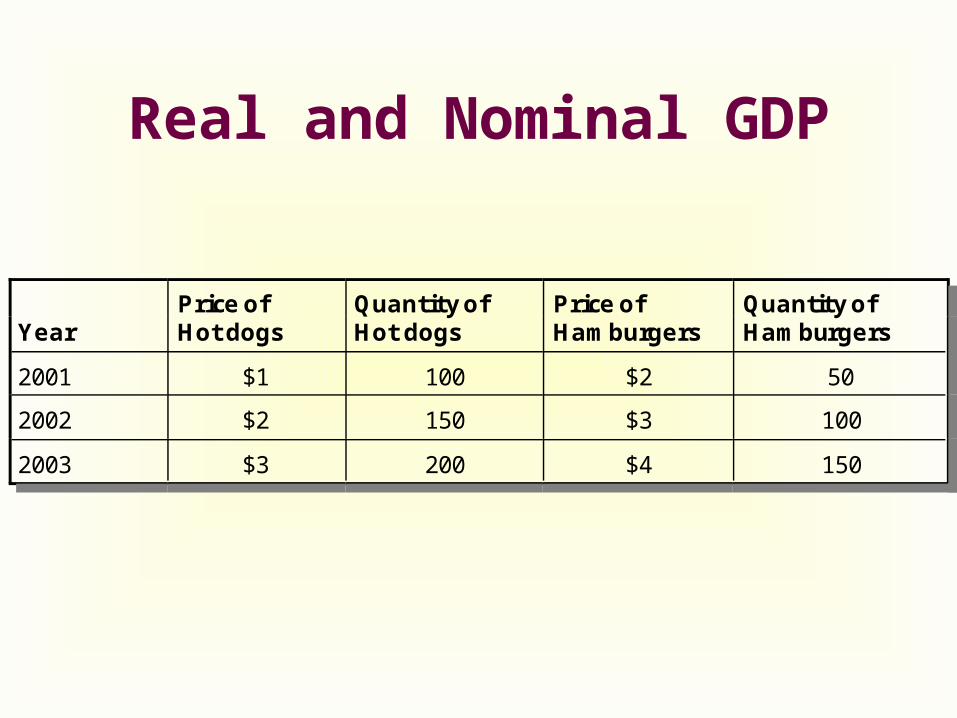
Real and Nominal GDP
YearPrice ofHot dogs
Quantity ofHot dogs
Price of Hamburgers
Quantity ofHamburgers
2001 $1 100 $2 50
2002 $2 150 $3 100
2003 $3 200 $4 150
Real and Nominal GDP
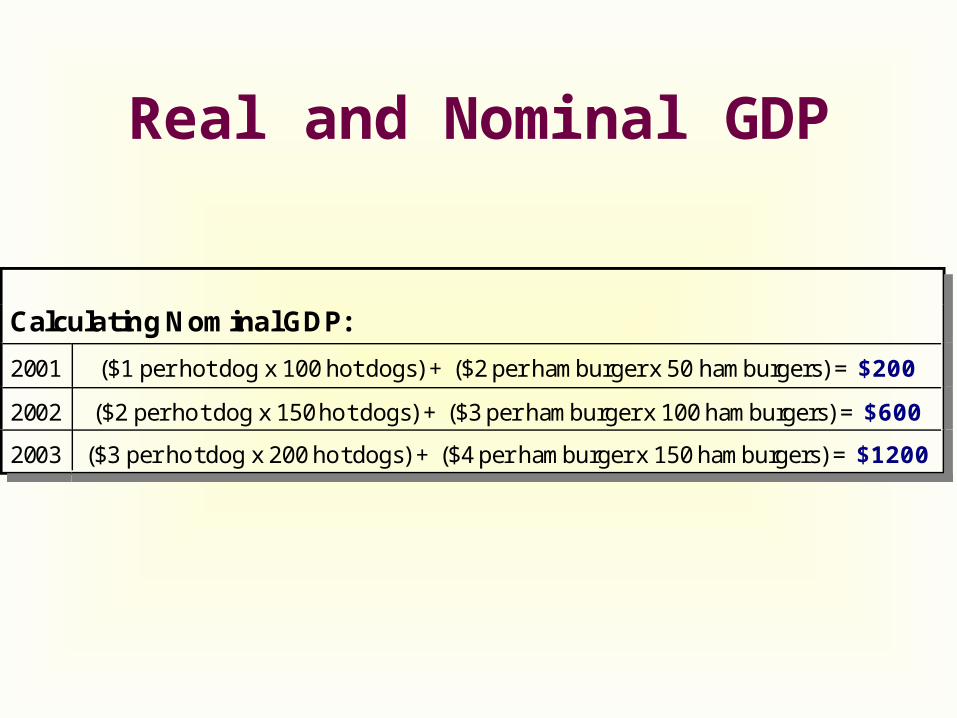
Calculating Nominal GDP:
2001 ($1 per hot dog x 100 hot dogs) + ($2 per hamburger x 50 hamburgers) = $200
2002 ($2 per hot dog x 150 hot dogs) + ($3 per hamburger x 100 hamburgers) = $600
2003 ($3 per hot dog x 200 hot dogs) + ($4 per hamburger x 150 hamburgers) = $1200
Real and Nominal GDP
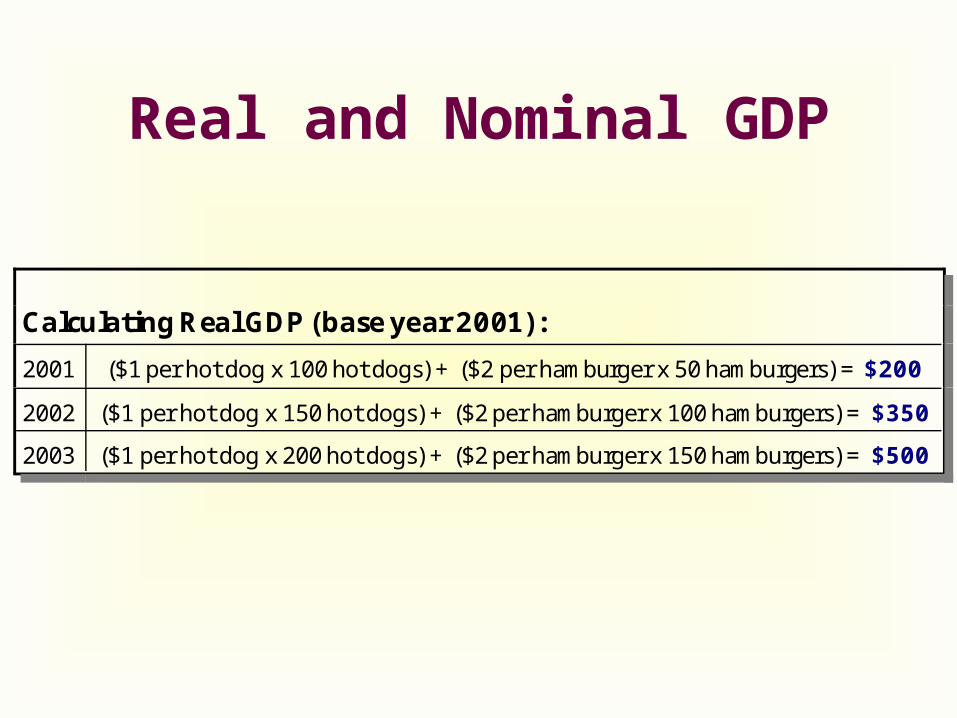
Calculating Real GDP (base year 2001):
2001 ($1 per hot dog x 100 hot dogs) + ($2 per hamburger x 50 hamburgers) = $200
2002 ($1 per hot dog x 150 hot dogs) + ($2 per hamburger x 100 hamburgers) = $350
2003 ($1 per hot dog x 200 hot dogs) + ($2 per hamburger x 150 hamburgers) = $500
Real and Nominal GDP
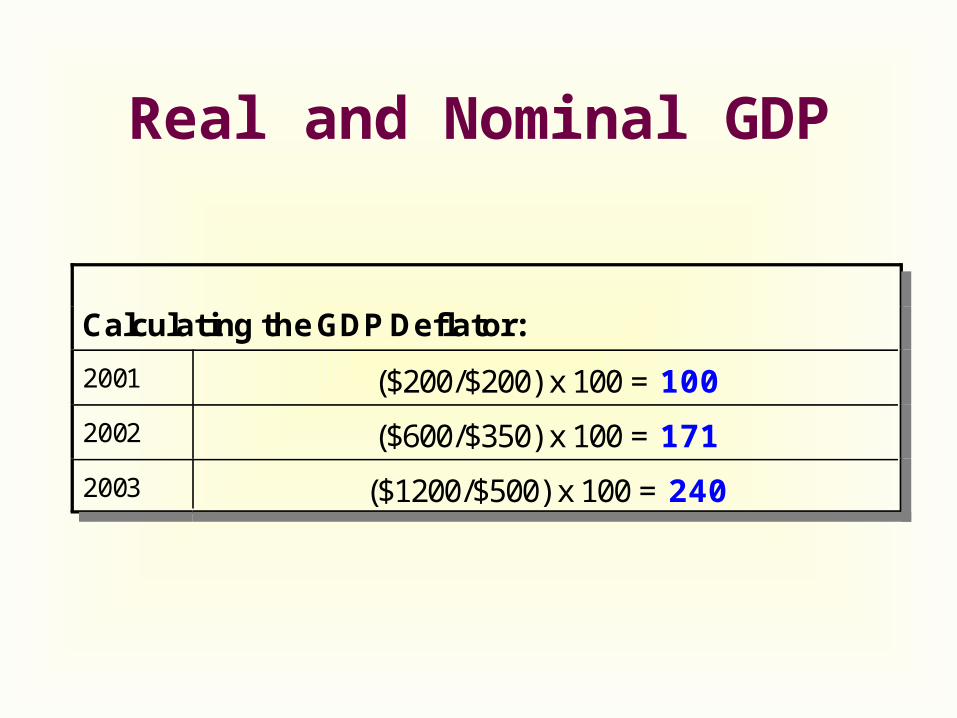
Calculating the GDP Deflator:
2001 ($200/$200) x 100 = 100
2002 ($600/$350) x 100 = 171
2003 ($1200/$500) x 100 = 240
CPI vs. GDP Deflator
Economists and policymakers monitor both the GDP deflator and the consumer price index to gauge how quickly prices are rising, but the results of the two indexes often differ.
There are two important differences between the indexes that can cause them to diverge.
CPI vs. GDP Deflator
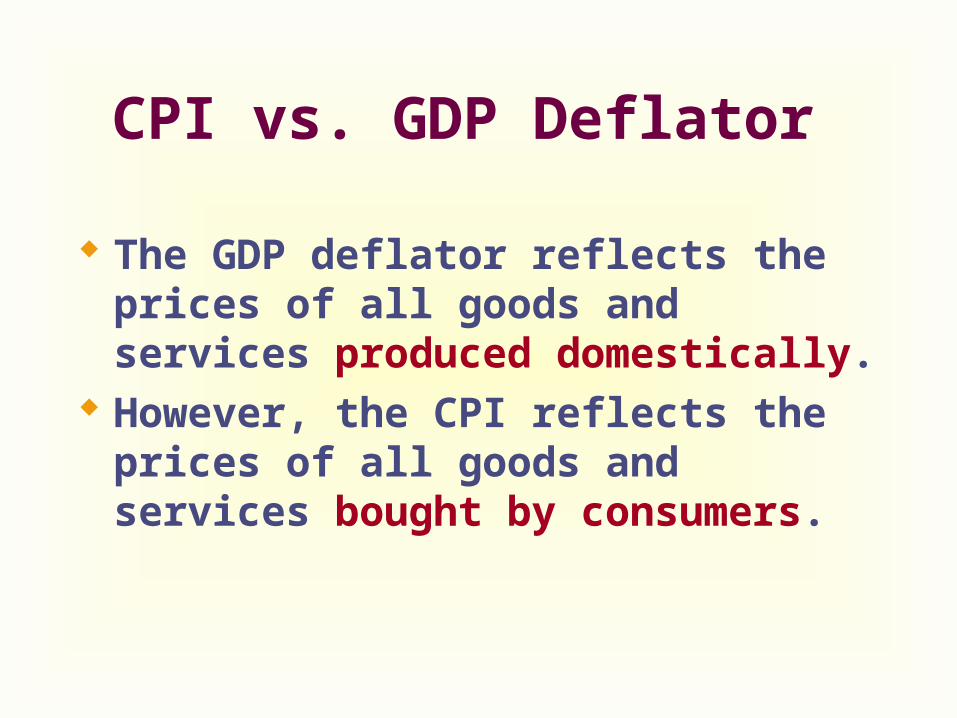
The GDP deflator reflects the prices of all goods and services produced domestically.
However, the CPI reflects the prices of all goods and services bought by consumers.
CPI vs. GDP Deflator
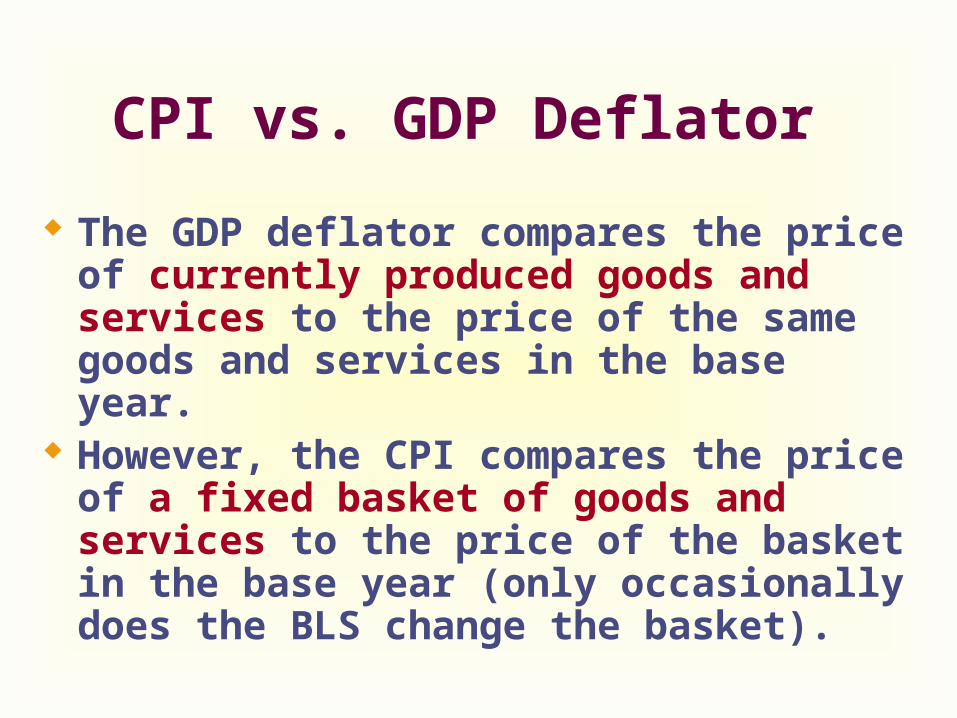
The GDP deflator compares the price of currently produced goods and services to the price of the same goods and services in the base year.
However, the CPI compares the price of a fixed basket of goods and services to the price of the basket in the base year (only occasionally does the BLS change the basket).
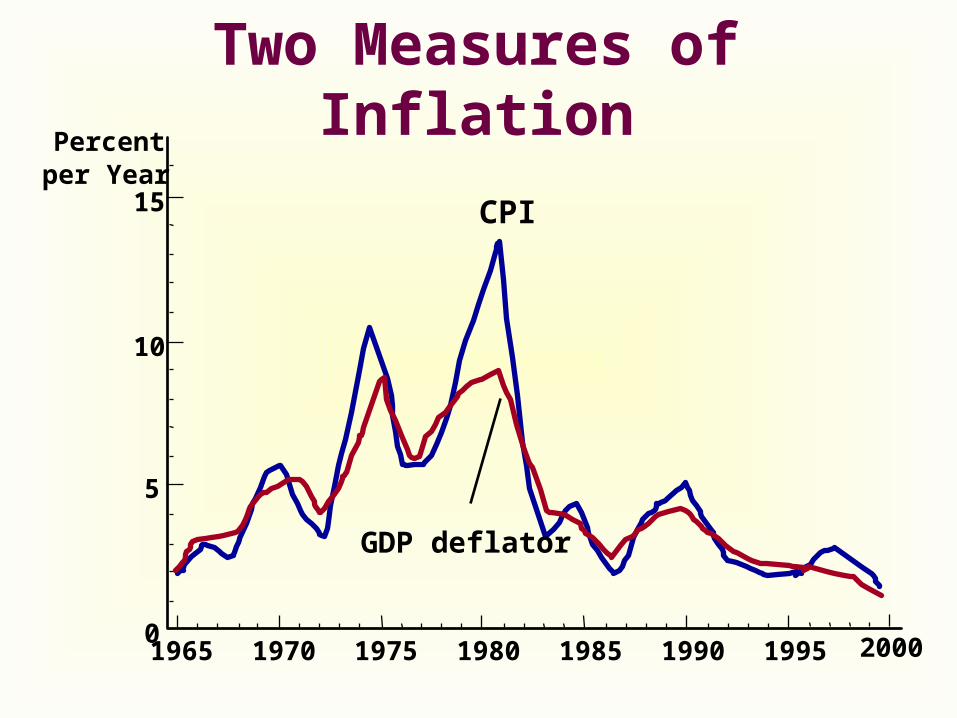
1965
Percentper Year
15
10
5
01970 1975 1980 1985 1990 1995 2000
CPI
Two Measures of Inflation
GDP deflator
Producer Price Index
The producer price index (PPI), which measures the cost of a basket of goods and services bought by firms rather than consumers.
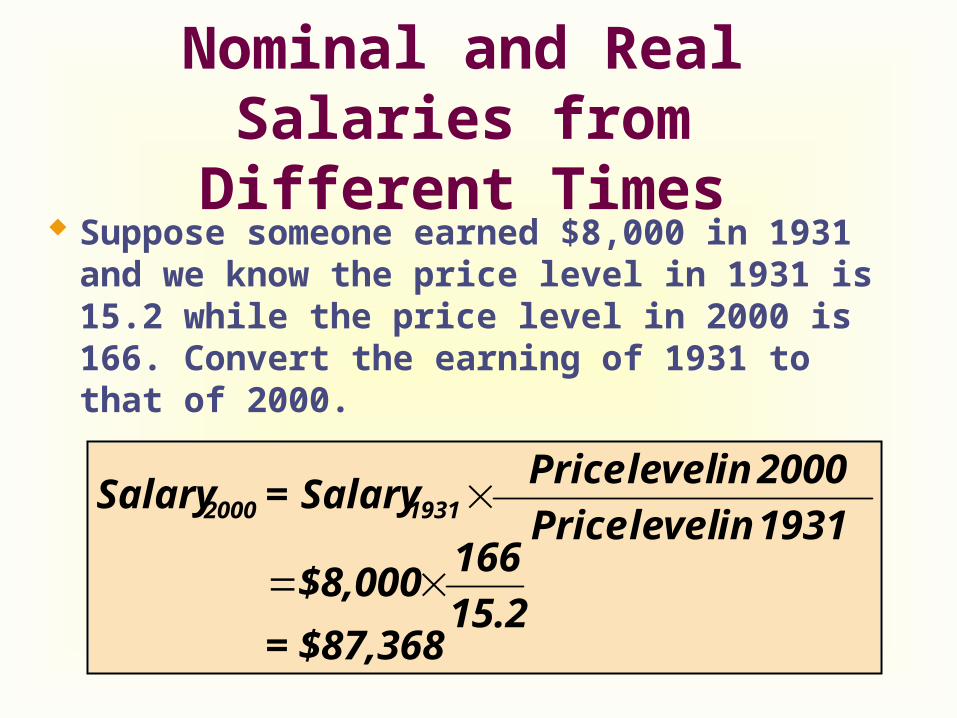
Nominal and Real Salaries from Different Times
Suppose someone earned $8,000 in 1931 and we know the price level in 1931 is 15.2 while the price level in 2000 is 166. Convert the earning of 1931 to that of 2000.
$87,368=15.2
166$8,000
1931 in levelPrice
2000 in levelPrice Salary=Salary 19312000
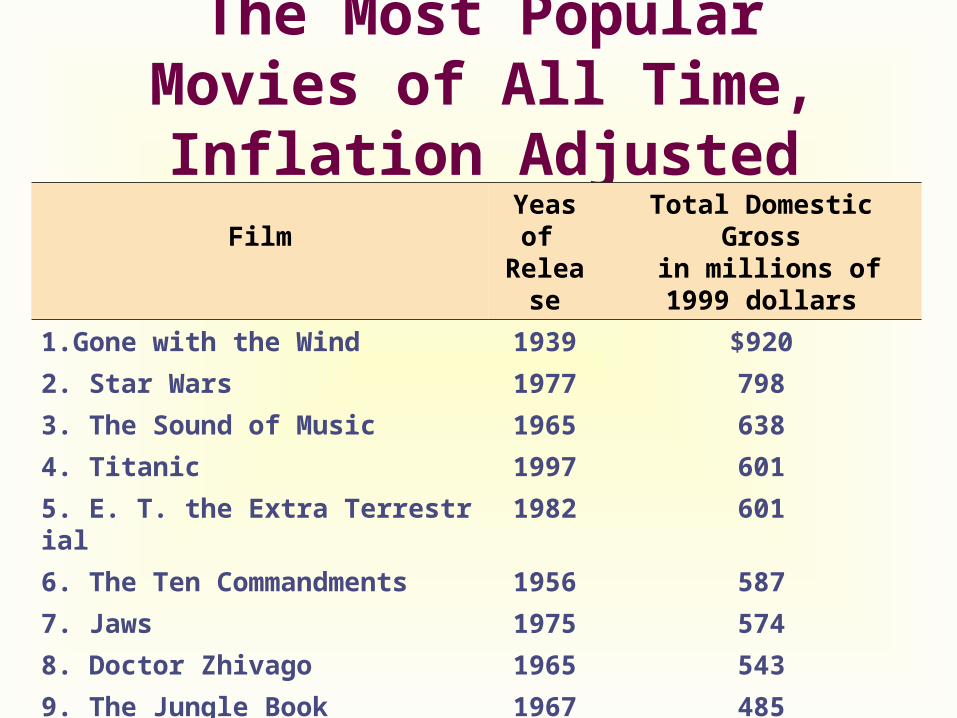
The Most Popular Movies of All Time, Inflation Adjusted
FilmYeas of Release
Total Domestic Gross in millions of 1999 dollars
1.Gone with the Wind 1939 $920
2. Star Wars 1977 798
3. The Sound of Music 1965 638
4. Titanic 1997 601
5. E. T. the Extra Terrestrial 1982 601
6. The Ten Commandments 1956 587
7. Jaws 1975 574
8. Doctor Zhivago 1965 543
9. The Jungle Book 1967 485
10. Snow White and the Seven Dwarfs 1937 476
AS and AD Curves
The aggregate demand curve (AD) shows the quantity of goods and services that households, firms, and the government want to buy at each price level.
The aggregate supply curve (AS) shows the quantity of goods and services that firms produce and sell at each price level.
AS and AD Curves
Aggregate demand is equal to aggregate expenditure, so:
AD= C + I + G + NX
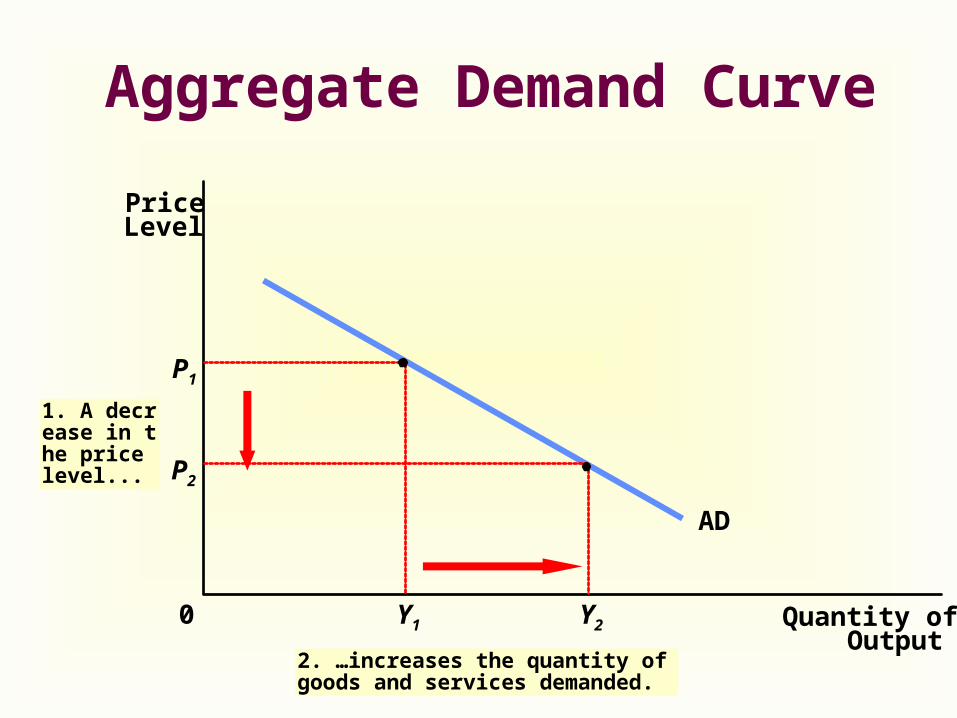
Aggregate Demand Curve
Quantity ofOutput
PriceLevel
0
AD
P1
Y1 Y2
P2
2. …increases the quantity of goods and services demanded.
1. A decrease in the price level...
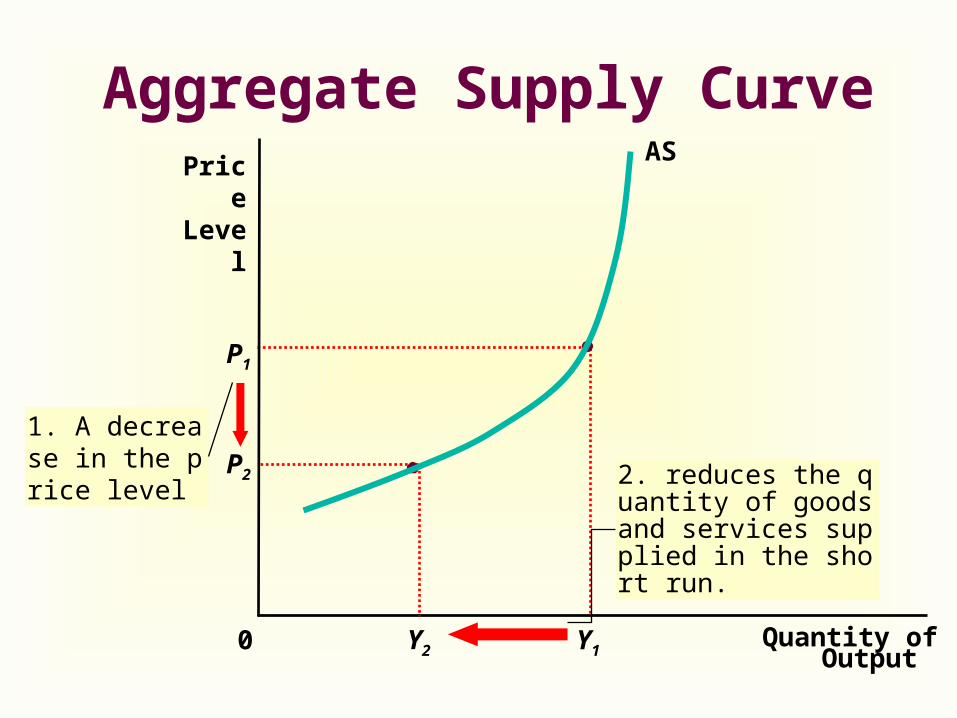
Aggregate Supply Curve
Quantity ofOutput
Price Leve
l
0
AS
Y1
P1
Y2
2. reduces the quantity of goods and services supplied in the short run.
P2
1. A decrease in the price level
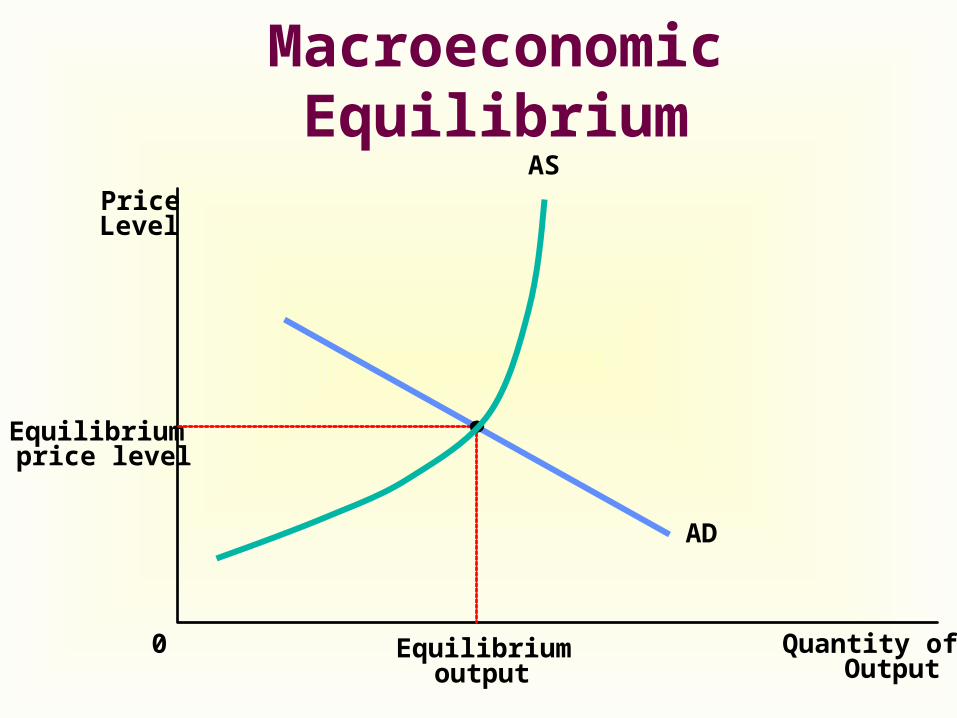
Macroeconomic Equilibrium
Quantity ofOutput
PriceLevel
0
AS
AD
Equilibriumoutput
Equilibriumprice level
Increased AD
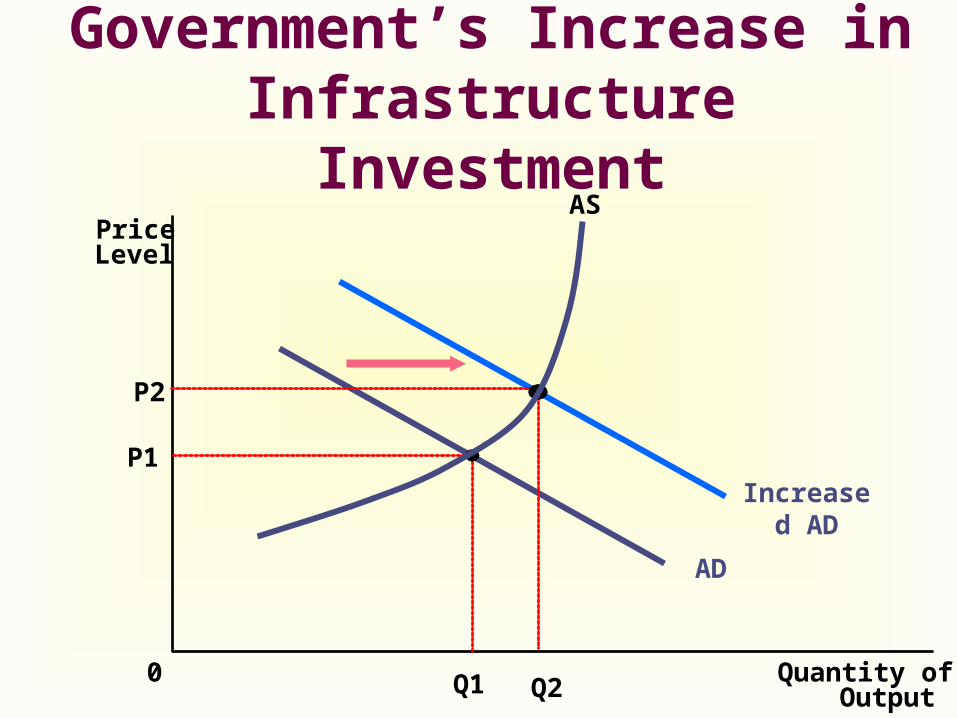
Government’s Increase in Infrastructure Investment
Quantity ofOutput
PriceLevel
0
AS
P1
Q2
P2
AD
Q1

Government’s Increase in Infrastructure Investment
The government’s increase in infrastructure investment leads to an increase in AD for government purchase (G) is part of AD.
The AD increase means a higher price level and a greater output.
Increased AS
RMB Value Remains ConstantDuring Asian Financial Crisis
Quantity ofOutput
PriceLevel
0
AS
P1
AD
Q1
Decreased ADP3
Q3Q2
P2
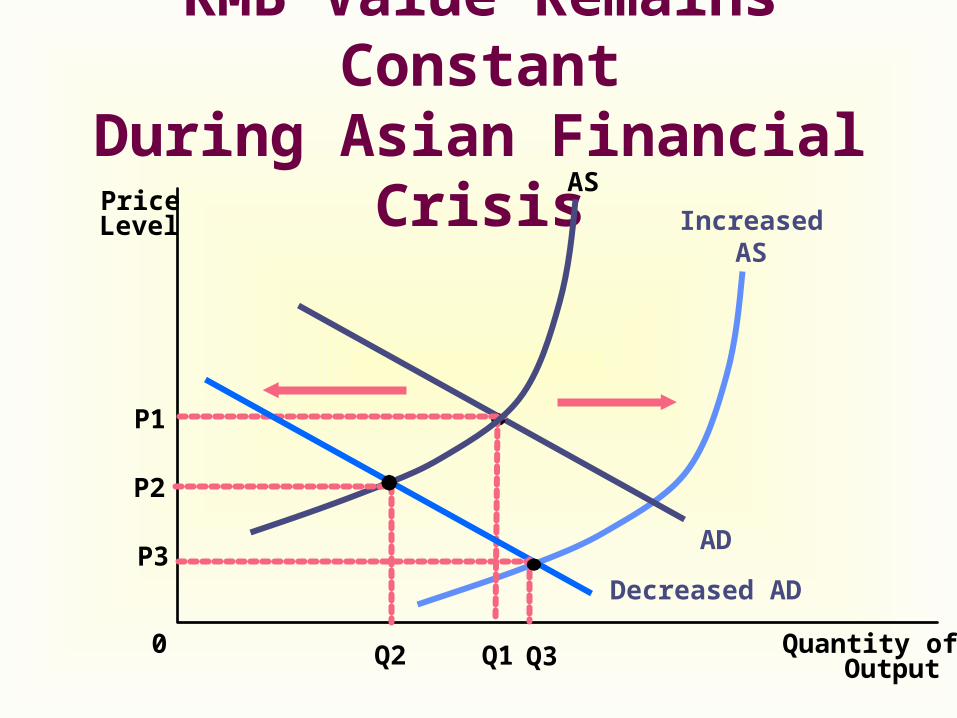
RMB Value Remains ConstantDuring Asian Financial Crisis
In the Asian financial crisis of 1997, many countries currencies depreciated.
Since the RMB value remains constant, the Chinese goods became relatively more expensive those those of its neighbors.
China’s export was negatively affected and the NX decreased, so the AD curve shifts left, which means a lower price level and less output.
RMB Value Remains ConstantDuring Asian Financial Crisis
Since some inputs of Chinese firms are imported from other Asian countries, so the firms production costs decreased.
With the cost decrease, the AS curve shifts right, which means a even lower price level.
Assignment
Review Chapter 20 and 21.Answer questions on P389 and 410.Search for information on China’s GDP
in recent years and its prospect in the future.
Preview Chapter 22, 23, 24.

Thanks