Embed Size (px)
Citation preview
Mathematics TEKS Refinement 2006 – 6-8 Tarleton State University
Probability and Statistics Grade 7 What’s the Difference? Page 1
Probability and Statistics Activity: What’s the Difference? TEKS: (7.10) Probability and statistics. The student recognizes that a physical
or mathematical model can be used to describe the experimental and theoretical probability of real-life events.
The student is expected to: (B) find the probability of independent events. (7.11) Probability and statistics. The student understands that the way a
set of data is displayed influences its interpretation. The student is expected to: (A) select and use an appropriate representation for presenting and
displaying relationships among collected data, including line plot, line graph, bar graph, stem and leaf plot, circle graph, and Venn diagrams, and justify the selection; and
(7.13) Underlying processes and mathematical tools. The student
applies Grade 7 mathematics to solve problems connected to everyday experiences, investigations in other disciplines, and activities in and outside of school.
The student is expected to: (A) identify and apply mathematics to everyday experiences, to
activities in and outside of school, with other disciplines, and with other mathematical topics;
Overview: This lesson gives students the opportunity to work with familiar objects
(number cubes) to answer something other than the usual question about possible sums of the numbers on top when the cubes are tossed. After playing the game, Remove One, students compute the experimental probability for each difference. Then students study a sample space and compute the theoretical probabilities. The lesson ends with a discussion about the differences between experimental and theoretical probability. Remove One was adapted from a PBS Teacher Source Mathline lesson of the same name.
Materials: Transparencies 1-4
Transparencies of Handouts 1 & 2 1 pair of number cubes for each pair of students 15 chips per student Handout 1 Remove One for each student Handout 2 Sample Space for each student Paper and pencil for each student TI-73 calculator (Optional)
Mathematics TEKS Refinement 2006 – 6-8 Tarleton State University
Probability and Statistics Grade 7 What’s the Difference? Page 2
Grouping: 2 to 4 students per group Time: 90 minutes Lesson:
Procedures Notes 1. (5 minutes) Use Transparency 1 to
introduce the lesson. Give students about one minute to think about the possible differences between the two numbers on top of the number cubes. Then allow them time to discuss their thoughts with their partner before having a whole group discussion.
Use questions similar to the following ones to help students share their thinking about the possible differences. What would be the smallest possible difference? How do you know? What would be the largest possible difference? How do you know?
2. (15 minutes) Use Transparency 2 and a transparency of Handout 1 to introduce the game, Remove One. Give each student 15 chips and Handout 1 Remove One. Explain that they may place their chips anywhere on the number line. Once the students have their chips in place, toss the number cubes, call out the two numbers and ask students for the difference. The first student to remove all of his or her chips is the winner and the game is over.
Briefly discuss with students how the game will be played. Do one or two tosses to model the procedure before beginning the game. Keep a record of the all differences tossed to use to analyze the game in the next step.
3. (10-15 minutes) Call out the differences which were tossed and have students place an x on their number line to construct a line plot to represent the frequency distribution of the differences. Have students use the line plot to compute the experimental probability of each difference.
Possible questions: Which differences occurred most often? Why do you think this happened? What differences occurred least often? Why do you think this happened?
4. (10-15 minutes) Distribute copies of Handout 2 Sample Space or if you prefer, allow students to create one. (If you choose to have them create one, more time will be needed for this section of the lesson.) Have the students compute the theoretical probability of each possible difference.
Possible questions: How many different outcomes are there? Does every outcome produce a different difference? What patterns do you notice? Be sure students understand that
Mathematics TEKS Refinement 2006 – 6-8 Tarleton State University
Probability and Statistics Grade 7 What’s the Difference? Page 3
Procedures Notes (1,2) and (2,1) are different outcomes. Use different colored number cubes to model that a 1 on the “red” cube and a 2 on a “white” cube is different from a 2 on the “red” cube and a 1 on the “white” cube.
5. (10-15 minutes) Allow the students to place their chips on the number line and play the game again.
Possible questions: Will you place your chips on different numbers this time? Why or why not?
6. (10-15 minutes) Record the data from each group on Transparency 3. Use questions like those on Transparency 4 to discuss the differences between the experimental and theoretical probability in this situation. Call attention to the difference between the experimental probabilities of each set of small group data compared to the experimental probability using the whole class data recorded on Transparency 3.
Possible questions: How does the experimental probability of your group data compare to the theoretical probability computed from the sample? How does the experimental probability of the class data compare to the theoretical probability computed from the sample? What would happen if we played Remove One fifty times and recorded the differences? Would the probabilities of each difference come closer to the theoretical probability? Why or why not? Suppose every 6th grade math class in the school played Remove One and we collected all the differences. Would those probabilities come closer to the theoretical probability? Why or why not?
7. (5 minutes) Student Reflection: Which do you think is more reliable – experimental or theoretical probability? Why?
Homework: Suppose we tossed two number cubes and multiplied the two numbers
Mathematics TEKS Refinement 2006 – 6-8 Tarleton State University
Probability and Statistics Grade 7 What’s the Difference? Page 4
on top. Would there be more possible products than there were differences? What are the possible products? Which product would occur most frequently and why? Use a sample space to confirm your answers. Compute the probability of each product. Is the probability of getting an even product greater or less than the probability of getting an odd product? Explain your answer.
Assessment: Suppose we played Remove One again, but this time we computed
the sum of the two numbers on top. How would you line up your chips on your number line to be a winner? Explain your answer.
Extensions: 1. Have each pair of students use the Dice feature of the TI-73 to
generate 25 tosses and record the difference for each toss. Have students compute the probability of each difference based on the 25 tosses. Discuss how these experimental probabilities compare to the theoretical probability computed from their sample spaces. Collect the outcomes for all groups and compute the probability of each difference again based on this larger set of data. Discuss how these probabilities compare to the probabilities generated from 25 tosses and to the theoretical probability from the sample spaces.
2. Create a circle graph to represent the theoretical probability of the
possible differences. Resources: What are the chances? (http://nces.ed.gov/nceskids/probability/)
This website allows students to choose the number of times the die will roll and then shows the student a bar graph of the outcomes. There is a link to an explanation of probability.
Mathematics TEKS Refinement 2006 – 6-8 Tarleton State University
Probability and Statistics Grade 7 What’s the Difference? Page 5
What’s the Difference?
Suppose you toss a pair of number cubes and compute the difference between the two numbers on top. What are the possible answers? Transparency 1
Mathematics TEKS Refinement 2006 – 6-8 Tarleton State University
Probability and Statistics Grade 7 What’s the Difference? Page 6
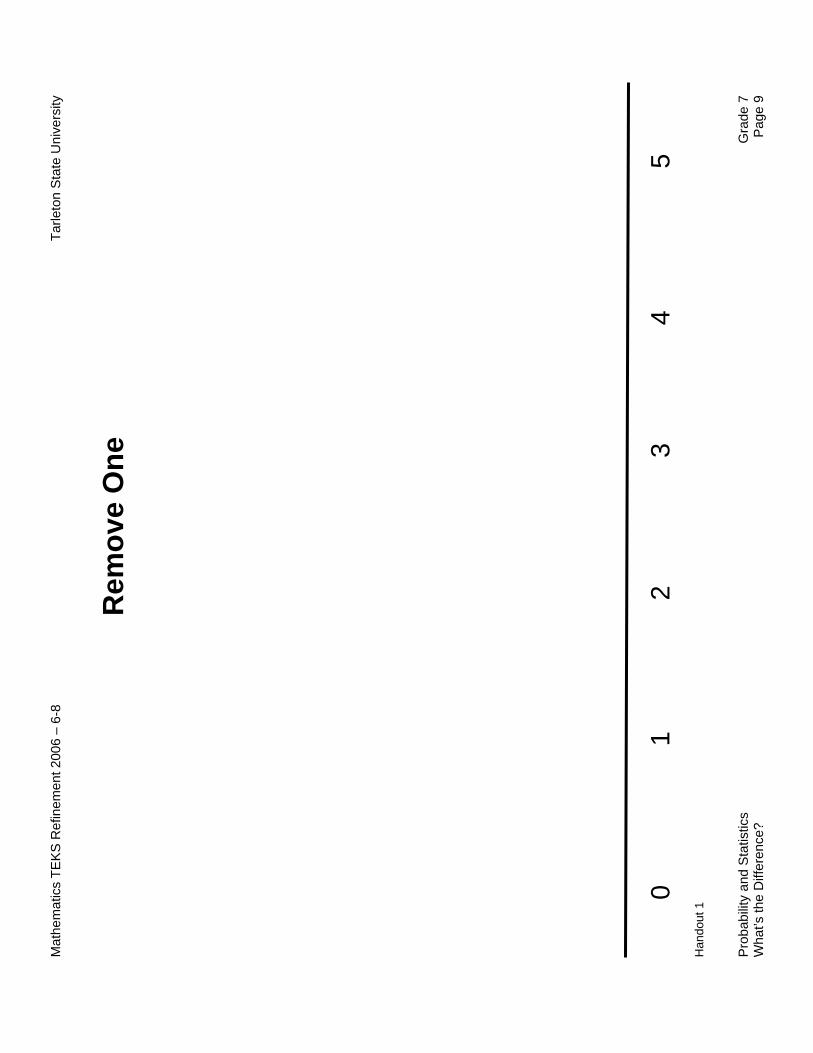
Remove One
Place your 15 chips anywhere on the number line. You may remove a chip if it is located on the number that represents the resulting difference when the number cubes are tossed. The winner is the first person to remove all the chips from their number line.
Transparency 2
Mathematics TEKS Refinement 2006 – 6-8 Tarleton State University
Probability and Statistics Grade 7 What’s the Difference? Page 7
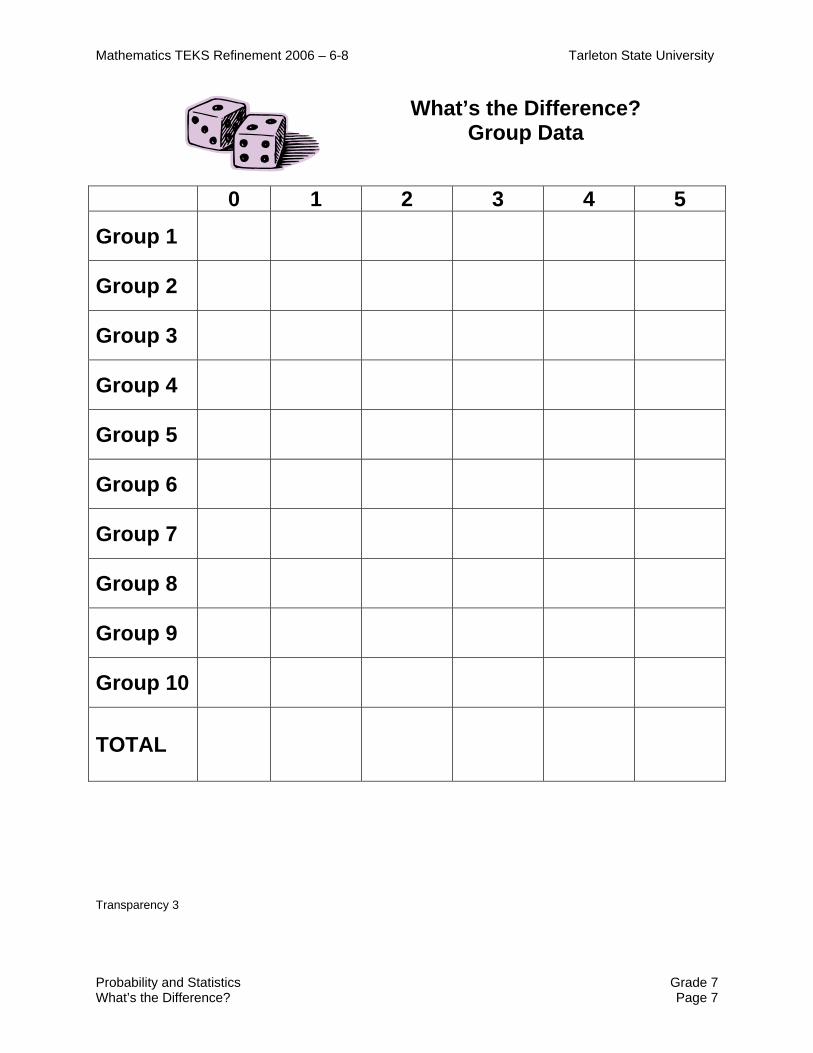
What’s the Difference? Group Data
0 1 2 3 4 5
Group 1
Group 2
Group 3
Group 4
Group 5
Group 6
Group 7
Group 8
Group 9
Group 10
TOTAL
Transparency 3
Mathematics TEKS Refinement 2006 – 6-8 Tarleton State University
Probability and Statistics Grade 7 What’s the Difference? Page 8
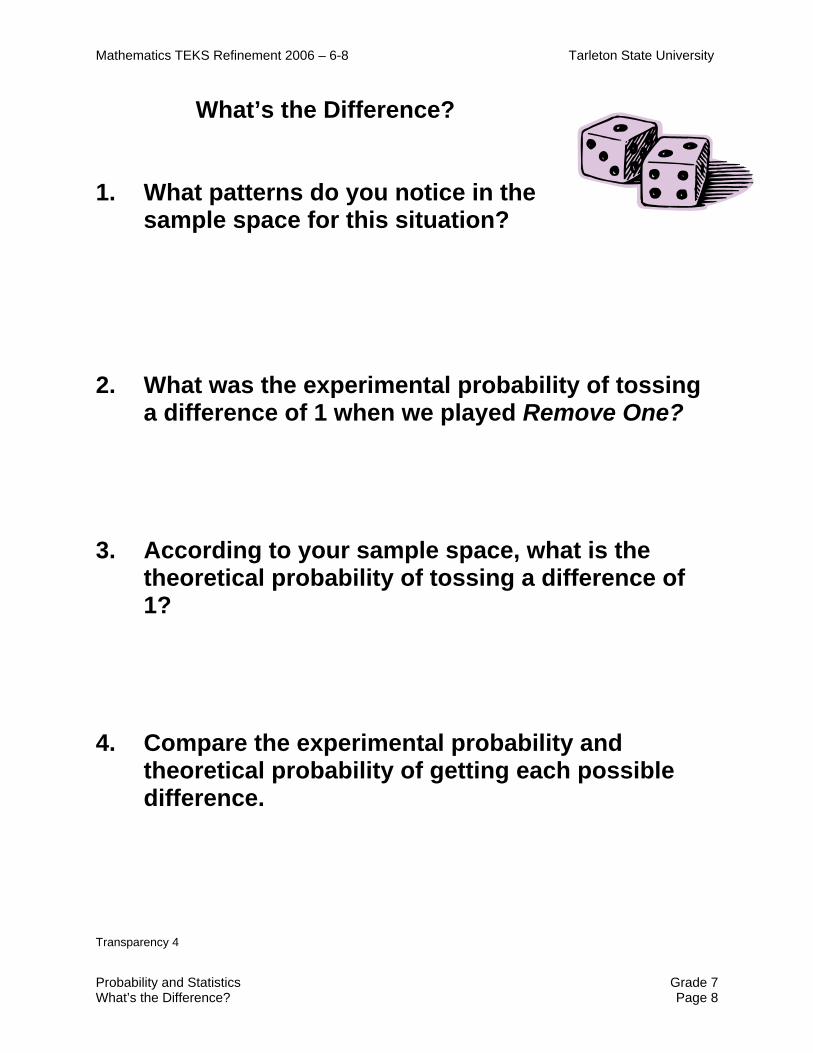
What’s the Difference?
1. What patterns do you notice in the
sample space for this situation? 2. What was the experimental probability of tossing
a difference of 1 when we played Remove One? 3. According to your sample space, what is the
theoretical probability of tossing a difference of 1?
4. Compare the experimental probability and
theoretical probability of getting each possible difference.
Transparency 4
Mat
hem
atic
s TE
KS
Ref
inem
ent 2
006
– 6-
8 Ta
rleto
n S
tate
Uni
vers
ity
Pro
babi
lity
and
Sta
tistic
s G
rade
7
Wha
t’s th
e D
iffer
ence
? P
age
9
Rem
ove
One
Han
dout
1
0 1
23
45
Mathematics TEKS Refinement 2006 – 6-8 Tarleton State University
Probability and Statistics Grade 7 What’s the Difference? Page 10
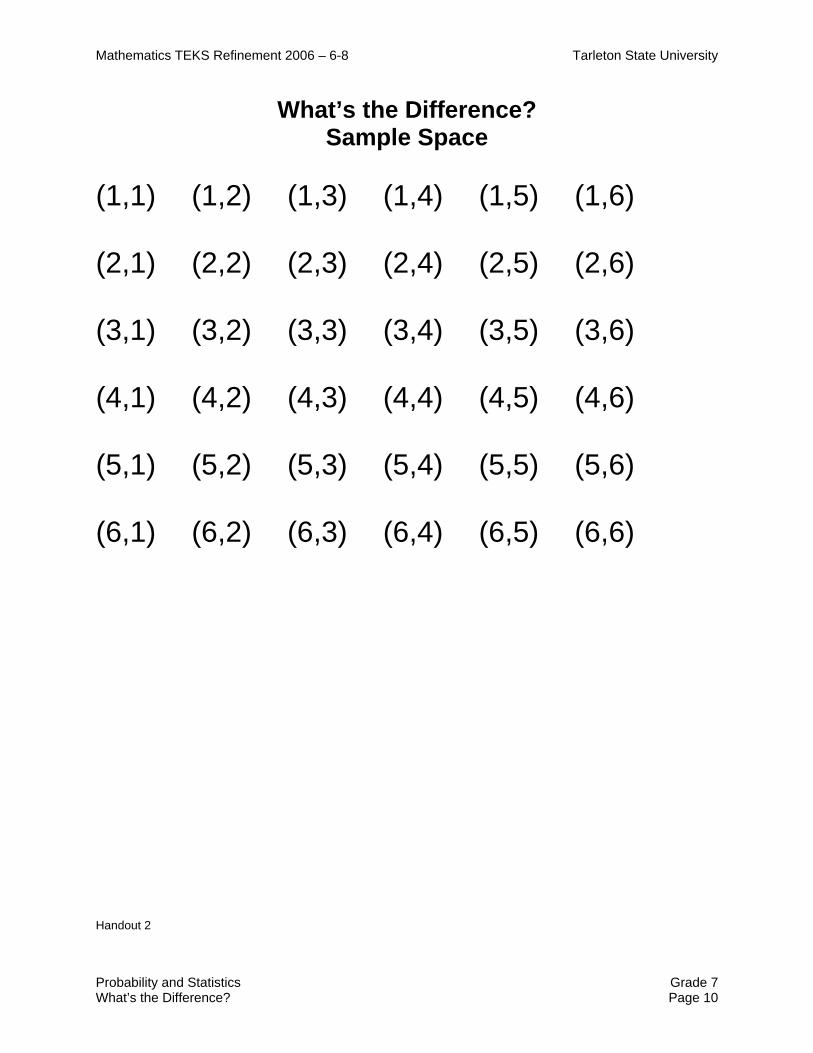
What’s the Difference? Sample Space
(1,1) (1,2) (1,3) (1,4) (1,5) (1,6) (2,1) (2,2) (2,3) (2,4) (2,5) (2,6) (3,1) (3,2) (3,3) (3,4) (3,5) (3,6) (4,1) (4,2) (4,3) (4,4) (4,5) (4,6) (5,1) (5,2) (5,3) (5,4) (5,5) (5,6) (6,1) (6,2) (6,3) (6,4) (6,5) (6,6)
Handout 2


![Probability and Statistics [7th grade]](https://img.pdfslide.net/doc/110x75/62127714f4a585679b2644ec/probability-and-statistics-7th-grade.jpg)


