Embed Size (px)
Citation preview

Product Innovations and Wealth Creation: Evidence from India
Rajesh Kumar Siddaganga Institute of Technology, India
S. M. Satish Indian Institute of Technology, India
This study highlights the value of event study methodology in marketing .We have examined the impact of new product introductions on the market value of firms. The Innovative firms have higher sales, assets, cash flow, market capitalization, R&D, and advertisement intensity, compared to control firms suggesting the superior financial strength of sample firms. The sample firms also show greater profitability compared to control group. The intensity ratios of capex, R&D and advertisement also show statistical significance suggesting that the new product firms are far superior in financial strength compared to control firms. The value of new product announcement as measured by the Cumulative Abnormal Return was statistically significant for firms in sectors like hardware, pharmaceuticals and Automobiles. Using a sample of 328 announcements of new product introductions during the period 2000-2006, this research paper finds that innovators realize a statistically significant five-day abnormal returns of 0.72% centered around the announcement day. The hardware sector also documents significant mean cumulative abnormal return of about 4.6% centered on three-day period. The multivariate analysis shows that firm size is inversely related to the market valuation of new product introductions. The value of innovation was higher for technologically intensive industries. Firms introducing multiple products experience greater wealth creation than those announcing single products. INTRODUCTION Innovation has become a continuous way of life. Product innovation is vital for the success of modern companies in the context of strategic decisions on markets, technologies and products. The significance of new products for the growth and prosperity of modern companies in the context of slow growth markets, heightened competition and maturing products occupies much relevance. It is a known fact that in the era of ever changing markets and technologies only innovators stood the test of time. An analysis of top Fortune 25 firms between 1930 and 1980s reveal that
13
Journal of Applied Business and Economics
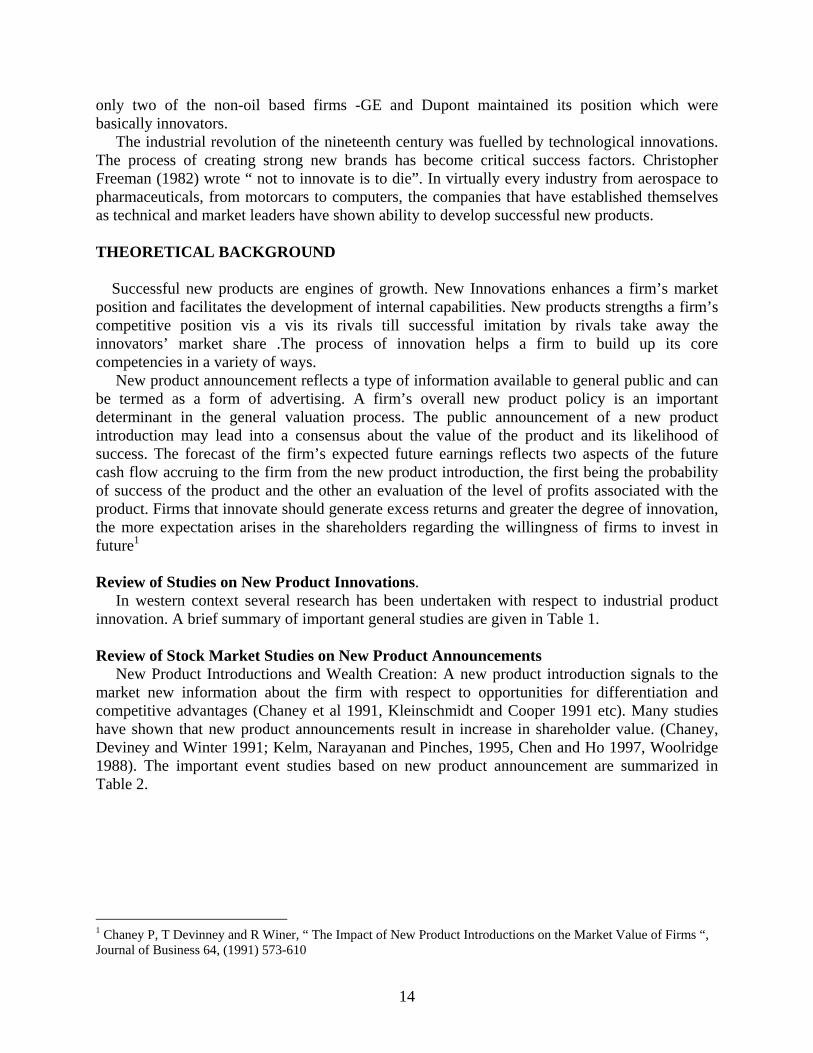
only two of the non-oil based firms -GE and Dupont maintained its position which were basically innovators. The industrial revolution of the nineteenth century was fuelled by technological innovations. The process of creating strong new brands has become critical success factors. Christopher Freeman (1982) wrote “ not to innovate is to die”. In virtually every industry from aerospace to pharmaceuticals, from motorcars to computers, the companies that have established themselves as technical and market leaders have shown ability to develop successful new products. THEORETICAL BACKGROUND Successful new products are engines of growth. New Innovations enhances a firm’s market position and facilitates the development of internal capabilities. New products strengths a firm’s competitive position vis a vis its rivals till successful imitation by rivals take away the innovators’ market share .The process of innovation helps a firm to build up its core competencies in a variety of ways. New product announcement reflects a type of information available to general public and can be termed as a form of advertising. A firm’s overall new product policy is an important determinant in the general valuation process. The public announcement of a new product introduction may lead into a consensus about the value of the product and its likelihood of success. The forecast of the firm’s expected future earnings reflects two aspects of the future cash flow accruing to the firm from the new product introduction, the first being the probability of success of the product and the other an evaluation of the level of profits associated with the product. Firms that innovate should generate excess returns and greater the degree of innovation, the more expectation arises in the shareholders regarding the willingness of firms to invest in future1 Review of Studies on New Product Innovations. In western context several research has been undertaken with respect to industrial product innovation. A brief summary of important general studies are given in Table 1. Review of Stock Market Studies on New Product Announcements New Product Introductions and Wealth Creation: A new product introduction signals to the market new information about the firm with respect to opportunities for differentiation and competitive advantages (Chaney et al 1991, Kleinschmidt and Cooper 1991 etc). Many studies have shown that new product announcements result in increase in shareholder value. (Chaney, Deviney and Winter 1991; Kelm, Narayanan and Pinches, 1995, Chen and Ho 1997, Woolridge 1988). The important event studies based on new product announcement are summarized in Table 2.
1 Chaney P, T Devinney and R Winer, “ The Impact of New Product Introductions on the Market Value of Firms “, Journal of Business 64, (1991) 573-610
14
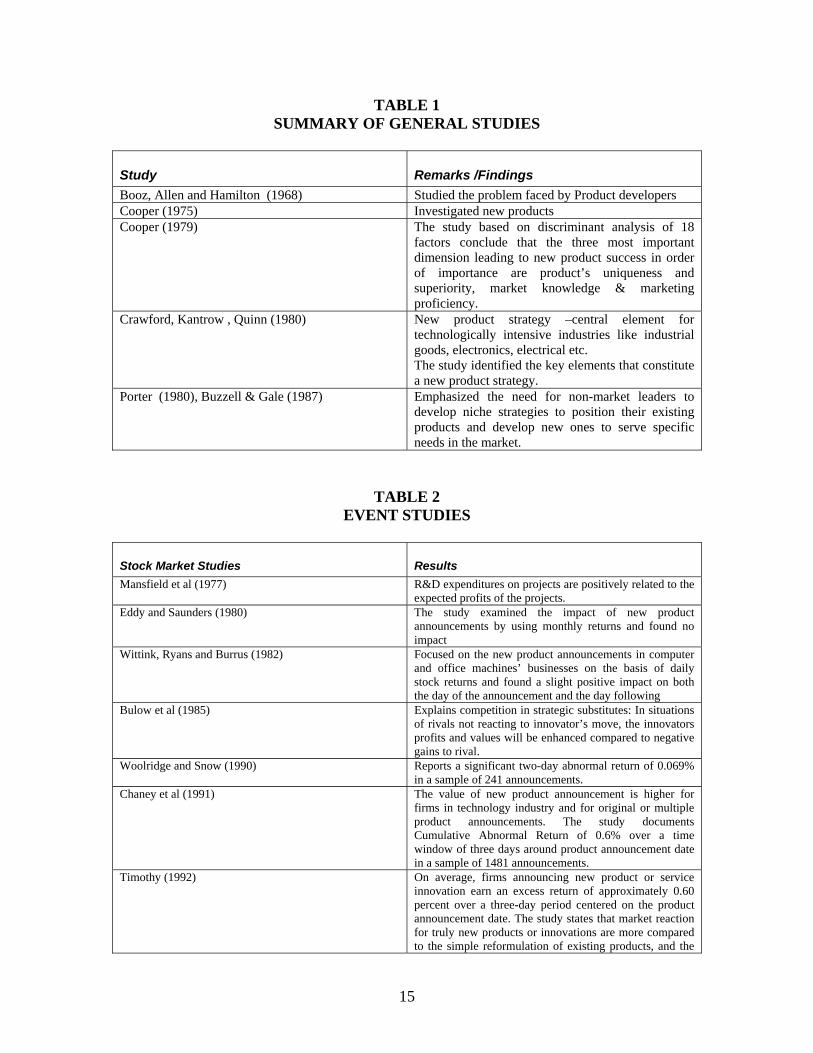
TABLE 1 SUMMARY OF GENERAL STUDIES
Study Remarks /Findings Booz, Allen and Hamilton (1968) Studied the problem faced by Product developers Cooper (1975) Investigated new products Cooper (1979) The study based on discriminant analysis of 18
factors conclude that the three most important dimension leading to new product success in order of importance are product’s uniqueness and superiority, market knowledge & marketing proficiency.
Crawford, Kantrow , Quinn (1980) New product strategy –central element for technologically intensive industries like industrial goods, electronics, electrical etc. The study identified the key elements that constitute a new product strategy.
Porter (1980), Buzzell & Gale (1987) Emphasized the need for non-market leaders to develop niche strategies to position their existing products and develop new ones to serve specific needs in the market.
TABLE 2 EVENT STUDIES
Stock Market Studies Results Mansfield et al (1977) R&D expenditures on projects are positively related to the
expected profits of the projects. Eddy and Saunders (1980) The study examined the impact of new product
announcements by using monthly returns and found no impact
Wittink, Ryans and Burrus (1982) Focused on the new product announcements in computer and office machines’ businesses on the basis of daily stock returns and found a slight positive impact on both the day of the announcement and the day following
Bulow et al (1985) Explains competition in strategic substitutes: In situations of rivals not reacting to innovator’s move, the innovators profits and values will be enhanced compared to negative gains to rival.
Woolridge and Snow (1990) Reports a significant two-day abnormal return of 0.069% in a sample of 241 announcements.
Chaney et al (1991) The value of new product announcement is higher for firms in technology industry and for original or multiple product announcements. The study documents Cumulative Abnormal Return of 0.6% over a time window of three days around product announcement date in a sample of 1481 announcements.
Timothy (1992) On average, firms announcing new product or service innovation earn an excess return of approximately 0.60 percent over a three-day period centered on the product announcement date. The study states that market reaction for truly new products or innovations are more compared to the simple reformulation of existing products, and the
15
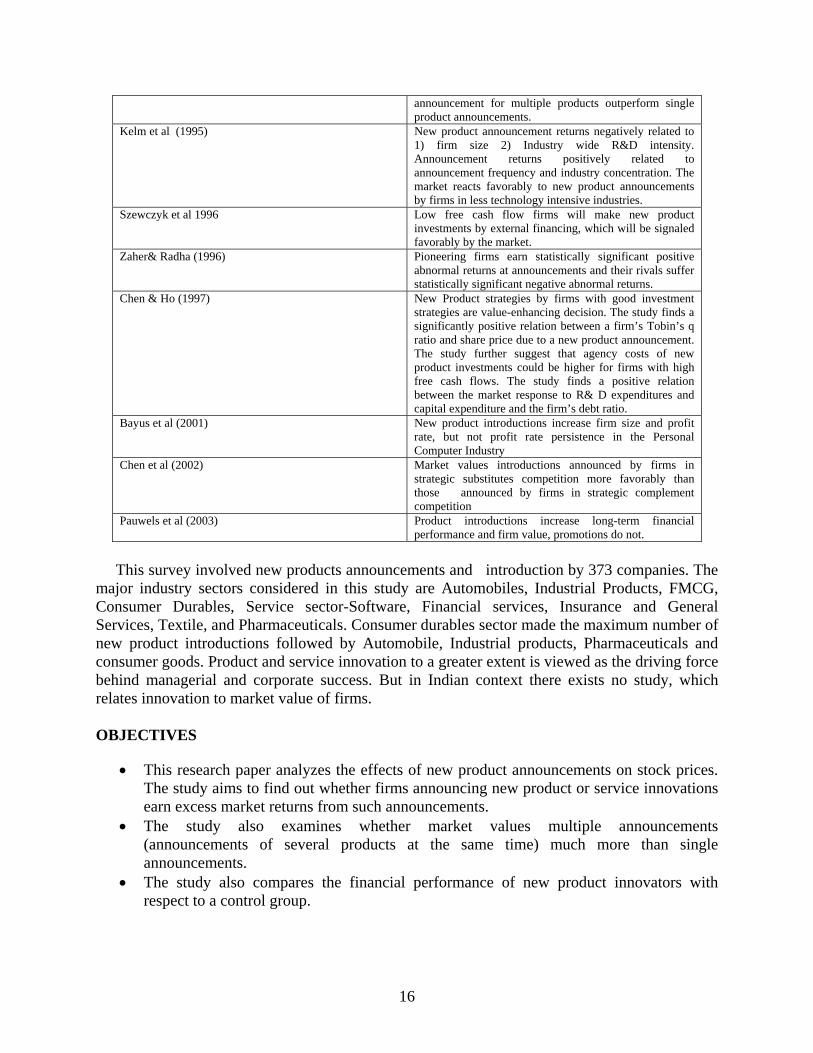
announcement for multiple products outperform single product announcements.
Kelm et al (1995) New product announcement returns negatively related to 1) firm size 2) Industry wide R&D intensity. Announcement returns positively related to announcement frequency and industry concentration. The market reacts favorably to new product announcements by firms in less technology intensive industries.
Szewczyk et al 1996 Low free cash flow firms will make new product investments by external financing, which will be signaled favorably by the market.
Zaher& Radha (1996) Pioneering firms earn statistically significant positive abnormal returns at announcements and their rivals suffer statistically significant negative abnormal returns.
Chen & Ho (1997) New Product strategies by firms with good investment strategies are value-enhancing decision. The study finds a significantly positive relation between a firm’s Tobin’s q ratio and share price due to a new product announcement. The study further suggest that agency costs of new product investments could be higher for firms with high free cash flows. The study finds a positive relation between the market response to R& D expenditures and capital expenditure and the firm’s debt ratio.
Bayus et al (2001) New product introductions increase firm size and profit rate, but not profit rate persistence in the Personal Computer Industry
Chen et al (2002) Market values introductions announced by firms in strategic substitutes competition more favorably than those announced by firms in strategic complement competition
Pauwels et al (2003) Product introductions increase long-term financial performance and firm value, promotions do not.
This survey involved new products announcements and introduction by 373 companies. The major industry sectors considered in this study are Automobiles, Industrial Products, FMCG, Consumer Durables, Service sector-Software, Financial services, Insurance and General Services, Textile, and Pharmaceuticals. Consumer durables sector made the maximum number of new product introductions followed by Automobile, Industrial products, Pharmaceuticals and consumer goods. Product and service innovation to a greater extent is viewed as the driving force behind managerial and corporate success. But in Indian context there exists no study, which relates innovation to market value of firms. OBJECTIVES
• This research paper analyzes the effects of new product announcements on stock prices. The study aims to find out whether firms announcing new product or service innovations earn excess market returns from such announcements.
• The study also examines whether market values multiple announcements (announcements of several products at the same time) much more than single announcements.
• The study also compares the financial performance of new product innovators with respect to a control group.
16
• The study also examines the stock market reaction to new product introductions on a sectoral basis.
HYPOTHESIS Pioneering firms earn significantly large abnormal returns. The stock market valuation for new product introductions in technologically based industries will be greater than that of new product introductions in non technological industries. Firm size should be inversely related to market reaction of new product introductions. The market’s response to a new product announcement will be inversely related to the firm’s level of free cash flow.
Specific Examples of New Product Announcements & Introductions A sample of the new product announcement considered for the study is given below: “…Mumbai, January 29, 2002: Hindustan Lever Limited (HLL) announces the launch of New Vim with a unique “Stain Cutter” formulation, that removes the toughest stains (burnt milk/ghee marks) with ease. The New Vim offers better value and cleaning ability at the old price of Rs. 13 for a 400 Gms pack and Rs. 6.50 for a 200 Gms pack. New Vim with its contemporary packaging illustrates dynamism and swift stain cutting powers…” This is considered as a single New Product Announcement and one New Product Introduction. A company has introduced single product in a New Product Announcement or has introduced multiple products in a single new product announcement. A sample of the New Product Announcement where multiple products are introduced is given below: “… Telco Unveils Six new products, Jan 15, 2002. …. Among the new launches is an LCV called `LPK 2516 6x4 tipper' in two sizes with a sandwich floor option. MORE PTI SJB VIN 01141806 D In the MCV category, Telco launched `LPTA 1516 4x4' and `LPT 1613 TC'. The former is a four-wheel drive specifically designed for defence applications whereas the latter is Telco's response to address the prevailing anomalies where the truck body does not confirm to any engineering or safety standards, Kant said. The three launches in the LCV segment are SFC 909 Turbo High Deck, the news TATA 207DI Single Cab pick Up and the new Tata 207DI Crew Cab Pick Up.” Below is the sample given that is considered by the researchers as Pre-announcement: “… GM’s Chevrolet Tevera to debut soon, March 16, 2004. … Planning to take on vehicles in a segment currently dominated by Mahindra Scorpio and the Toyota Qualis, General Motors India is planning to launch a big family car under its Chevrolet brand in the second quarter of 2004.”
17
RESEARCH DESIGN AND METHODOLOGY
We collected a sample of initial announcements of new product introductions by firms over a period from 2000 to 2006. The data was collected through various sources primarily by searching the archival records in the WebPages like India infoline.com, domain-b.com, financial express, business standard, Prowess CMIE database, Business line, Economic Times and some specific web pages of companies. The initial sample consisted of 872 announcements, which represented 1075 introductions made by 373 companies across various sectors over a period of seven years (Jan 2000 –March 2006). The final sample for the univariate statistical analysis included 217 sample firms and 170 control firms. The final sample included those companies, which had financial data in the CMIE prowess database Control firms for many of the sample firms could not be found out due to matching problems as many of the top companies in different sectors have introduced new products. The control groups were matched with sample firms based on sales as far as possible in the earliest year of announcement. On the assumptions of both normality and non-normality of the data source, the parametric mean test of t and non-parametric tests of Mann Whitney and Kolgomorov Smirnov test were utilized for the univariate analysis. Event study methodology is a natural offshoot of the rational expectations /efficient market tradition in financial economics. One of the areas where event study methodology has influenced marketing and strategic management literature is the examination of new product announcements. In an efficient market security prices reflect all available information about the firm and any new information received by the market is instantaneously incorporated into the stock price. In this context a change in the security price is an unbiased reflection of changes in the expected future cash flows of the firm. This research paper uses the abnormal stock return at announcements of new product introductions as a measure of first mover advantages since it represent a risk adjusted scope of investor’s expectation of future economic profit. The final sample for stock market study was arrived after eliminating unlisted companies and announcements, which had confounding events. The final sample included those companies, which had financial data in the CMIE prowess database. The actively traded scrip was included in the final sample. We required firms to be listed on Bombay Stock Exchange. For a security to be involved in a sample, it must have atleast four daily returns in the entire week period. In the study, the event date examined is the date that the new product is announced in the press. The final sample for the event study consisted of 328 announcements made by 159 listed firms. (Details given in appendix). Six separate event windows were used to test for any abnormal stock behaviour. One day before to one day after announcement, day of announcement to one day after announcement, two days before to two days after announcement, 3 days before to 3 days after announcement, 5days before to five days after announcement. Further more to be included in the sample, the new product announcements with the following criteria were selected .1) To avoid any confounding events that could distort the measurement of the valuation effects, the announcing firms should not have other announcements five days after and before the initial announcement date. The study analyzes the share price performance using market model method. The market’s reaction to a merger bid is measured using daily stock return data to compute the excess stockholder returns. These excess returns are a measure of the stockholder’s return from the new information, which becomes available to market. The daily excess return for the security is estimated by:
18
XRt = Rt- E (Rt) where t=Day relative to an event XRt = Excess return on the security for day t Rt = Actual return on the security for day t E (Rt) = Expected rate of return on the security for day t To use the market model, a clean period was chosen –50 to –200 days (0 being the new product announcement day) to estimate the model parameters. The model parameters were estimated by regressing daily stock return on the market index over the estimation period. The market model is given by Rt = α + βRmt +εt Where Rmt is the return on Sensex for day t, β measures the sensitivity of the firm to market –this is a measure of risk and εt is a statistical error where Σεt =0 Thus the predicted return for the firm in the event period is the return given by the market model on that day using these estimates. Finally the cross-sectional differences in the percentage excess returns from an announcement were analyzed by regressing the standardized CAR (-1 to +1) against specific control variables like beta as a measure of firm risk, accounting measures like size profitability, cash flow, R&D intensity, dummy variables for multiple introductions, technology intensity and a series of industry dummy variable. RESULTS AND ANALYSIS
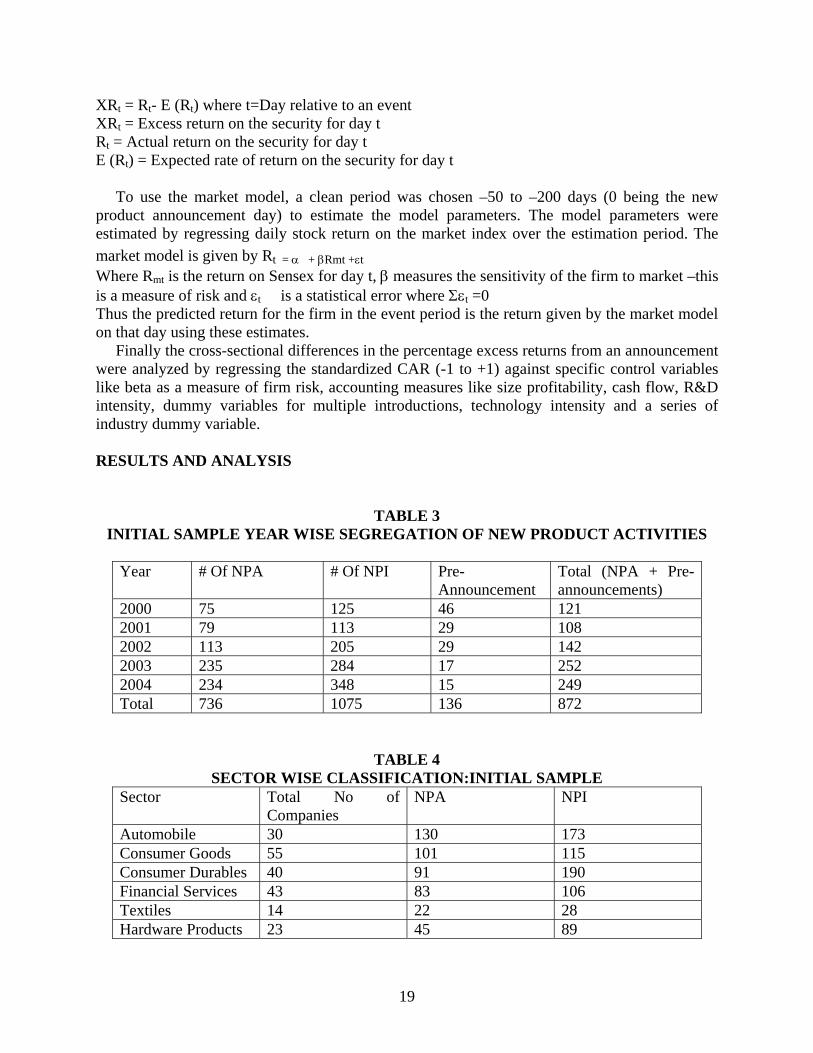
TABLE 3 INITIAL SAMPLE YEAR WISE SEGREGATION OF NEW PRODUCT ACTIVITIES
Year # Of NPA # Of NPI Pre-
Announcement Total (NPA + Pre-announcements)
2000 75 125 46 121 2001 79 113 29 108 2002 113 205 29 142 2003 235 284 17 252 2004 234 348 15 249 Total 736 1075 136 872
TABLE 4 SECTOR WISE CLASSIFICATION:INITIAL SAMPLE
Sector Total No of Companies
NPA NPI
Automobile 30 130 173 Consumer Goods 55 101 115 Consumer Durables 40 91 190 Financial Services 43 83 106 Textiles 14 22 28 Hardware Products 23 45 89
19
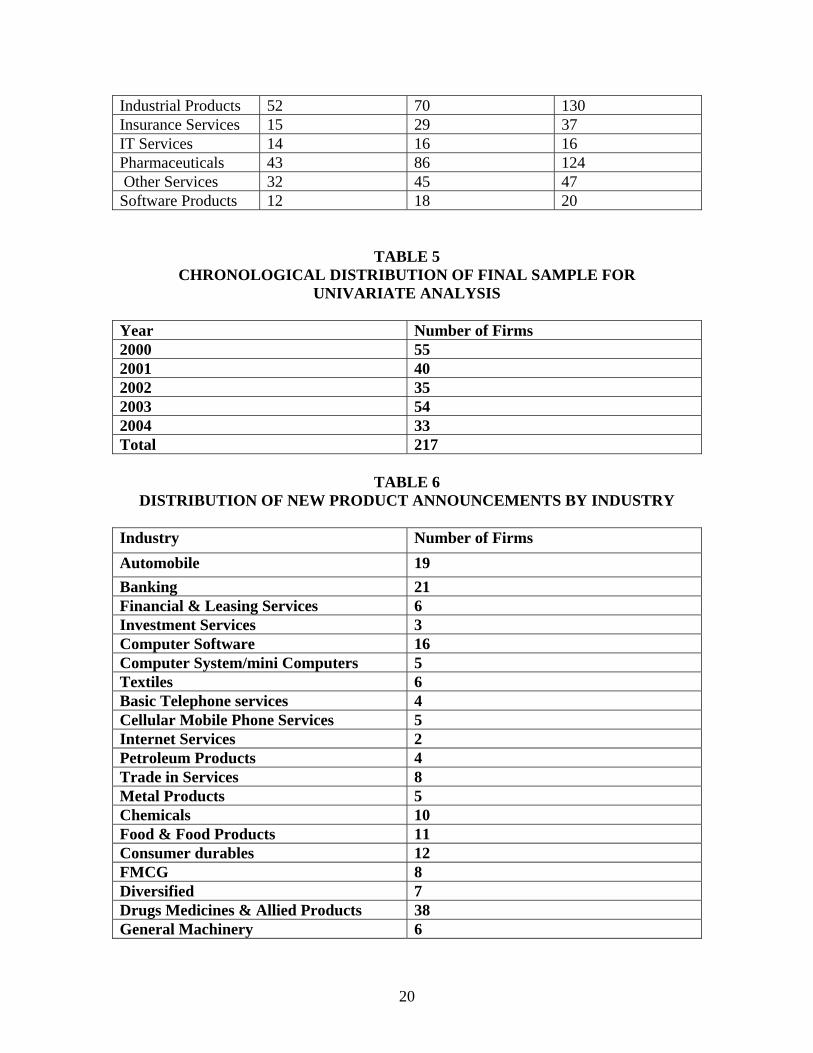
Industrial Products 52 70 130 Insurance Services 15 29 37 IT Services 14 16 16 Pharmaceuticals 43 86 124 Other Services 32 45 47 Software Products 12 18 20
TABLE 5 CHRONOLOGICAL DISTRIBUTION OF FINAL SAMPLE FOR
UNIVARIATE ANALYSIS
Year Number of Firms 2000 55 2001 40 2002 35 2003 54 2004 33 Total 217
TABLE 6
DISTRIBUTION OF NEW PRODUCT ANNOUNCEMENTS BY INDUSTRY
Industry Number of Firms Automobile 19 Banking 21 Financial & Leasing Services 6 Investment Services 3 Computer Software 16 Computer System/mini Computers 5 Textiles 6 Basic Telephone services 4 Cellular Mobile Phone Services 5 Internet Services 2 Petroleum Products 4 Trade in Services 8 Metal Products 5 Chemicals 10 Food & Food Products 11 Consumer durables 12 FMCG 8 Diversified 7 Drugs Medicines & Allied Products 38 General Machinery 6
20
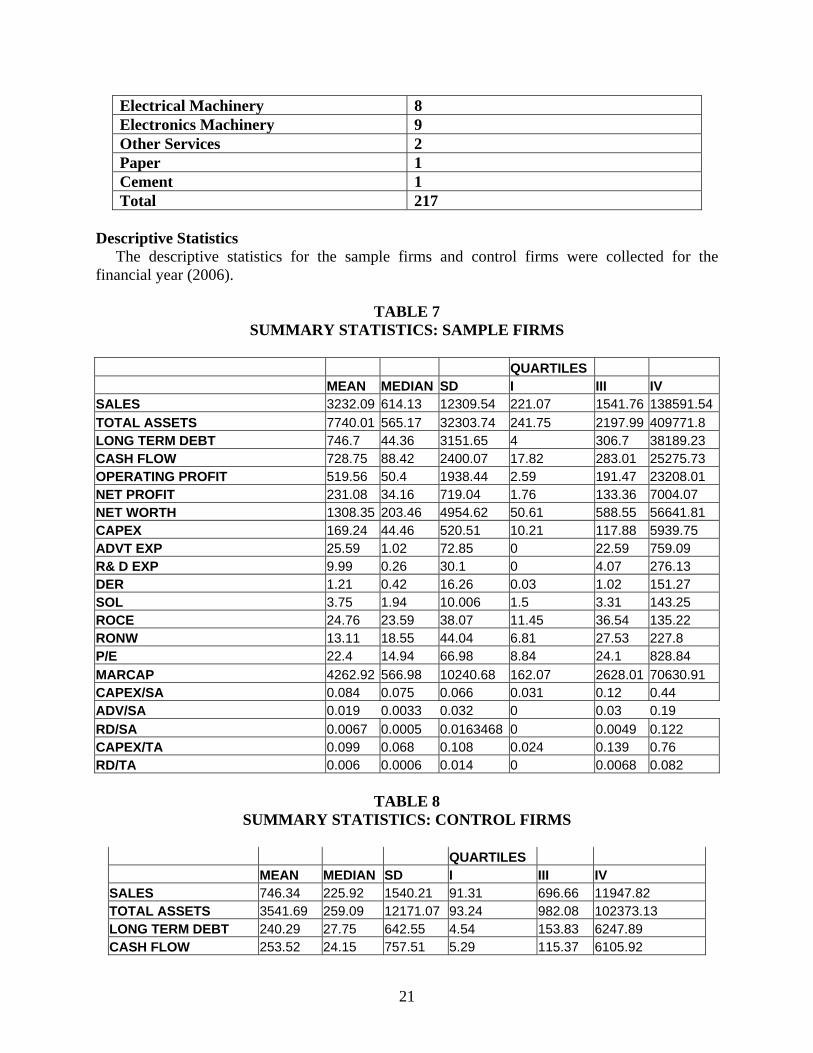
Electrical Machinery 8 Electronics Machinery 9 Other Services 2 Paper 1 Cement 1 Total 217
Descriptive Statistics The descriptive statistics for the sample firms and control firms were collected for the financial year (2006).
TABLE 7 SUMMARY STATISTICS: SAMPLE FIRMS
QUARTILES MEAN MEDIAN SD I III IV SALES 3232.09 614.13 12309.54 221.07 1541.76 138591.54TOTAL ASSETS 7740.01 565.17 32303.74 241.75 2197.99 409771.8 LONG TERM DEBT 746.7 44.36 3151.65 4 306.7 38189.23 CASH FLOW 728.75 88.42 2400.07 17.82 283.01 25275.73 OPERATING PROFIT 519.56 50.4 1938.44 2.59 191.47 23208.01 NET PROFIT 231.08 34.16 719.04 1.76 133.36 7004.07 NET WORTH 1308.35 203.46 4954.62 50.61 588.55 56641.81 CAPEX 169.24 44.46 520.51 10.21 117.88 5939.75 ADVT EXP 25.59 1.02 72.85 0 22.59 759.09 R& D EXP 9.99 0.26 30.1 0 4.07 276.13 DER 1.21 0.42 16.26 0.03 1.02 151.27 SOL 3.75 1.94 10.006 1.5 3.31 143.25 ROCE 24.76 23.59 38.07 11.45 36.54 135.22 RONW 13.11 18.55 44.04 6.81 27.53 227.8 P/E 22.4 14.94 66.98 8.84 24.1 828.84 MARCAP 4262.92 566.98 10240.68 162.07 2628.01 70630.91 CAPEX/SA 0.084 0.075 0.066 0.031 0.12 0.44 ADV/SA 0.019 0.0033 0.032 0 0.03 0.19 RD/SA 0.0067 0.0005 0.0163468 0 0.0049 0.122 CAPEX/TA 0.099 0.068 0.108 0.024 0.139 0.76 RD/TA 0.006 0.0006 0.014 0 0.0068 0.082
TABLE 8
SUMMARY STATISTICS: CONTROL FIRMS
QUARTILES MEAN MEDIAN SD I III IV SALES 746.34 225.92 1540.21 91.31 696.66 11947.82 TOTAL ASSETS 3541.69 259.09 12171.07 93.24 982.08 102373.13 LONG TERM DEBT 240.29 27.75 642.55 4.54 153.83 6247.89 CASH FLOW 253.52 24.15 757.51 5.29 115.37 6105.92
21
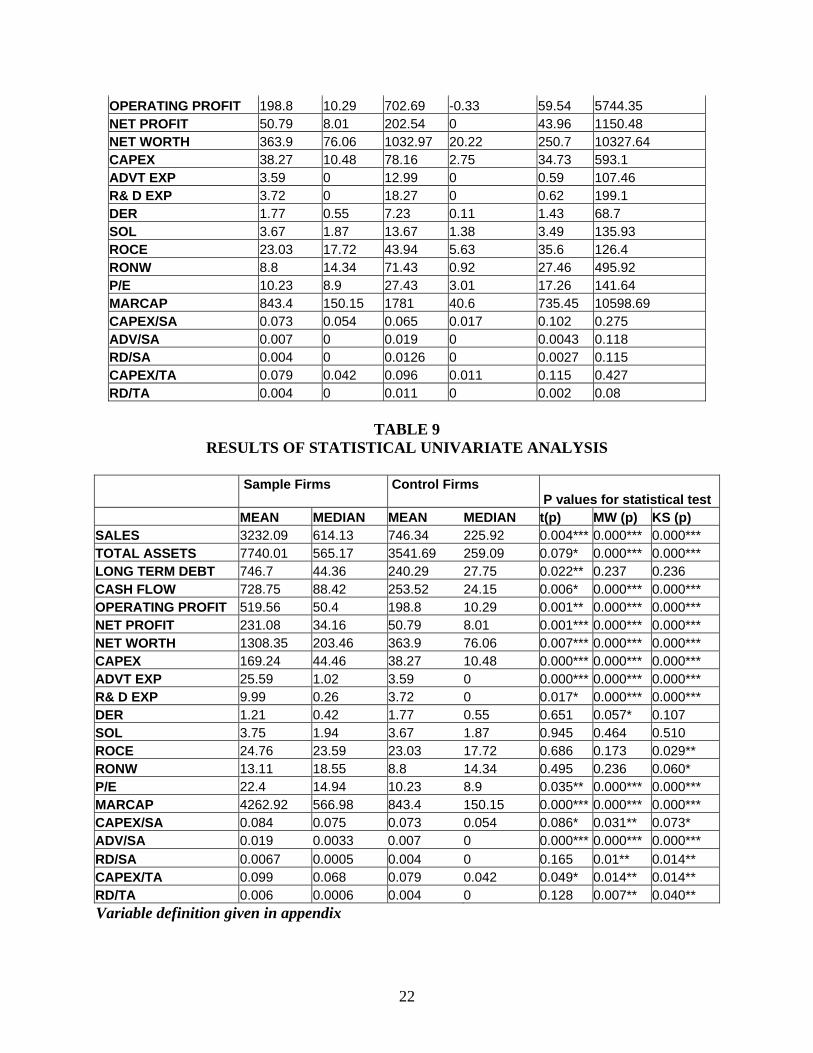
OPERATING PROFIT 198.8 10.29 702.69 -0.33 59.54 5744.35 NET PROFIT 50.79 8.01 202.54 0 43.96 1150.48 NET WORTH 363.9 76.06 1032.97 20.22 250.7 10327.64 CAPEX 38.27 10.48 78.16 2.75 34.73 593.1 ADVT EXP 3.59 0 12.99 0 0.59 107.46 R& D EXP 3.72 0 18.27 0 0.62 199.1 DER 1.77 0.55 7.23 0.11 1.43 68.7 SOL 3.67 1.87 13.67 1.38 3.49 135.93 ROCE 23.03 17.72 43.94 5.63 35.6 126.4 RONW 8.8 14.34 71.43 0.92 27.46 495.92 P/E 10.23 8.9 27.43 3.01 17.26 141.64 MARCAP 843.4 150.15 1781 40.6 735.45 10598.69 CAPEX/SA 0.073 0.054 0.065 0.017 0.102 0.275 ADV/SA 0.007 0 0.019 0 0.0043 0.118 RD/SA 0.004 0 0.0126 0 0.0027 0.115 CAPEX/TA 0.079 0.042 0.096 0.011 0.115 0.427 RD/TA 0.004 0 0.011 0 0.002 0.08
TABLE 9
RESULTS OF STATISTICAL UNIVARIATE ANALYSIS
Sample Firms
Control Firms P values for statistical test
MEAN MEDIAN MEAN MEDIAN t(p) MW (p) KS (p) SALES 3232.09 614.13 746.34 225.92 0.004*** 0.000*** 0.000*** TOTAL ASSETS 7740.01 565.17 3541.69 259.09 0.079* 0.000*** 0.000*** LONG TERM DEBT 746.7 44.36 240.29 27.75 0.022** 0.237 0.236 CASH FLOW 728.75 88.42 253.52 24.15 0.006* 0.000*** 0.000*** OPERATING PROFIT 519.56 50.4 198.8 10.29 0.001** 0.000*** 0.000*** NET PROFIT 231.08 34.16 50.79 8.01 0.001*** 0.000*** 0.000*** NET WORTH 1308.35 203.46 363.9 76.06 0.007*** 0.000*** 0.000*** CAPEX 169.24 44.46 38.27 10.48 0.000*** 0.000*** 0.000*** ADVT EXP 25.59 1.02 3.59 0 0.000*** 0.000*** 0.000*** R& D EXP 9.99 0.26 3.72 0 0.017* 0.000*** 0.000*** DER 1.21 0.42 1.77 0.55 0.651 0.057* 0.107 SOL 3.75 1.94 3.67 1.87 0.945 0.464 0.510 ROCE 24.76 23.59 23.03 17.72 0.686 0.173 0.029** RONW 13.11 18.55 8.8 14.34 0.495 0.236 0.060* P/E 22.4 14.94 10.23 8.9 0.035** 0.000*** 0.000*** MARCAP 4262.92 566.98 843.4 150.15 0.000*** 0.000*** 0.000*** CAPEX/SA 0.084 0.075 0.073 0.054 0.086* 0.031** 0.073* ADV/SA 0.019 0.0033 0.007 0 0.000*** 0.000*** 0.000*** RD/SA 0.0067 0.0005 0.004 0 0.165 0.01** 0.014** CAPEX/TA 0.099 0.068 0.079 0.042 0.049* 0.014** 0.014** RD/TA 0.006 0.0006 0.004 0 0.128 0.007** 0.040** Variable definition given in appendix
22
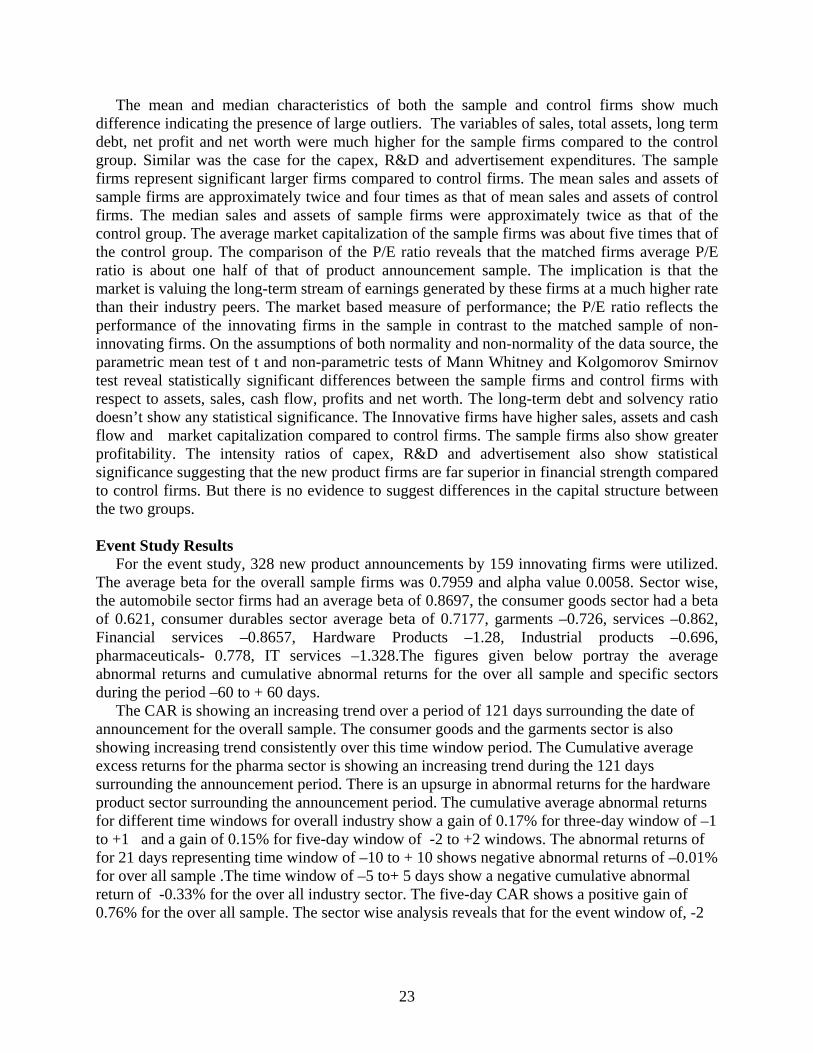
The mean and median characteristics of both the sample and control firms show much difference indicating the presence of large outliers. The variables of sales, total assets, long term debt, net profit and net worth were much higher for the sample firms compared to the control group. Similar was the case for the capex, R&D and advertisement expenditures. The sample firms represent significant larger firms compared to control firms. The mean sales and assets of sample firms are approximately twice and four times as that of mean sales and assets of control firms. The median sales and assets of sample firms were approximately twice as that of the control group. The average market capitalization of the sample firms was about five times that of the control group. The comparison of the P/E ratio reveals that the matched firms average P/E ratio is about one half of that of product announcement sample. The implication is that the market is valuing the long-term stream of earnings generated by these firms at a much higher rate than their industry peers. The market based measure of performance; the P/E ratio reflects the performance of the innovating firms in the sample in contrast to the matched sample of non-innovating firms. On the assumptions of both normality and non-normality of the data source, the parametric mean test of t and non-parametric tests of Mann Whitney and Kolgomorov Smirnov test reveal statistically significant differences between the sample firms and control firms with respect to assets, sales, cash flow, profits and net worth. The long-term debt and solvency ratio doesn’t show any statistical significance. The Innovative firms have higher sales, assets and cash flow and market capitalization compared to control firms. The sample firms also show greater profitability. The intensity ratios of capex, R&D and advertisement also show statistical significance suggesting that the new product firms are far superior in financial strength compared to control firms. But there is no evidence to suggest differences in the capital structure between the two groups. Event Study Results For the event study, 328 new product announcements by 159 innovating firms were utilized. The average beta for the overall sample firms was 0.7959 and alpha value 0.0058. Sector wise, the automobile sector firms had an average beta of 0.8697, the consumer goods sector had a beta of 0.621, consumer durables sector average beta of 0.7177, garments –0.726, services –0.862, Financial services –0.8657, Hardware Products –1.28, Industrial products –0.696, pharmaceuticals- 0.778, IT services –1.328.The figures given below portray the average abnormal returns and cumulative abnormal returns for the over all sample and specific sectors during the period –60 to + 60 days. The CAR is showing an increasing trend over a period of 121 days surrounding the date of announcement for the overall sample. The consumer goods and the garments sector is also showing increasing trend consistently over this time window period. The Cumulative average excess returns for the pharma sector is showing an increasing trend during the 121 days surrounding the announcement period. There is an upsurge in abnormal returns for the hardware product sector surrounding the announcement period. The cumulative average abnormal returns for different time windows for overall industry show a gain of 0.17% for three-day window of –1 to +1 and a gain of 0.15% for five-day window of -2 to +2 windows. The abnormal returns of for 21 days representing time window of –10 to + 10 shows negative abnormal returns of –0.01% for over all sample .The time window of –5 to+ 5 days show a negative cumulative abnormal return of -0.33% for the over all industry sector. The five-day CAR shows a positive gain of 0.76% for the over all sample. The sector wise analysis reveals that for the event window of, -2
23
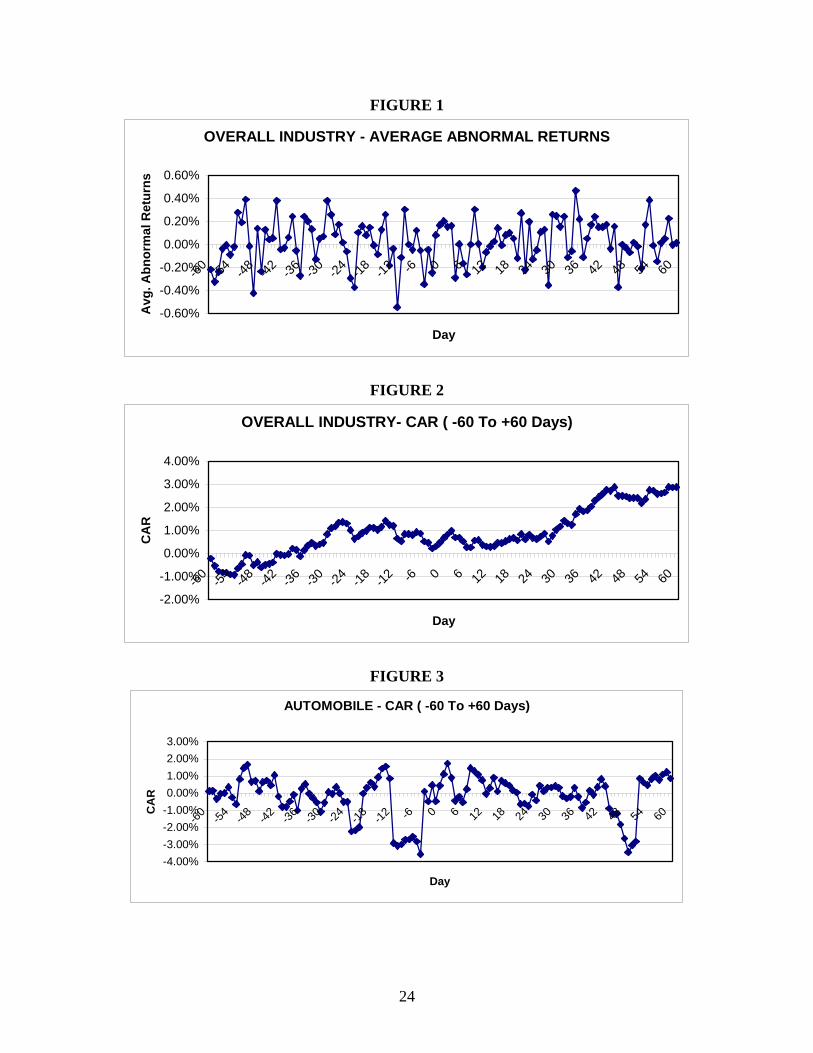
FIGURE 1
OVERALL INDUSTRY - AVERAGE ABNORMAL RETURNS
-0.60%
-0.40%
-0.20%
0.00%
0.20%
0.40%
0.60%
-60 -54 -48 -42 -36 -30 -24 -18 -12 -6 0 6 12 18 24 30 36 42 48 54 60
Day
Avg
. Abn
orm
al R
etur
ns
FIGURE 2
OVERALL INDUSTRY- CAR ( -60 To +60 Days)
-2.00%
-1.00%
0.00%
1.00%
2.00%
3.00%
4.00%
-60 -54 -48 -42 -36 -30 -24 -18 -12 -6 0 6 12 18 24 30 36 42 48 54 60
Day
CA
R
FIGURE 3
AUTOMOBILE - CAR ( -60 To +60 Days)
-4.00%-3.00%-2.00%-1.00%0.00%1.00%2.00%3.00%
-60 -54 -48 -42 -36 -30 -24 -18 -12 -6 0 6 12 18 24 30 36 42 48 54 60
Day
CA
R
24
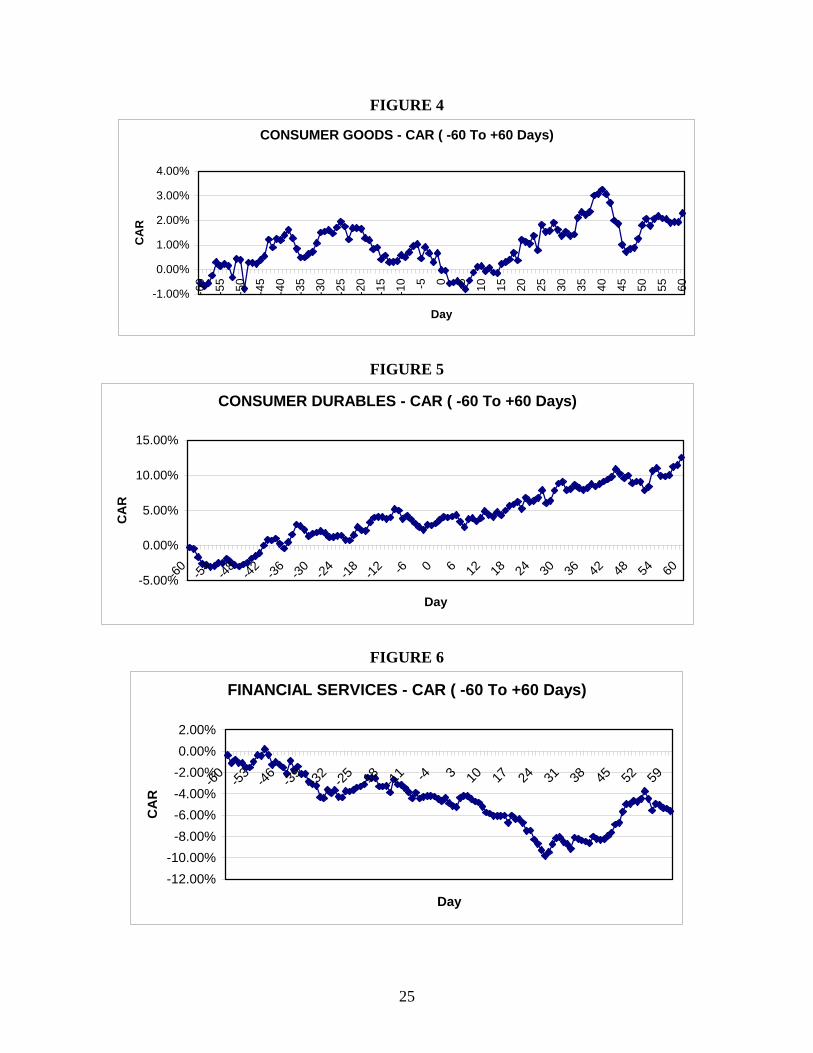
FIGURE 4
CONSUMER GOODS - CAR ( -60 To +60 Days)
-1.00%
0.00%
1.00%
2.00%
3.00%
4.00%
-60
-55
-50
-45
-40
-35
-30
-25
-20
-15
-10 -5 0 5 10 15 20 25 30 35 40 45 50 55 60
Day
CA
R
FIGURE 5
CONSUMER DURABLES - CAR ( -60 To +60 Days)
-5.00%
0.00%
5.00%
10.00%
15.00%
-60 -54 -48 -42 -36 -30 -24 -18 -12 -6 0 6 12 18 24 30 36 42 48 54 60
Day
CA
R
FIGURE 6
FINANCIAL SERVICES - CAR ( -60 To +60 Days)
-12.00%-10.00%-8.00%-6.00%-4.00%-2.00%0.00%2.00%
-60 -53 -46 -39 -32 -25 -18 -11 -4 3 10 17 24 31 38 45 52 59
Day
CA
R
25
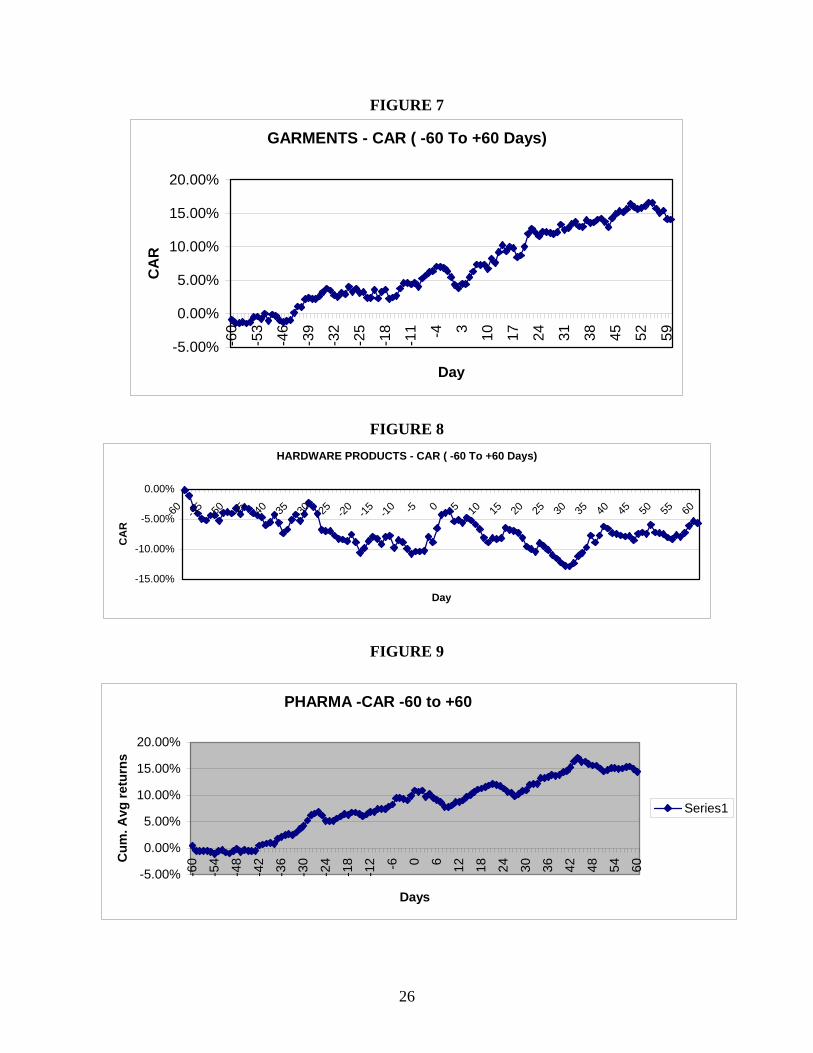
FIGURE 7
GARMENTS - CAR ( -60 To +60 Days)
-5.00%
0.00%
5.00%
10.00%
15.00%
20.00%
-60
-53
-46
-39
-32
-25
-18
-11 -4 3 10 17 24 31 38 45 52 59
Day
CA
R
FIGURE 8 HARDWARE PRODUCTS - CAR ( -60 To +60 Days)
-15.00%
-10.00%
-5.00%
0.00%
-60 -55 -50 -45 -40 -35 -30 -25 -20 -15 -10 -5 0 5 10 15 20 25 30 35 40 45 50 55 60
Day
CA
R
FIGURE 9
PHARMA -CAR -60 to +60
-5.00%
0.00%
5.00%
10.00%
15.00%
20.00%
-60
-54
-48
-42
-36
-30
-24
-18
-12 -6 0 6 12 18 24 30 36 42 48 54 60
Days
Cum
. Avg
retu
rns
Series1
26
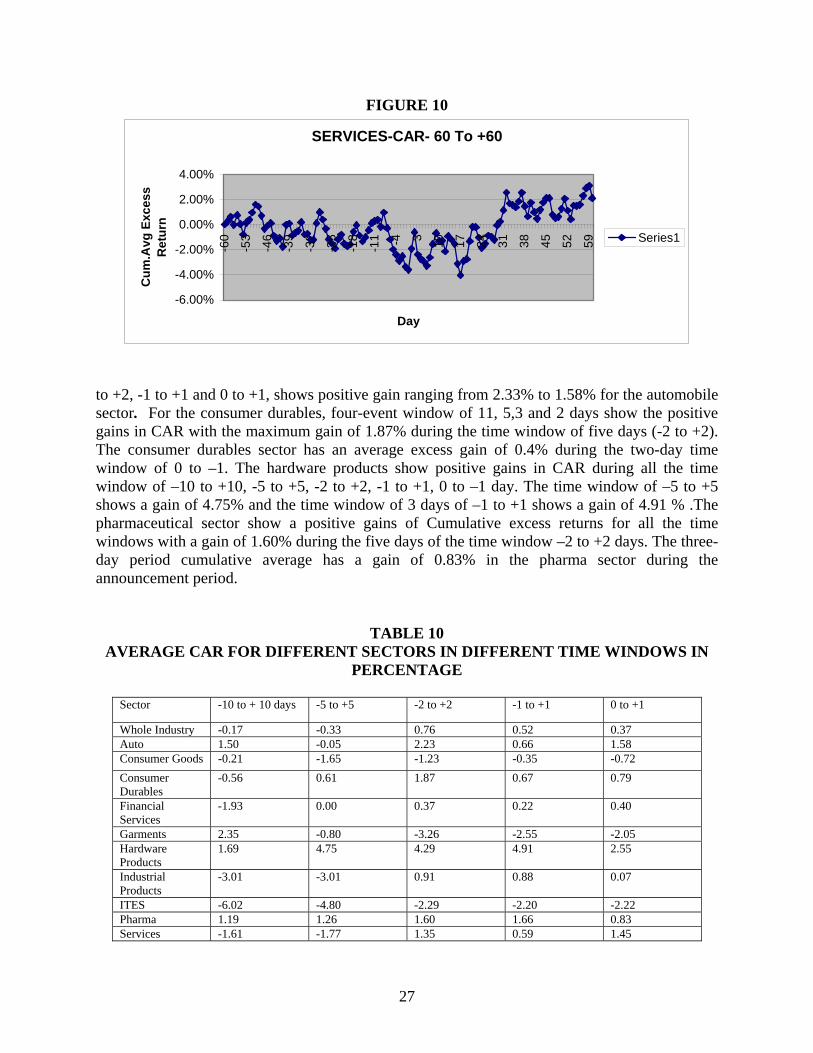
FIGURE 10
SERVICES-CAR- 60 To +60
-6.00%
-4.00%
-2.00%
0.00%
2.00%
4.00%
-60
-53
-46
-39
-32
-25
-18
-11 -4 3 10 17 24 31 38 45 52 59
Day
Cum
.Avg
Exc
ess
Ret
urn
Series1
to +2, -1 to +1 and 0 to +1, shows positive gain ranging from 2.33% to 1.58% for the automobile sector. For the consumer durables, four-event window of 11, 5,3 and 2 days show the positive gains in CAR with the maximum gain of 1.87% during the time window of five days (-2 to +2). The consumer durables sector has an average excess gain of 0.4% during the two-day time window of 0 to –1. The hardware products show positive gains in CAR during all the time window of –10 to +10, -5 to +5, -2 to +2, -1 to +1, 0 to –1 day. The time window of –5 to +5 shows a gain of 4.75% and the time window of 3 days of –1 to +1 shows a gain of 4.91 % .The pharmaceutical sector show a positive gains of Cumulative excess returns for all the time windows with a gain of 1.60% during the five days of the time window –2 to +2 days. The three-day period cumulative average has a gain of 0.83% in the pharma sector during the announcement period.
TABLE 10 AVERAGE CAR FOR DIFFERENT SECTORS IN DIFFERENT TIME WINDOWS IN
PERCENTAGE
Sector -10 to + 10 days -5 to +5 -2 to +2 -1 to +1 0 to +1
Whole Industry -0.17 -0.33 0.76 0.52 0.37 Auto 1.50 -0.05 2.23 0.66 1.58 Consumer Goods -0.21 -1.65 -1.23 -0.35 -0.72 Consumer Durables
-0.56 0.61 1.87 0.67 0.79
Financial Services
-1.93 0.00 0.37 0.22 0.40
Garments 2.35 -0.80 -3.26 -2.55 -2.05 Hardware Products
1.69 4.75 4.29 4.91 2.55
Industrial Products
-3.01 -3.01 0.91 0.88 0.07
ITES -6.02 -4.80 -2.29 -2.20 -2.22 Pharma 1.19 1.26 1.60 1.66 0.83 Services -1.61 -1.77 1.35 0.59 1.45
27
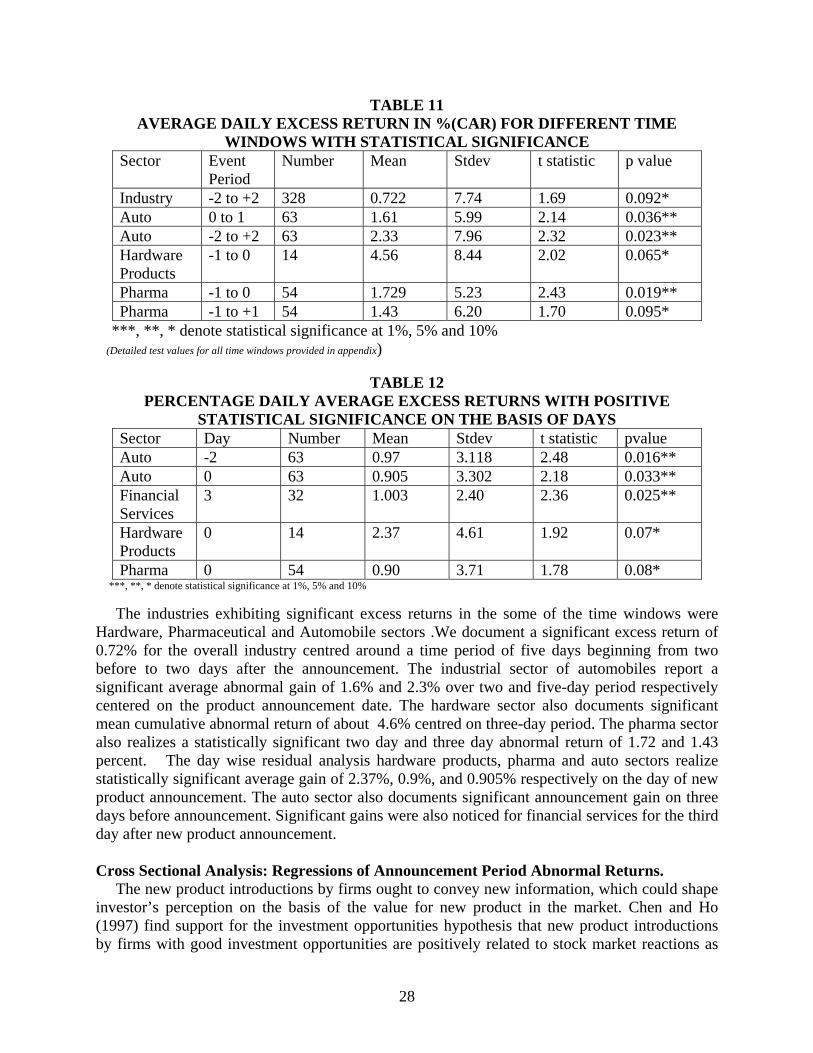
TABLE 11 AVERAGE DAILY EXCESS RETURN IN %(CAR) FOR DIFFERENT TIME
WINDOWS WITH STATISTICAL SIGNIFICANCE Sector Event
Period Number Mean Stdev t statistic p value
Industry -2 to +2 328 0.722 7.74 1.69 0.092* Auto 0 to 1 63 1.61 5.99 2.14 0.036** Auto -2 to +2 63 2.33 7.96 2.32 0.023** Hardware Products
-1 to 0 14 4.56 8.44 2.02 0.065*
Pharma -1 to 0 54 1.729 5.23 2.43 0.019** Pharma -1 to +1 54 1.43 6.20 1.70 0.095*
***, **, * denote statistical significance at 1%, 5% and 10% (Detailed test values for all time windows provided in appendix)
TABLE 12
PERCENTAGE DAILY AVERAGE EXCESS RETURNS WITH POSITIVE STATISTICAL SIGNIFICANCE ON THE BASIS OF DAYS
Sector Day Number Mean Stdev t statistic pvalue Auto -2 63 0.97 3.118 2.48 0.016** Auto 0 63 0.905 3.302 2.18 0.033** Financial Services
3 32 1.003 2.40 2.36 0.025**
Hardware Products
0 14 2.37 4.61 1.92 0.07*
Pharma 0 54 0.90 3.71 1.78 0.08* ***, **, * denote statistical significance at 1%, 5% and 10% The industries exhibiting significant excess returns in the some of the time windows were Hardware, Pharmaceutical and Automobile sectors .We document a significant excess return of 0.72% for the overall industry centred around a time period of five days beginning from two before to two days after the announcement. The industrial sector of automobiles report a significant average abnormal gain of 1.6% and 2.3% over two and five-day period respectively centered on the product announcement date. The hardware sector also documents significant mean cumulative abnormal return of about 4.6% centred on three-day period. The pharma sector also realizes a statistically significant two day and three day abnormal return of 1.72 and 1.43 percent. The day wise residual analysis hardware products, pharma and auto sectors realize statistically significant average gain of 2.37%, 0.9%, and 0.905% respectively on the day of new product announcement. The auto sector also documents significant announcement gain on three days before announcement. Significant gains were also noticed for financial services for the third day after new product announcement. Cross Sectional Analysis: Regressions of Announcement Period Abnormal Returns. The new product introductions by firms ought to convey new information, which could shape investor’s perception on the basis of the value for new product in the market. Chen and Ho (1997) find support for the investment opportunities hypothesis that new product introductions by firms with good investment opportunities are positively related to stock market reactions as
28
measured by the proxy of Tobin’s q measure. The free cash flow theory predicts that the market’s response to a new product announcement will be inversely related to the firm’s level of free cash flow. The potential agency costs of new product investments can be higher for firms with high free cash flow. Large firms introduce new products to capture more market share compared to small firms need for product innovation for survival. In this context firm size should be inversely related to market reaction of new product introductions (Kelm et al 1995). Chaney et al (1991) argue that firms in more technologically based industries have greater technology opportunities. Thus the value of an innovation should be higher for firms in more technologically based industries. Firms introducing multiple products experience greater wealth creation than those announcing single products. (Chaney et al 1991). REGRESSION RESULTS The table-representing model 1 to 7 below gives the statistically significant results of the regression analyses of three day (-1,0, +1) for new product announcements. The announcement period returns is estimated using the market model method with model parameters being estimated for the period –50 to –150 days before the announcement period. The dependent variable is the standardized cumulative abnormal return (CAR) centred around a three-day period of –1 to +1 days. The specific control variables used are sales, log of total assets, debt equity ratio, return on net worth, cash flow, free cash flow, Research & Development Intensity, Tobin’s q ratio and beta .The dummy variables represent multiple introductions (MULTI), technologically intensive sectors (TECH) and industry sectors like Auto, Consumer goods, Consumer durables, Financial Services, Garments, Hardware Products, Industrial Products, Information technology related services, Pharmaceuticals and other services. The firm size variable (log TA) is the logarithm of book value of total assets. Another variable for size was sales. Debt ratio (DER) is the book value of total debt divided by the book value of total equity. RONW represent net worth. Cash flow (CF) is defined as operating income before depreciation minus interest expenses and taxes. Free cash flow (FCF) is defined as the operating income before depreciation minus interest expense, taxes divided by book value of total assets The investment opportunities (Q) represented by the measure of Tobin’s q is estimated by the ratio of the market to book value of the firm’s assets, where the market value of assets equals the book value of assets minus the book value of common equity plus the market value of common equity. A firm’s R&D intensity is the ratio of R&D expenses divided by the net sales. All the control variable values represent the fiscal year prior to the announcement. The dummy variable TECH takes a value of one if the announcing firm is in a high technology industry and zero otherwise, as a proxy for technology opportunities. The dummy variable MULTI equals one for multiple product announcements and zero for single product announcement. The variable beta captures the measure of systematic risk. The first model included all the control and dummy variable. The second model included only the control variables. The third model excluded the variables of sales, cash flow and dummy variables. The fourth model excluded variables of log of assets and free cash flow. The fifth model included dummy variables only. The sixth model excluded dummy variables other than pharma, log of assets and free cash flow. The seventh model included control variables and dummy variables of multiple introductions, technology intensity. The results are given for statistically significant variables.
29
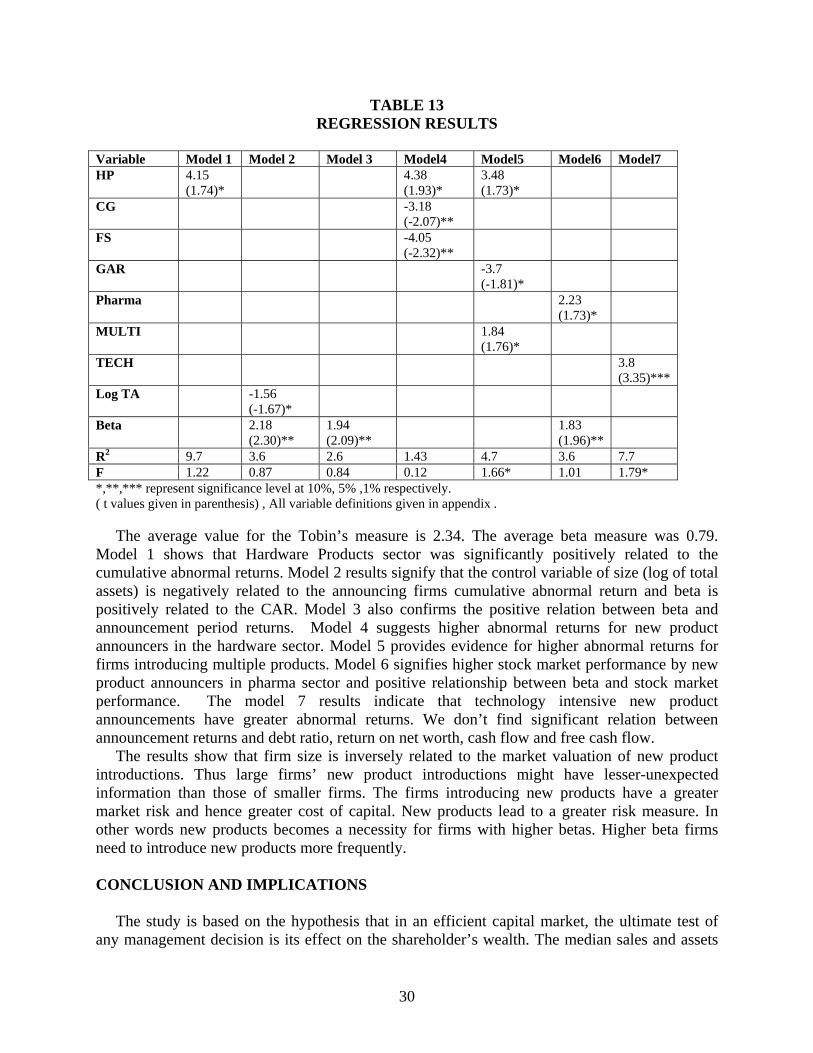
TABLE 13 REGRESSION RESULTS
Variable Model 1 Model 2 Model 3 Model4 Model5 Model6 Model7 HP 4.15
(1.74)* 4.38
(1.93)* 3.48 (1.73)*
CG -3.18 (-2.07)**
FS -4.05 (-2.32)**
GAR -3.7 (-1.81)*
Pharma 2.23 (1.73)*
MULTI 1.84 (1.76)*
TECH 3.8 (3.35)***
Log TA -1.56 (-1.67)*
Beta 2.18 (2.30)**
1.94 (2.09)**
1.83 (1.96)**
R2 9.7 3.6 2.6 1.43 4.7 3.6 7.7 F 1.22 0.87 0.84 0.12 1.66* 1.01 1.79* *,**,*** represent significance level at 10%, 5% ,1% respectively. ( t values given in parenthesis) , All variable definitions given in appendix . The average value for the Tobin’s measure is 2.34. The average beta measure was 0.79. Model 1 shows that Hardware Products sector was significantly positively related to the cumulative abnormal returns. Model 2 results signify that the control variable of size (log of total assets) is negatively related to the announcing firms cumulative abnormal return and beta is positively related to the CAR. Model 3 also confirms the positive relation between beta and announcement period returns. Model 4 suggests higher abnormal returns for new product announcers in the hardware sector. Model 5 provides evidence for higher abnormal returns for firms introducing multiple products. Model 6 signifies higher stock market performance by new product announcers in pharma sector and positive relationship between beta and stock market performance. The model 7 results indicate that technology intensive new product announcements have greater abnormal returns. We don’t find significant relation between announcement returns and debt ratio, return on net worth, cash flow and free cash flow. The results show that firm size is inversely related to the market valuation of new product introductions. Thus large firms’ new product introductions might have lesser-unexpected information than those of smaller firms. The firms introducing new products have a greater market risk and hence greater cost of capital. New products lead to a greater risk measure. In other words new products becomes a necessity for firms with higher betas. Higher beta firms need to introduce new products more frequently. CONCLUSION AND IMPLICATIONS The study is based on the hypothesis that in an efficient capital market, the ultimate test of any management decision is its effect on the shareholder’s wealth. The median sales and assets
30
of sample firms were approximately twice as that of the control group. The average market capitalization of the sample firms was about five times that of the control group. The Innovative firms have higher sales, assets and cash flow and market capitalization compared to control firms. The sample firms also show greater profitability. The intensity ratios of capex, R&D and advertisement also show statistical significance suggesting that the new product firms are far superior in financial strength compared to control firms. Using a sample of 328 announcements of new product introductions in a span of years, this research paper documents a statistically significant five-day abnormal returns of 0.72% centered around the announcement day. The hardware sector also documents significant mean cumulative abnormal return of about 4.6% centered on three-day period. The other sectors showing significant stock market impact are the pharmaceutical and automobile sectors. In an efficient stock market, security prices reflect all available information about the firm and any new information received by the market is instantaneously incorporated into the stock price.Hardware Products sector was significantly positively related to the cumulative abnormal returns. The cross sectional analysis exploits information on product, firm and industry specific characteristics to shed light on the determinants of the sustainability of first mover advantages. The multivariate analysis shows that firm size is inversely related to the market valuation of new product introductions. The value of innovation was higher for technologically intensive industries. Firms introducing multiple products experience greater wealth creation than those announcing single products The significance of new product development and their successful commercial introductions is the central theme of corporate strategic decisions. The corporate policy makers should focus attention on the establishment of long range product policy plans and the communication of these plans to the stockholders in the context of wealth creation .The ultimate yardstick for measuring the effectiveness of marketing decisions is its impact in the market place on the firm’s securities. REFERENCES Booz, Allen & Hamilton (1968), Management of New Products, New York: Booz, Allen & Hamilton, Inc. Cooper, Robert G (1975). Why New Industrial Products Fail. Industrial Marketing Management, 4, pp 315-326. Crawford C M (1980). Defining the charter for Product Innovations. Sloan Management Review, Fall (1980), pp 3-12 Kantrow A M (1980). The Strategy- Technology Connection. Harvard Business Review, 6-21. Mansfield, E, M Schwartz, S Wagner (1981). Imitation Costs and Patents: An Empirical Study. Economic Journal Quinn, J B (1980). Managing Strategic Change. Sloan Management Review, Vol 21, No 4, 3-20. R G Cooper (1979). The Dimensions of Industrial New Product Success And Failure. Journal of Marketing Vol .43, 93-103.
31

Robert G Cooper. The Performance Impact of Product Innovation Strategies European Journal of Marketing 18,5 Woolridge R (1988). Competitive Decline and Corporate Restructuring: Is a myopic Stock Market to Blame? Journal of Applied Corporate Finance 1, 26-36.
Stock Market Reaction on New Product Introductions:
Albert Eddy, George Saunders (1980). New Product Announcements and Stock Prices. Decision Sciences Vol 11. Arrow Kenneth (1962). Economic Welfare and the Allocation of Resources for Invention in R Nelson (ed.) The Rate and Direction of Inventive Activity, Princeton NJ Princeton, University Press. Bayus Barry, Gay Erickson and Robert Jacobson (2001). The financial rewards of New product introductions in the Personal Computer Industry. Working Paper. Booz, Allen and Hamilton(1982). New Product Management for the 1980s, Booz Allen & Hamilton, New York Bulow J J, Geanakoplos and P Klemperer(1985).Multimarket Oligopoly: Strategic Substitutes and Complements. Journal of Political Economy 93, 488-511. Chan, S H, J Martin and J Kensinger(1990). Corporate Research and Development Expenditures and Share Value. Journal of Financial Economics, 26, 255-276 Chaney P and T Devinney (1992). New Product Innovations and Stock Price Performance. Journal of Business Finance and Accounting, September 677-695. Chaney P, T Devinney and R Winer(1991). The Impact of New Product Introductions on the Market Value of Firms. Journal of Business 64, 573-610. Chauvin, K W and M Hirschey(1993). Advertising, R& D Expenditures and Market Value of the Firm. Financial Management 22, 128-140. Chen S S and K W Ho (1997). Market Response to Product Strategy and Capital Expenditure Announcements in Singapore: Investment Opportunities and Free Cash Flow. Financial Management, 26, 82-88 Jensen M (1986). Agency Costs of Free Cash Flow, Corporate Finance, and Takeovers. American Economic Review 76, 323-329. Kantrow A M (1980). The Strategy- Technology Connection. Harvard Business Review, July –August, 6-21
32
Kelm K M, V K Narayanan and GE Pinches (1995). Shareholder Value creation During R& D Innovation and Commercialization Stages. Academy of Management Journal 38, 770-786. Peltzman S (1981). The effects of FTC advertising Regulation. Journal of Law and Economics, 24, 403-48 Quinn, J B (1980). Managing Strategic Change. Sloan Management Review, Vol 21 No 4, 3-20 Sheng Syan Chen, Kim Wai Ho, kueh Hwa Ik and Cheng few Lee (2002). How does Strategic Competition Affect Firm Values? A study of New Product Announcements. Financial Management, 67-84 Szewczyk, S, G Tsetsekos and Z Zantout (1996). The Valuation of Corporate R& D Expenditures: Evidence From Investment Opportunities and Free Cash Flow. Financial Management, 25, 105-110. Wittink D Ryans and Burus N (1982) New Product and Security Prices Working Paper Ithaca N Y Cornell University Woolridge R and C Snow (1990). Stock Market Reaction to Strategic Investment Decisions, Strategic Management Journal, 353-363
33