Embed Size (px)
Citation preview
Professional development for mainstream teachers of ELLs Project GLAD® and Beyond
Theresa Deussen March 10, 2014
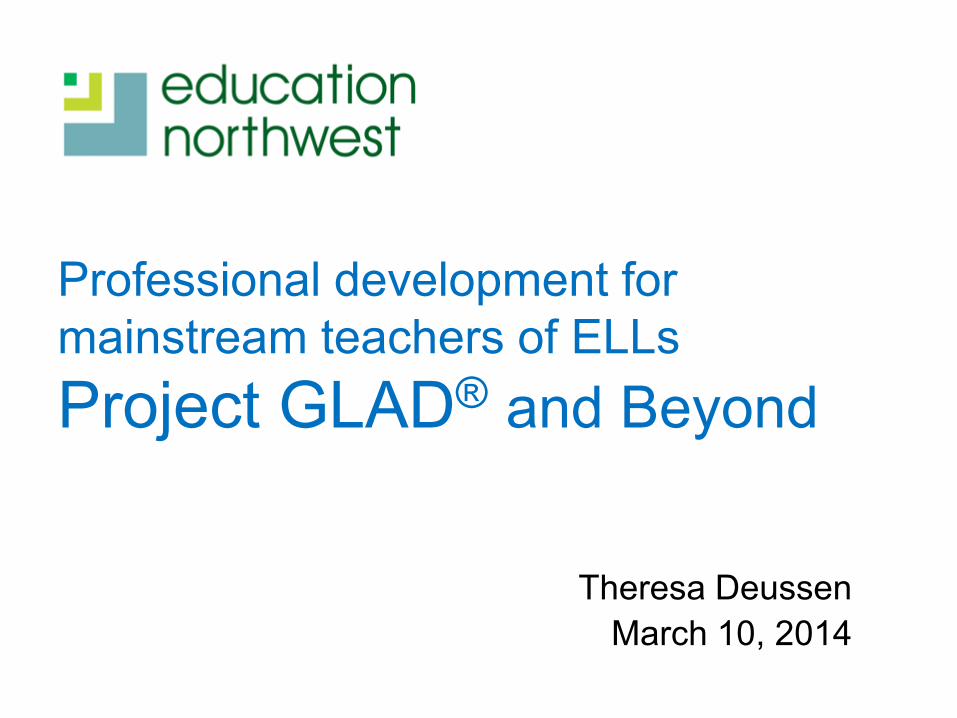
The challenge
Today’s Agenda
•
•
•
•
Describe what ELLs in mainstream classrooms commonly receive Focus on one program–Project GLAD–and Year 1 results from our experimental study Take a closer look at what our findings mean for closing the achievement gap Raise some questions about what schools can do to have a bigger impact
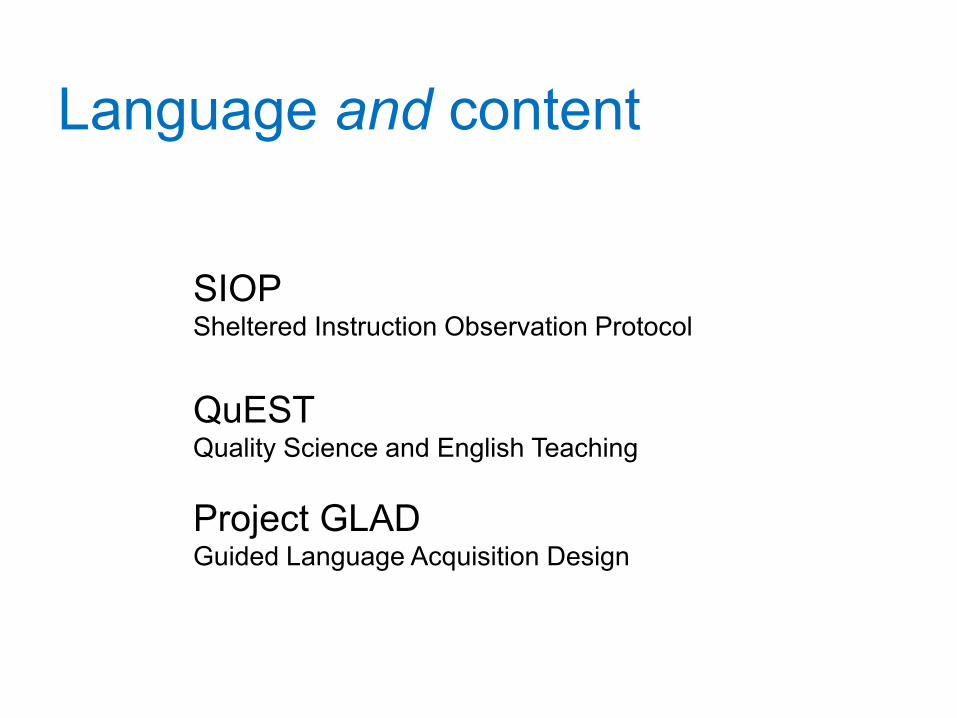
Language and content
SIOP Sheltered Instruction Observation Protocol QuEST Quality Science and English Teaching Project GLAD Guided Language Acquisition Design
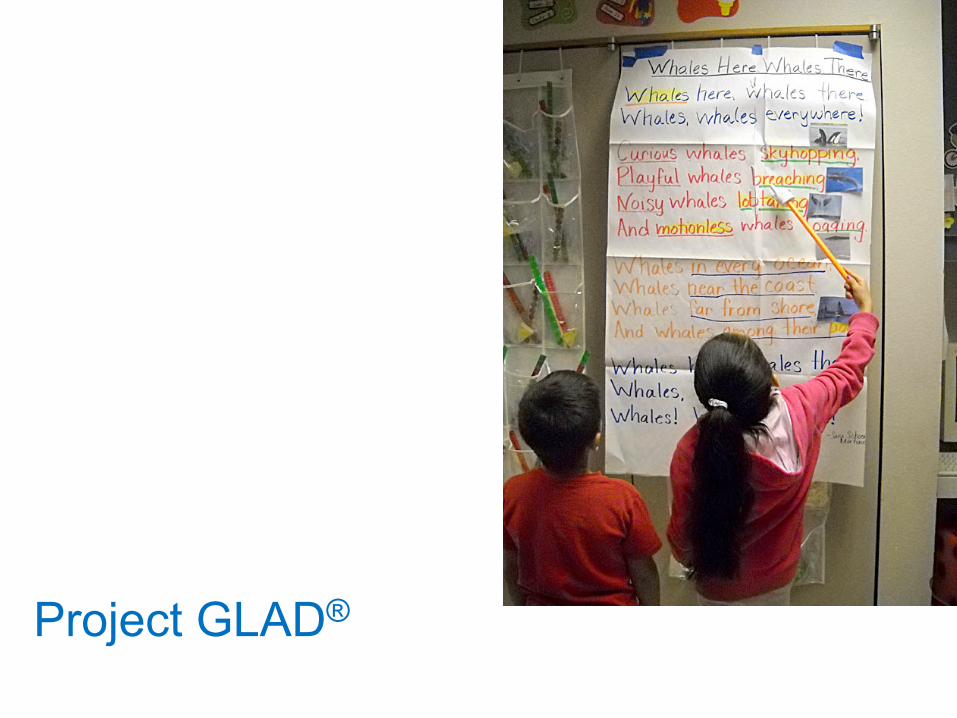
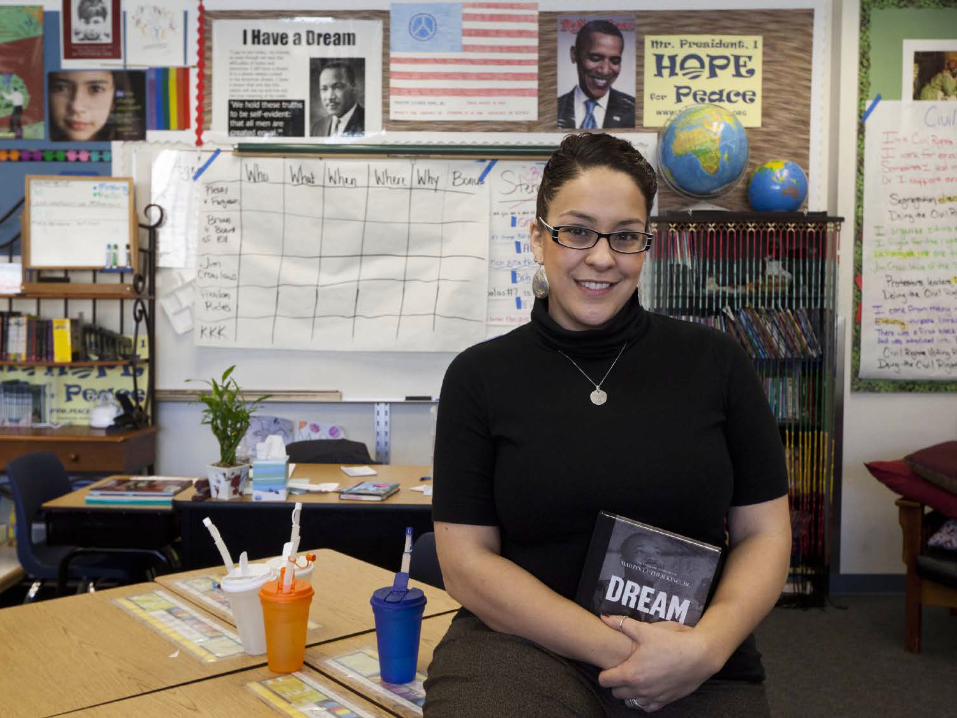
Project GLAD®
• [3-minute video of Project GLAD strategies]
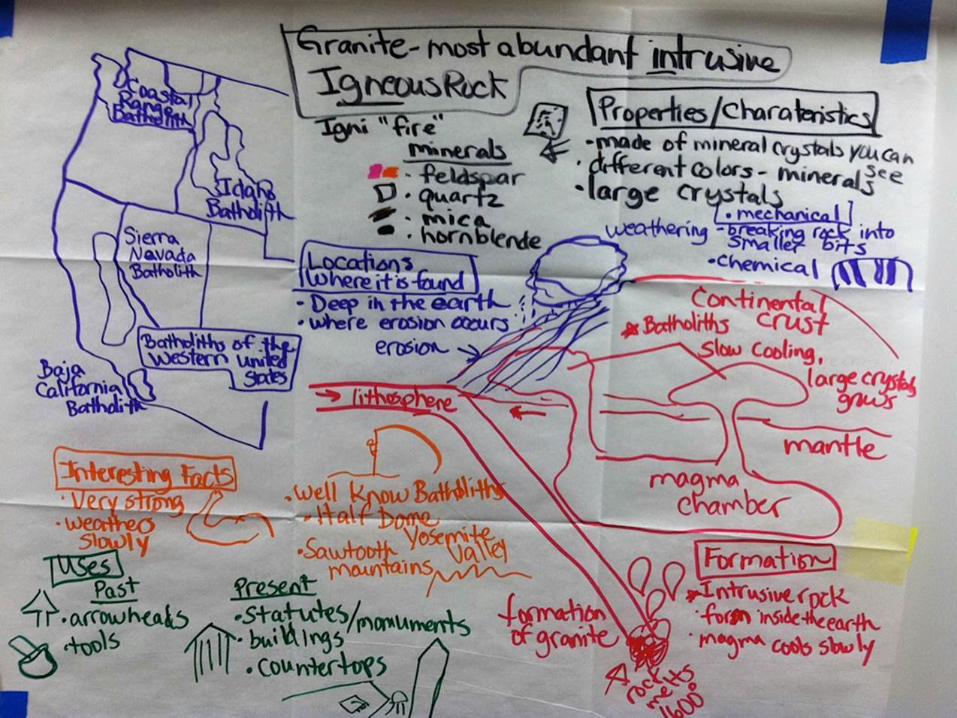
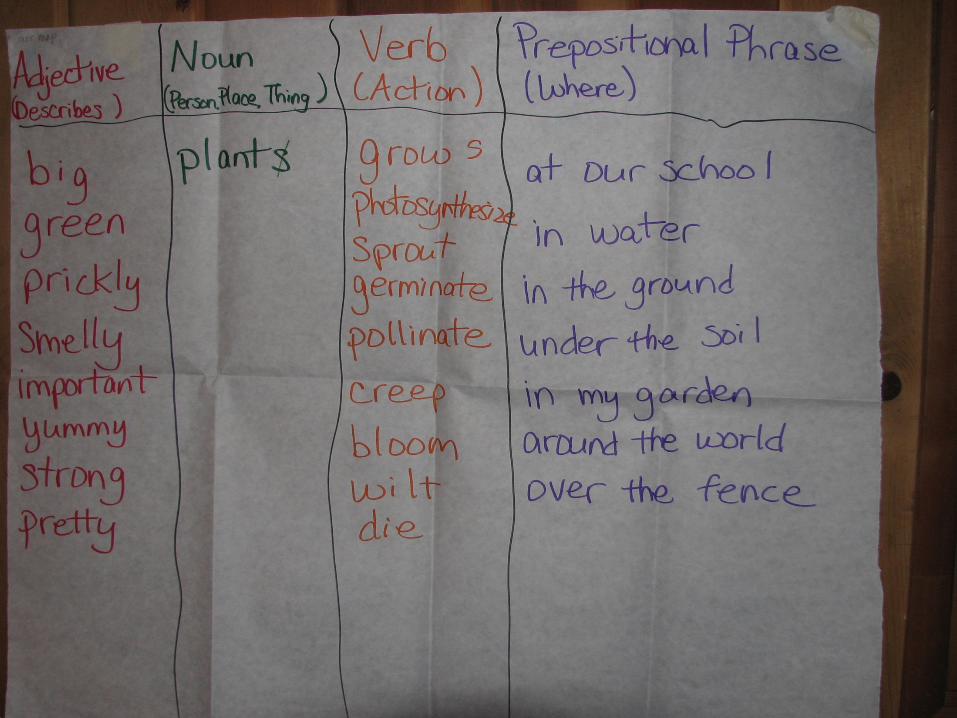
Project GLAD Input Chart (One of 35 instructional strategies)
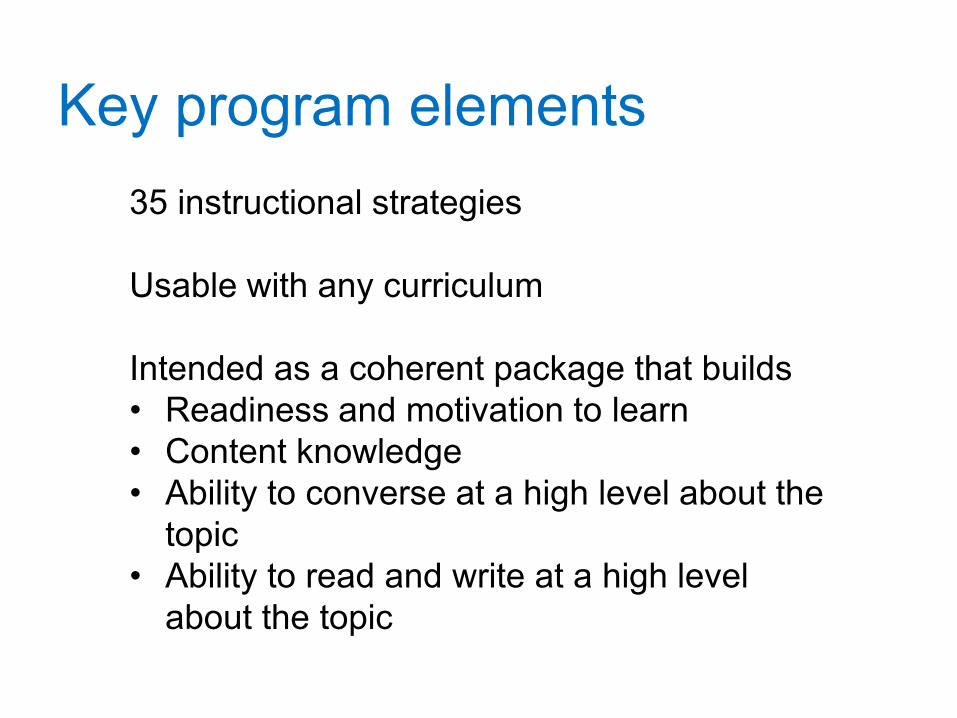
Key program elements
35 instructional strategies Usable with any curriculum Intended as a coherent package that builds •••
•
Readiness and motivation to learn Content knowledge Ability to converse at a high level about the topic Ability to read and write at a high level about the topic
11
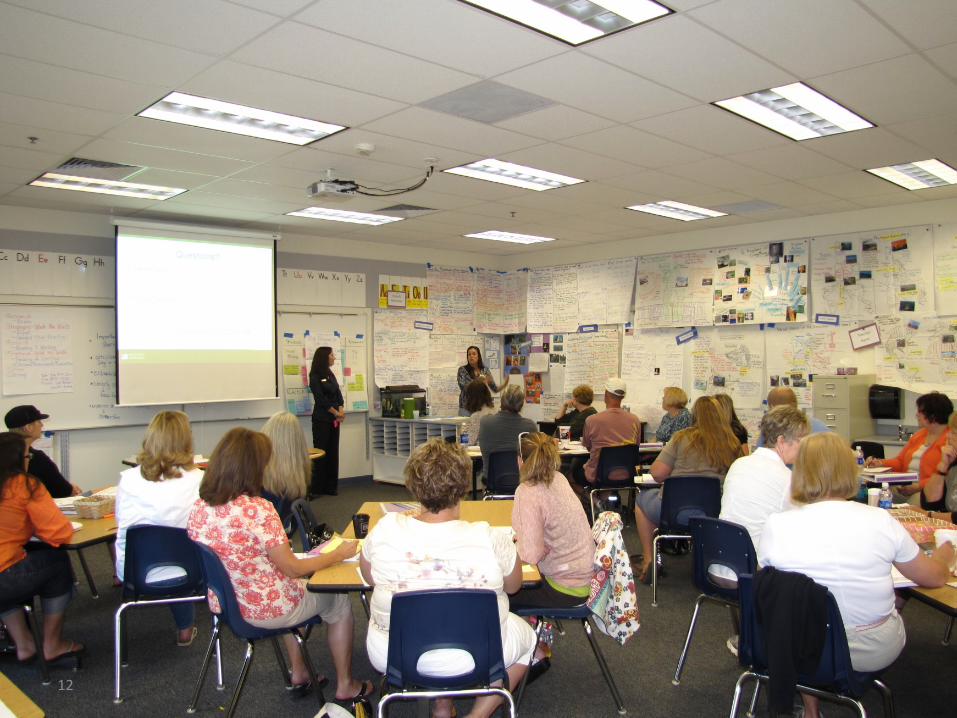
12
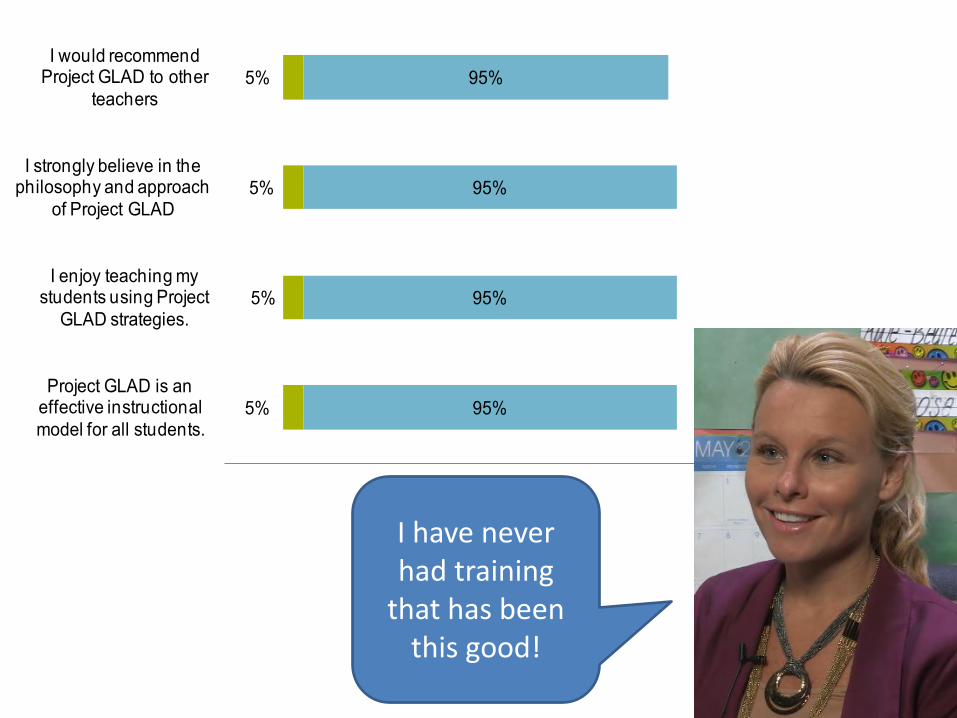
5%
5%
5%
5%
95%
95%
95%
95%
Project GLAD is an effective instructional model for all students.
I enjoy teaching my students using Project
GLAD strategies.
I strongly believe in the philosophy and approach
of Project GLAD
I would recommend Project GLAD to other
teachers
I have never had training
that has been this good!
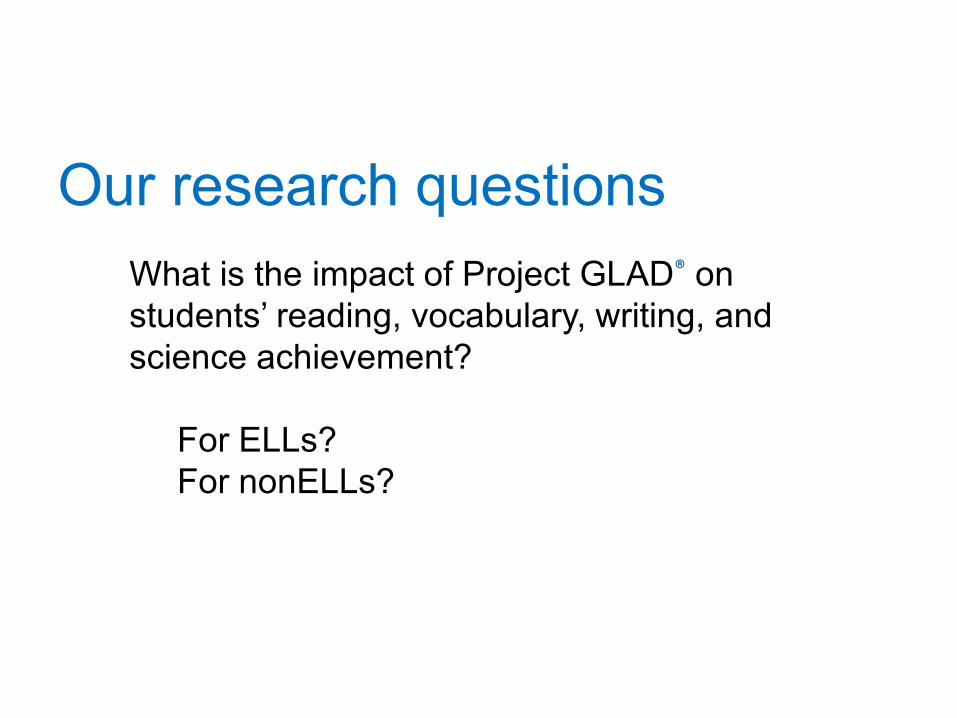
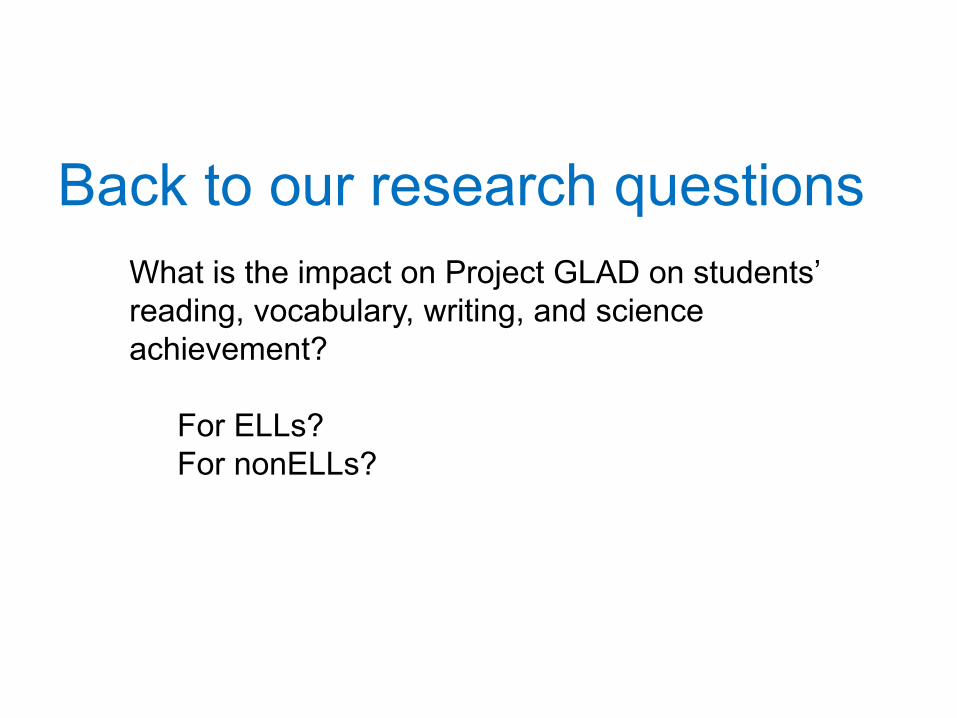
Our research questions What is the impact of Project GLAD® on
students’ reading, vocabulary, writing, and science achievement?
For ELLs? For nonELLs?
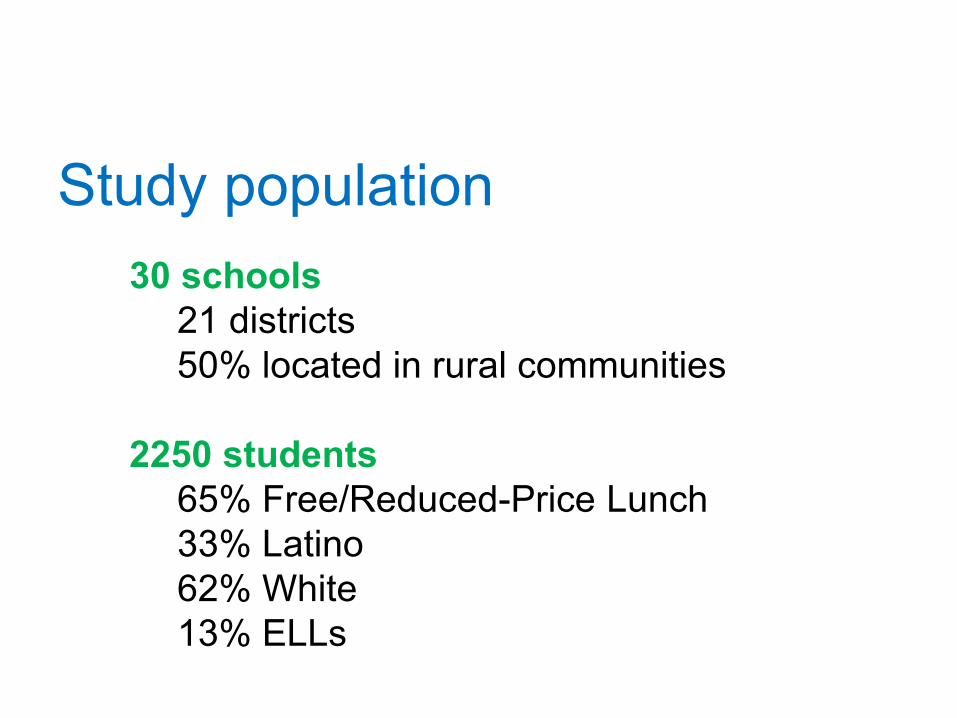
Study population 30 schools
21 districts 50% located in rural communities
2250 students
65% Free/Reduced-Price Lunch 33% Latino 62% White 13% ELLs
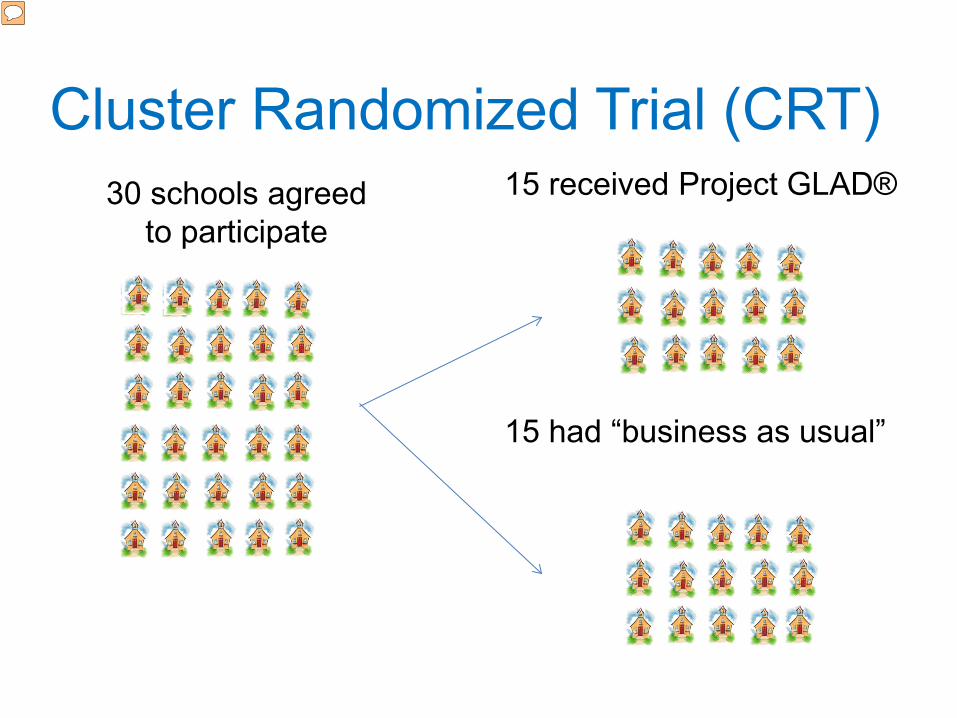
Cluster Randomized Trial (CRT) 30 schools agreed
to participate 15 received Project GLAD®
15 had “business as usual”
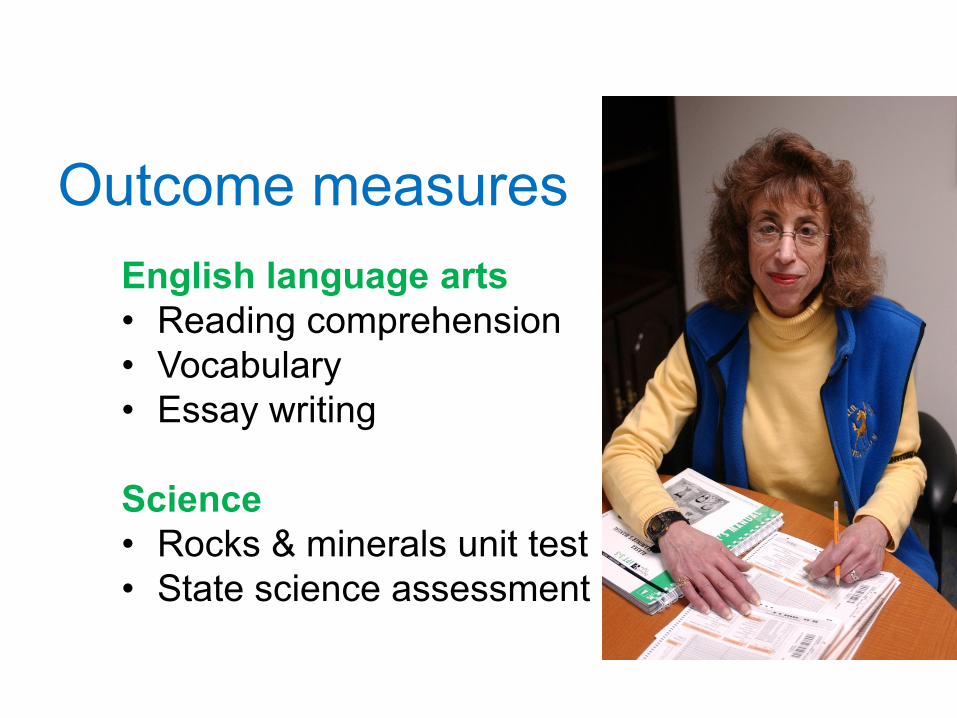
Outcome measures English language arts
•••
Reading comprehension Vocabulary Essay writing
Science ••
Rocks & minerals unit test State science assessment
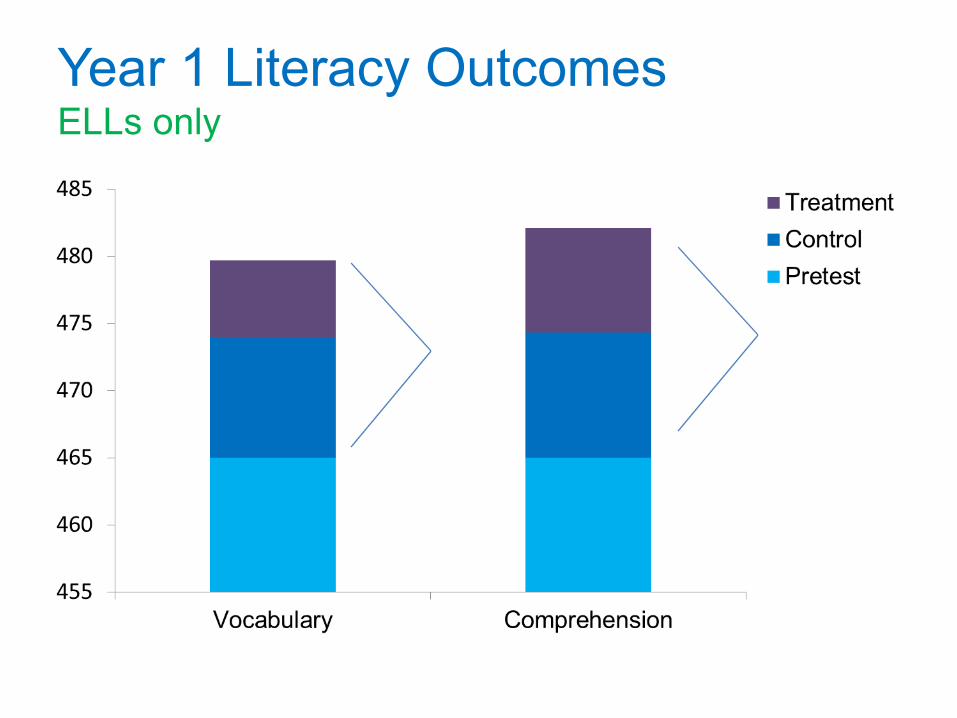
Year 1 Literacy Outcomes ELLs only
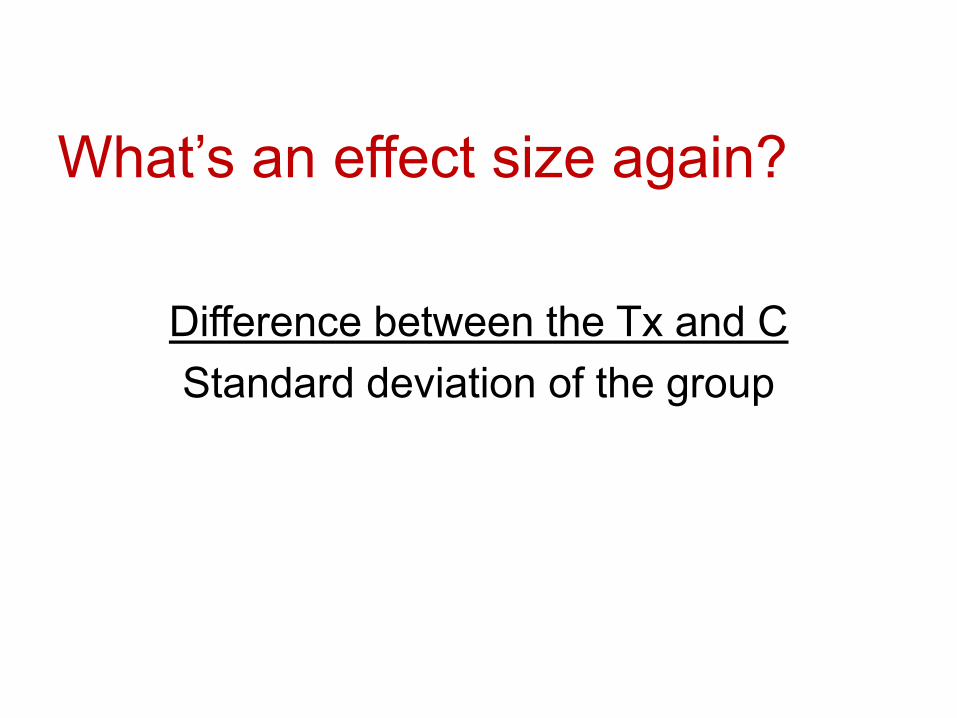
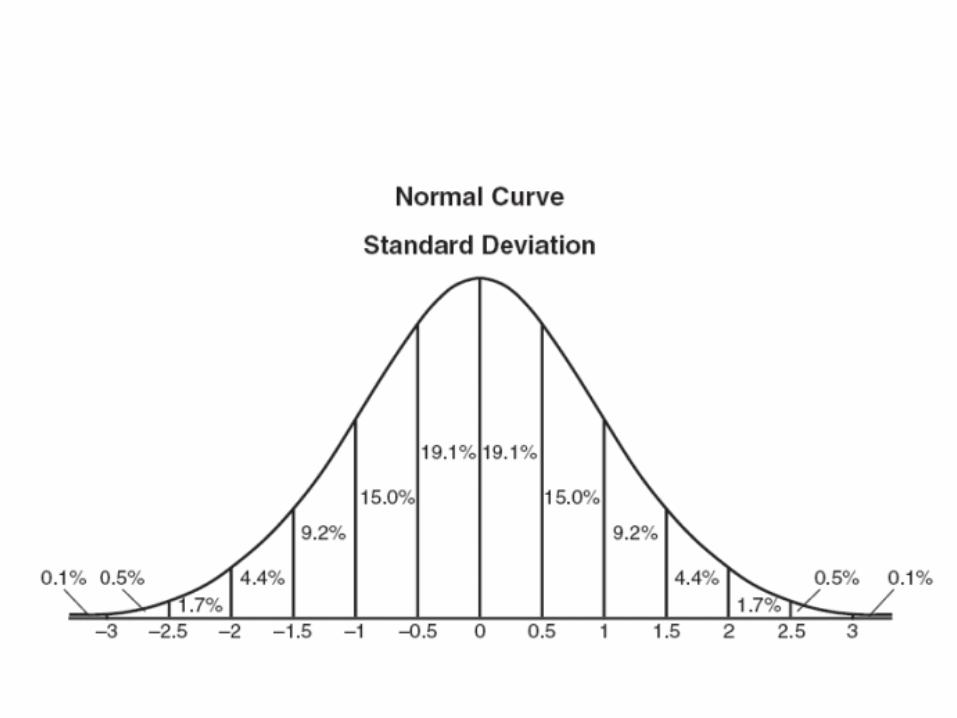
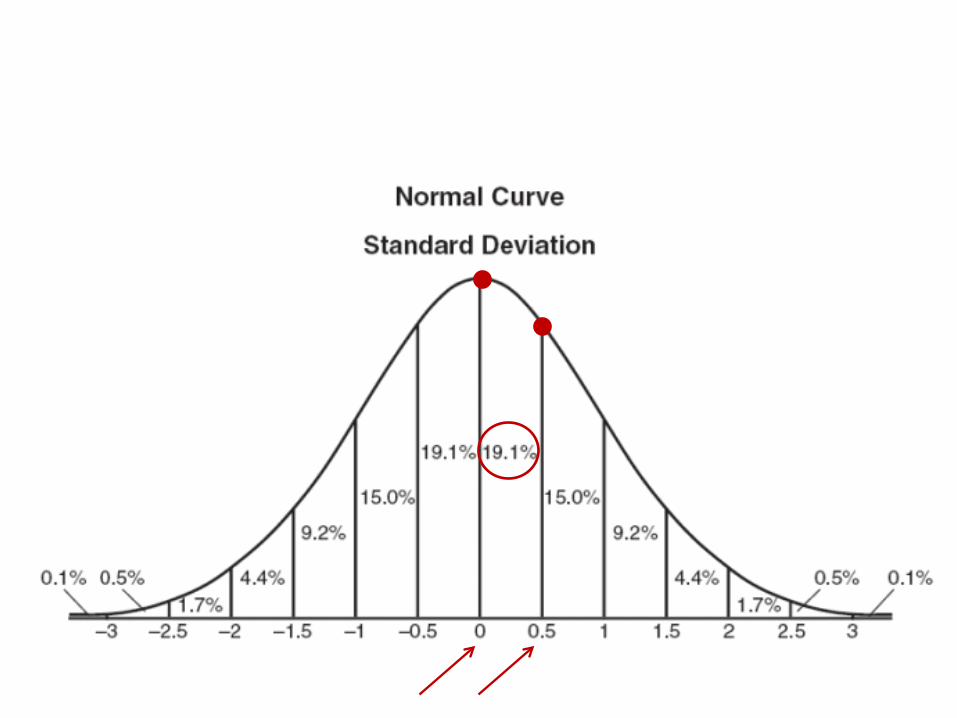
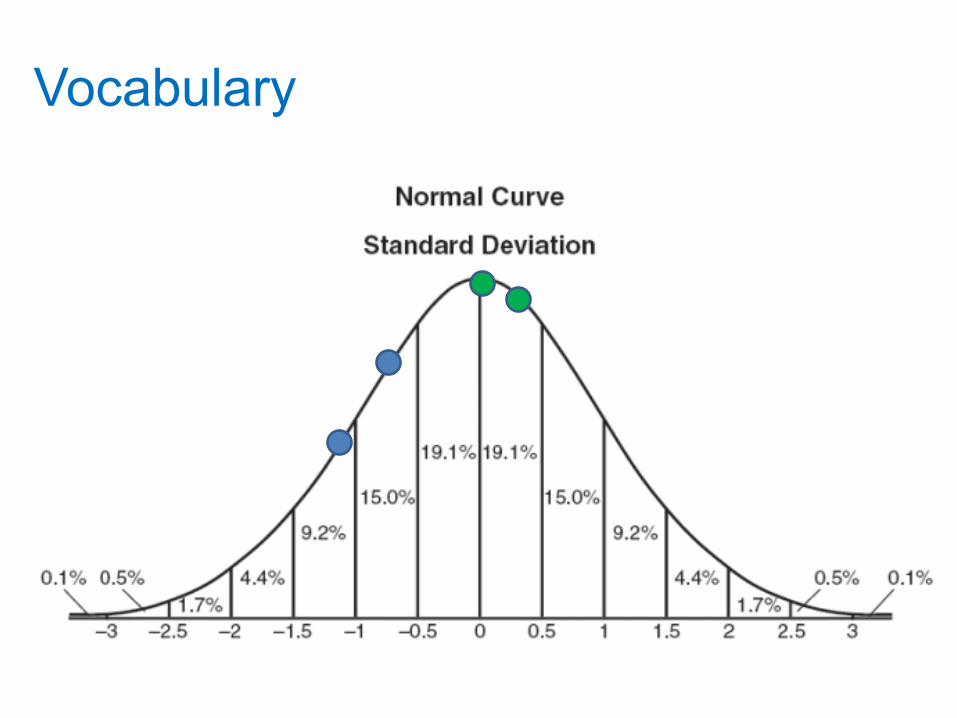
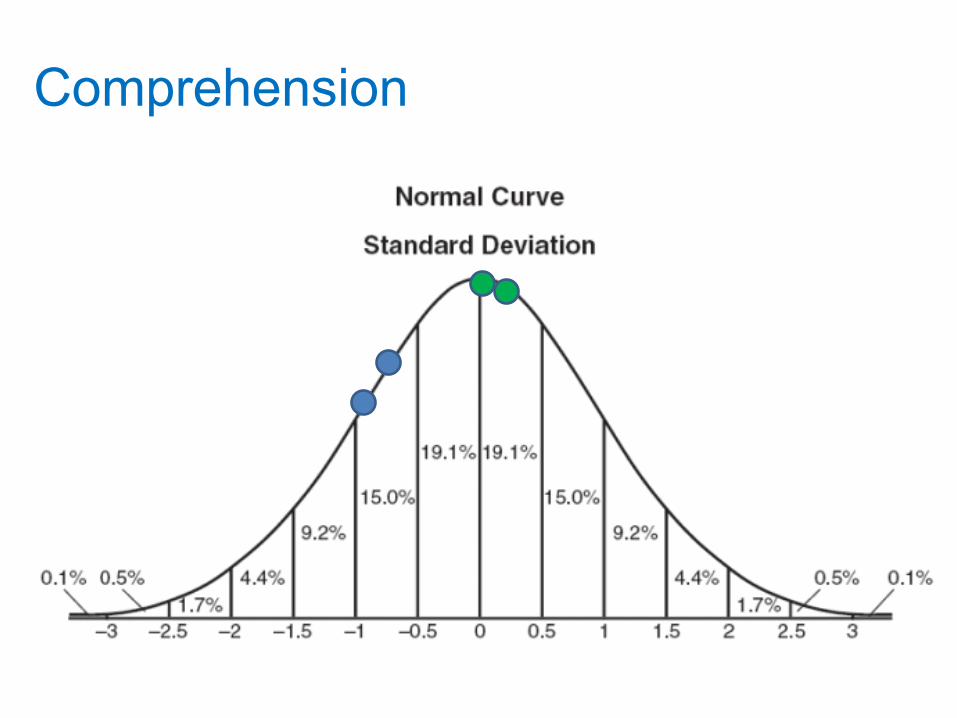
What’s an effect size again?
Difference between the Tx and C Standard deviation of the group
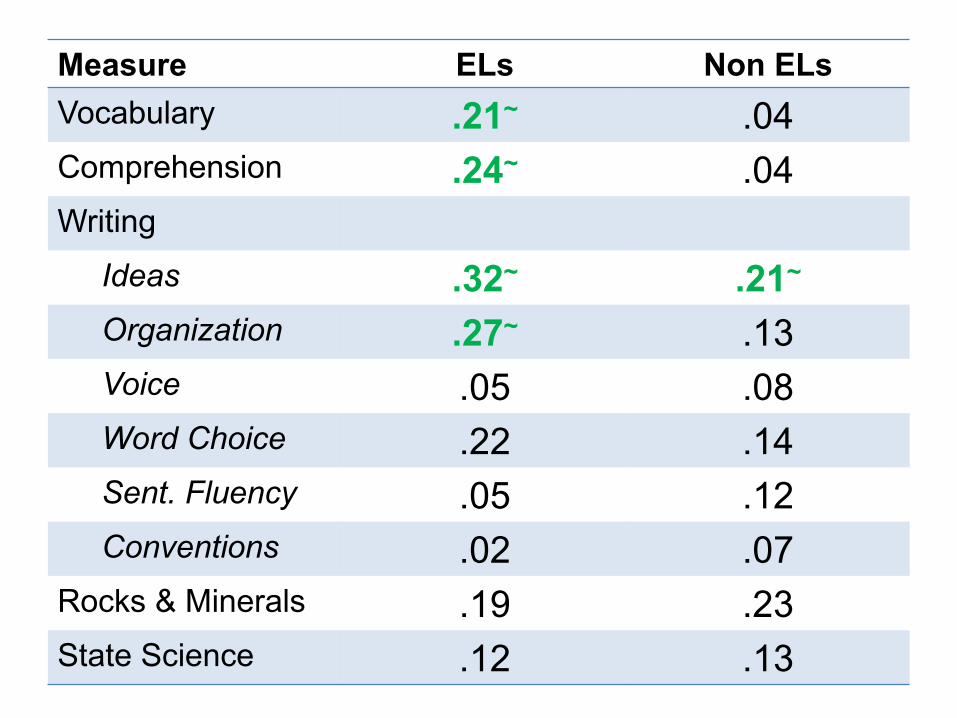
Measure ELs Non ELs Vocabulary .21~ .04 Comprehension .24~ .04 Writing
Ideas .32~ .21~ Organization .27~ .13 Voice .05 .08 Word Choice .22 .14 Sent. Fluency .05 .12 Conventions .02 .07 Rocks & Minerals .19 .23 State Science .12 .13
What’s a good effect size?
Use empirical comparisons.
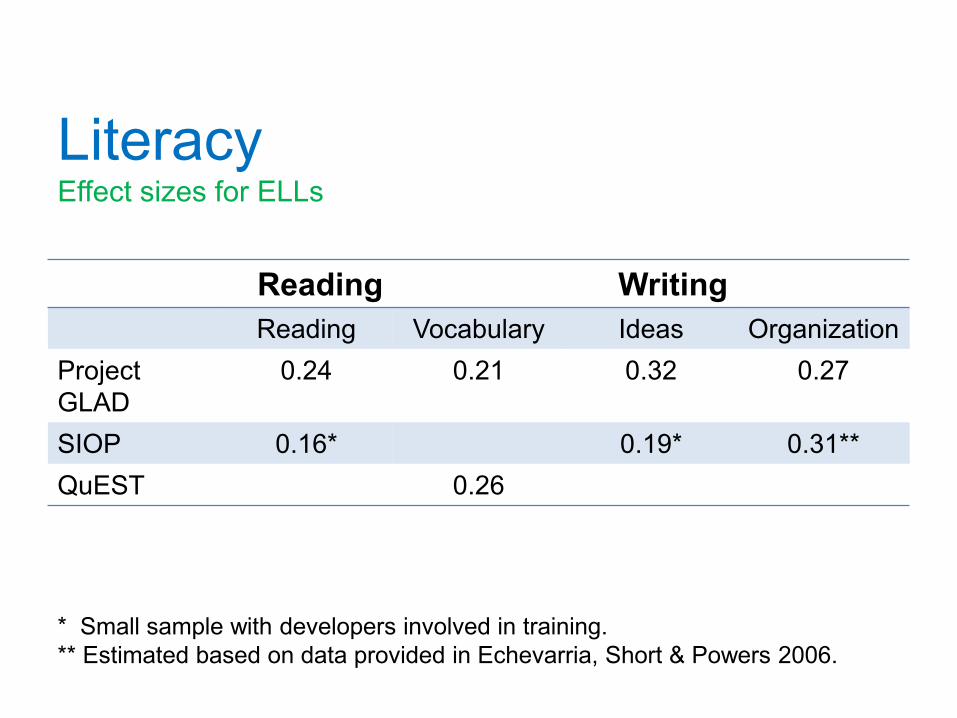
Literacy Effect sizes for ELLs
Reading Writing Reading Vocabulary Ideas Organization
Project GLAD
0.24 0.21 0.32 0.27
SIOP 0.16* 0.19* 0.31** QuEST 0.26
* Small sample with developers involved in training. ** Estimated based on data provided in Echevarria, Short & Powers 2006.
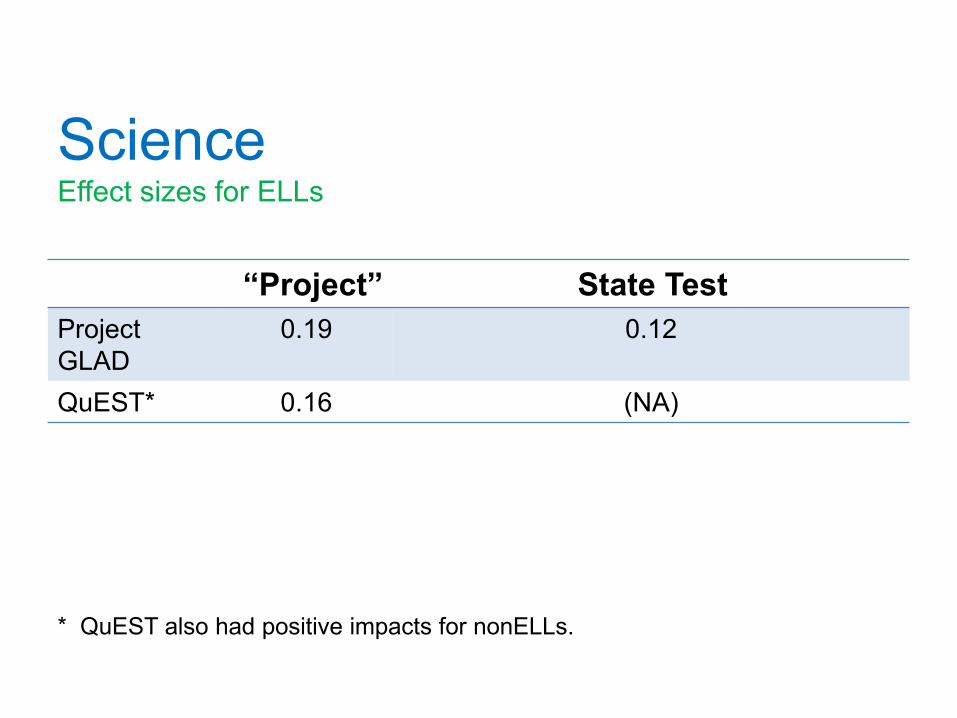
Science Effect sizes for ELLs
“Project” State Test Project GLAD
0.19 0.12
QuEST* 0.16 (NA)
* QuEST also had positive impacts for nonELLs.
Back to our research questions What is the impact on Project GLAD on students’
reading, vocabulary, writing, and science achievement?
For ELLs? For nonELLs?
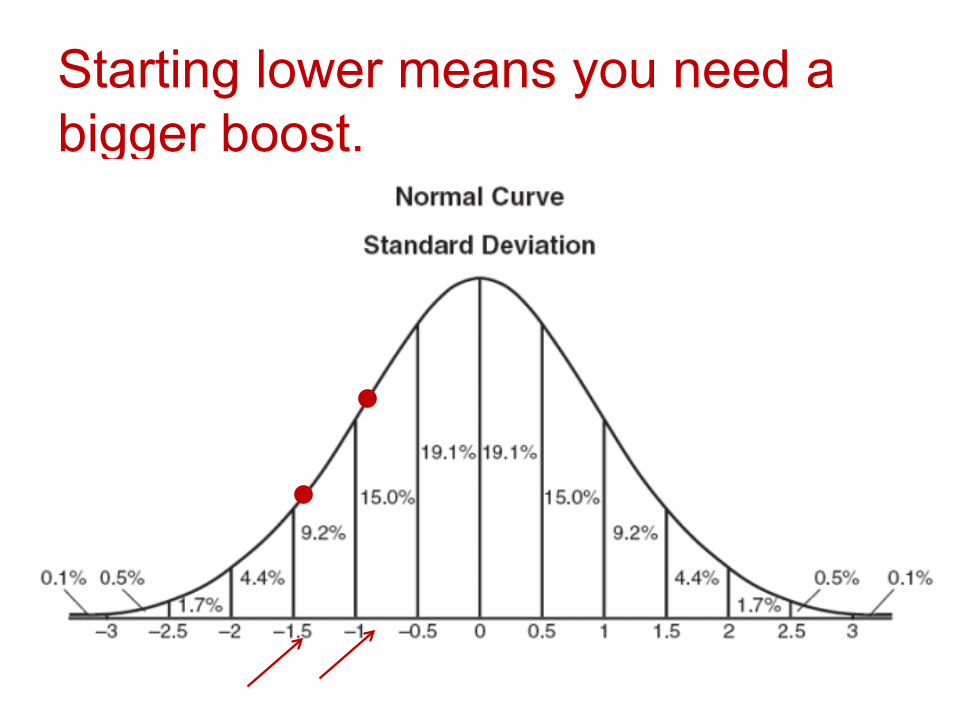
Starting lower means you need a bigger boost.
Vocabulary
Comprehension
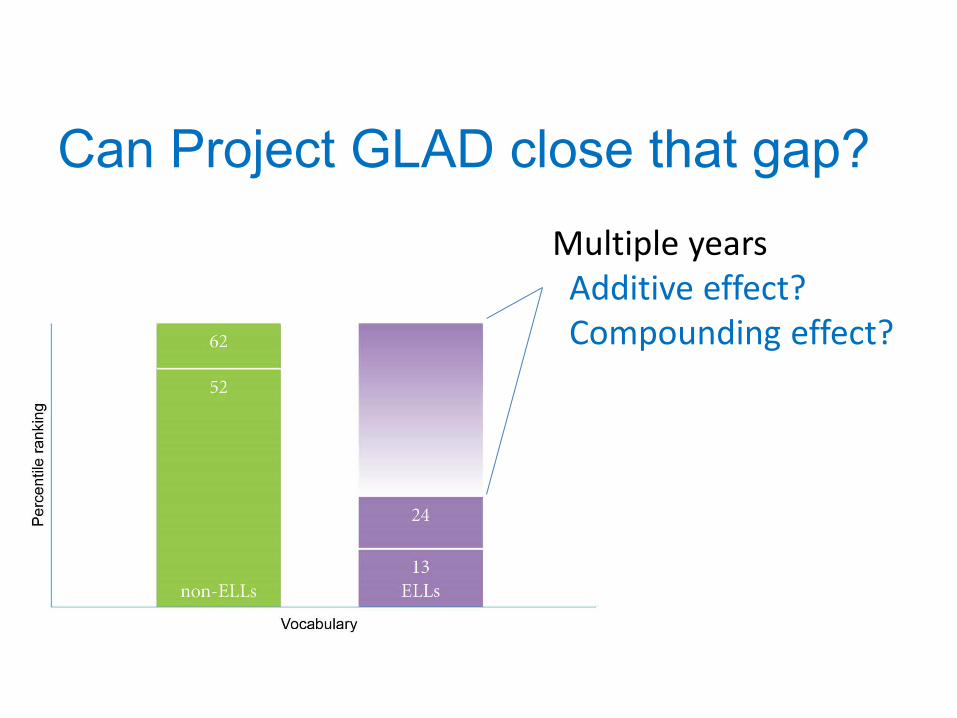
Can Project GLAD close that gap? Multiple years Additive effect? Compounding effect?
Reflections
Content of the PD Factors affecting implementation
Beyond the classroom
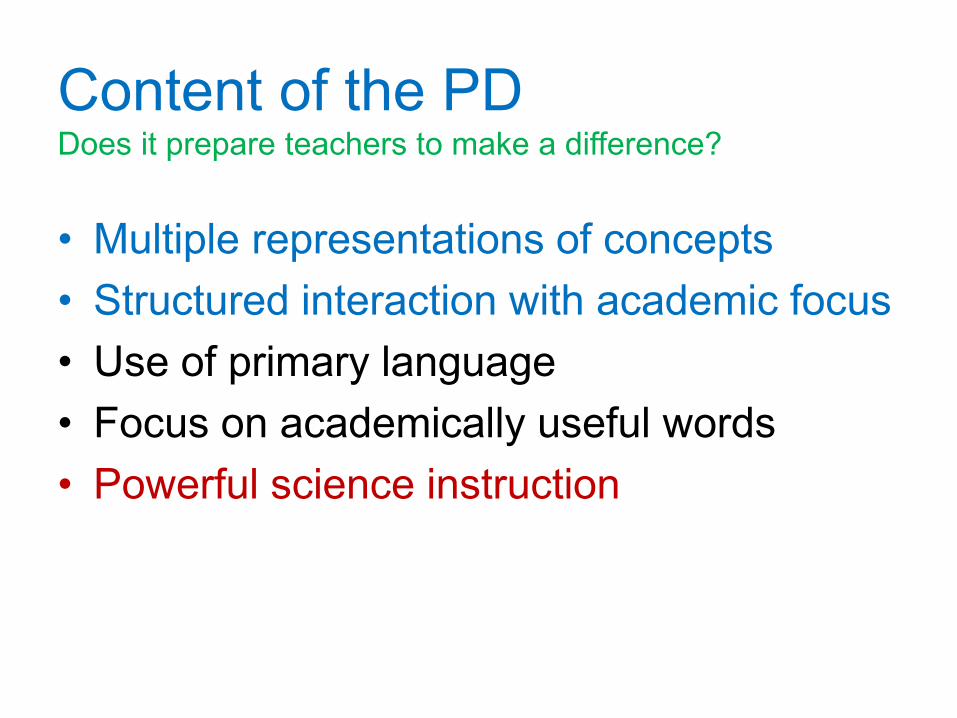
Content of the PD Does it prepare teachers to make a difference?
•••••
Multiple representations of concepts Structured interaction with academic focus Use of primary language Focus on academically useful words Powerful science instruction
•••
•
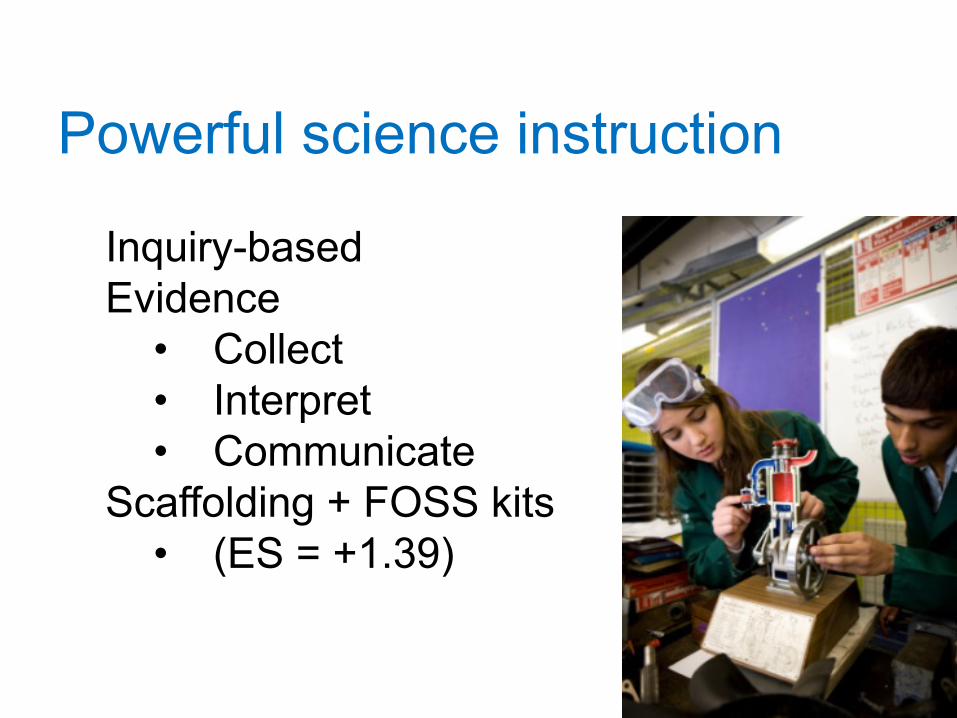
Powerful science instruction
Inquiry-based Evidence
Collect Interpret Communicate
Scaffolding + FOSS kits (ES = +1.39)
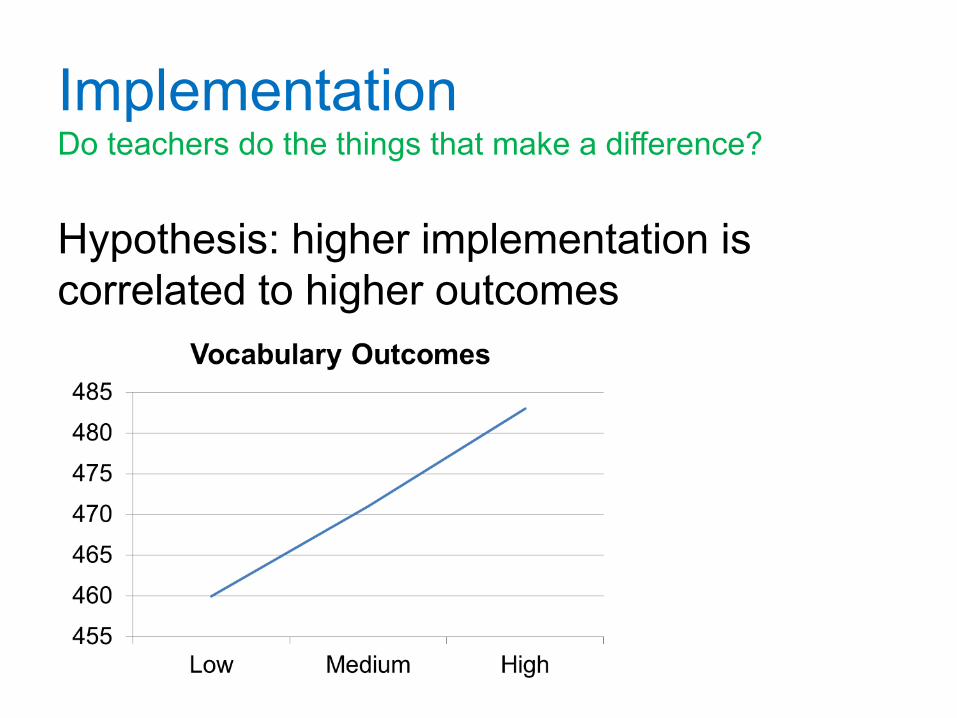
Implementation Do teachers do the things that make a difference?
Hypothesis: higher implementation is correlated to higher outcomes
35
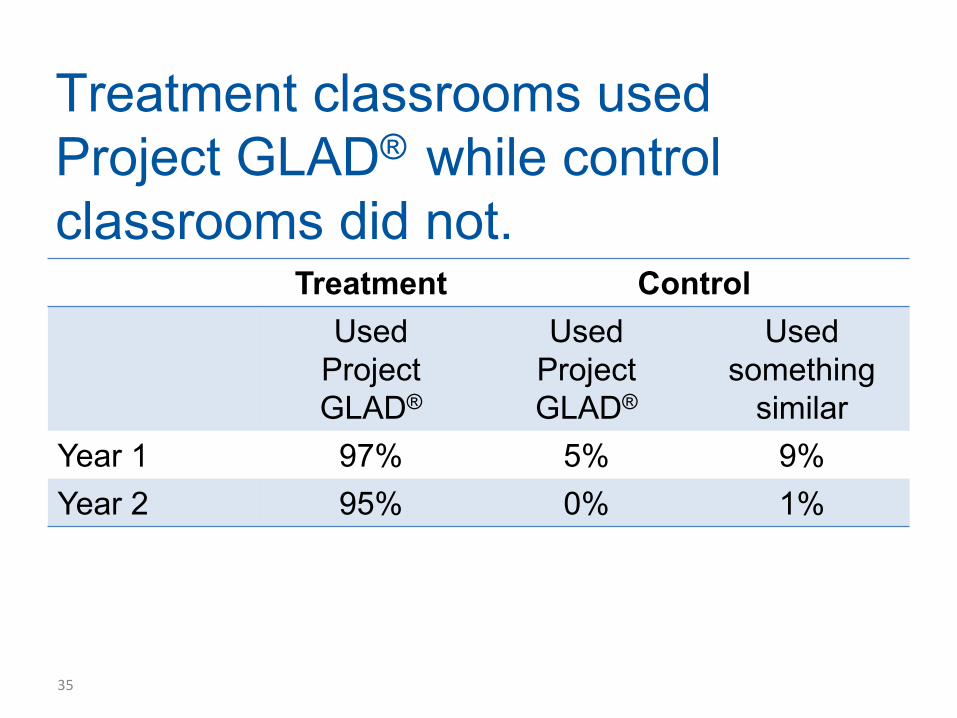
Treatment classrooms used Project GLAD® while control classrooms did not.
Treatment Control Used
Project GLAD®
Used Project GLAD®
Used something
similar Year 1 97% 5% 9% Year 2 95% 0% 1%
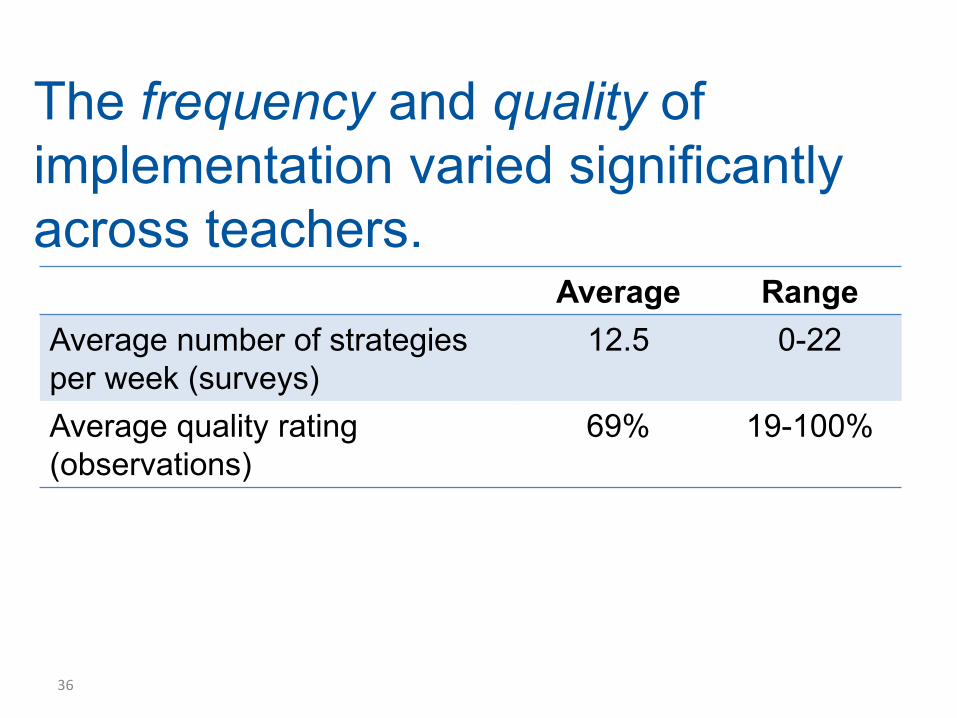
36
The frequency and quality of implementation varied significantly across teachers.
Average Range Average number of strategies per week (surveys)
12.5 0-22
Average quality rating (observations)
69% 19-100%
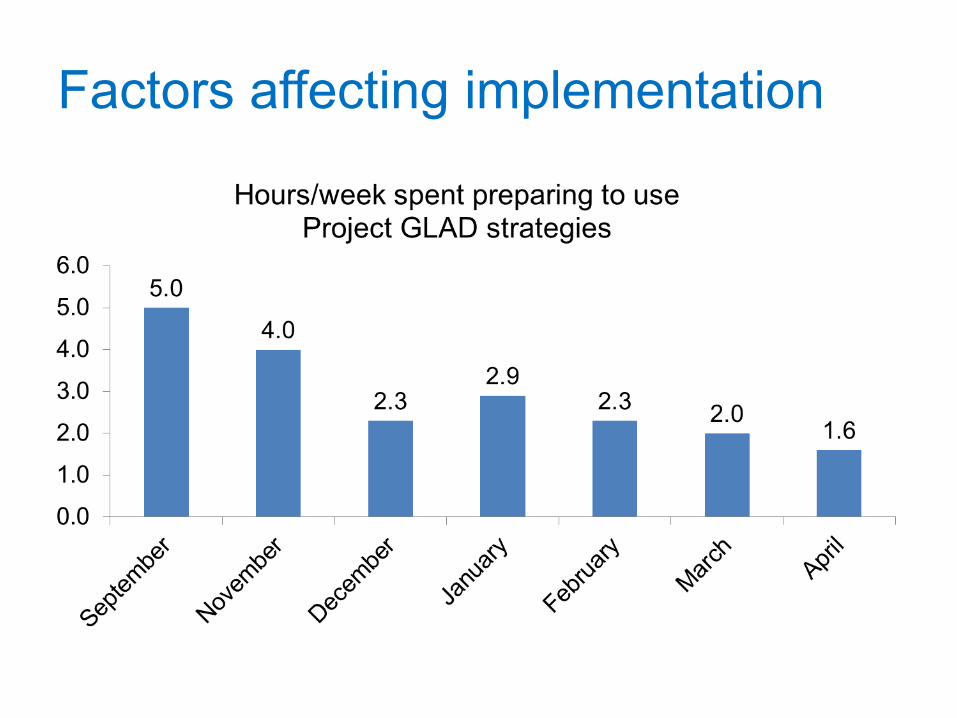
Factors affecting implementation
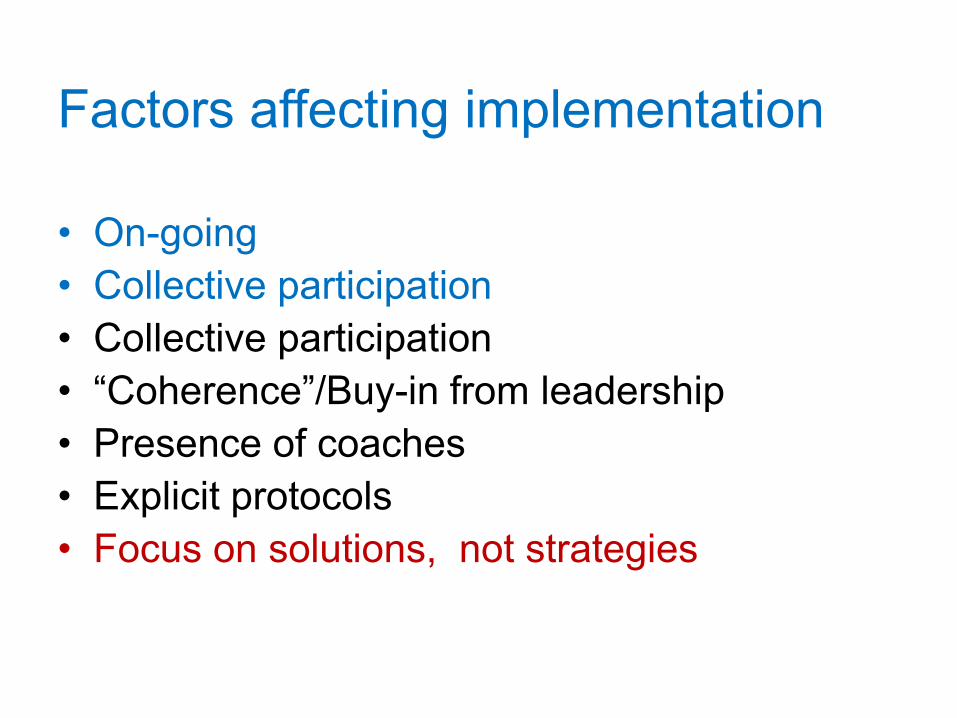
Factors affecting implementation
•••••••
On-going Collective participation Collective participation “Coherence”/Buy-in from leadership Presence of coaches Explicit protocols Focus on solutions, not strategies
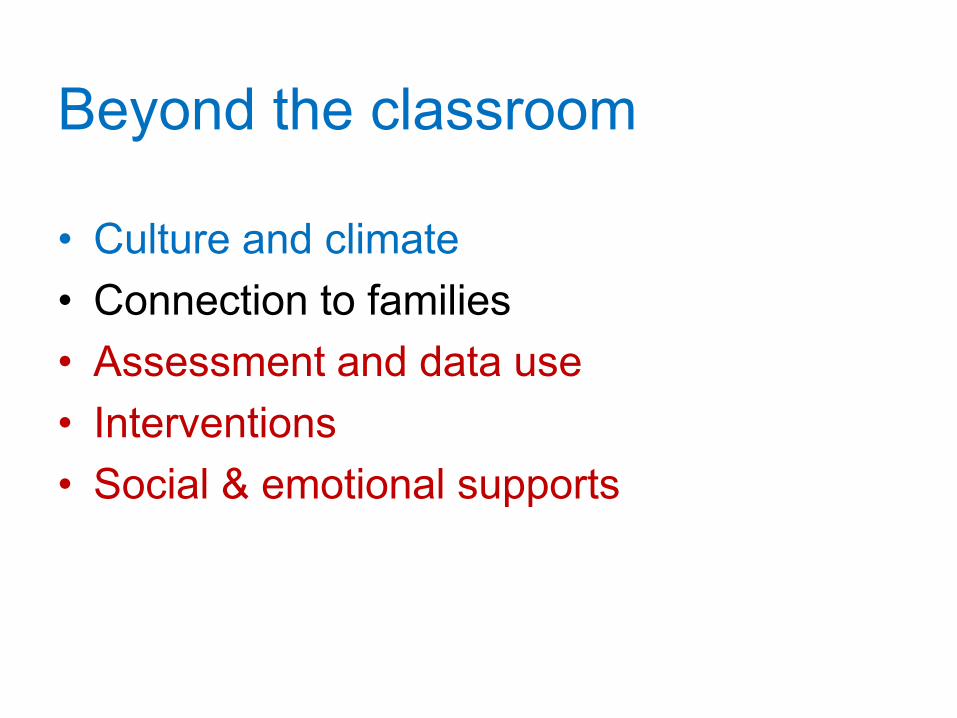
Beyond the classroom
•••••
Culture and climate Connection to families Assessment and data use Interventions Social & emotional supports
More about the study http://projectgladstudy.educationnorthwest.org/
Contact us
Thanks to our funders The research reported here was supported by the Institute of
Education Sciences, U.S. Department of Education, through Grant R305A100583 to Education Northwest. The opinions expressed are those of the authors and do not represent views of the Institute or the U.S. Department of Education.
41