Embed Size (px)
DESCRIPTION
Chapter 2. Financial Statements And Cash Flow Analysis. Professor Thomson Finance 3014. Asset, Liability, Equity. - PowerPoint PPT Presentation
Citation preview
Chapter 2. Financial Statements And
Cash Flow AnalysisProfessor Thomson
Finance 3014
2
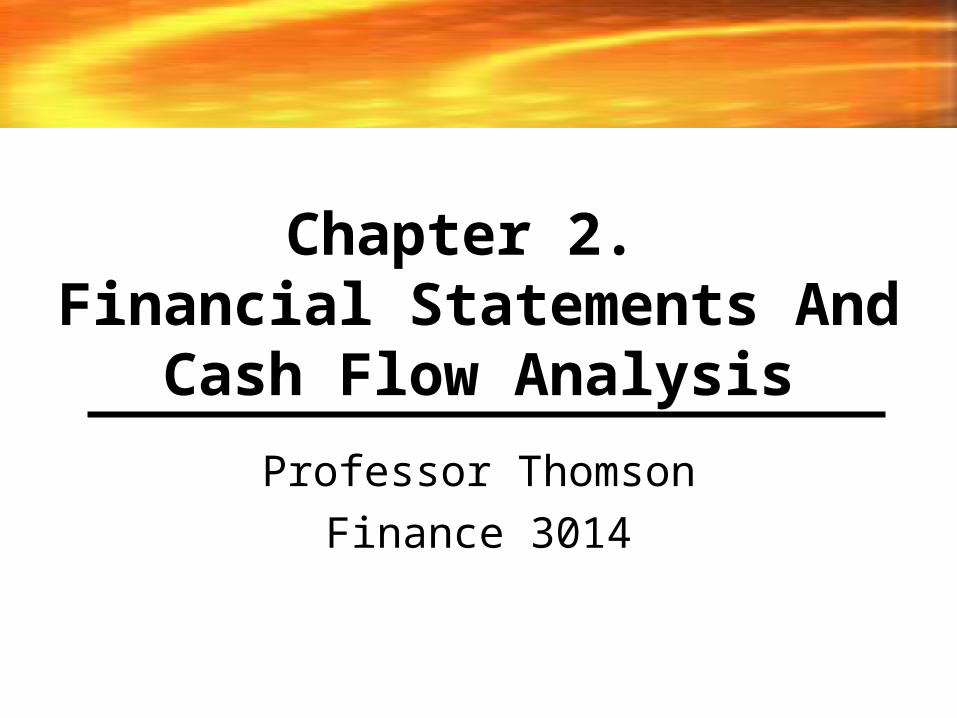
Asset, Liability, Equity• Asset – something that has value
(typically can be sold for $). Why does it have value? It produces a benefit such as a cash flow. (Could be money in the bank, a house, car, college education)
• Liability – Something you have to pay for someone to take from you, like a loan (i.e. debt). It has negative value (to you).
• Equity – represents your ownership in something
3
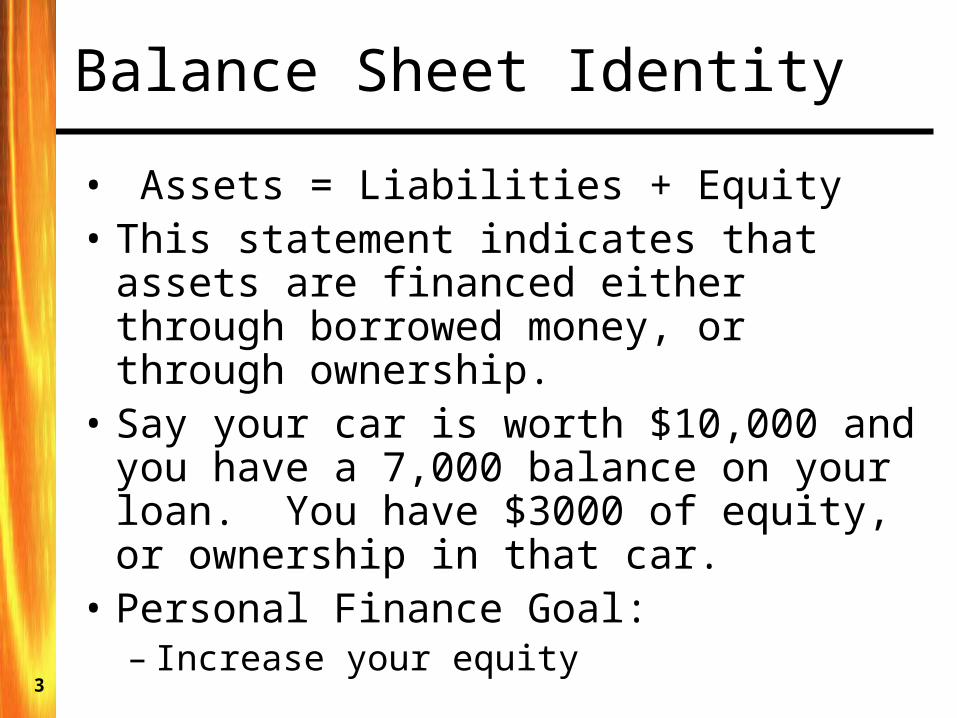
Balance Sheet Identity• Assets = Liabilities + Equity• This statement indicates that assets
are financed either through borrowed money, or through ownership.
• Say your car is worth $10,000 and you have a 7,000 balance on your loan. You have $3000 of equity, or ownership in that car.
• Personal Finance Goal: – Increase your equity
4
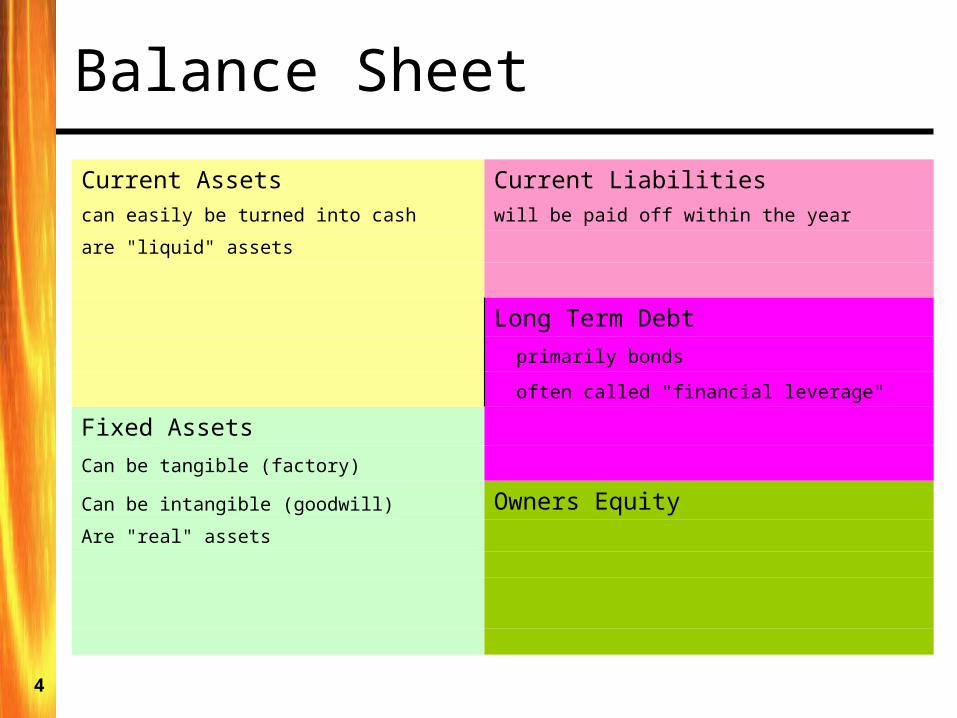
Balance SheetCurrent Assets Current Liabilitiescan easily be turned into cash will be paid off within the year
are "liquid" assets
Long Term Debt primarily bonds
often called "financial leverage"
Fixed Assets
Can be tangible (factory)
Can be intangible (goodwill) Owners EquityAre "real" assets
5
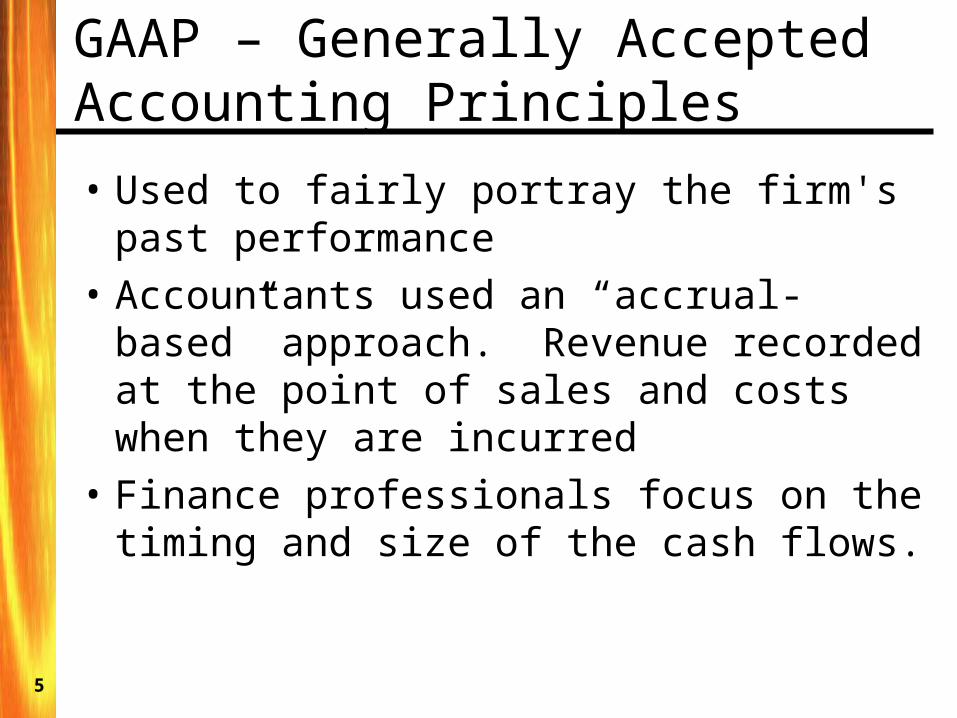
GAAP – Generally Accepted Accounting Principles• Used to fairly portray the firm's past
performance• Accountants used an “accrual-based”
approach. Revenue recorded at the point of sales and costs when they are incurred
• Finance professionals focus on the timing and size of the cash flows.
6
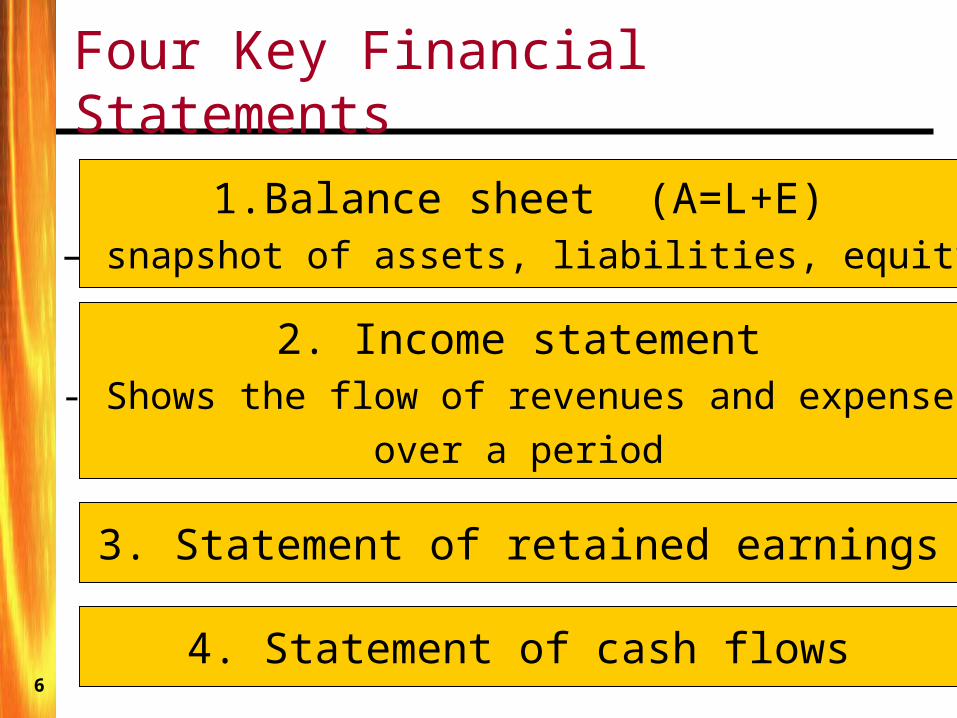
Four Key Financial Statements
1.Balance sheet (A=L+E)– snapshot of assets, liabilities, equity
2. Income statement- Shows the flow of revenues and expenses
over a period
3. Statement of retained earnings
4. Statement of cash flows
7
Financial Statements
Financial Managers and analysts use financial statements to conduct:
-Cash Flow Analysis
-Performance (Ratio) Analysis
8
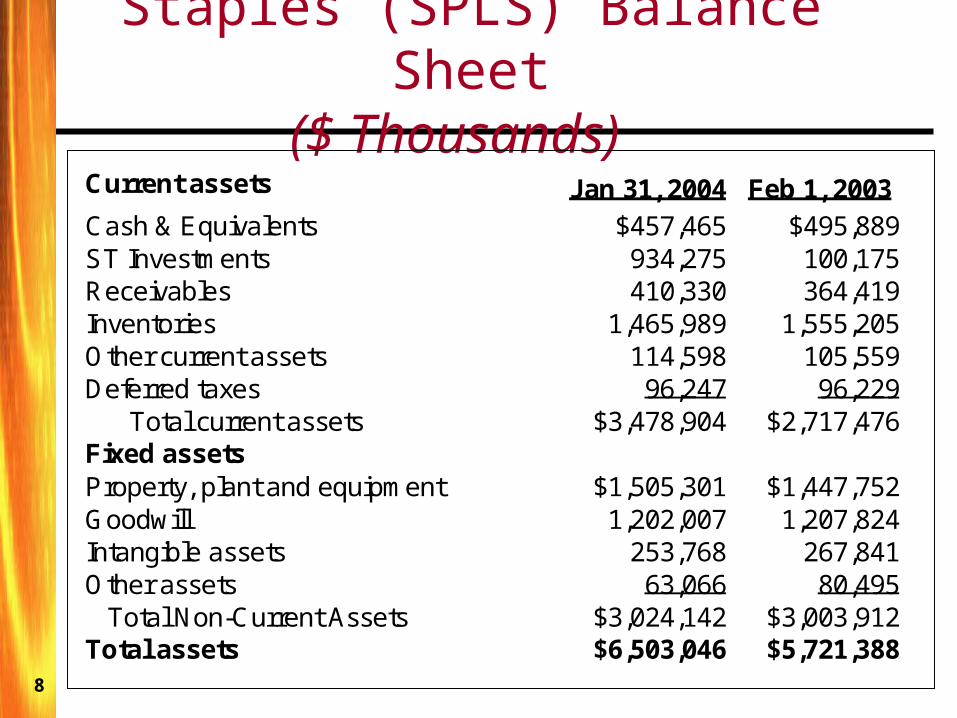
Staples (SPLS) Balance Sheet($ Thousands)
Current assets Jan 31, 2004 Feb 1, 2003 Cash & Equivalents $457,465 $495,889 ST Investments 934,275 100,175 Receivables 410,330 364,419 Inventories 1,465,989 1,555,205 Other current assets 114,598 105,559 Deferred taxes 96,247 96,229 Total current assets $3,478,904 $2,717,476 Fixed assets Property, plant and equipment $1,505,301 $1,447,752 Goodwill 1,202,007 1,207,824 Intangible assets 253,768 267,841 Other assets 63,066 80,495 Total Non-Current Assets $3,024,142 $3,003,912 Total assets $6,503,046 $5,721,388
9
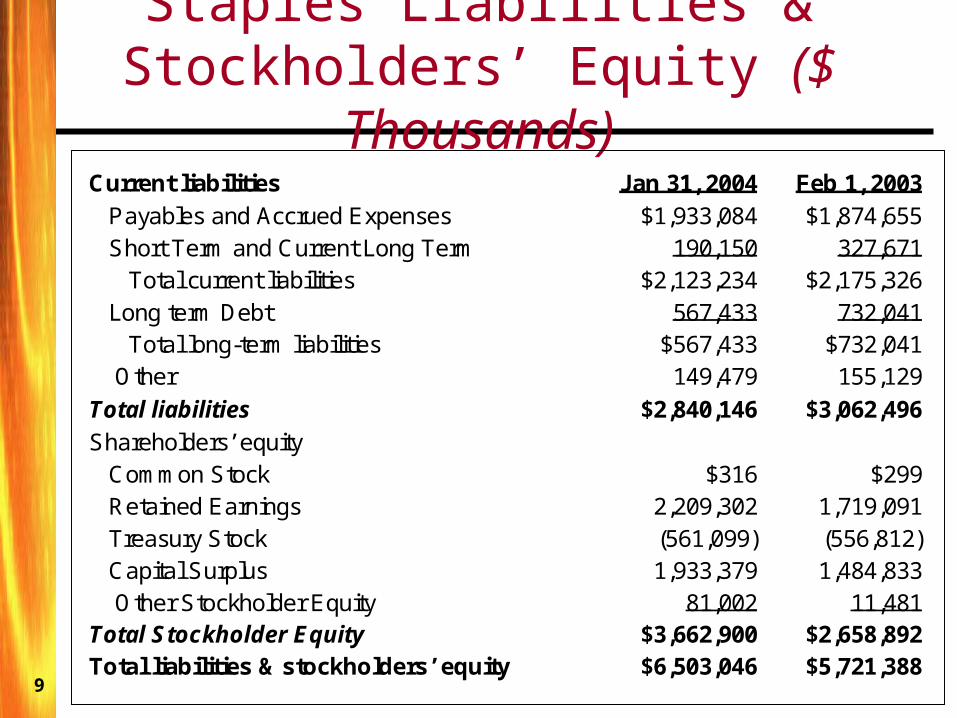
Staples Liabilities & Stockholders’ Equity ($
Thousands) Current liabilities Jan 31, 2004 Feb 1, 2003 Payables and Accrued Expenses $1,933,084 $1,874,655 Short Term and Current Long Term 190,150 327,671 Total current liabilities $2,123,234 $2,175,326 Long term Debt 567,433 732,041 Total long-term liabilities $567,433 $732,041 Other 149,479 155,129 Total liabilities $2,840,146 $3,062,496 Shareholders’ equity Common Stock $316 $299 Retained Earnings 2,209,302 1,719,091 Treasury Stock (561,099) (556,812) Capital Surplus 1,933,379 1,484,833 Other Stockholder Equity 81,002 11,481 Total Stockholder Equity $3,662,900 $2,658,892 Total liabilities & stockholders’ equity $6,503,046 $5,721,388
10
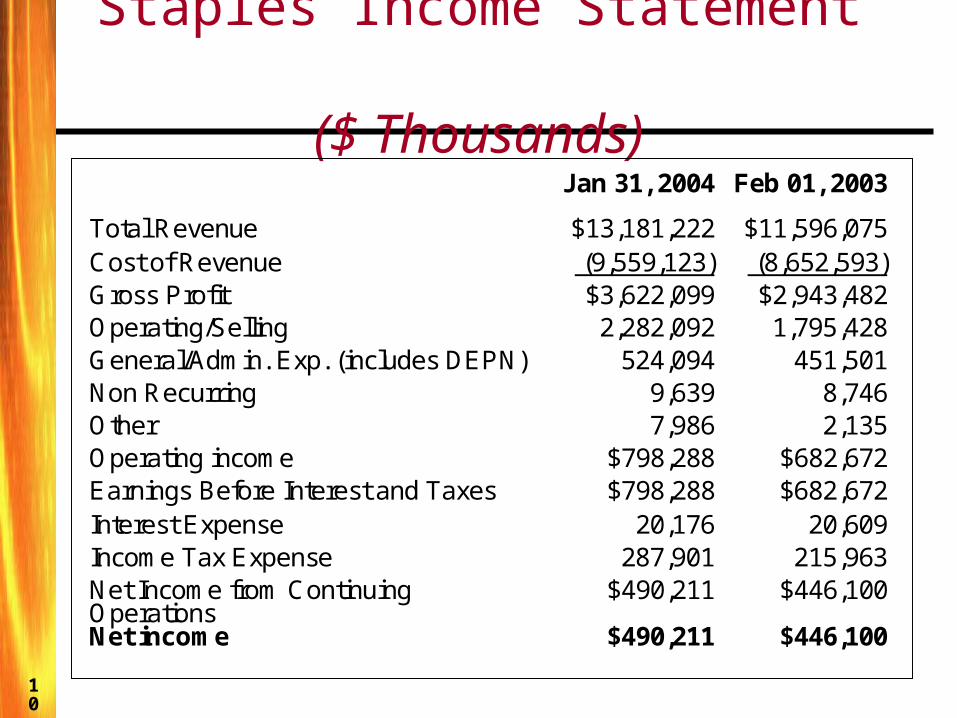
Staples Income Statement ($ Thousands)
Jan 31, 2004
Feb 01, 2003 Total Revenue $13,181,222 $11,596,075 Cost of Revenue (9,559,123) (8,652,593) Gross Profit $3,622,099 $2,943,482 Operating/Selling 2,282,092 1,795,428 General/Admin. Exp. (includes DEPN) 524,094 451,501 Non Recurring 9,639 8,746 Other 7,986 2,135 Operating income $798,288 $682,672 Earnings Before Interest and Taxes $798,288 $682,672 Interest Expense 20,176 20,609 Income Tax Expense 287,901 215,963 Net Income from Continuing Operations
$490,211 $446,100
Net income $490,211 $446,100
11
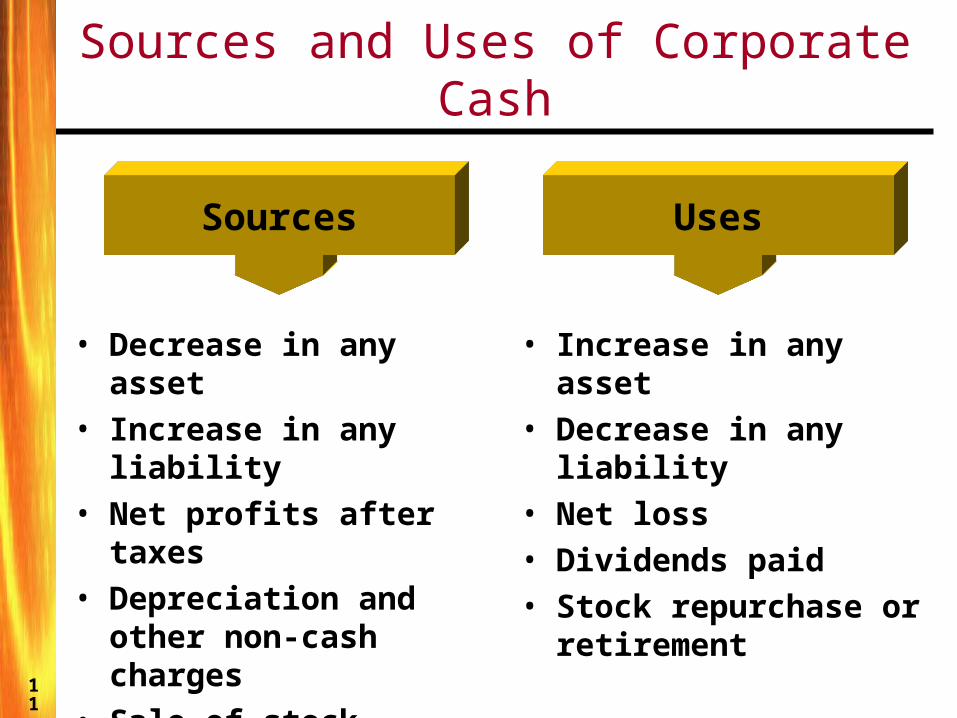
Sources and Uses of Corporate Cash
Sources
• Decrease in any asset
• Increase in any liability
• Net profits after taxes
• Depreciation and other non-cash charges
• Sale of stock
Uses
• Increase in any asset• Decrease in any
liability• Net loss• Dividends paid• Stock repurchase or
retirement
12
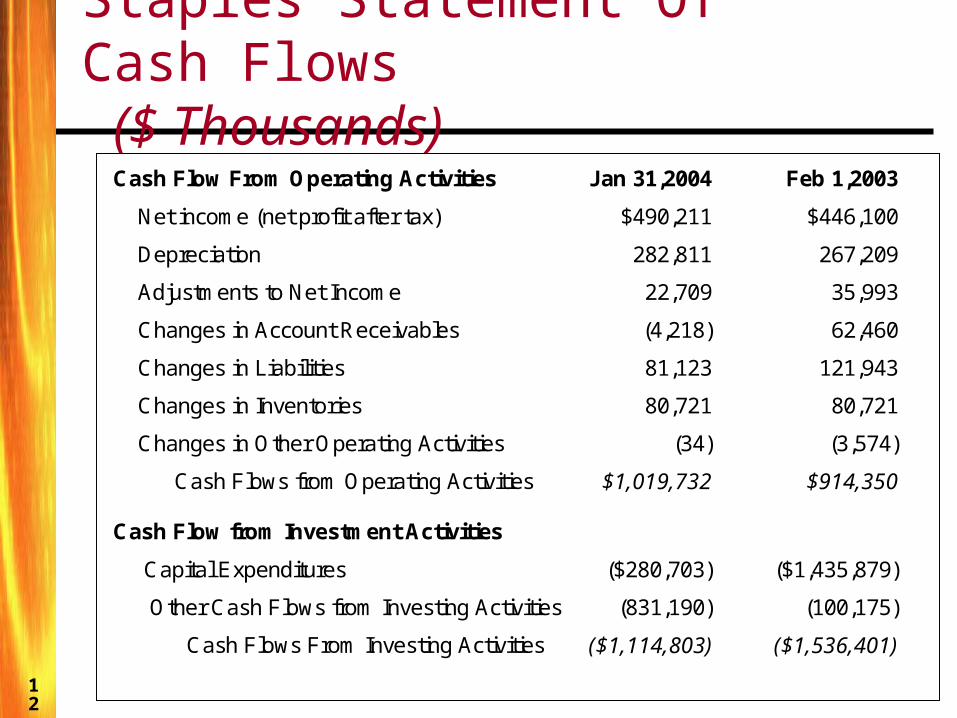
Staples Statement Of Cash Flows ($ Thousands)
Cash Flow From Operating Activities
Jan 31,2004
Feb 1,2003 Net income (net profit after tax) $490,211 $446,100
Depreciation 282,811 267,209
Adjustments to Net Income 22,709 35,993
Changes in Account Receivables (4,218) 62,460
Changes in Liabilities 81,123 121,943
Changes in Inventories 80,721 80,721
Changes in Other Operating Activities (34) (3,574)
Cash Flows from Operating Activities $1,019,732 $914,350
Cash Flow from Investment Activities
Capital Expenditures ($280,703) ($1,435,879)
Other Cash Flows from Investing Activities (831,190) (100,175)
Cash Flows From Investing Activities ($1,114,803) ($1,536,401)
13
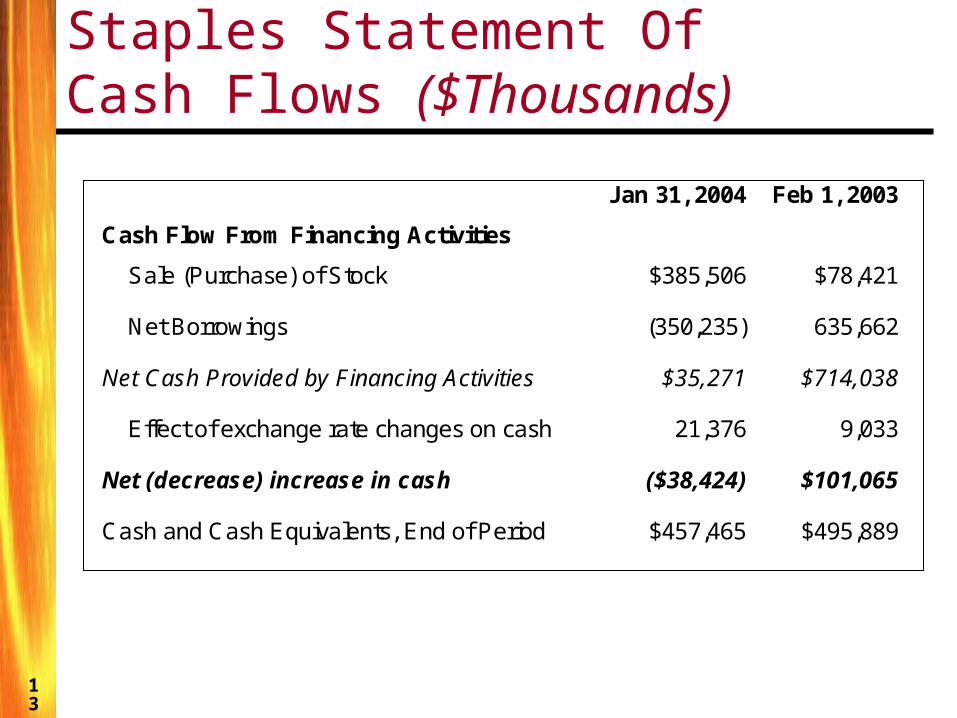
Staples Statement Of Cash Flows ($Thousands)
Cash Flow From Financing Activities Jan 31, 2004 Feb 1, 2003
Sale (Purchase) of Stock $385,506 $78,421
Net Borrowings (350,235) 635,662
Net Cash Provided by Financing Activities $35,271 $714,038
Effect of exchange rate changes on cash 21,376 9,033
Net (decrease) increase in cash ($38,424) $101,065
Cash and Cash Equivalents, End of Period $457,465 $495,889
14
Key Equation for Fin 3014• In this course we will study the cash
flows that result from fixed investments• An important cash flow item, derived
from the Income Statement, is the Operating Cash Flow (OCF) from an investment
• We will compute: OCF = EBIT – taxes +
depreciationEBIT is Earnings Before Interest and Taxes
15
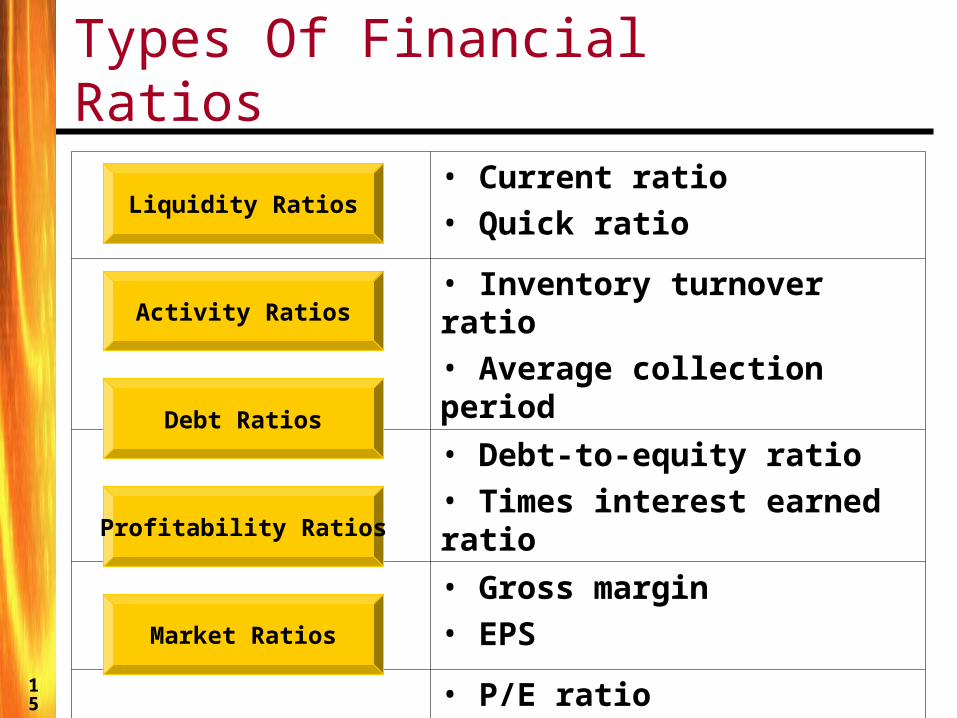
• Current ratio • Quick ratio• Inventory turnover ratio• Average collection period• Debt-to-equity ratio• Times interest earned ratio• Gross margin• EPS• P/E ratio• Market-to-book ratio
Types Of Financial Ratios
Activity Ratios
Debt Ratios
Profitability Ratios
Market Ratios
Liquidity Ratios
16
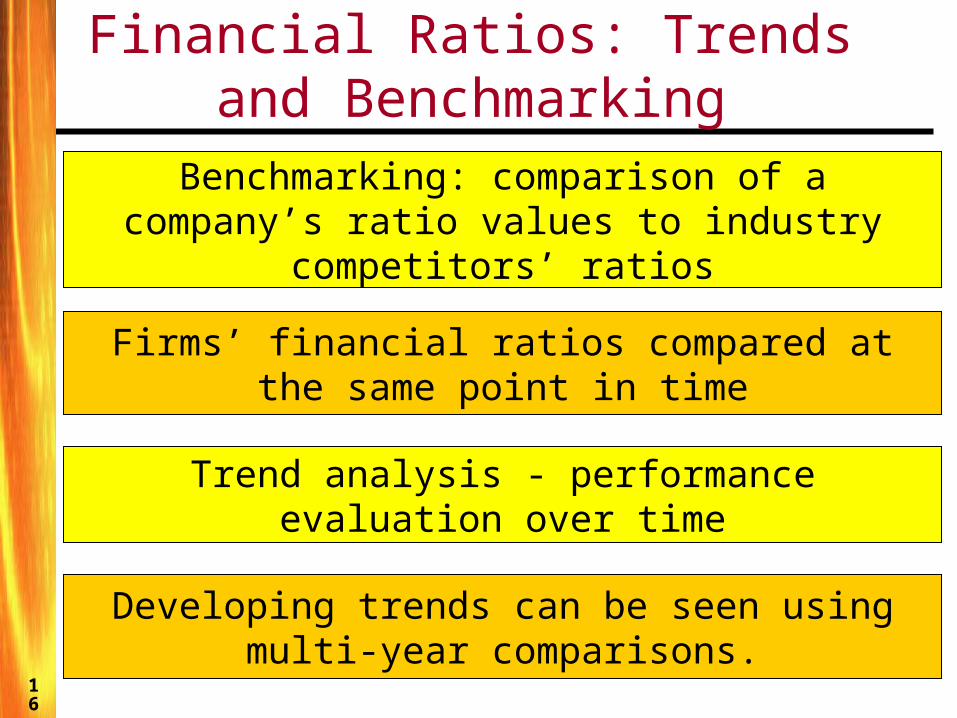
Financial Ratios: Trends and Benchmarking
Benchmarking: comparison of a company’s ratio values to industry competitors’ ratios
Firms’ financial ratios compared at the same point in time
Trend analysis - performance evaluation over time
Developing trends can be seen using multi-year comparisons.
17
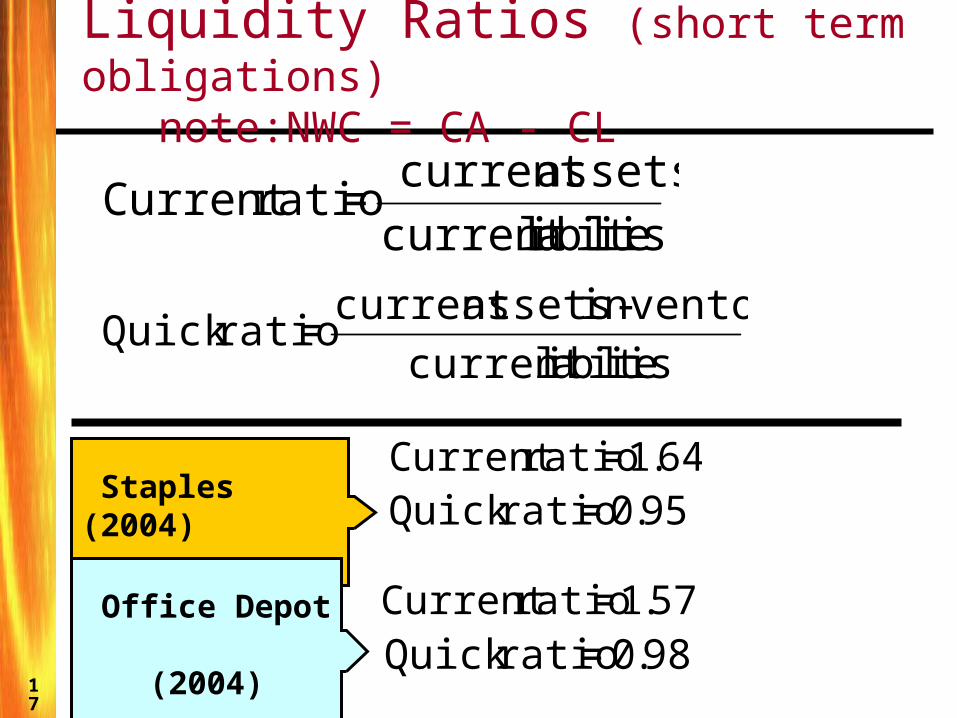
Liquidity Ratios (short term obligations) note:NWC = CA - CL
seitilibailcurrent assetscurrent = ratioCurrent
seitilibailcurrent inventoryassets-current = ratioQuick
Staples (2004)
64.1 = ratioCurrent 95.0 = ratioQuick
Office Depot (2004)
57.1 = ratioCurrent 98.0 = ratioQuick
18
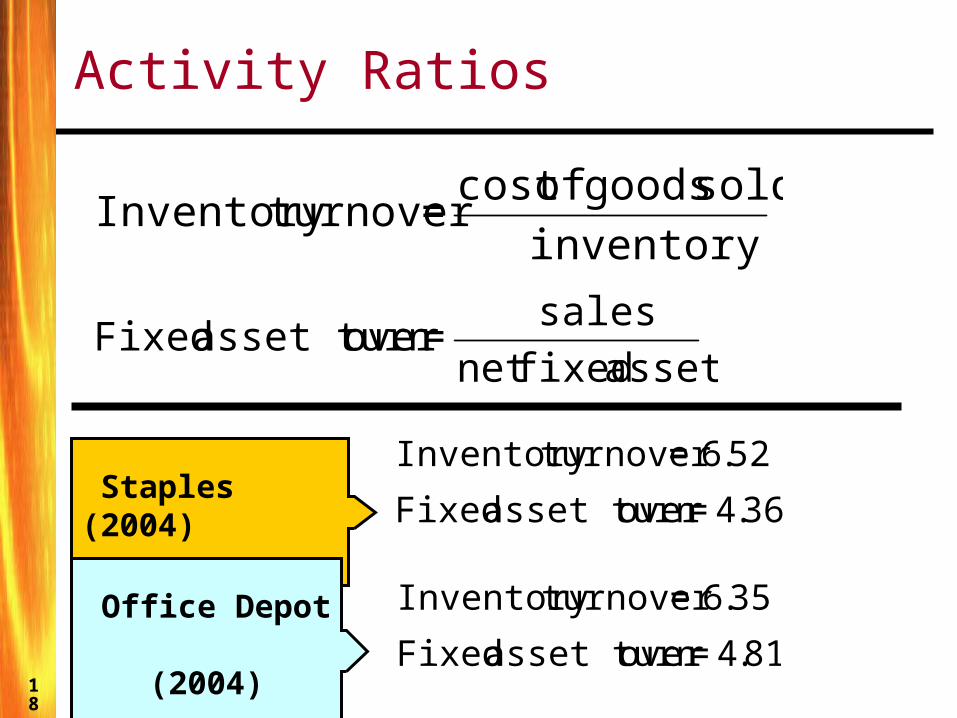
Activity Ratios
inventorysold goods ofcost = turnoverInventory
assets fixednet sales = overasset turn Fixed
52.6 = turnoverInventory 36.4 = overasset turn Fixed
Staples (2004)
Office Depot (2004)
35.6 = turnoverInventory 81.4 = overasset turn Fixed
19
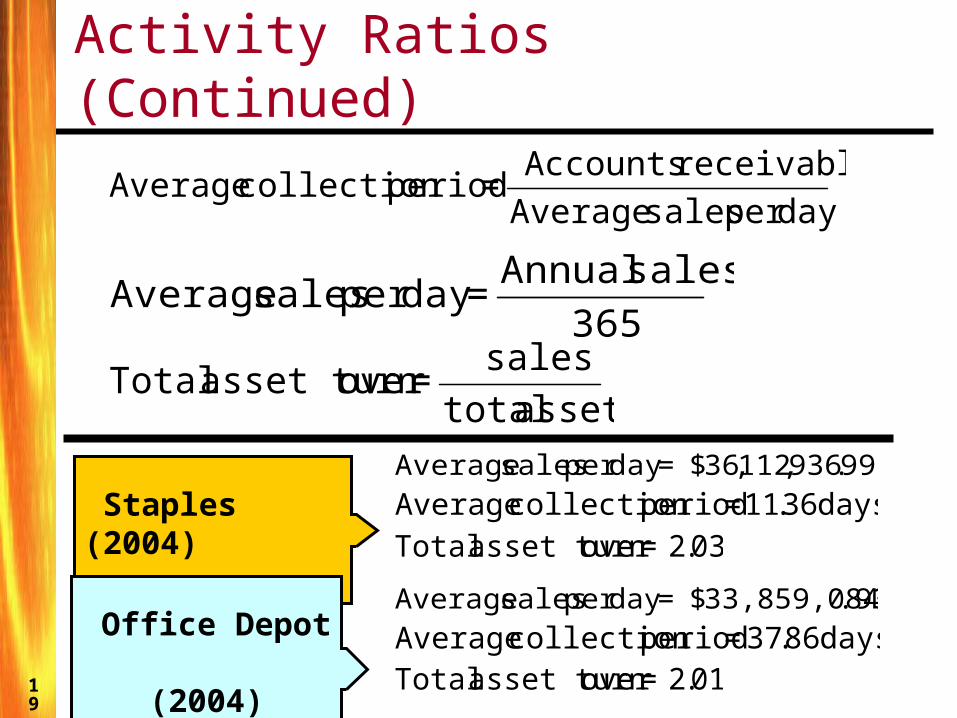
Activity Ratios (Continued)
daypersalesAveragereceivableAccounts = periodcollectionAverage
365salesAnnual
= daypersalesAverage
assets totalsales = overasset turn Total
99.936,112,36$ = daypersalesAveragedays 36.11 = periodcollectionAverage
03.2 = overasset turn Total Staples (2004)
Office Depot (2004)
.9333,859,084$ = daypersalesAveragedays 86.37 = periodcollectionAverage
01.2 = overasset turn Total
20
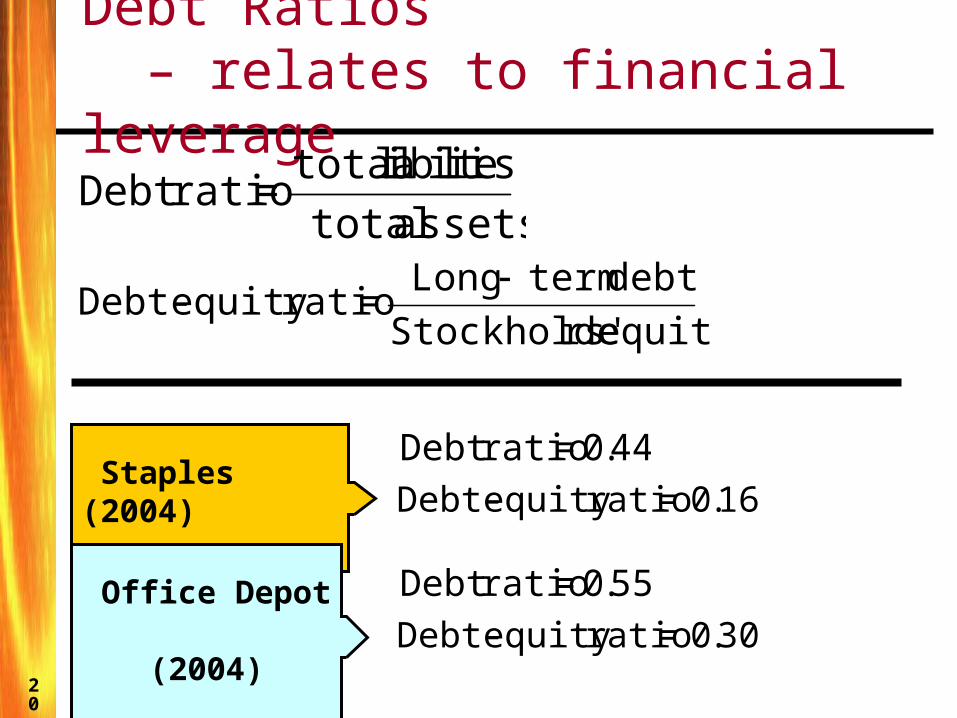
Debt Ratios – relates to financial leverage
equityrs'StockholdedebttermLong = ratioequity Debt-
assets totalseitilibail total
= ratioDebt
44.0 = ratioDebt 16.0 = ratioequity Debt-
Staples (2004)
Office Depot (2004)
55.0 = ratioDebt 30.0 = ratioequity Debt-
21
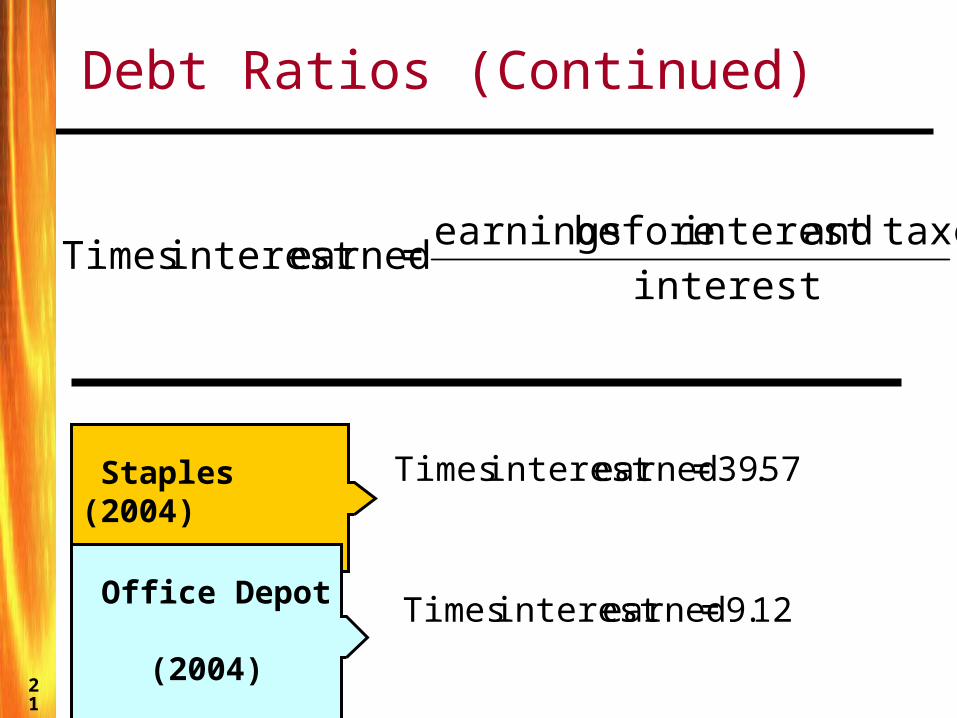
Debt Ratios (Continued)
interest taxesandinterest before earnings = earnedinterest Times
57.39 = earnedinterest Times Staples (2004)
Office Depot (2004) 12.9 = earnedinterest Times
22
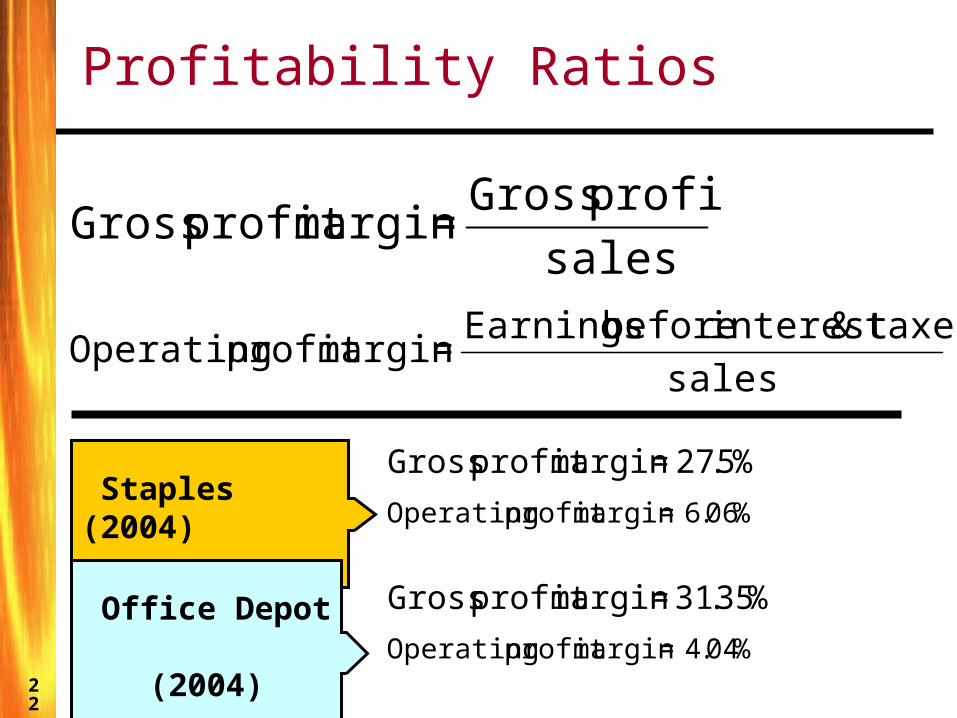
Profitability Ratios
salestaxes&interestbeforeEarnings = marginprofit Operating
sales
profitsGross = marginprofit Gross
%5.27 = marginprofit Gross%06.6 = marginprofit Operating
Staples (2004)
Office Depot (2004)
%35.31 = marginprofit Gross%04.4 = marginprofit Operating
23
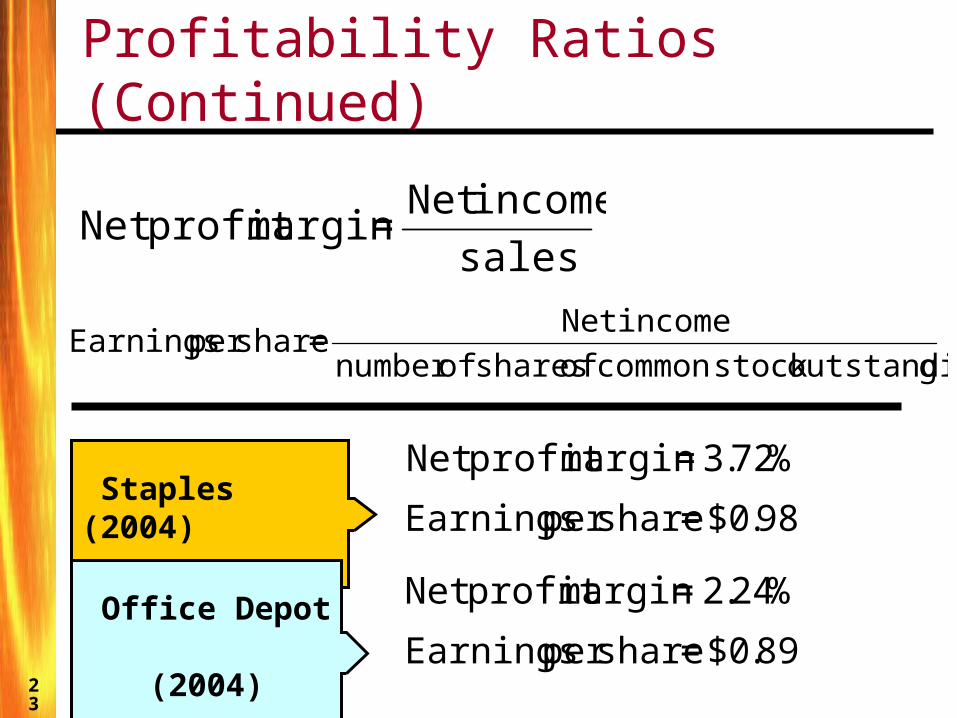
Profitability Ratios (Continued)
salesincomeNet = marginprofit Net
goutstandinstock common of shares ofnumber incomeNet = shareper Earnings
%72.3 = marginprofit Net 98.0$ = shareper Earnings
Staples (2004)
Office Depot (2004)
%24.2 = marginprofit Net 89.0$ = shareper Earnings
24
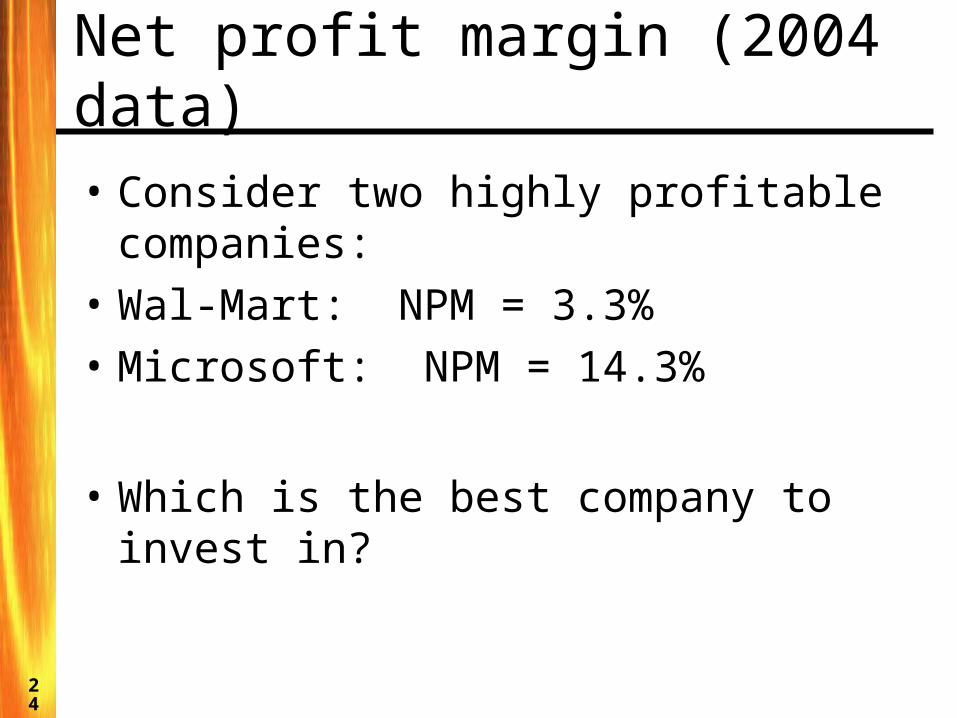
Net profit margin (2004 data)• Consider two highly profitable
companies:• Wal-Mart: NPM = 3.3%• Microsoft: NPM = 14.3%
• Which is the best company to invest in?
25
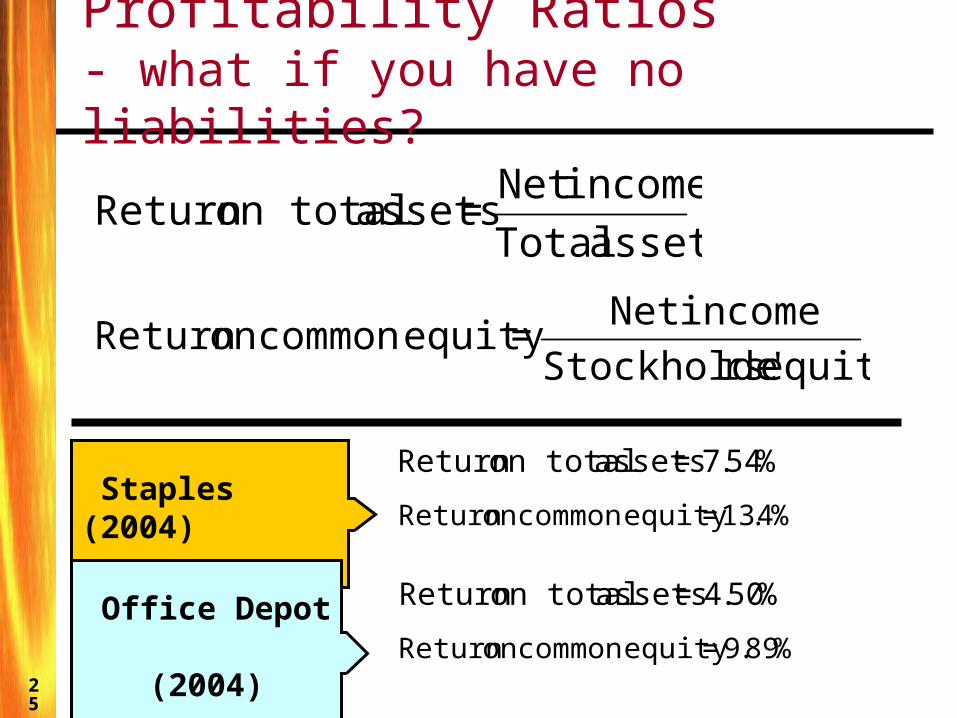
Profitability Ratios - what if you have no liabilities?
assets TotalincomeNet = assets on totalReturn
equity rs'StockholdeincomeNet = equitycommon on Return
%54.7 = assets on totalReturn
%4.13 = equitycommon on Return Staples (2004)
Office Depot (2004)
%50.4 = assets on totalReturn
%89.9 = equitycommon on Return
26
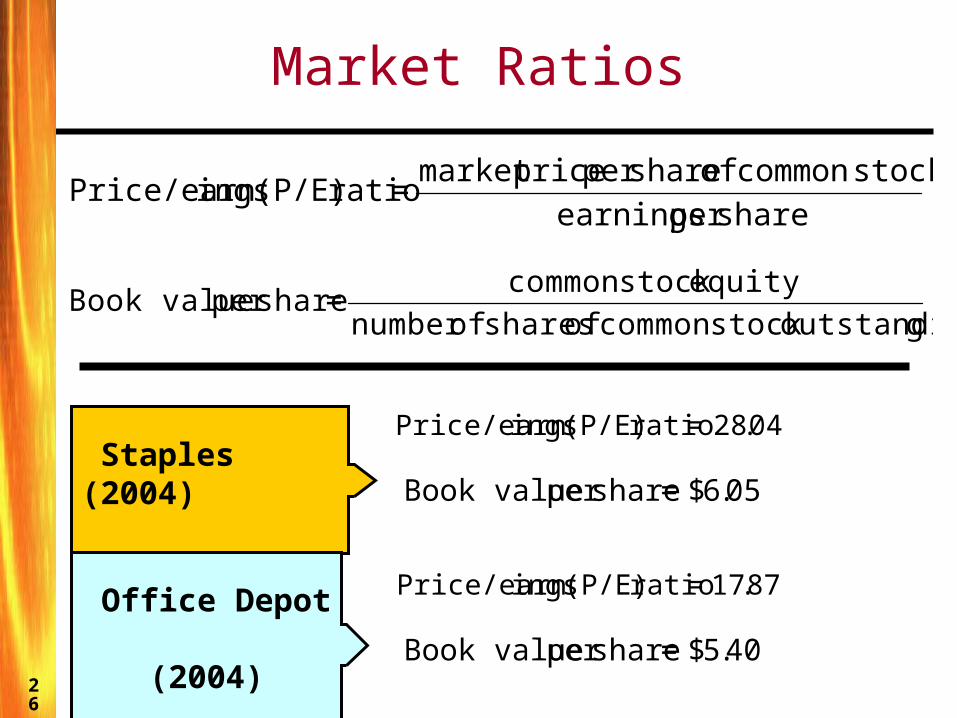
Market Ratios
shareper earningsstockcommon of shareper pricemarket = ratio (P/E) ingsPrice/earn
goutstandinstock common of shares ofnumber equitystock common = shareper Book value
04.28 = ratio (P/E) ingsPrice/earn
05.6$ = shareper Book value Staples (2004)
Office Depot (2004)
87.17 = ratio (P/E) ingsPrice/earn
40.5$ = shareper Book value
27
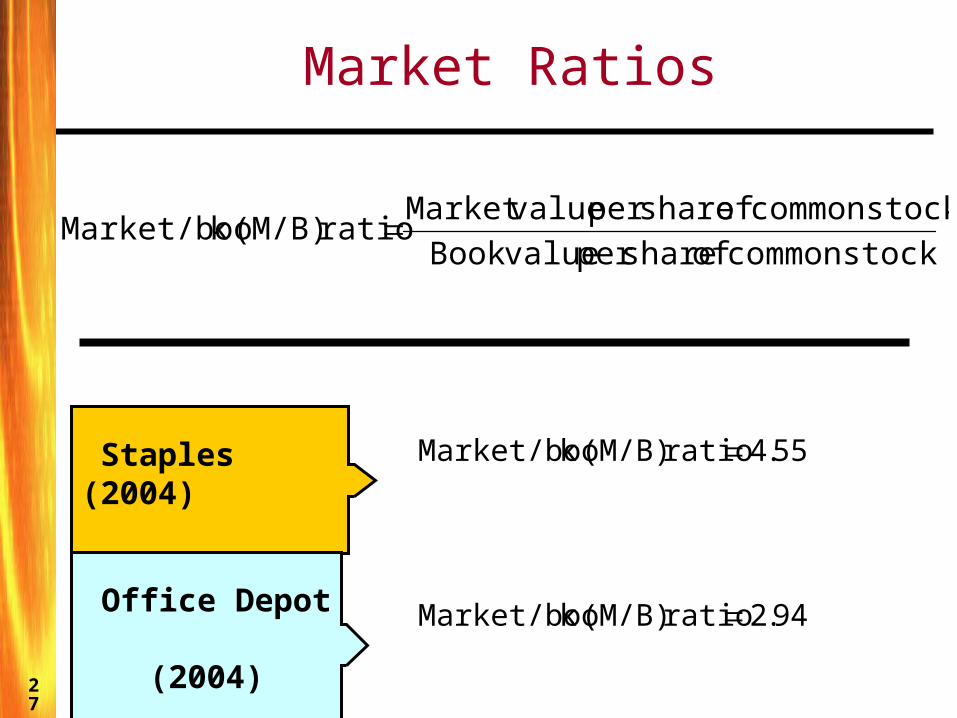
Market Ratios
stockcommonofsharepervalueBook
stockcommonofsharepervalueMarketratio (M/B)k Market/boo
55.4 ratio (M/B)k Market/boo Staples (2004)
Office Depot (2004) 94.2 ratio (M/B)k Market/boo
28
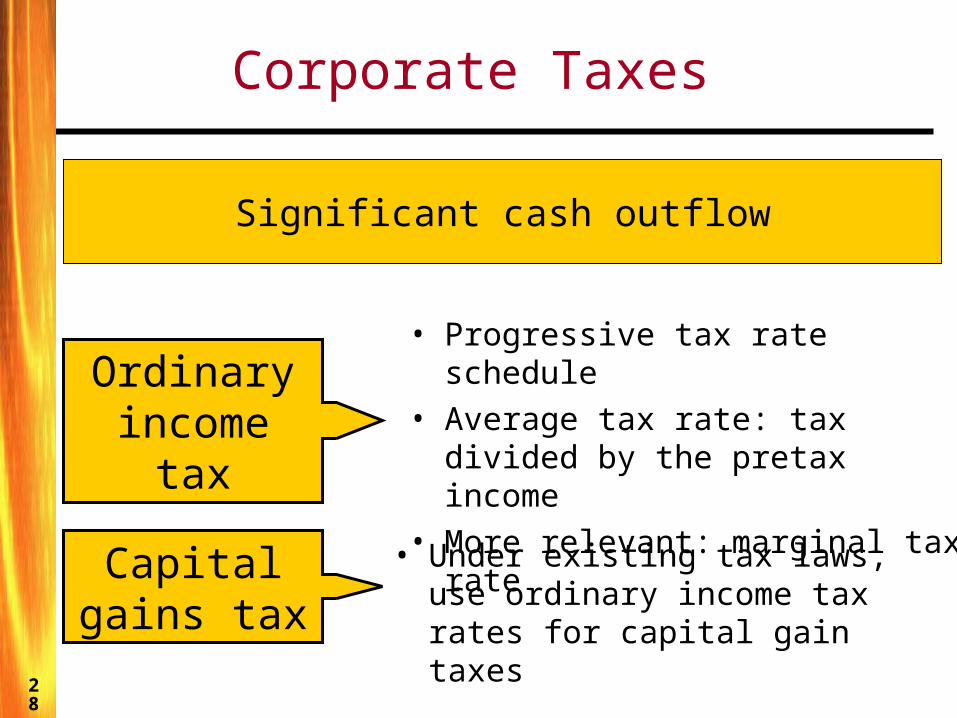
Corporate Taxes
Significant cash outflow
Ordinary income tax
• Progressive tax rate schedule• Average tax rate: tax divided by
the pretax income• More relevant: marginal tax rate
Capital gains tax
• Under existing tax laws, use ordinary income tax rates for capital gain taxes
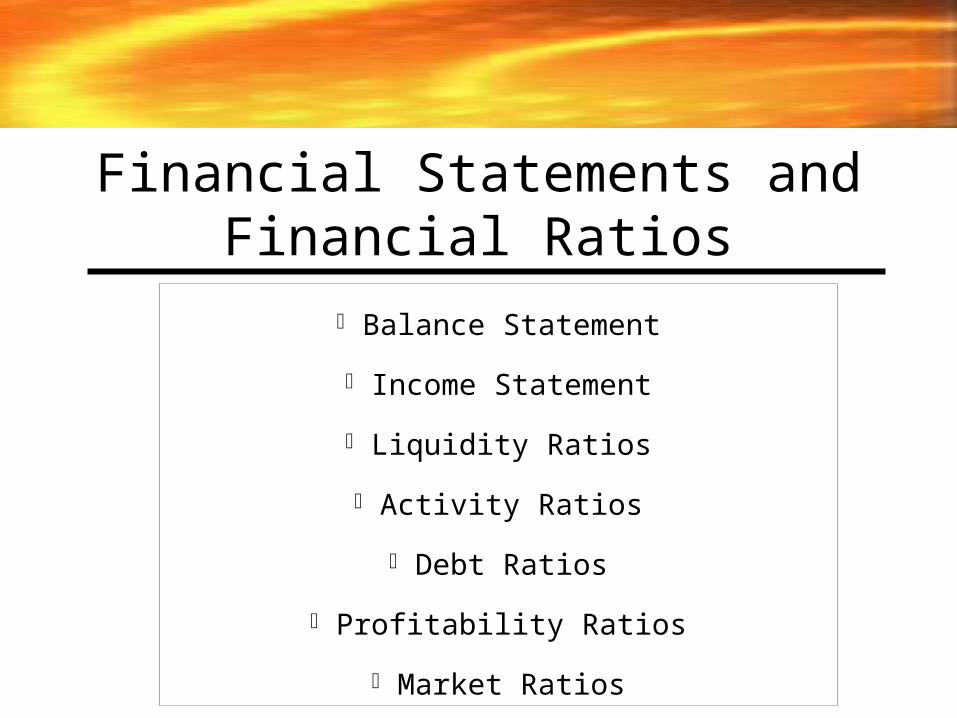
Financial Statements and Financial Ratios
Balance Statement Income Statement
Liquidity Ratios Activity Ratios
Debt Ratios Profitability Ratios
Market Ratios


![THOMSON REUTERS OIC [ISLAMIC] Indexes & Finance A Deep Dive](https://img.pdfslide.net/doc/110x75/61fb98d82e268c58cd60101c/thomson-reuters-oic-islamic-indexes-amp-finance-a-deep-dive.jpg)