Embed Size (px)
Citation preview
PROFILE OF THE BLACK POPULATIONIN MIAMI-DADE COUNTY
Released by:Miami-Dade County
Office of Community Advocacy Office of Black Affairs
December, 2007
Written by:Thomas D. Boswell, Ph.D.
Department of Geography & Regional StudiesUniversity of Miami
Coral Gables, Florida [email protected]
Profile of Miami-Dade County’s Black Population Thomas D. Boswell, Ph.D.
Office of Black Affairs Miami-Dade County Office of Community Advocacy-i-
TABLE OF CONTENTS
Preface . . . . . . . . . . . . . . . . . . . . . . . . . . . . . . . . . . . . . . . . . . . . . . . . . . . . . . . . . . . . . . . . . . . . . . .
Table of Contents . . . . . . . . . . . . . . . . . . . . . . . . . . . . . . . . . . . . . . . . . . . . . . . . . . . . . . . . . . . . . i
List of Tables . . . . . . . . . . . . . . . . . . . . . . . . . . . . . . . . . . . . . . . . . . . . . . . . . . . . . . . . . . . . . . . iv
List of Charts . . . . . . . . . . . . . . . . . . . . . . . . . . . . . . . . . . . . . . . . . . . . . . . . . . . . . . . . . . . . . . . vii
List of Maps . . . . . . . . . . . . . . . . . . . . . . . . . . . . . . . . . . . . . . . . . . . . . . . . . . . . . . . . . . . . . . . . ix
Executive Summary . . . . . . . . . . . . . . . . . . . . . . . . . . . . . . . . . . . . . . . . . . . . . . . . . . . . . . . . . . . 1
A NOTE ON THE USE OF THE TERM “BLACK” IN THIS REPORT . . . . . . . . . . . . . . . . . . 8
INTRODUCTION . . . . . . . . . . . . . . . . . . . . . . . . . . . . . . . . . . . . . . . . . . . . . . . . . . . . . . . . . . . . 10
CHAPTER 1: Population Growth and Change of Blacks in Miami-Dade County . . . . . . . . . . 12
CHAPTER 2: Components of Population Change for Blacks in Miami-Dade County . . . . . . . 18
Black Births and Deaths . . . . . . . . . . . . . . . . . . . . . . . . . . . . . . . . . . . . . . . . . . . . . . . . . 19
Components of Population Change . . . . . . . . . . . . . . . . . . . . . . . . . . . . . . . . . . . . . . . . 25
CHAPTER 3: Basic Demographic Characteristics of Blacks in Miami-Dade County . . . . . . . . 29
Gender and Age of Blacks . . . . . . . . . . . . . . . . . . . . . . . . . . . . . . . . . . . . . . . . . . . . . . . 29
Education Levels of Blacks . . . . . . . . . . . . . . . . . . . . . . . . . . . . . . . . . . . . . . . . . . . . . . . 31
Black Income and Poverty . . . . . . . . . . . . . . . . . . . . . . . . . . . . . . . . . . . . . . . . . . . . . . . 33
Marital Status of Blacks . . . . . . . . . . . . . . . . . . . . . . . . . . . . . . . . . . . . . . . . . . . . . . . . . 36
Miscellaneous Social Characteristics of Blacks . . . . . . . . . . . . . . . . . . . . . . . . . . . . . . . 38
CHAPTER 4: Employment Characteristics of Black in Miami-Dade County . . . . . . . . . . . . . . 40
Profile of Miami-Dade County’s Black Population Thomas D. Boswell, Ph.D.
Office of Black Affairs Miami-Dade County Office of Community Advocacy-ii-
Employment Status of Blacks . . . . . . . . . . . . . . . . . . . . . . . . . . . . . . . . . . . . . . . . . . . . . 40
Occupational Characteristics of Blacks . . . . . . . . . . . . . . . . . . . . . . . . . . . . . . . . . . . . . 41
Industries in Which Blacks Are Employed . . . . . . . . . . . . . . . . . . . . . . . . . . . . . . . . . . . 45
For Whom Blacks Work . . . . . . . . . . . . . . . . . . . . . . . . . . . . . . . . . . . . . . . . . . . . . . . . . 45
How Blacks Commute to Work . . . . . . . . . . . . . . . . . . . . . . . . . . . . . . . . . . . . . . . . . . . 47
CHAPTER 5: The Mobility and Migration of Blacks in Miami-Dade County . . . . . . . . . . . . . 50
Recent (1995-2000) Mobility and Migration of Blacks . . . . . . . . . . . . . . . . . . . . . . . . . 50
Place of Birth for Blacks Living In Miami-Dade County . . . . . . . . . . . . . . . . . . . . . . . . 52
Language Spoken at Home and Ability to Speak English . . . . . . . . . . . . . . . . . . . . . . . 62
CHAPTER 6: The Geography of Miami-Dade County’s Blacks: Where They Live . . . . . . . . . 65
CHAPTER 7: The Socioeconomic Status of Blacks and Black Subgroups in Miami-Dade County . . . . . . . . . . . . . . . . . . . . . . . . . . . . . . . . . . . . . . . . . . . . . . . . . . 84
Blacks Compared to Hispanics and Non-Hispanic Whites . . . . . . . . . . . . . . . . . . . . . . . 84
Non-Hispanic Blacks (minus West Indians), Hispanic Blacks, and Black West Indians . . . . . . . . . . . . . . . . . . . . . . . . . . . . . . . . . . . . . . . . . . . . . . . 87
Haitian Blacks, Jamaican Blacks, and Other West Indian Blacks . . . . . . . . . . . . . . . . . 88
Bahamians and Trinidadians . . . . . . . . . . . . . . . . . . . . . . . . . . . . . . . . . . . . . . . . . . . . . . 89
Black Cubans, non-Black Cubans, Black Dominicans, and Non-Black Dominicans . . . . . . . . . . . . . . . . . . . . . . . . . . . . . . . . . . . . . . . . . . . . 89
African Born Blacks in Miami-Dade County and in the United States . . . . . . . . . . . . . 90
CHAPTER 8: Household Characteristics of Blacks Living In Miami-Dade County . . . . . . . . 102
Relationship to Householder . . . . . . . . . . . . . . . . . . . . . . . . . . . . . . . . . . . . . . . . . . . . . 102
Profile of Miami-Dade County’s Black Population Thomas D. Boswell, Ph.D.
Office of Black Affairs Miami-Dade County Office of Community Advocacy-iii-
Family household Relationships, Housing Tenure, and Household Size . . . . . . . . . . . 102
Occupants Per Room by Housing Tenure and Numbers of Rooms PerHousehold by Housing Tenure . . . . . . . . . . . . . . . . . . . . . . . . . . . . . . . . . . . . . 103
CONCLUSIONS . . . . . . . . . . . . . . . . . . . . . . . . . . . . . . . . . . . . . . . . . . . . . . . . . . . . . . . . . . . . 108
APPENDIX . . . . . . . . . . . . . . . . . . . . . . . . . . . . . . . . . . . . . . . . . . . . . . . . . . . . . . . . . . . . . . . . 112
Profile of Miami-Dade County’s Black Population Thomas D. Boswell, Ph.D.
Office of Black Affairs Miami-Dade County Office of Community Advocacy-iv-
LIST OF TABLES
Table Page
1. Population by Race and Hispanic Origin, Miami-Dade County, Florida,1950-2005 . . . . . . . . . . . . . . . . . . . . . . . . . . . . . . . . . . . . . . . . . . . . . . . . . . . . . . . . . . . . 15
2. Population Projections by Race and Hispanic Origin Miami-Dade County,Florida, 2010-2020 . . . . . . . . . . . . . . . . . . . . . . . . . . . . . . . . . . . . . . . . . . . . . . . . . . . . . 17
3. Births, Deaths, and Natural Increases for Blacks in Miami-DadeCounty, 1970-2005 . . . . . . . . . . . . . . . . . . . . . . . . . . . . . . . . . . . . . . . . . . . . . . . . . . . . . 22
4. Births Rates, Death Rates, and Rates of Natural Increase for Blacks in Miami-DadeCounty, 1970-2005 . . . . . . . . . . . . . . . . . . . . . . . . . . . . . . . . . . . . . . . . . . . . . . . . . . . . . 24
5. Components of Population Change for Blacks, Hispanics, and Non-Hispanic Whites forMiami-Dade County, 1990-2000 . . . . . . . . . . . . . . . . . . . . . . . . . . . . . . . . . . . . . . . . . . 27
6. Sex and Age Composition for the Population in the United States and for Blacks,Hispanics, and Non-Hispanic Whites, Miami-Dade County, 2000 . . . . . . . . . . . . . . . . 30
7. School Enrollment and Educational Attainment for the Population in the United Statesand for Blacks, Hispanics, and Non-Hispanic Whites in Miami-Dade County, 2000 . . 32
8. Incomes for the Population in the United States and for Blacks, Hispanics, and Non-Hispanic Whites in Miami-Dade County, 2000 . . . . . . . . . . . . . . . . . . . . . . . . . . . . . . . 34
9. Poverty Status for the Population in the United States and for Blacks, Hispanics, andNon-Hispanic Whites in Miami-Dade County, 2000 . . . . . . . . . . . . . . . . . . . . . . . . . . . 35
10. Marital Status for the Population (15 Years and Older) in the United States and forBlacks, Hispanics, and Non-Hispanic Whites in Miami-Dade County, 2000 . . . . . . . . 37
11. Miscellaneous Social Characteristics: Grandparents as Care-Givers, Veteran Status, andDisability Status for the Population in the United States and for Blacks, Hispanics, andNon-Hispanic Whites in Miami-Dade County, 2000 . . . . . . . . . . . . . . . . . . . . . . . . . . . 39
Profile of Miami-Dade County’s Black Population Thomas D. Boswell, Ph.D.
Office of Black Affairs Miami-Dade County Office of Community Advocacy-v-
12. Enrollment Status for the population (16 Years and Older) in the United States and forBlacks, Hispanics, and Non-Hispanic Whites in Miami-Dade County, 2000 . . . . . . . . 43
13. Occupations for the Employed Civilian Labor Force (16 Years and Older) for the TotalPopulation in the United States and for Blacks, Hispanics, and Non-Hispanic Whites inMiami-Dade County, 2000 . . . . . . . . . . . . . . . . . . . . . . . . . . . . . . . . . . . . . . . . . . . . . . . 44
14. Industry for the Employed Civilian Labor Force (16 Years and Older) for the Populationin the United States and for Blacks, Hispanics, and non-Hispanic Whites in Miami-DadeCounty, 2000 . . . . . . . . . . . . . . . . . . . . . . . . . . . . . . . . . . . . . . . . . . . . . . . . . . . . . . . . . . 46
15. Class of Worker for the Population in the United States and for Blacks, Hispanics, andNon-Hispanic Whites in Miami-Dade County, 2000 . . . . . . . . . . . . . . . . . . . . . . . . . . . 47
16. How People (Working and 16 Years and Older) Commute to Work for the Population inthe United States and for Blacks, Hispanics, and Non-Hispanic Whites in :Miami-DadeCounty, 2000 . . . . . . . . . . . . . . . . . . . . . . . . . . . . . . . . . . . . . . . . . . . . . . . . . . . . . . . . . . 49
17. Residence in 1995 for the Population (5 Years and Older) in the United States and forBlacks, Hispanics, and Non-Hispanic Whites in Miami-Dade County, 2000 . . . . . . . . 51
18. Nativity and Place of Birth for the Population in the United States and for Blacks,Hispanics, and Non-Hispanic Whites in Miami-Dade County, 2000 . . . . . . . . . . . . . . . 53
19. Place of Birth for Blacks in Miami-Dade County, 2000 . . . . . . . . . . . . . . . . . . . . . . . . . 54
20 Migration to Miami-Dade County, 1960, 1970, 1980, 1990, and 2000 . . . . . . . . . . . . . 56
21. Migration to Miami-Dade County for Blacks, Hispanics, and Non-Hispanic Whites,1995-2000 . . . . . . . . . . . . . . . . . . . . . . . . . . . . . . . . . . . . . . . . . . . . . . . . . . . . . . . . . . . . 58
22. Percent Foreign Born, Unites States, Florida, and Miami-Dade County, 2000 . . . . . . . 60
23. Region of Birth for the Foreign Born for the Population in the United States and forBlacks, Hispanics, and Non-Hispanic Whites in Miami-Dade County, 2000 . . . . . . . . 61
24. Caribbean Born Blacks Living in Miami-Dade County by Periods of Entry, Numbers andPercentages . . . . . . . . . . . . . . . . . . . . . . . . . . . . . . . . . . . . . . . . . . . . . . . . . . . . . . . . . . . 63
25. Language Spoken at home (for Persons 5 years and Older) for the Population in the
Profile of Miami-Dade County’s Black Population Thomas D. Boswell, Ph.D.
Office of Black Affairs Miami-Dade County Office of Community Advocacy-vi-
United States and for Blacks, Hispanics, and Non-Hispanic Whites in Miami-DadeCounty, 2000 . . . . . . . . . . . . . . . . . . . . . . . . . . . . . . . . . . . . . . . . . . . . . . . . . . . . . . . . . . 64
26. Indexes of Segregation for Racial and Ethnic Groups in Miami-Dade County, 2000 . . 67
27. Selected Socioeconomic Characteristics of Blacks, Hispanics, and Non-Hispanic Whites,Miami-Dade County, 2000 . . . . . . . . . . . . . . . . . . . . . . . . . . . . . . . . . . . . . . . . . . . . . . . 85
28. Selected Socioeconomic Characteristics of Non-Hispanic Blacks, Hispanic Blacks, andBlack West Indians, Miami-Dade County, 2000 . . . . . . . . . . . . . . . . . . . . . . . . . . . . . . . 92
29. Selected Socioeconomic Characteristics of Haitian Blacks, Jamaican Blacks, and OtherWest Indian Blacks, Miami-Dade County, 2000 . . . . . . . . . . . . . . . . . . . . . . . . . . . . . . 94
30. Selected Socioeconomic Characteristics of Persons of Bahamian and Trinidadian andTogagonian Ancestry, Miami-Dade County, 2000 . . . . . . . . . . . . . . . . . . . . . . . . . . . . . 96
31. Selected Socioeconomic Characteristics of Black Cubans, Non-Black Cubans, BlackDominicans, and Non-Black Dominicans, Miami-Dade County, 2000 . . . . . . . . . . . . . 98
32. Selected Socioeconomic Characteristics of Blacks Born in Africa, Living in Miami-DadeCounty and in the United States, 2000 . . . . . . . . . . . . . . . . . . . . . . . . . . . . . . . . . . . . . 100
33. Relationships for the Population in the United States and for Blacks, Hispanics, and Non-Hispanic Whites in Miami-Dade County, 2000 . . . . . . . . . . . . . . . . . . . . . . . . . . . . . . 104
34 Households and Housing Tenure for the Population in the United States and for Blacks,Hispanics, and Non-Hispanic Whites in Miami-Dade County, 2000 . . . . . . . . . . . . . . 105
35. Household Size in the United States and for Blacks, Hispanics, and non-Hispanic Whitesin Miami-Dade County, 2000 . . . . . . . . . . . . . . . . . . . . . . . . . . . . . . . . . . . . . . . . . . . . 106
36. Occupants per Room by Tenure, Median Rooms per Household, and Median Value forOccupied Households by Tenure in the United States and for Blacks, Hispanics, and Non-Hispanic Whites in Miami-Dade County, 2000 . . . . . . . . . . . . . . . . . . . . . . . . . . . . . . 107
Profile of Miami-Dade County’s Black Population Thomas D. Boswell, Ph.D.
Office of Black Affairs Miami-Dade County Office of Community Advocacy-vii-
LIST OF CHARTS
1. Population by Race and Hispanic Origin, Miami-Dade County: 1930-2005 . . . . . . . . . . . . 16
2. Percent by Race and Hispanic origin, Miami-Dade County: 1930-2005 . . . . . . . . . . . . . . . 16
3. Population Projections by Race and Hispanic Origin in Miami-Dade County, 2010-2020 . . . . . . . . . . . . . . . . . . . . . . . . . . . . . . . . . . . . . . . . . . . . . . . . . . . . . . . . . . . . . . . 17
4. Birth Rates, Death Rates, and Rates of Natural Increase for Blacks in Miami-Dade County:1970-2005 . . . . . . . . . . . . . . . . . . . . . . . . . . . . . . . . . . . . . . . . . . . . . . . . . . . . . . . . . . . . . . . 24
5. Components of Change by Race and Hispanic Origin, Miami-Dade County,1990 to 2000 . . . . . . . . . . . . . . . . . . . . . . . . . . . . . . . . . . . . . . . . . . . . . . . . . . . . . . . . . . . . . 28
6. Place of Birth for Blacks in Miami-Dade County: 2000 . . . . . . . . . . . . . . . . . . . . . . . . . . . . 55
7. In-Migrants from Rest of Florida, Rest of U.S., and Immigrants from Abroad, Miami-DadeCounty: 1960-2000 . . . . . . . . . . . . . . . . . . . . . . . . . . . . . . . . . . . . . . . . . . . . . . . . . . . . . . . . 57
8. In-Migrants by Place of Origin by Race and Hispanics for Miami-Dade County,1995-2000 . . . . . . . . . . . . . . . . . . . . . . . . . . . . . . . . . . . . . . . . . . . . . . . . . . . . . . . . . . . . . . . 59
9. Percent Foreign Born by Race and Hispanic Origin: United States, Florida, and Miami-DadeCounty, 2000 . . . . . . . . . . . . . . . . . . . . . . . . . . . . . . . . . . . . . . . . . . . . . . . . . . . . . . . . . . . . . 60
10. Education, Occupations, and Poverty Levels for Blacks, Hispanics, and Non-HispanicWhites, Miami-Dade County, 2000 . . . . . . . . . . . . . . . . . . . . . . . . . . . . . . . . . . . . . . . . . . . 86
11. Mean and Median Incomes for Blacks, Hispanics, and Non-Hispanic Whites, Miami-DadeCounty: 2000 . . . . . . . . . . . . . . . . . . . . . . . . . . . . . . . . . . . . . . . . . . . . . . . . . . . . . . . . . . . . . 86
12. Education, Occupations, and Poverty levels for Non-Hispanic Blacks, Hispanic Blacks, andBlack West Indians in Miami-Dade County, 2000 . . . . . . . . . . . . . . . . . . . . . . . . . . . . . . . . 93
13. Mean and Median Incomes for Non-Hispanic Blacks, Hispanic Blacks, and Black WestIndians, Miami-Dade County, 2000 . . . . . . . . . . . . . . . . . . . . . . . . . . . . . . . . . . . . . . . . . . . 93
Profile of Miami-Dade County’s Black Population Thomas D. Boswell, Ph.D.
Office of Black Affairs Miami-Dade County Office of Community Advocacy-viii-
14. Education, Occupations, and Poverty Levels for Haitian Blacks, Jamaican Blacks, and otherWest Indian Blacks in Miami-Dade County: 2000 . . . . . . . . . . . . . . . . . . . . . . . . . . . . . . . . 95
15. Mean and Median Incomes for Haitian Blacks, Jamaican Blacks, and Other West IndianBlacks in Miami-Dade County: 2000 . . . . . . . . . . . . . . . . . . . . . . . . . . . . . . . . . . . . . . . . . . 95
16. Education, Occupations, and Poverty Levels for Bahamians and Trinidadians, Miami-DadeCounty, 2000 . . . . . . . . . . . . . . . . . . . . . . . . . . . . . . . . . . . . . . . . . . . . . . . . . . . . . . . . . . . . . 97
17. Mean Incomes for Bahamians and Trinidadians in Miami-Dade County: 2000 . . . . . . . . . 97
18. Education, Occupations, and Poverty Levels for Cubans and Dominicans by Race, Miami-Dade County: 2000 . . . . . . . . . . . . . . . . . . . . . . . . . . . . . . . . . . . . . . . . . . . . . . . . . . . . . . . . 99
19. Mean and Median Incomes for Cubans and Dominicans by Race, Miami-DadeCounty: 2000 . . . . . . . . . . . . . . . . . . . . . . . . . . . . . . . . . . . . . . . . . . . . . . . . . . . . . . . . . . . . . 99
20. Education, Occupations, and Poverty Levels for African Born Blacks Living in Miami-DadeCounty and in the U.S.: 2000 . . . . . . . . . . . . . . . . . . . . . . . . . . . . . . . . . . . . . . . . . . . . . . . 101
21. Mean and Median Incomes of African Born Blacks Living in Miami-Dade County and In theU.S.: 2000 . . . . . . . . . . . . . . . . . . . . . . . . . . . . . . . . . . . . . . . . . . . . . . . . . . . . . . . . . . . . . . 101
Profile of Miami-Dade County’s Black Population Thomas D. Boswell, Ph.D.
Office of Black Affairs Miami-Dade County Office of Community Advocacy-ix-
LIST OF MAPS
1. Percent of Total Population that is Black, Miami-Dade County: 2000 . . . . . . . . . . . . . . . . 71
2. Percent of Total Population that is Non-Hispanic Black, Miami-Dade County: 2000 . . . . . 72
3. Percent of Total Population that is Hispanic (Includes Black Hispanics),Miami-Dade County: 2000 . . . . . . . . . . . . . . . . . . . . . . . . . . . . . . . . . . . . . . . . . . . . . . . . . . 73
4. Distribution of Black Hispanics, Miami-Dade County: 2000 . . . . . . . . . . . . . . . . . . . . . . . . 74
5. Percent of Total Population that is Non-Hispanic White, Miami-Dade County: 2000 . . . . 75
6. Percent of Total Population that is West Indian, Miami-Dade County: 2000 . . . . . . . . . . . 76
7. Distribution of West Indians, Miami-Dade County: 2000 . . . . . . . . . . . . . . . . . . . . . . . . . . 77
8. Distribution of Haitians, Miami-Dade County: 2000 . . . . . . . . . . . . . . . . . . . . . . . . . . . . . . 78
9. Distribution of Jamaicans, Miami-Dade County: 2000 . . . . . . . . . . . . . . . . . . . . . . . . . . . . 79
10. Distribution of Bahamians, Miami-Dade County: 2000 . . . . . . . . . . . . . . . . . . . . . . . . . . . . 80
11. Distribution of Trinidadians, Miami-Dade County: 2000 . . . . . . . . . . . . . . . . . . . . . . . . . . 81
12. Distribution of the Black Population Living Above Poverty, Miami-Dade County: 2000 . . 82
13. Distribution of the Black Population Living Below Poverty, Miami-Dade County: 2000 . . 83
Profile of Miami-Dade County’s Black Population Thomas D. Boswell, Ph.D.
Office of Black Affairs Miami-Dade County Office of Community Advocacy-1-
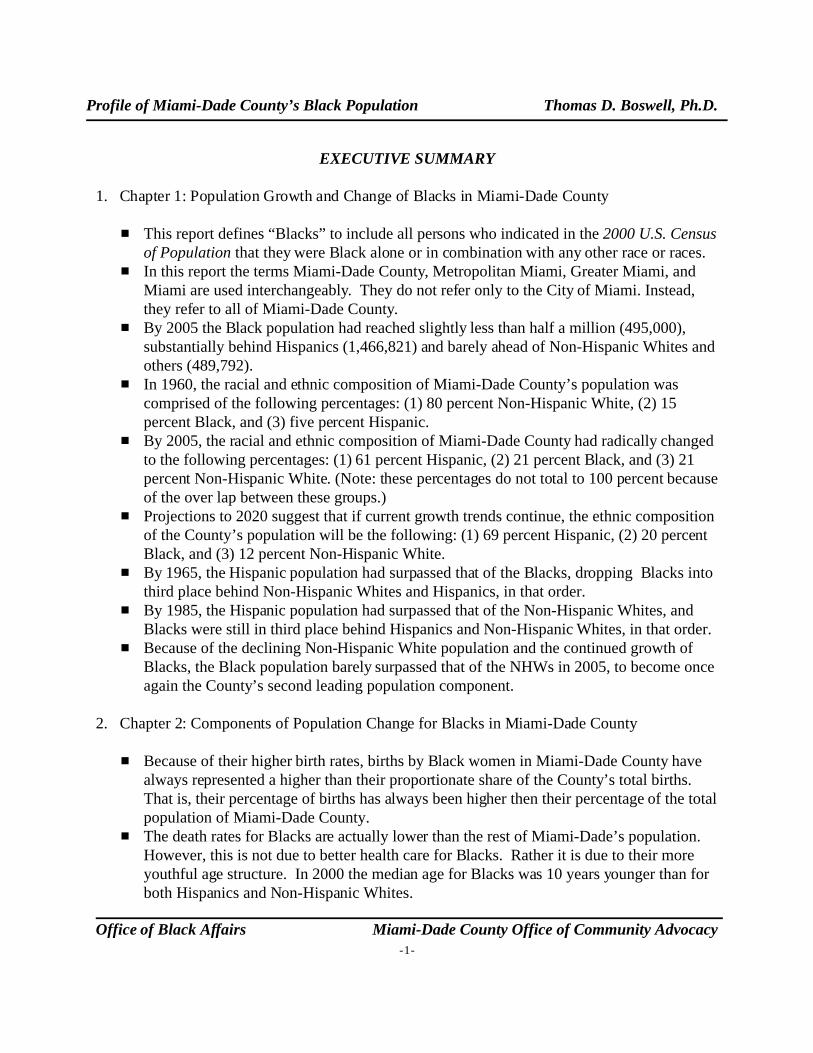
EXECUTIVE SUMMARY
1. Chapter 1: Population Growth and Change of Blacks in Miami-Dade County
# This report defines “Blacks” to include all persons who indicated in the 2000 U.S. Censusof Population that they were Black alone or in combination with any other race or races.
# In this report the terms Miami-Dade County, Metropolitan Miami, Greater Miami, and Miami are used interchangeably. They do not refer only to the City of Miami. Instead,they refer to all of Miami-Dade County.
# By 2005 the Black population had reached slightly less than half a million (495,000),substantially behind Hispanics (1,466,821) and barely ahead of Non-Hispanic Whites andothers (489,792).
# In 1960, the racial and ethnic composition of Miami-Dade County’s population wascomprised of the following percentages: (1) 80 percent Non-Hispanic White, (2) 15percent Black, and (3) five percent Hispanic.
# By 2005, the racial and ethnic composition of Miami-Dade County had radically changedto the following percentages: (1) 61 percent Hispanic, (2) 21 percent Black, and (3) 21percent Non-Hispanic White. (Note: these percentages do not total to 100 percent becauseof the over lap between these groups.)
# Projections to 2020 suggest that if current growth trends continue, the ethnic compositionof the County’s population will be the following: (1) 69 percent Hispanic, (2) 20 percentBlack, and (3) 12 percent Non-Hispanic White.
# By 1965, the Hispanic population had surpassed that of the Blacks, dropping Blacks intothird place behind Non-Hispanic Whites and Hispanics, in that order.
# By 1985, the Hispanic population had surpassed that of the Non-Hispanic Whites, andBlacks were still in third place behind Hispanics and Non-Hispanic Whites, in that order.
# Because of the declining Non-Hispanic White population and the continued growth of Blacks, the Black population barely surpassed that of the NHWs in 2005, to become onceagain the County’s second leading population component.
2. Chapter 2: Components of Population Change for Blacks in Miami-Dade County
# Because of their higher birth rates, births by Black women in Miami-Dade County havealways represented a higher than their proportionate share of the County’s total births. That is, their percentage of births has always been higher then their percentage of the totalpopulation of Miami-Dade County.
# The death rates for Blacks are actually lower than the rest of Miami-Dade’s population. However, this is not due to better health care for Blacks. Rather it is due to their moreyouthful age structure. In 2000 the median age for Blacks was 10 years younger than forboth Hispanics and Non-Hispanic Whites.
Profile of Miami-Dade County’s Black Population Thomas D. Boswell, Ph.D.
Office of Black Affairs Miami-Dade County Office of Community Advocacy-2-
# Because of the combination of their higher birth rates and lower death rates, Blacks havealways accounted for more than their proportionate share of the natural increase (birthsminus deaths) in metropolitan Miami’s population. In fact, between 1972 and 1979Blacks accounted for more than 100 percent of the natural increase in Miami-DadeCounty because deaths exceeded births among the combined Non-Hispanic White andHispanic populations during this period. In 2005, Blacks accounted for 32 percent of theCounty’s natural increase.
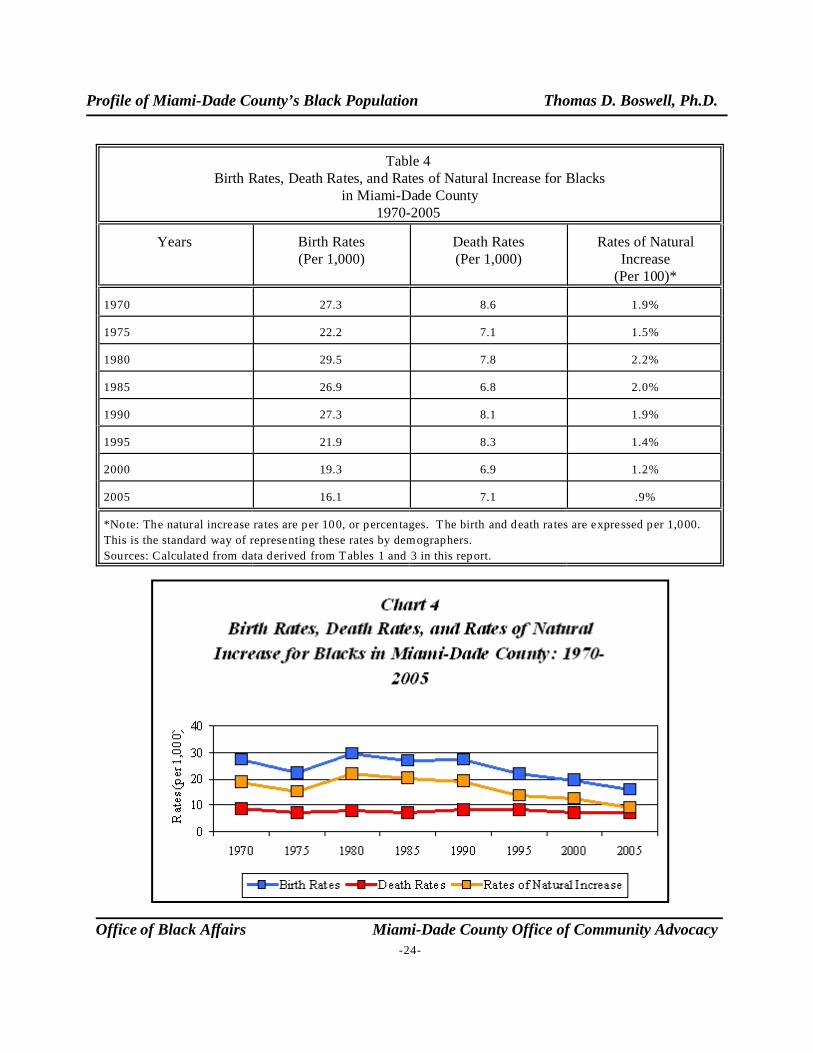
# Although the birth rates among Blacks have been consistently higher than those amongHispanics and Non-Hispanics in Greater Miami, they have been falling since 1980. In1980, the rate among the County’s Black population was 29.5 per 1,000. By 2005, thebirth rate for Blacks had been reduced to 16 per 1,000.
# Most of the growth of Greater Miami’s Black population has been due to naturalincrease. Secondarily, net international immigration has also contributed to the growth ofthis population. Between 1990 and 2000, 28,000 more Blacks left Miami to live in otherplaces in the United States than arrived in Miami from other places within the U.S. Thisnet domestic out-migration of Blacks appears to have been motivated by a combination offactors, including high cost of housing, high insurance rates, increased job competition,high crime rates especially in Black neighborhoods, and poor quality schools that manyBlack children attend. Other sources suggest that the net domestic out-migration ofBlacks from Miami-Dade County has been occurring at least since 1980. However, it isimportant to note that the subtraction of net domestic Black out-migrants has been morethan compensated for by the Black population’s natural increase and positive netinternational immigration.
3. Chapter 3: Basic Demographic Characteristics of Blacks in Miami-Dade County
# Blacks are very similar in their gender composition to the other populations in Miami-Dade County and to the United States population. Slightly more than half (52 percent)the County’s Blacks are comprised of females.
# Blacks in Miami have a younger median age (29 years) than the County’s Hispanics (39years) and Non-Hispanic Whites (39 years). Blacks also have a smaller percentage whoare over the age of 60 years (10 percent) when compared to Hispanics (19 percent) andNon-Hispanic Whites (22 percent).
# Blacks have low educational attainment levels in Metropolitan Miami when compared toNon-Hispanic Whites, but they are ambivalent when compared to Hispanics. Thirty-seven percent of Blacks 25 years of age and older have not graduated from high schools. This compares to 39 percent for Hispanics and 11 percent for NHWs. Nationally, about20 percent of the population has not graduated from high school. About 12 percent ofMiami’s Blacks have a B.A. degree or higher, whereas the comparable figures forHispanics and NHWs are 18 percent and 38 percent, respectively.
Profile of Miami-Dade County’s Black Population Thomas D. Boswell, Ph.D.
Office of Black Affairs Miami-Dade County Office of Community Advocacy-3-
# No matter how you measure income, Blacks have much lower income than eitherHispanics or NHWs in Miami. In 2000, the per capita income of Blacks was $12,022,whereas for Hispanics it was $16,194 and for NHW’s it was $31,059.
# Twenty-eight percent of Miami’s Blacks live in families with incomes below the povertylevel. This compares with 18 percent for Hispanics and 9 percent for Non-HispanicWhites who live in poverty.
# A much larger proportion (42 percent) of Black women 15 years and older have nevermarried, when compared to Hispanic women (24 percent) and NHW women (28 percent). The lower marriage rates for Blacks is attributed to their higher poverty rates (whichmakes it more difficult for Blacks to afford a family) other possible factors.
# Black grandparents are much more likely to be responsible for caring for theirgrandchildren than are the grandparents of Hispanics or NHWs.
# Blacks in Miami are not over-represented in the military forces. In 2000, about 6 percentof the Blacks in Miami-Dade County were veterans, compared to 13 percent of theNHWs and three percent of the Hispanics.
# Blacks have a higher percentage of their civilian labor force with disabilities than eitherHispanics of NHWs. This reflects the greater tendency for Blacks to be employed in theso-called “3-D jobs” (those that are dangerous, dirty, and demanding).
4. Chapter 4: Employment Characteristics of Blacks in Miami-Dade County
# The labor force participation rates for Blacks is about the same as for Hispanics and Non-Hispanic Whites in metropolitan Miami.
# The unemployment rates for Blacks, no matter how they are measured, are much higherthen they are for Hispanics and Non-Hispanic Whites in the County.
# The percentage (.1 percent) of Blacks currently employed in the military is very similar toHispanics (.2 percent) and NHWs (.0 percent) in Greater Miami. This finding reinforcesthe finding stated earlier that Blacks in Miami are not over-represented in the militaryservices based on their veteran status.
# Occupationally, Blacks are most concentrated in the services sector, in the “sales andoffice occupations,” and in 3-D jobs (those that are dangerous, dirty, and/or demanding)in Greater Miami. The 3-D jobs pay lower wages and have fewer benefits and tend todepress the socioeconomic status of Blacks. But many of the jobs Blacks take in theservice sector are sponsored by the local, state, and federal governments. As such theytend to be higher paying with substantial benefits. These government jobs have been amajor reason for the ascension of many Blacks into the American middle class status. Ina sense government-sponsored service jobs have become an occupational niche forBlacks living in Miami.
# Miami’s Blacks are heavily over-represented by employment in the “educational, health,and social services industries.” They are somewhat over-represented in the “art,
Profile of Miami-Dade County’s Black Population Thomas D. Boswell, Ph.D.
Office of Black Affairs Miami-Dade County Office of Community Advocacy-4-
entertainment, recreation, accommodation, and food services industries,” in “publicadministration” and in the “transportation and warehousing, and utilities” industries. Again, the “educational, health, and social services” and “public administration”industries both rely heavily on government spending.
# Almost three-quarters of Black workers in Miami are employed as private wage andsalary workers, so we don’t want to push too far the thought that they have found a nichein government jobs. Still, government jobs do provide the next largest category ofemployment for the Black labor force in Miami and a much higher percentage (23percent) of Black workers are employed in these jobs than are Hispanics (9 percent) andNHWs (14 percent).
# About two-thirds of Miami’s Blacks commute to work alone in private cars, trucks, orvans. This is a somewhat smaller proportion than for Hispanics (74 percent) and NHWs(79 percent). A slightly larger share (11 percent) of Blacks use public transportation thando Hispanics (4 percent) and NHWs (3 percent), but these differences are not largeenough to be very important.
# The average commute to work for Blacks lasts 32 minutes. This is a little more than forHispanics (30 minutes) and NHWs (28 minutes), but it is not enough different to makeany important difference.
5. Chapter 5: The Mobility and Migration of Blacks in Miami-Dade County
# Forty-one percent of metropolitan Miami’s Blacks changed residences during the 1995-2000 period. Most of these residentially mobile Blacks (34 percent) moved from oneplace in Miami-Dade County to another in the County. Only about four percent moved toMiami from another state, while six percent moved from a foreign country during thisfive-year period.
# About 69 percent of Miami-Dade County’s Black population was born in the U.S. Mostof these (52 percent) were born in the state of Florida and 16 percent were born in anotherstate within the U.S. Most of those born in the U.S., but outside of Florida came fromGeorgia, New York, South Carolina, and Alabama.
# Almost one-third (31 percent) of Miami’s Black population was foreign born(immigrants). This is much higher than the seven percent foreign born for the UnitedStates’ Black population. Ninety percent of metropolitan Miami’s immigrant Blackswere born in the Caribbean, primarily in Haiti, Jamaica, Cuba, the Bahamas, and theDominican Republic. Ninety-seven percent came from Latin America, which includesthe Caribbean.
# During the latter half of the 1950s 78 percent of Miami-Dade County’s in-migrants (notonly Blacks) came from other states in the United States. By the later 1990s this patternchanged, as 56 percent of Greater Miami’s in-migrants came as immigrants from foreigncountries. Immigrants overtook in-migrants from other states in the U.S. during the
Profile of Miami-Dade County’s Black Population Thomas D. Boswell, Ph.D.
Office of Black Affairs Miami-Dade County Office of Community Advocacy-5-
1985-1990 period.# For Blacks the general trends of in-migration patterns are similar to what they are for all
of Miami’s population. During the 1995-2000 interval, 44 percent of the Blacks whomoved to Miami-Dade County were immigrants from abroad; 35 percent were in-migrants from other states in the United States; and 21 percent were from other countiesin Florida.
# Large-scale Black immigrantion to Miami from the Caribbean dates mainly to the late1970s and early 1980s, although there was some immigration of Bahamians as long agoas the 1890s. Of the 136,000 Caribbean Black immigrants enumerated in the 2000Census of Population for Miami, 74 percent came after 1980 and 39 percent came after1990. This recency of immigration is relevant because more recent arrivals normally arein the early stages of assimilating either to the White or Black American mainstreampopulations.
# Almost 32 percent of Blacks living in Miami-Dade County speak a language other thanEnglish in their homes. The largest number of these people speak either Haitian Creoleor French in their homes, while the second largest number speak Spanish. The Blackswho speak Spanish are mainly from Cuba and the Dominican Republic. Only 14 percentof the Blacks living in Miami say they do not speak English very well, which if far lowerthan for Hispanics where 53 percent say they do not speak English very well.
6. Chapter 6: The Geography of Miami-Dade County’s Blacks: Where They Live
# Blacks are still the most segregated population living in Miami-Dade County. In 2000,73 percent of the residences of Non-Hispanic Whites would need to be redistributedamong the County’s nearly 350 census tracts to have the same percentage distribution asthe County’s Non-Hispanic Blacks. Also, similarly 73 percent of the residences ofHispanics would need to be redistributed to have the same percentage distribution as theCounty’s Non-Hispanic Blacks. This means that most Blacks live in predominantlyBlack neighborhoods and most Non-Hispanic Whites and Hispanics tend to avoid livingin these Black neighborhoods. However, there is evidence that since the 2000 Censusenumeration Hispanics have been moving increasingly into some Black neighborhoods,thereby increasing the overlap between where Blacks and Hispanics live in Miami-DadeCounty.
# Blacks tend to concentrate their residences in 11 distinctive areas: Carol City (MiamiGardens), Opa-Locka, Liberty City, Overtown, Coconut Grove, South Miami-CoralGables, Richmond Heights, Cutler Ridge, Perrine, Homestead, and Florida City.
# Black Hispanics are more concentrated in Hispanic neighborhoods than they are inpredominantly Black neighborhoods. They are found least often in Non-Hispanic Whiteneighborhoods.
# West Indians are predominantly from the Non-Spanish speaking islands in the Caribbean.
Profile of Miami-Dade County’s Black Population Thomas D. Boswell, Ph.D.
Office of Black Affairs Miami-Dade County Office of Community Advocacy-6-
Most of them are Black and they tend to settle in predominantly Black neighborhoods. They are especially notable in Miami’s Little Haiti, North Miami, and Cutler Ridge.
# West Indian sub-populations, like the Haitians, Jamaicans, Bahamians, and Trinidadiansexhibit a triple embedded nature. They concentrate in Black neighborhoods, with asecondary tendency to find areas where other West Indians live, and finally they try tofind areas where other immigrants from their island origin are living. However, becauseof their small numbers, it is often hard to find an area where there is a concentration ofany particular nationality of West Indians, other than for Haitians who are much larger innumber.
# There appears to be only a small amount of segregation according to income amongMiami’s Black population. Only 29 percent of the Blacks living above poverty wouldhave to be redistributed to have the same residential distribution as Blacks living belowpoverty. This degree of segregation between those living above and below poverty issimilar to those for the County’s Hispanics and Non-Hispanic Whites.
7. The Socioeconomic Status of Blacks and Black Subgroups Living in Miami-Dade County
# As stated earlier, Blacks are characterized by lower socioeconomic status in MetropolitanMiami when compared to Hispanics and Non-Hispanic Whites and this is true byvirtually any measure, except for the percent who have not graduated from high schooland the percentage employed in the Service sector. The percentage who have notgraduated from high school is slightly higher for Hispanics than Blacks because virtuallyall the Hispanics immigrated from Third World countries where the educational standardsare lower and the facilities less than in the United States. Also, there is an element (about24 percent) of the Black population that has been able to find an employment niche ingovernment jobs in the services sector of Miami’s economy. These people benefit fromgood pay and the fringe benefits provided by federal, state, and local municipalgovernments. On the other hand, most Blacks have lower percentages who havegraduated from college with a B.A. degree, more who are employed in the 3-D jobs, andthey have lower mean and median incomes when compared to Hispanics and NHWs.
# Non-Hispanic Blacks minus West Indians (African Americans) have about the same SESas Hispanic Blacks and Black West Indians (including Haitians).
# Haitians have by far the lowest SES of any major group in Metropolitan Miami becausethey derive from the poorest county in the Western Hemisphere. Their SES isconsiderably lower than that of Non-Hispanic Blacks minus West Indians (AfricanAmericans). When Haitians are removed from the West Indian class, the West Indiansthen have SES levels that are generally above those of African Americans living inMiami. The same is true for Black Jamaicans, Bahamians, and Trinidadians living inGreater Miami. They also have SES levels that are generally higher than for AfricanAmericans (Non-Hispanic Blacks minus Black West Indians) living in Miami-Dade
Profile of Miami-Dade County’s Black Population Thomas D. Boswell, Ph.D.
Office of Black Affairs Miami-Dade County Office of Community Advocacy-7-
County.# This study also reports on the degree to which race played a role in the Cuban and
Dominican populations similar to that in Miami’s Black and White populations. Thiswas accomplished by comparing the SES of Black Cubans to Non-Black Cubans and theSES of Black Dominicans to Non-Black Dominicans. It was found that among Cubansthere was a large difference, with the White Cubans having a substantially higher SES. Although there was some difference between Blacks and Non-Black Dominicans, it wasvery slight. In fact, the mean income for Black Dominicans was a little higher than it wasfor the Non-Black Dominicans. On the other hand, the Non-Black Dominicans hadslightly higher median income than the Black Dominicans, underscoring how closelymatched these two racial components of the Dominican population are.
# African born Blacks living in Miami appear to have relatively high SES when comparedto other Black population components living in this metropolitan area. The reason forthis finding is that poor Blacks from Africa are unable to afford the transportation costs ofimmigrating to Miami, so this immigration tends to be highly selective from the upperand middle classes of Africa.
8. Chapter 8: Household Characteristics of Blacks Living in Miami-Dade County
# Black households are clearly more disadvantaged than Hispanic and Non-Hispanic Whitehouseholds in metropolitan Miami. Black households tend to have larger numbers ofchildren and other relatives living in them. They are more likely to headed by a singlewoman. Blacks are less likely to own the housing they live in, and their housing is morelikely to be crowded and be of lower value.
Profile of Miami-Dade County’s Black Population Thomas D. Boswell, Ph.D.
Office of Black Affairs Miami-Dade County Office of Community Advocacy-8-
A NOTE ON THE USE OF THE TERM “BLACK”IN THIS REPORT
The concept of race as used by the U.S. Bureau of the Census reflects self-identification. Itdoes not represent any scientific definition of biological stock. People classify themselvesaccording to the race (or races in the case of the 2000 Census of Population) with which theymost closely identify during each of the more recent censuses of the United States. Havingpeople classify themselves instead of having an enumerator categorize them is based on theconcept that what matters most is what a person thinks he/she is.
The term “Black” is used in this report rather than “African American.” The reason for thischoice is that “Black” is a more inclusive term than “African American” and it better describesthe cultural and ethnic diversity of Miami-Dade County’s Black communities. It is also the termused (along with African American) today in most of the census publications which provide theprimary sources for this report. When it is said that “Black” is more inclusive than AfricanAmerican we are referring to the fact that almost one-third of the Blacks living in Miami-DadeCounty derive from foreign countries and are not United States residents or citizens by birth. They come from diverse countries such as Haiti, Cuba, the Dominican Republic, Jamaica,Trinidad and Tobago, as well as a few from African countries and some from South America. Some of them speak languages other than English, have different religions, and maintaindifferent national affiliations when compared to this nation’s African American population. Theterm “Black” also appears to have greater acceptance locally in South Florida as reflected in thenames of organizations like Miami-Dade County’s Office of Black Affairs, the Miami BlackArchives, etc., as well as in the language of several local government ordinances and resolutions.
The inadequacy of the term “Black” to describe persons of mixed races is of increasingconcern both locally and nationally as persons of mixed race become more numerous due tointerracial marriages and unions. During the 1990s it became apparent that Blacks werebeginning to marry across racial lines, much more so than in the past. In addition, asimmigration increased from the Caribbean and South America many of these immigrants werealso of mixed race ancestries. Until 2000, people enumerated in the United States Censuses wererequired to select only one from a list of races when describing themselves. Many people ofmixed race felt that they were being forced to pick only one of the ancestral roots in identifyingtheir biological origin. As a consequence of these trends and feelings, the 2000 Census ofPopulation was the first in the United States to allow people to identify themselves with morethan one racial category.
However, allowing people to select more than one racial category to classify themselvesposed a problem when comparing the United States’ Blacks today with those of the past. For
Profile of Miami-Dade County’s Black Population Thomas D. Boswell, Ph.D.
1The “one-drop of blood rule” is the idea that anybody with any Black blood is automatically to be
classified as being of Black racial affiliation.
2These figures come from: U.S. Bureau of the Census, 2000 Census of Population, Summary File 1, Tables
P7 and P9.
Office of Black Affairs Miami-Dade County Office of Community Advocacy-9-
example, when the Black population is counted, should we include people who said they wereonly Black, or should we also include those who said they were Black in combination withanother race? For this report it was decided to use the more inclusive category of “Blacks aloneor in combination with one or more other races.” So, figures from the 1990 and 2000 censusesare not strictly comparable because there is no way of determining how persons in the 1990census listed themselves if they were a combination of Black and some other race. We suspectthat most of them would have classified themselves as Black, but nobody knows how manyexceptions there would be to this so-called “one-drop of blood” rule.1
Are we splitting hairs or is this issue of mixed race really a significant complicating factorwhen describing this country’s Blacks? Results from the 2000 Census of Population show thatabout 2.4 percent of all persons in the United States indicated they were of mixed race heritage. The comparable figure for Miami-Dade County was slightly higher at 3.5 percent. Furthermore,there were significant differences along racial lines. About 2.5 percent of all Whites in the U.S.said they were a mixture of two or more races; for Blacks the comparable national figure was 4.8percent. In Miami-Dade County 3.6 percent of the Whites said they were of mixed racebackground; whereas the comparable figure for Blacks was 6.1 percent.2
Profile of Miami-Dade County’s Black Population Thomas D. Boswell, Ph.D.
3These percentages in 2005 total to more than 100 percent because of the overlap between these categories.
Office of Black Affairs Miami-Dade County Office of Community Advocacy-10-
INTRODUCTION
In 2005 Blacks once again assumed the position as Miami-Dade County’s second leadingpopulation component behind Hispanics. Earlier, in 1965, Blacks lost this standing to Hispanicsand Blacks fell into third place numerically behind Non-Hispanic Whites and Hispanics, in thatorder. However, the tremendous growth of the Hispanic population surpassed the Non-HispanicWhites in 1985, who had been experiencing a decline both proportionately (beginning in 1960)and in absolute numbers (beginning in 1970). By 2000, the continued decline in the non-Hispanic Whites and the continued growth of the Blacks resulted in the Blacks surpassing theWhites in 2005. Probably no major metropolitan area in the United States has experienced suchan extreme change in the racial and ethnic composition of its population as has Miami-DadeCounty in the relatively short period of about four and a half decades between 1960 and 2005. In1960, 80 percent of the County’s population was comprised of Non-Hispanic Whites, about fivepercent was Hispanic, and about 15 percent was Black. By 2005 these figures had changeddramatically. By then 61 percent was Hispanic, about 21 percent was Non-Hispanic White, andanother 21 percent was Black.3 The question to be asked is: How has metropolitan Miami’sBlack population fared during this period of unprecedented change? To answer this question thisreport provides a broad demographic portrait of Greater Miami’s Black population.
Chapter 1 covers in more detail the growth of the various components of the County’spopulation. It also provides projections for what should be expected for the future populationcharacteristics of Miami-Dade to be if current trends continue to 2020. Chapter 2 concentrateson the components of the population change that has taken place, including the effects of births,deaths, net domestic (within the U.S.) migration, and net international migration. The thirdchapter covers some of the basic demographic characteristics of Miami’s Blacks, including theirgender composition, age structure, educational achievement, income and poverty levels, maritalstatus, and various other miscellaneous social characteristics. Chapter 4 investigates theemployment characteristics of Blacks. Black migration is the topic of the fifth chapter, stressingboth domestic moves made within the United States and international migration of Blacks toMiami, especially from the Caribbean. Chapter 6 studies the basic geography of where Blackslive in Miami-Dade County, and how their residential patterns segregated from that of Hispanicsand Non-Hispanic Whites. It also looks at the residential distributions of some of thecomponents of the County’s Black population. Chapter 7 considers the socioeconomic status(SES) of Miami’s Blacks and compares them to the SES of Hispanics and Non-Hispanic Whites. It then disaggregates the Black population into some of its sub-populations and compares theirSES levels as well. Finally, Chapter 8 considers some of the household characteristics of Blacks
Profile of Miami-Dade County’s Black Population Thomas D. Boswell, Ph.D.
Office of Black Affairs Miami-Dade County Office of Community Advocacy-11-
and compares them to that of Hispanics and Non-Hispanic Whites.
The reader should note that this report is using the following terms as synonyms, Miami-Dade County, metropolitan Miami, and Greater Miami. Sometimes for brevity we simply say“Miami” when referring to Miami-Dade County. None of the data being used here refer to onlythe City of Miami.
The data used in this report came mainly from the U.S. Bureau of the Census. Morespecifically, liberal use is made of the 2000 Population Census and its four summary files. Summary File 1 was used whenever possible because its figures derive from the complete countof the 2000 Census of Population. Summary File 2 was used for household characteristics. Summary File 3 comes from a 17 percent sample and was used for some of the socioeconomicdata. Summary File 4 also comes from a sample and it was used for comparing Blacks,Hispanics, and Non-Hispanic Whites. The Public Use Microdata Sample (PUMS) one percentsample for the United States and the PUMS five percent sample for Miami-Dade County wereboth used in making custom tabulations when Summary Files 1-4 did not provide some of theinformation needed. Use was also made of some other miscellaneous data sources such as the2006 United States Statistical Abstract, and we occasionally use data from a demographic profileof the Dade County’s Black population produced by Miami-Dade County’s Department ofPlanning and Zoning in 1995. In fact, the profile of the Black population in this report is thefourth one in a series, and partially updates the other three that were published in 1979, 1985, and1995.
One last point that needs to be made in this introduction is how the data have been reported. When using percentages, we normally carry them out to the first decimal point in the tables. However, we round them in the text to the nearest whole number to keep things simple and easier to remember.
Profile of Miami-Dade County’s Black Population Thomas D. Boswell, Ph.D.
4Profile of the Black Population 1995, Department of Community Affairs, Office of Black Affairs,
Research Division of the Metropolitan Dade County Planing Department, December, 1995, p. 3.
5A brief overview of the Black settlement in Miami-Dade County is contained in: Profile of the Black
Population, Metropolitan Dade County, Office of the County Manger, Spring, 1979. The names of many of these
historic neighborhoods are no longer used among the local population of metropolitan M iami.
Office of Black Affairs Miami-Dade County Office of Community Advocacy-12-
CHAPTER 1
Population Growth and Change of Blacks in Miami-Dade County
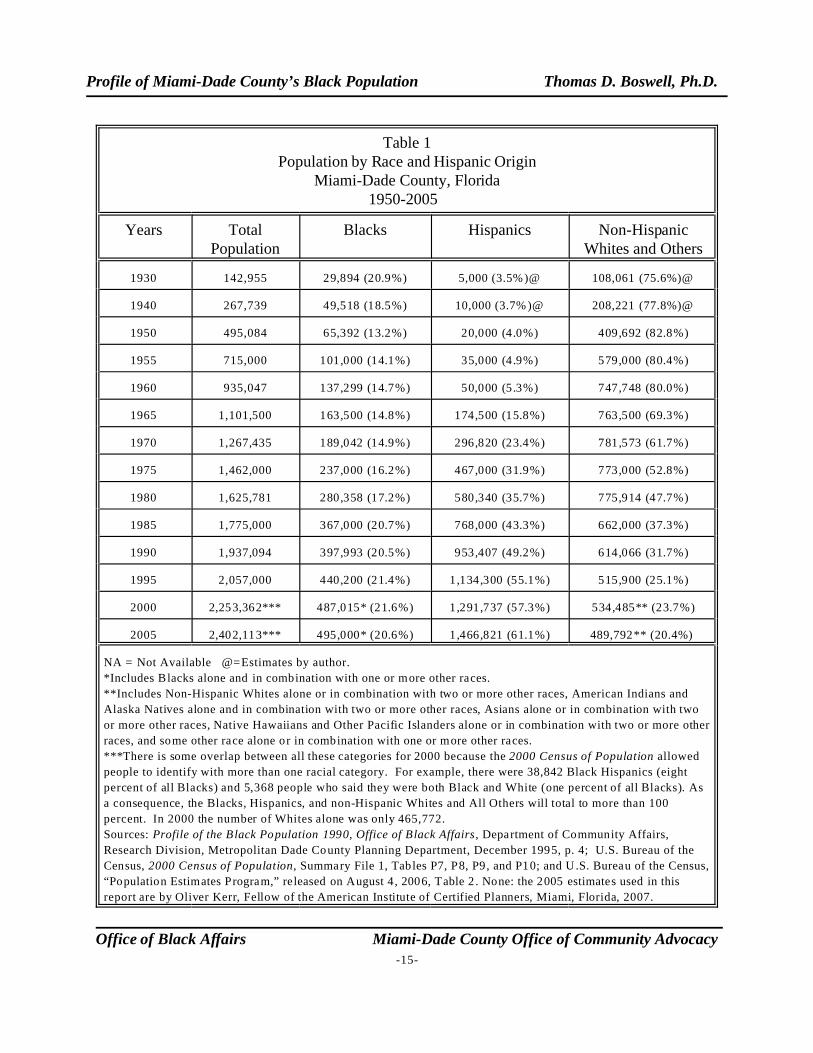
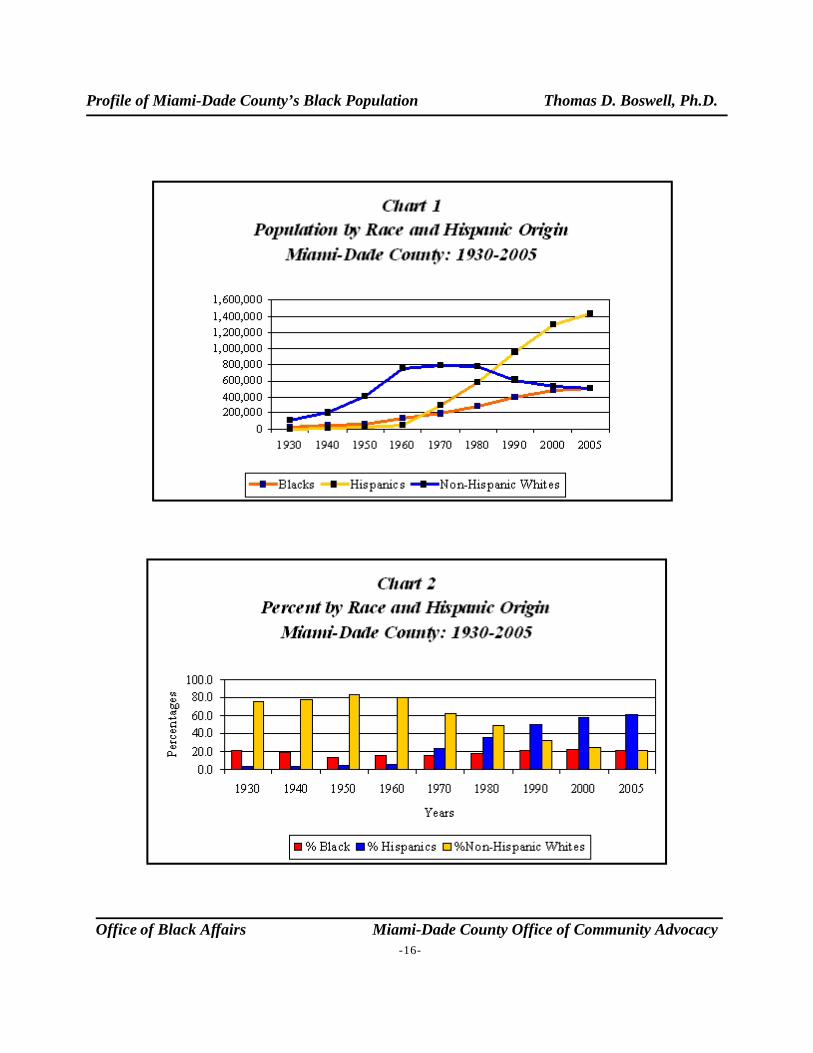
Table 1 shows the growth and change in the racial and ethnic composition of the populationof Miami-Dade County starting in 1930 and continuing to 2005. Table 2 shows the most recentprojections for the period of 2010 to 2020. Charts 1 and 2 accompany Tables 1 and 2,respectively.
The 1880 Census enumerated only four Blacks in Miami-Dade County4 and by 1930 thisfigure had increased to almost 30,000 (Table 1). In 2000, results from the most recent U.S.Census of Population showed that the number of people who classified themselves as Blackalone or in combination with another race(s) was 487,015. If we consider only persons wholisted themselves as Black alone, the figure would be 457,214. Therefore, there were 29,801(487,015 minus 457,214) persons who indicated they were a mixture of Black and some otherrace. By 2005 it is estimated by the U.S. Census Bureau that Blacks alone or in combinationwith other races increased to slightly less than one-half million (495,000). In that year theyfinally surpassed Miami’s Non-Hispanic White population, to become the County’s secondlargest population group behind Hispanics.
Many predominantly Black neighborhoods in Miami-Dade County today trace their historyback a number of decades and some even into the late 1800s. The latter include Coconut Grove,Overtown, Lemon City (now Edison), and Brownsville. In the 1910s and 1920s Goulds,Homestead, Florida City, South Miami, and Seminola became Black communities, to befollowed later by the emergence of Perrine, Opa-Locka, and Washington Park. Many other Blackareas such as Model City, Carol City, North County, West Little River, Edison-Little River,Bunche Park, and Richmond Heights are relatively recent Black concentrations, dating from the1950s, 1960s and 1970s.5
Of course everyone who lives in Metropolitan Miami knows that the biggest news concerningethnic and racial change in South Florida has been the tremendous growth of its Hispanic
Profile of Miami-Dade County’s Black Population Thomas D. Boswell, Ph.D.
6Oliver Kerr is a Fellow of the American Institute of Certified Planners and currently works part-time for
Florida International University’s Metropolitan Center. He retired from the Miami-Dade County’s Department of
Planning and Zoning in 2006 . He can be reached at [email protected].
Office of Black Affairs Miami-Dade County Office of Community Advocacy-13-
population. In 1960 Hispanics represented only slightly more than five percent of Miami-Dade County’s population, but by 2005 this proportion has increased to almost 61 percent. Until the1960s, Miami-Dade County was a typical American city with more than 80 percent of its totalpopulation being Non-Hispanic Whites (NHWs) and its largest minority was comprised ofBlacks. However, all of this began to change with the Cuban Revolution that occurred in 1959,and the subsequent heavy emigration from that island to Miami-Dade County. By 1965 theBlack population was surpassed by Hispanics and by 1985 Hispanics were more numerous thanNHWs (Chart 1). The next chapter discusses the factors or components that accounted for thischange. The percentages displayed in Table 1 and shown in Chart 2 dramatically show how theethnic and racial composition of Miami’s population has changed. Today, the vast majority(approaching two-thirds) of the population is Hispanic and the number of Blacks and NHWs arealmost identical at around 21 percent each. During the 75 years shown in Table 1 not only hasthe Hispanic population grown, but so to has the Black population increased, although itspercentage of the total has consistently hovered around 21 percent since 1985. While the Blacksand especially the Hispanics have been increasing, the NHW population has been declining inabsolute numbers as well as percentages since the 1970s. Today, Blacks and NHWs are almosttied for second place (Blacks have slightly larger numbers), with Hispanics clearly being thenumerically dominant component of the Miami-Dade’s population. It is clear that there is largescale White out-migration from Metropolitan Miami, but is also clear, but less apparent, thatthere has been a significant amount of Black flight as well, although this latter is difficult to seein the in the figures in Table 1. This is a topic that will be explored more fully in the nextchapter.
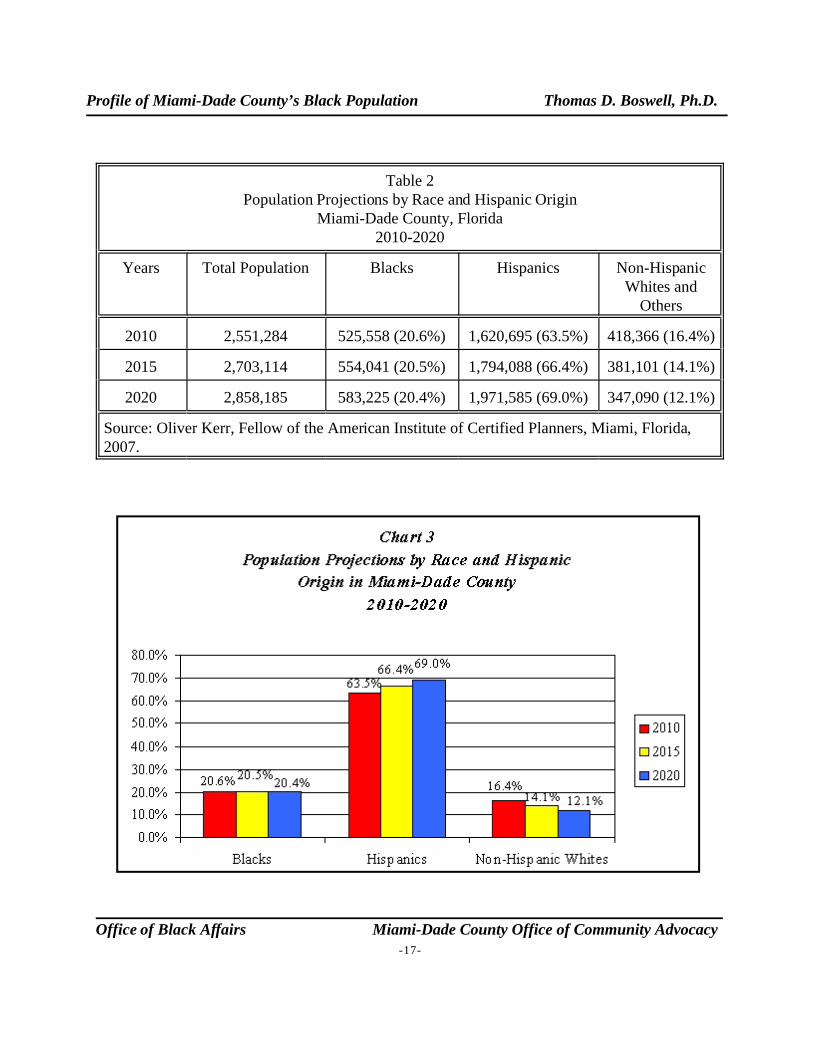
What does the future hold for ethnic and racial change in metropolitan Miami? In an attemptto answer this question Oliver Kerr, former planner with the Metropolitan Miami-Dade CountyPlanning and Zoning Department,6 has made some projections forward to 2020 (Table 2 andChart 3). It is important to note that these are “projections” and not necessarily “predictions”because they are based on the assumption that current trends in fertility, mortality, and migrationcontinue into the future. A drastic change in any of these components (especially America’simmigration policy) could radically affect these numbers in the future.
The projections show (Chart 3) that if current trends continue, the percentage of Blacks inMetropolitan Miami will slightly decrease to around 20 percent, while their absolute numberswill somewhat increase. Hispanics will continue to increase their numbers and proportion of theCounty’s total population to near 70 percent, while the NHWs will continue to plummet in both
Profile of Miami-Dade County’s Black Population Thomas D. Boswell, Ph.D.
Office of Black Affairs Miami-Dade County Office of Community Advocacy-14-
numbers and percentages. By 2020, if trends continue as they are now, Blacks will have re-established themselves clearly as the largest minority in the County. What will be especiallydifferent will be that NHWs will barely represent 12 percent of the County’s population, makingthem the second minority (behind Blacks) in a majority population of Hispanics. How thishappened and is currently occurring will be the topic of discussion in the next chapter.
Profile of Miami-Dade County’s Black Population Thomas D. Boswell, Ph.D.
Office of Black Affairs Miami-Dade County Office of Community Advocacy-15-
Table 1Population by Race and Hispanic Origin
Miami-Dade County, Florida1950-2005
Years TotalPopulation
Blacks Hispanics Non-HispanicWhites and Others
1930 142,955 29,894 (20.9%) 5,000 (3.5%)@ 108,061 (75.6%)@
1940 267,739 49,518 (18.5%) 10,000 (3.7% )@ 208,221 (77.8%)@
1950 495,084 65,392 (13.2%) 20,000 (4.0%) 409,692 (82.8%)
1955 715,000 101,000 (14.1%) 35,000 (4.9%) 579,000 (80.4%)
1960 935,047 137,299 (14.7%) 50,000 (5.3%) 747,748 (80.0%)
1965 1,101,500 163,500 (14.8%) 174,500 (15.8%) 763,500 (69.3%)
1970 1,267,435 189,042 (14.9%) 296,820 (23.4%) 781,573 (61.7%)
1975 1,462,000 237,000 (16.2%) 467,000 (31.9%) 773,000 (52.8%)
1980 1,625,781 280,358 (17.2%) 580,340 (35.7%) 775,914 (47.7%)
1985 1,775,000 367,000 (20.7%) 768,000 (43.3%) 662,000 (37.3%)
1990 1,937,094 397,993 (20.5%) 953,407 (49.2%) 614,066 (31.7%)
1995 2,057,000 440,200 (21.4%) 1,134,300 (55.1%) 515,900 (25.1%)
2000 2,253,362*** 487,015* (21.6%) 1,291,737 (57.3%) 534,485** (23.7%)
2005 2,402,113*** 495,000* (20.6%) 1,466,821 (61.1%) 489,792** (20.4%)
NA = Not Available @=Estimates by author.
*Includes Blacks alone and in combination with one or more other races.
**Includes Non-Hispanic Whites alone or in combination with two or more other races, American Indians and
Alaska Natives alone and in combination with two or more other races, Asians alone or in combination with two
or more other races, Native Hawaiians and Other Pacific Islanders alone or in combination with two or more other
races, and some other race alone or in combination with one or more other races.
***There is some overlap between all these categories for 2000 because the 2000 Census of Population allowed
people to identify with more than one racial category. For example, there were 38,842 Black Hispanics (eight
percent of all Blacks) and 5,368 people who said they were both Black and White (one percent of all Blacks). As
a consequence, the Blacks, Hispanics, and non-Hispanic Whites and All Others will total to more than 100
percent. In 2000 the number of Whites alone was only 465,772.
Sources: Profile of the Black Population 1990, Office of Black Affairs, Department of Community Affairs,
Research Division, Metropolitan Dade County Planning Department, December 1995, p. 4; U.S. Bureau of the
Census, 2000 Census of Population, Summary File 1, Tables P7, P8, P9, and P10; and U.S. Bureau of the Census,
“Population Estimates Program,” released on August 4, 2006, Table 2 . None: the 2005 estimates used in this
report are by Oliver Kerr, Fellow of the American Institute of Certified Planners, Miami, Florida, 2007.
Profile of Miami-Dade County’s Black Population Thomas D. Boswell, Ph.D.
Office of Black Affairs Miami-Dade County Office of Community Advocacy-16-
Profile of Miami-Dade County’s Black Population Thomas D. Boswell, Ph.D.
Office of Black Affairs Miami-Dade County Office of Community Advocacy-17-
Table 2Population Projections by Race and Hispanic Origin
Miami-Dade County, Florida2010-2020
Years Total Population Blacks Hispanics Non-HispanicWhites and
Others
2010 2,551,284 525,558 (20.6%) 1,620,695 (63.5%) 418,366 (16.4%)
2015 2,703,114 554,041 (20.5%) 1,794,088 (66.4%) 381,101 (14.1%)
2020 2,858,185 583,225 (20.4%) 1,971,585 (69.0%) 347,090 (12.1%)
Source: Oliver Kerr, Fellow of the American Institute of Certified Planners, Miami, Florida,2007.
Profile of Miami-Dade County’s Black Population Thomas D. Boswell, Ph.D.
Office of Black Affairs Miami-Dade County Office of Community Advocacy-18-
CHAPTER 2
Components of Population Change for Blacks in Miami-Dade County
The following two equations show the components or factors that directly control populationgrowth.
(1) P2 = P1 + B - D + IMdom - OMdom + IM int - OM int
Where: P1 = Population at the beginning of the period (e.g. 1990) P2 = Population at the end of the period (e.g. 2000)B = Births during the periodD = Deaths during the periodIMdom = Domestic In-Migration during the periodOMdom = Domestic Out-Migration during the period IMint = International In-Migration during the periodOMint = International Out-Migration during the period
This can be simplified to:
(2) P2 = P1 + NI + NMdom + NMint
Where: NI = Natural Increase = B - D during the periodNMdom = Net Domestic Migration = IMdom - Omdom during the periodNMint = Net International Migration = IMint - OMint during the period
The first equation (1) says that the population at some time (e.g. 2000) is dependent upon whatthe population was at the beginning of the period (e.g. 1990), plus the births that occurred duringthe time period, minus the deaths that occurred during the period, plus the number of domestic in-migrants, minus the number of domestic (internal) out-migrants, plus the number of internationalimmigrants, minus the number of international emigrants. Domestic migrants are people whomove internally within a country; whereas international migrants are those who move acrossinternational borders. Examples of domestic in-migrants would be people who move from otherparts of the United States to Miami-Dade County. Examples of domestic out-migrants would bepeople who move from Miami-Dade County to other parts of the United States. Examples ofinternational immigrants would be people from other countries who move to Miami and examples
Profile of Miami-Dade County’s Black Population Thomas D. Boswell, Ph.D.
7In the case of M iami-Dade County, the terms “in-migrants” and “out-migrants” are generally used with
domestic migrants who move internally to Miami and from Miami within the United States. The term “immigrants”
refer to people who move from other countries to Miami and the term “emigrants” refers to persons who move from
Miami to o ther countries.
Office of Black Affairs Miami-Dade County Office of Community Advocacy-19-
of international emigrants would be people who move from Miami to other countries.7
The second equation (2) is a simplification of the first. Births minus deaths are referred to bydemographers as natural increase (NI). In-migrants minus out-migrants is referred to as netdomestic migration (NMdom). Immigrants minus emigrants are called net internationalmigration (NMint).
This chapter briefly covers each of these components of population change for Miami-DadeCounty’s Black population and makes frequent comparisons between metropolitan Miami’sBlacks and those of the non-Black population and those of the County’s Hispanics and Non-Hispanic Whites.
Black Births and Deaths
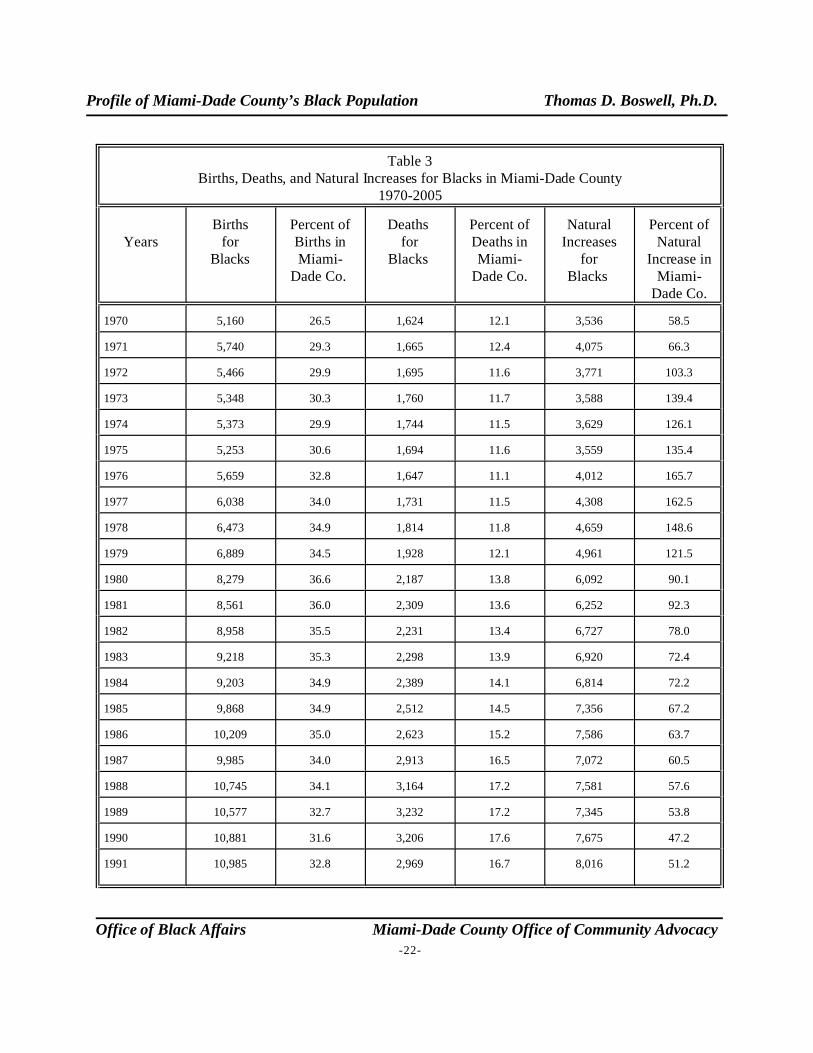
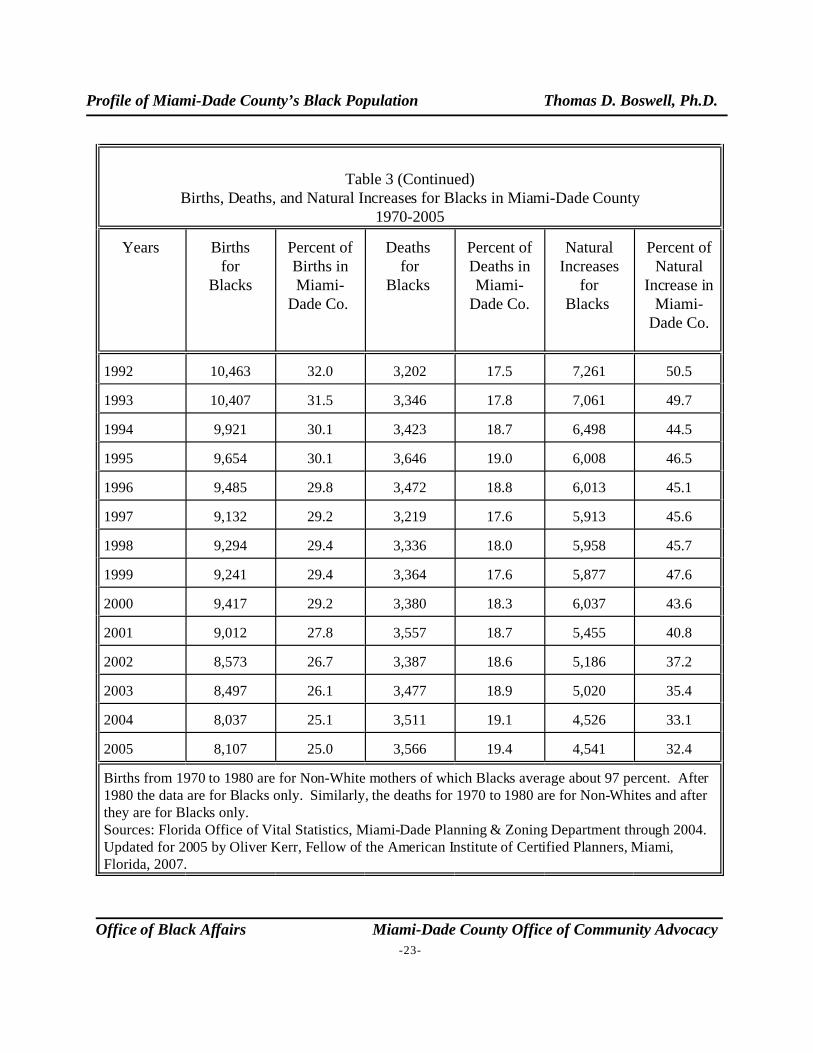
Table 3 shows the numbers of births and deaths of Blacks in Miami-Dade County during theperiod of 1970 to 1995. It also shows the Black percentages of all births and deaths occurring inMiami-Dade County during this 35-year interval. The number of births to Black mothersincreased to a high of almost 11,000 in 1991 and thereafter declined steadily to slightly more than8,000 in 2005. This decline during the past 15 years occurred despite an increase in the Blackpopulation. This could only have occurred if the birth rates of Blacks declined (Table 4). Therates for Blacks in Miami-Dade County dropped from a high of almost 30 births per thousandBlacks to 16.1 births per thousand in 2005. The decline in birth rates among metropolitanMiami’s Blacks followed declining national trends among both Blacks and Whites living in theUnited States. As Blacks began to modernize and their incomes and socioeconomic status rose,the costs of having children also rose, providing an incentive for lowering fertility. Still, thefigures in Table 3 show that the percentage of births in Miami-Dade County that were producedby Black mothers since 1970 were consistently higher than their proportionate share of thepopulation. During this time the percentage of the County’s population that was Black hoveredbetween about 15 percent and 22 percent (Table 1), while the percentage of all births attributed toBlacks rose from 26 percent in 1970 to a high of almost 37 percent in 1980 and then declined to25 percent in 2005.
The number of deaths that have occurred to Blacks since 1970 have increased from about1,600 in 1970 to a high of almost 3,650 in 1995 (Table 3). Since the latter date, the number ofBlack deaths have fluctuated from year to year between 3,600 and 3,200 deaths. It may surprise
Profile of Miami-Dade County’s Black Population Thomas D. Boswell, Ph.D.
8Population Reference Bureau, 2006 World Population Data Sheet, Washington, D.C., 2006.
9Thirty-Year Retrospective: The Status of the Black Community in M iami-Dade County, Metropolitan
Center, Florida International University, 2007, sponsored by the Metro Miami Action Plan, pp. 89-96.
Office of Black Affairs Miami-Dade County Office of Community Advocacy-20-
some readers to learn that Blacks actually have lower death rates per 1,000 Blacks than the rest ofMiami-Dade County’s population. This can be seen from the fourth column in Table 3 containingthe figures for the percentage of all deaths attributable to Blacks. These percentages areconsistently lower than the proportion of the County’s total population that is comprised of Blacksfor each of the years covered in this table. This does not mean that Blacks enjoy a higher standardof health in the County than either Non-Hispanic Whites or Hispanics. In fact, the standard ofhealth care for Blacks is considerably lower. The reason their death rates are lower is that theyhave a more youthful age structure when compared to the rest of the County’s population. In fact,the median age for Blacks is almost 10 years younger than for either Hispanics of Non-HispanicWhites, a topic that will be covered later in this report. Since it is the elderly who are exposed tothe greatest risk of dying this is a significant fact. Populations with relatively high fertility, likeBlacks in Miami, produce age structures that have a larger percentage of young people who areless likely to die and a smaller percentage of elderly who are more exposed to the risk of dying. Adeath that does not standardize for age effects is called by demographers the “crude death rate.” As an example of this problem, the crude death rate for the United States in 2006 was eight per1,000, which is considerable higher than in such developing countries as Mexico (5 per 1,000),Guatemala (6 per 1,000), Honduras (6 per 1,000), Nicaragua (5 per 1,000), Colombia (5 per1,000), Venezuela (5 per 1,000), and Paraguay (5 per 1,000).8 All of these countries in LatinAmerica have much more youthful populations and a considerably lower percentage of theirpopulations being elderly.
A recent study by Florida International University’s Metropolitan Center studies in more detailthe death rates of Blacks compared to Hispanics and Non-Hispanic Whites in Miami-DadeCounty. Although it also shows a lower crude death rate for Blacks, it clearly demonstrates thepoorer health of Miami’s Non-Hispanic Blacks. In 2002, Blacks in Miami had an infant mortalityrate that was more than twice that of both Hispanics and NHWs. The percentage of low birthweight births to Blacks was twice that for NHWs and more than twice that for Hispanics. Although Blacks represent 21 percent of the County’s population, they accounted for 55 percentof the AIDS cases.9
Perhaps the most interesting column in Table 3 is the one containing the percentages of theCounty’s total natural increase that is attributable to Blacks. For each year, these figures are farhigher than the Black’s proportionate share of the County’s total population (15 to 22 percent). This makes sense because Blacks have had consistently higher birth rates and lower death rates
Profile of Miami-Dade County’s Black Population Thomas D. Boswell, Ph.D.
10Although Blacks have a lower death rate than the rest of the County’s population, the age-specific death
rates are higher for Blacks. The reason the overall death rate for Blacks is lower is because of their more youthful
age structure, with proportionately fewer elderly Blacks.
11Population Reference Bureau, 2006 World Population Data Sheet, Washington, D.C., 2006.
Office of Black Affairs Miami-Dade County Office of Community Advocacy-21-
than the rest of the County’s population.10 In fact, from 1972 to 1979 Blacks accounted for morethan 100 percent of the County’s natural increase because the rates of natural increase werenegative for the rest of the population during this period. That is, there were more deaths thanbirths during this eight-year period among the rest of the population.
The figures in Table 4 and in Chart 4 confirm some of the inferences made earlier when examining Table 3. The Black birth rates reached a peak in 1980 and then began a declinethereafter to a low of 16 per 1,000 in 2005. The death rates for Blacks fluctuated between 1970and 1995, and thereafter exhibited a gradual decline. The rates of natural increase for Blacksreached a peak in 1980 and then declined. In 2005 the rate of natural increase for Blacks inMiami-Dade County was .9 percent and was higher than it was among the rest of the County’spopulation and was about 50 percent higher than for the total United States population (.6percent). It was about equal to the rates of natural increase found in such South Americancountries as Chile (1.0 percent) and Argentina (1.1 Percent) and the Caribbean-island countries ofthe Bahamas (1.0 percent) , Dominica (.8 percent), Guadeloupe, and St. Kitts-Nevis.11
Profile of Miami-Dade County’s Black Population Thomas D. Boswell, Ph.D.
Office of Black Affairs Miami-Dade County Office of Community Advocacy-22-
Table 3Births, Deaths, and Natural Increases for Blacks in Miami-Dade County
1970-2005
YearsBirths
forBlacks
Percent ofBirths inMiami-
Dade Co.
Deaths for
Blacks
Percent ofDeaths inMiami-
Dade Co.
NaturalIncreases
forBlacks
Percent ofNatural
Increase inMiami-
Dade Co.
1970 5,160 26.5 1,624 12.1 3,536 58.5
1971 5,740 29.3 1,665 12.4 4,075 66.3
1972 5,466 29.9 1,695 11.6 3,771 103.3
1973 5,348 30.3 1,760 11.7 3,588 139.4
1974 5,373 29.9 1,744 11.5 3,629 126.1
1975 5,253 30.6 1,694 11.6 3,559 135.4
1976 5,659 32.8 1,647 11.1 4,012 165.7
1977 6,038 34.0 1,731 11.5 4,308 162.5
1978 6,473 34.9 1,814 11.8 4,659 148.6
1979 6,889 34.5 1,928 12.1 4,961 121.5
1980 8,279 36.6 2,187 13.8 6,092 90.1
1981 8,561 36.0 2,309 13.6 6,252 92.3
1982 8,958 35.5 2,231 13.4 6,727 78.0
1983 9,218 35.3 2,298 13.9 6,920 72.4
1984 9,203 34.9 2,389 14.1 6,814 72.2
1985 9,868 34.9 2,512 14.5 7,356 67.2
1986 10,209 35.0 2,623 15.2 7,586 63.7
1987 9,985 34.0 2,913 16.5 7,072 60.5
1988 10,745 34.1 3,164 17.2 7,581 57.6
1989 10,577 32.7 3,232 17.2 7,345 53.8
1990 10,881 31.6 3,206 17.6 7,675 47.2
1991 10,985 32.8 2,969 16.7 8,016 51.2
Profile of Miami-Dade County’s Black Population Thomas D. Boswell, Ph.D.
Office of Black Affairs Miami-Dade County Office of Community Advocacy-23-
Table 3 (Continued)Births, Deaths, and Natural Increases for Blacks in Miami-Dade County
1970-2005
Years Birthsfor
Blacks
Percent ofBirths inMiami-
Dade Co.
Deaths for
Blacks
Percent ofDeaths inMiami-
Dade Co.
NaturalIncreases
forBlacks
Percent ofNatural
Increase inMiami-
Dade Co.
1992 10,463 32.0 3,202 17.5 7,261 50.5
1993 10,407 31.5 3,346 17.8 7,061 49.7
1994 9,921 30.1 3,423 18.7 6,498 44.5
1995 9,654 30.1 3,646 19.0 6,008 46.5
1996 9,485 29.8 3,472 18.8 6,013 45.1
1997 9,132 29.2 3,219 17.6 5,913 45.6
1998 9,294 29.4 3,336 18.0 5,958 45.7
1999 9,241 29.4 3,364 17.6 5,877 47.6
2000 9,417 29.2 3,380 18.3 6,037 43.6
2001 9,012 27.8 3,557 18.7 5,455 40.8
2002 8,573 26.7 3,387 18.6 5,186 37.2
2003 8,497 26.1 3,477 18.9 5,020 35.4
2004 8,037 25.1 3,511 19.1 4,526 33.1
2005 8,107 25.0 3,566 19.4 4,541 32.4
Births from 1970 to 1980 are for Non-White mothers of which Blacks average about 97 percent. After1980 the data are for Blacks only. Similarly, the deaths for 1970 to 1980 are for Non-Whites and afterthey are for Blacks only. Sources: Florida Office of Vital Statistics, Miami-Dade Planning & Zoning Department through 2004. Updated for 2005 by Oliver Kerr, Fellow of the American Institute of Certified Planners, Miami,Florida, 2007.
Profile of Miami-Dade County’s Black Population Thomas D. Boswell, Ph.D.
Office of Black Affairs Miami-Dade County Office of Community Advocacy-24-
Table 4 Birth Rates, Death Rates, and Rates of Natural Increase for Blacks
in Miami-Dade County1970-2005
Years Birth Rates(Per 1,000)
Death Rates(Per 1,000)
Rates of NaturalIncrease
(Per 100)*
1970 27.3 8.6 1.9%
1975 22.2 7.1 1.5%
1980 29.5 7.8 2.2%
1985 26.9 6.8 2.0%
1990 27.3 8.1 1.9%
1995 21.9 8.3 1.4%
2000 19.3 6.9 1.2%
2005 16.1 7.1 .9%
*Note: The natural increase rates are per 100, or percentages. The birth and death rates are expressed per 1,000.
This is the standard way of representing these rates by demographers.
Sources: Calculated from data derived from T ables 1 and 3 in this report.
Profile of Miami-Dade County’s Black Population Thomas D. Boswell, Ph.D.
12Profile of the Black Population 1995, Department of Community Affairs, Office of Black Affairs,
Research Division of the Metropolitan Dade County Planing Department, December, 1995, p. 9.
Office of Black Affairs Miami-Dade County Office of Community Advocacy-25-
Components of Population Change
The direct affects of natural increase, net domestic migration, and net international migrationon the changing racial and ethnic composition of Miami-Dade County’s population are shown inTable 5 and Chart 5. However, as a cautionary note, it should be understood by the reader thatthere is some overlap in Table 5 between the Blacks and Hispanics because there were almost39,000 Black Hispanics living in the County in 2000, as noted earlier in this report in Table 1. Thus, when Blacks, Hispanics, and Non-Hispanic Whites and Others are added together they totalto slightly more than the figures shown in the second column of Table 5.
All three groups (Blacks, Hispanics, and Non-Hispanics and Others) gained population throughnatural increase during the 1990s. As noted earlier in this chapter, because of their higher birthrates and lower death rates, Blacks gained the most through natural increase. In fact, Blacks aloneaccounted for almost 47 percent of the total natural increase during this decade in MetropolitanMiami (see both Tables 3 and 5).
Also, all three groups gained population through net international migration. Of course theHispanics gained the most, slightly more than a quarter of a million. The net internationalmigration for Blacks and the Non-Hispanics Whites and Others were almost identical at somewhatmore than 39,000 each. The topic of the immigration of Blacks is an issue that will be discussedfurther in a later chapter in this report.
Where the three population subgroups in Metropolitan Miami varied the most was in theirrespective net domestic migration patterns. While, the Hispanics had slightly more people movinginto Miami than leaving to live somewhere else in the United States, the reverse was true forBlacks and Non-Hispanic Whites. Approximately, 83,000 Blacks left Miami to live elsewhere inthe United States, while 55,000 Blacks moved into Miami-Dade County from other places in theU.S., providing a negative domestic net out-migration of 28,000 Blacks. For Non-Hispanic Whitesand Others the effect was even greater. They experienced a domestic net out-migration of almost167,000 persons. Similar domestic net migration patterns were experienced during the 1980s forHispanics (positive net in-flow), Blacks (negative net out-flow), and Non-Hispanic Whites(negative net out-flow).12 So, both the Black and Non-Hispanic White populations of Miami-DadeCounty have experienced domestic net out flows since at least the 1980s.
This raises the question of why more Blacks and Non-Hispanic Whites are out-migrating toother places in the United States than are in-migrating to Miami from other parts of the Country.
Profile of Miami-Dade County’s Black Population Thomas D. Boswell, Ph.D.
13The Metropolitan Center, “Black Community Survey: Perceptions & Outlooks,” Florida International
University, sponsored by the Metro-Miami Action Plan Trust, 2007.
Office of Black Affairs Miami-Dade County Office of Community Advocacy-26-
Anecdotal evidence suggests that it has to with job competition in Metropolitan Miami betweenimmigrants on the one hand and Blacks and Non-Hispanic Whites on the other. In 2000, 51percent of the population of Miami-Dade was comprised of immigrants, by far the highestpercentage for any large metropolitan area in the United States. In addition, by 2005 almost 62percent of the County’s population was comprised of Hispanics, of whom about 71 percent wereimmigrants. The more recent immigrants have become particularly dominant in the blue-collaroccupations requiring fewer skills, such as in the construction, restaurant, and hotel industries. Furthermore, Blacks and Hispanics are finding that it is becoming more important to be proficientin speaking and understanding Spanish, as well as English in Miami because of the large Spanish-speaking population. Frequently, one of the first questions Blacks and Non-Hispanic Whites areasked when they apply for a job is if they can speak Spanish. Because many cannot theiremployment opportunities are limited. A recent poll conducted by Florida InternationalUniversity’s Metropolitan Center determined that more than 30 percent of the Blacks they surveyedsaid they were considering moving away from Miami-Dade County. They were most concernedabout Miami’s housing costs and their raising insurance rates, in addition to job competition. Theywere also concerned about high crime rates and the poor quality of the schools in Blackneighborhoods.13
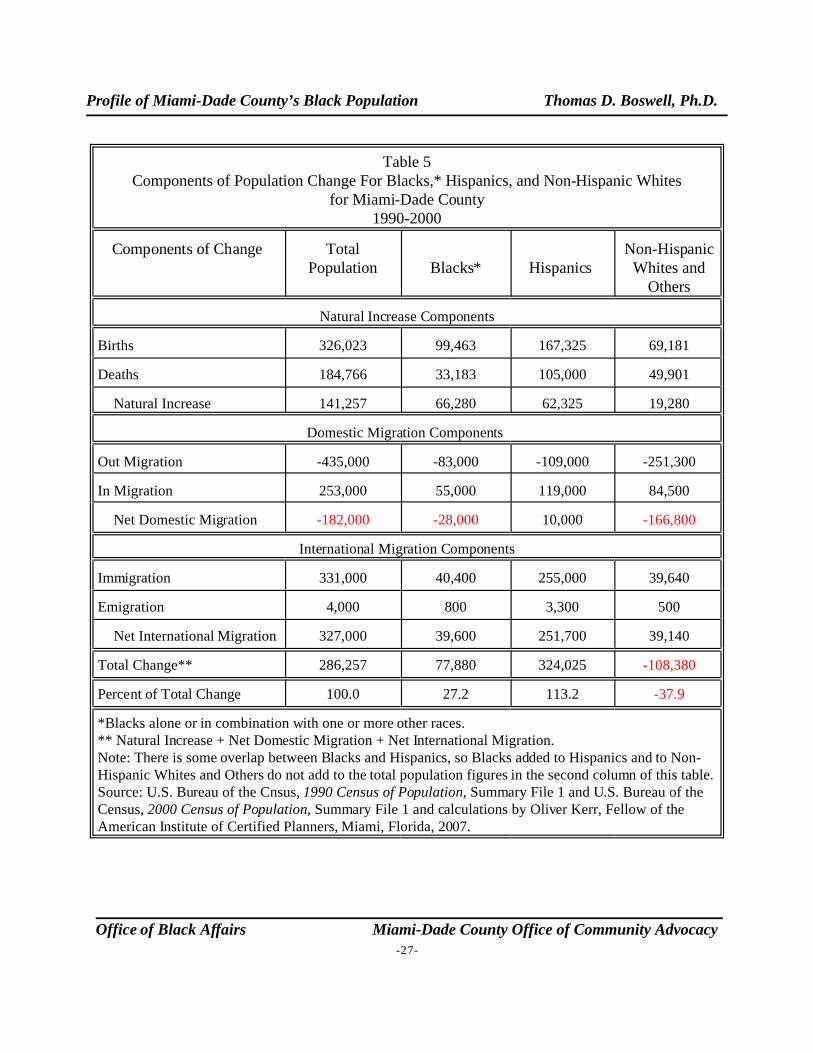
Profile of Miami-Dade County’s Black Population Thomas D. Boswell, Ph.D.
Office of Black Affairs Miami-Dade County Office of Community Advocacy-27-
Table 5Components of Population Change For Blacks,* Hispanics, and Non-Hispanic Whites
for Miami-Dade County1990-2000
Components of Change TotalPopulation Blacks* Hispanics
Non-HispanicWhites and
Others
Natural Increase Components
Births 326,023 99,463 167,325 69,181
Deaths 184,766 33,183 105,000 49,901
Natural Increase 141,257 66,280 62,325 19,280
Domestic Migration Components
Out Migration -435,000 -83,000 -109,000 -251,300
In Migration 253,000 55,000 119,000 84,500
Net Domestic Migration -182,000 -28,000 10,000 -166,800
International Migration Components
Immigration 331,000 40,400 255,000 39,640
Emigration 4,000 800 3,300 500
Net International Migration 327,000 39,600 251,700 39,140
Total Change** 286,257 77,880 324,025 -108,380
Percent of Total Change 100.0 27.2 113.2 -37.9
*Blacks alone or in combination with one or more other races.** Natural Increase + Net Domestic Migration + Net International Migration.Note: There is some overlap between Blacks and Hispanics, so Blacks added to Hispanics and to Non-Hispanic Whites and Others do not add to the total population figures in the second column of this table.Source: U.S. Bureau of the Cnsus, 1990 Census of Population, Summary File 1 and U.S. Bureau of theCensus, 2000 Census of Population, Summary File 1 and calculations by Oliver Kerr, Fellow of theAmerican Institute of Certified Planners, Miami, Florida, 2007.
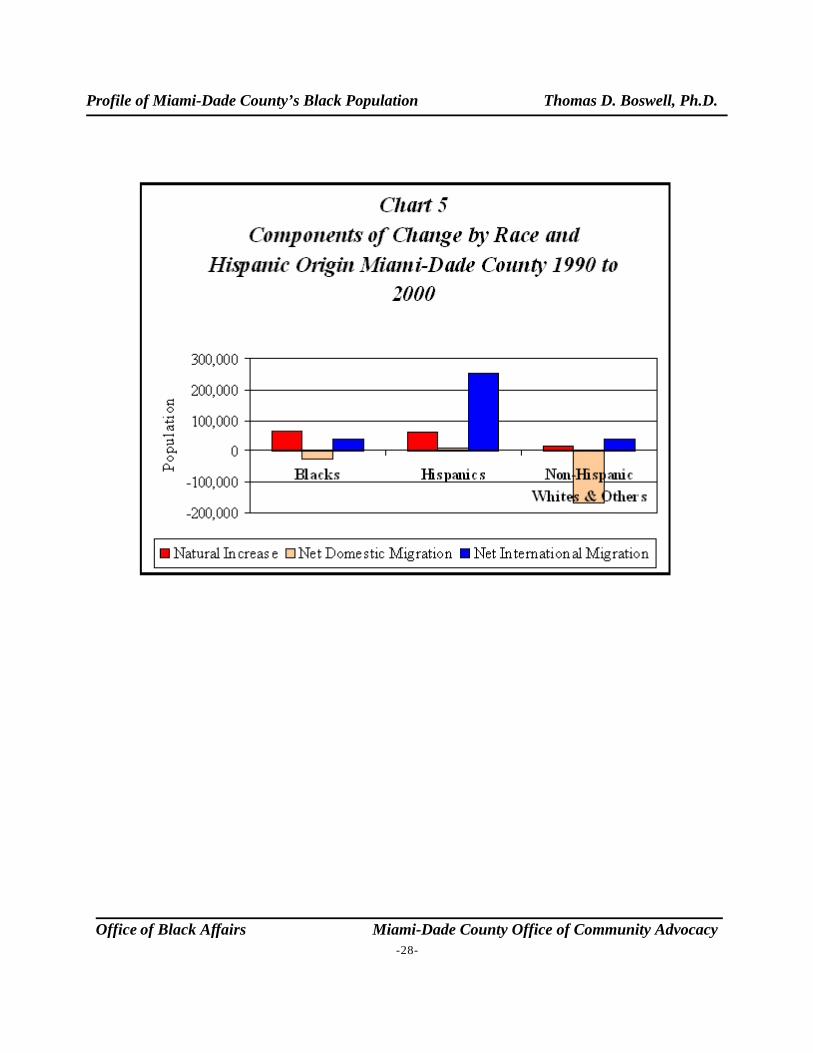
Profile of Miami-Dade County’s Black Population Thomas D. Boswell, Ph.D.
Office of Black Affairs Miami-Dade County Office of Community Advocacy-28-
Profile of Miami-Dade County’s Black Population Thomas D. Boswell, Ph.D.
Office of Black Affairs Miami-Dade County Office of Community Advocacy-29-
CHAPTER 3
Basic Demographic Characteristics of Blacksin Miami-Dade County
This chapter discusses some of the more important demographic and social characteristicsof Miami-Dade County’s Black population. In doing so, it compares Blacks to Hispanics and Non-Hispanic Whites living in the County and to the total U.S. population. More specifically, it coversthe following characteristics: (1) gender and age, (2) educational achievement levels, (3) incomeand poverty, (4) marital status, and (5) miscellaneous social characteristics.
Gender and Age of Blacks
Gender and age are two vital factors affecting the social and economic behavior ofpopulations. Both affect such characteristics as fertility, mortality, morbidity, migration, votingpatterns, and consumer behavior. The numbers in Table 6 imply that there is not much differencein the gender composition of Miami-Dade’s Black population when compared to either Hispanicsof Non-Hispanic Whites (NHWs). For all three populations there are slightly more females thanmales, and this is true as well for the total U.S. population.
There are, however, some very significant differences when it comes to the agecomposition of these populations. As noted earlier in this report, Blacks are on average about 10years younger than Hispanics and NHWs living in Miami-Dade County (Table 6). A significantlylarger share (47 percent) of the Miami’s Black population is found in the prime fertility age group(15-44 years) when compared to Hispanics (42 percent) and NHWs (38 percent). This is one ofthe reasons why Blacks have higher birth rates as noted earlier in this report. Of course, higherfertility itself affects the age structure of a population, so the effects are somewhat circular. Higherfertility produces a more youthful age structure and a younger population affects higher fertilityrates. Also it is noteworthy that Blacks have the lowest proportion (10 percent) of persons in theelderly years (60 years and older). For Hispanics and NHWs the share that is elderly is 19 percentand 22 percent, respectively. The proportion elderly is particularly important because of the way itaffects the need for health care facilities and services, as well as other social services.
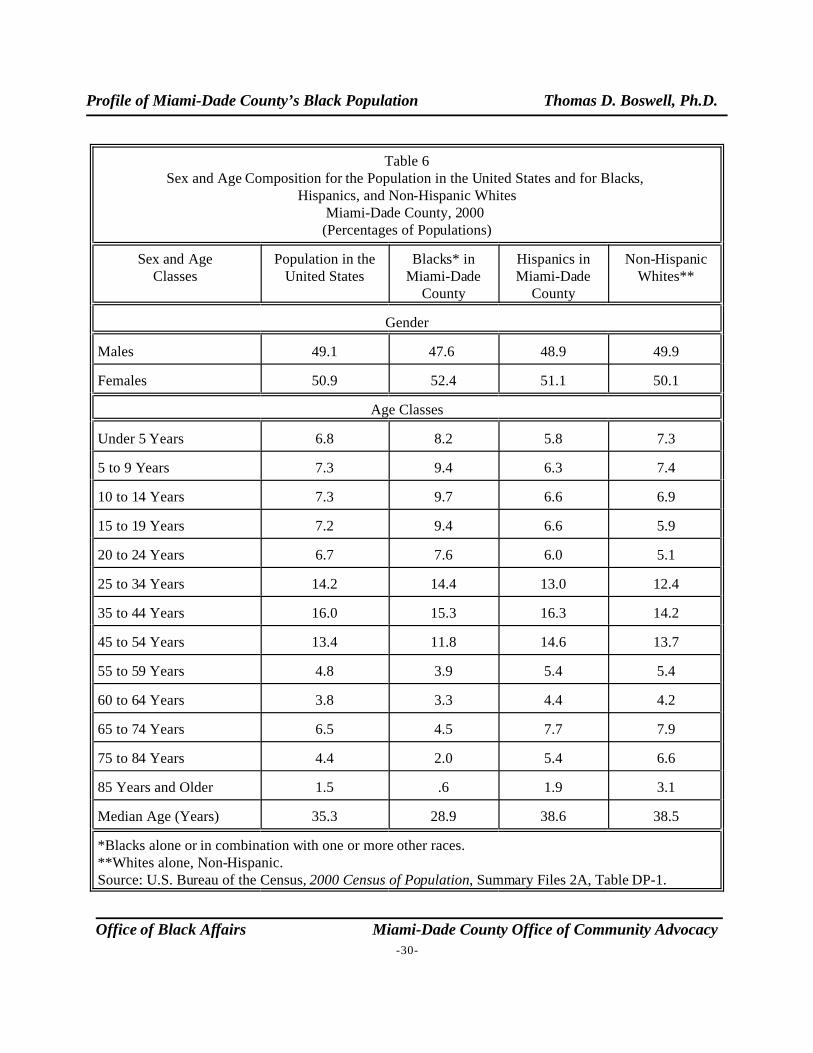
Profile of Miami-Dade County’s Black Population Thomas D. Boswell, Ph.D.
Office of Black Affairs Miami-Dade County Office of Community Advocacy-30-
Table 6Sex and Age Composition for the Population in the United States and for Blacks,
Hispanics, and Non-Hispanic WhitesMiami-Dade County, 2000
(Percentages of Populations)
Sex and AgeClasses
Population in theUnited States
Blacks* inMiami-Dade
County
Hispanics inMiami-Dade
County
Non-HispanicWhites**
Gender
Males 49.1 47.6 48.9 49.9
Females 50.9 52.4 51.1 50.1
Age Classes
Under 5 Years 6.8 8.2 5.8 7.3
5 to 9 Years 7.3 9.4 6.3 7.4
10 to 14 Years 7.3 9.7 6.6 6.9
15 to 19 Years 7.2 9.4 6.6 5.9
20 to 24 Years 6.7 7.6 6.0 5.1
25 to 34 Years 14.2 14.4 13.0 12.4
35 to 44 Years 16.0 15.3 16.3 14.2
45 to 54 Years 13.4 11.8 14.6 13.7
55 to 59 Years 4.8 3.9 5.4 5.4
60 to 64 Years 3.8 3.3 4.4 4.2
65 to 74 Years 6.5 4.5 7.7 7.9
75 to 84 Years 4.4 2.0 5.4 6.6
85 Years and Older 1.5 .6 1.9 3.1
Median Age (Years) 35.3 28.9 38.6 38.5
*Blacks alone or in combination with one or more other races.**Whites alone, Non-Hispanic.Source: U.S. Bureau of the Census, 2000 Census of Population, Summary Files 2A, Table DP-1.
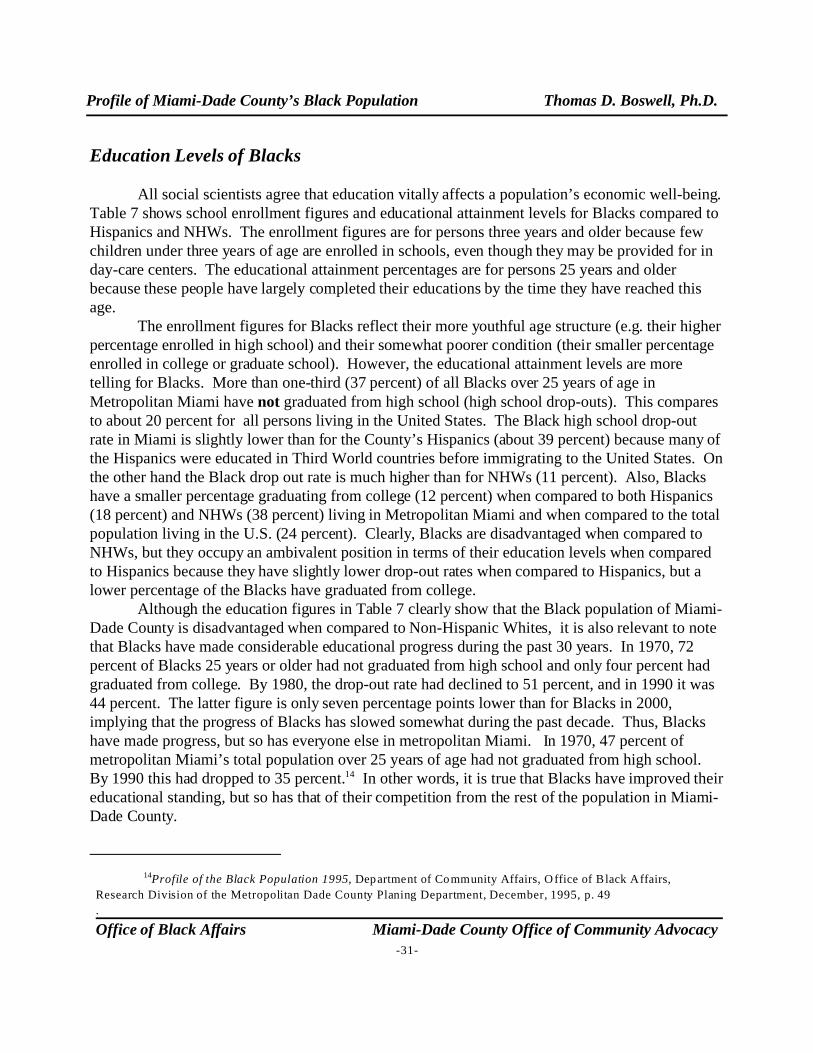
Profile of Miami-Dade County’s Black Population Thomas D. Boswell, Ph.D.
14Profile of the Black Population 1995, Department of Community Affairs, O ffice of Black Affairs,
Research Division of the Metropolitan Dade County Planing Department, December, 1995, p. 49
.
Office of Black Affairs Miami-Dade County Office of Community Advocacy-31-
Education Levels of Blacks
All social scientists agree that education vitally affects a population’s economic well-being. Table 7 shows school enrollment figures and educational attainment levels for Blacks compared toHispanics and NHWs. The enrollment figures are for persons three years and older because fewchildren under three years of age are enrolled in schools, even though they may be provided for inday-care centers. The educational attainment percentages are for persons 25 years and olderbecause these people have largely completed their educations by the time they have reached thisage.
The enrollment figures for Blacks reflect their more youthful age structure (e.g. their higherpercentage enrolled in high school) and their somewhat poorer condition (their smaller percentageenrolled in college or graduate school). However, the educational attainment levels are moretelling for Blacks. More than one-third (37 percent) of all Blacks over 25 years of age inMetropolitan Miami have not graduated from high school (high school drop-outs). This comparesto about 20 percent for all persons living in the United States. The Black high school drop-outrate in Miami is slightly lower than for the County’s Hispanics (about 39 percent) because many ofthe Hispanics were educated in Third World countries before immigrating to the United States. Onthe other hand the Black drop out rate is much higher than for NHWs (11 percent). Also, Blackshave a smaller percentage graduating from college (12 percent) when compared to both Hispanics(18 percent) and NHWs (38 percent) living in Metropolitan Miami and when compared to the totalpopulation living in the U.S. (24 percent). Clearly, Blacks are disadvantaged when compared toNHWs, but they occupy an ambivalent position in terms of their education levels when comparedto Hispanics because they have slightly lower drop-out rates when compared to Hispanics, but alower percentage of the Blacks have graduated from college.
Although the education figures in Table 7 clearly show that the Black population of Miami-Dade County is disadvantaged when compared to Non-Hispanic Whites, it is also relevant to notethat Blacks have made considerable educational progress during the past 30 years. In 1970, 72percent of Blacks 25 years or older had not graduated from high school and only four percent hadgraduated from college. By 1980, the drop-out rate had declined to 51 percent, and in 1990 it was44 percent. The latter figure is only seven percentage points lower than for Blacks in 2000,implying that the progress of Blacks has slowed somewhat during the past decade. Thus, Blackshave made progress, but so has everyone else in metropolitan Miami. In 1970, 47 percent ofmetropolitan Miami’s total population over 25 years of age had not graduated from high school. By 1990 this had dropped to 35 percent.14 In other words, it is true that Blacks have improved theireducational standing, but so has that of their competition from the rest of the population in Miami-Dade County.
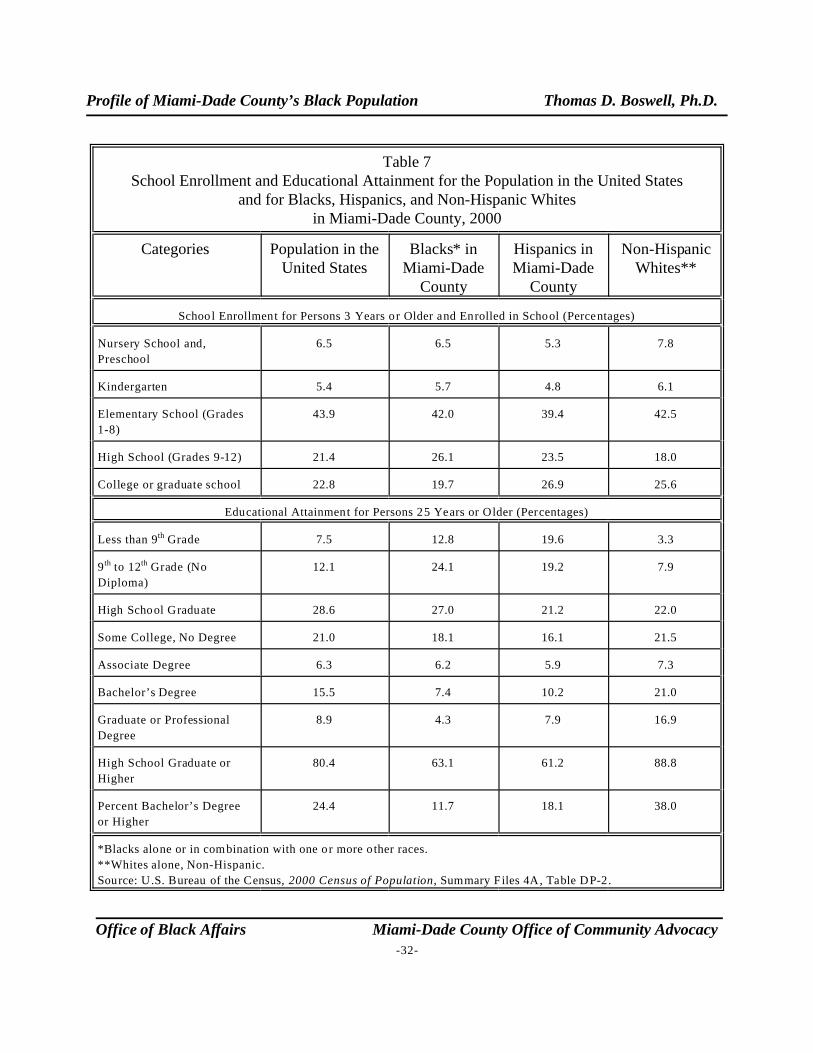
Profile of Miami-Dade County’s Black Population Thomas D. Boswell, Ph.D.
Office of Black Affairs Miami-Dade County Office of Community Advocacy-32-
Table 7School Enrollment and Educational Attainment for the Population in the United States
and for Blacks, Hispanics, and Non-Hispanic Whitesin Miami-Dade County, 2000
Categories Population in theUnited States
Blacks* inMiami-Dade
County
Hispanics inMiami-Dade
County
Non-HispanicWhites**
School Enrollment for Persons 3 Years or Older and Enrolled in School (Percentages)
Nursery School and,
Preschool
6.5 6.5 5.3 7.8
Kindergarten 5.4 5.7 4.8 6.1
Elementary School (Grades
1-8)
43.9 42.0 39.4 42.5
High School (Grades 9-12) 21.4 26.1 23.5 18.0
College or graduate school 22.8 19.7 26.9 25.6
Educational Attainment for Persons 25 Years or Older (Percentages)
Less than 9th Grade 7.5 12.8 19.6 3.3
9 th to 12th Grade (No
Diploma)
12.1 24.1 19.2 7.9
High School Graduate 28.6 27.0 21.2 22.0
Some College, No Degree 21.0 18.1 16.1 21.5
Associate Degree 6.3 6.2 5.9 7.3
Bachelor’s Degree 15.5 7.4 10.2 21.0
Graduate or Professional
Degree
8.9 4.3 7.9 16.9
High School Graduate or
Higher
80.4 63.1 61.2 88.8
Percent Bachelor’s Degree
or Higher
24.4 11.7 18.1 38.0
*Blacks alone or in combination with one or more o ther races.
**Whites alone, Non-Hispanic.
Source: U.S. Bureau of the Census, 2000 Census of Population, Summary Files 4A, Table DP-2.
Profile of Miami-Dade County’s Black Population Thomas D. Boswell, Ph.D.
Office of Black Affairs Miami-Dade County Office of Community Advocacy-33-
Black Income and Poverty
Both income and poverty levels are two of the most frequently used barometers of the well-being of a population. These are shown in Tables 8 and 9, respectively, for Blacks, Hispanics,Non-Hispanic Whites in Miami, and for the total population of the United States. By virtually allmeasures of income and poverty, Blacks are more disadvantaged than the Miami-Dade County’sHispanics and NHWs. Blacks have a higher percentage of their households in the low incomecategories and a lower percentage in the higher income classes. Black median household incomeis more than $21,000 less than that of NHWs and more than $5,000 less than for Hispanics. Theirper capita income is more $19,000 less than for NHWs and $4,000 less than for Hispanics inMetropolitan Miami and more than $9,000 less than the national average for all persons living inthe United States.
Blacks have a lower percentage of their households with Social Security Income and withother retirement income (Table 8) when compared to Non-Hispanic Whites, only because theyhave a smaller percentage of their population being elderly, as mentioned earlier in this chapter. On the other hand, a higher percentage of Black households receive Supplemental Security Incomeand Public Assistance income than NHWs, since both these programs are administered accordingto need and not age.
Their poverty levels also demonstrate how disadvantaged Blacks are in MetropolitanMiami (Table 9). One-fourth of Miami-Dade County’s Black households have incomes that arebelow the poverty level, far higher than the comparable figures for Hispanics (14 percent) andNHWs (5 percent) in the County and higher also than the national average (9 percent). About 28percent of all Black persons live in poverty. The comparable figures for Hispanic and NHWpersons are 18 percent and nine percent, respectively. Female headed families are most likely to bepoor and this is certainly the case with Black families that are headed by women, where almost 40percent are below the poverty level in Greater Miami.
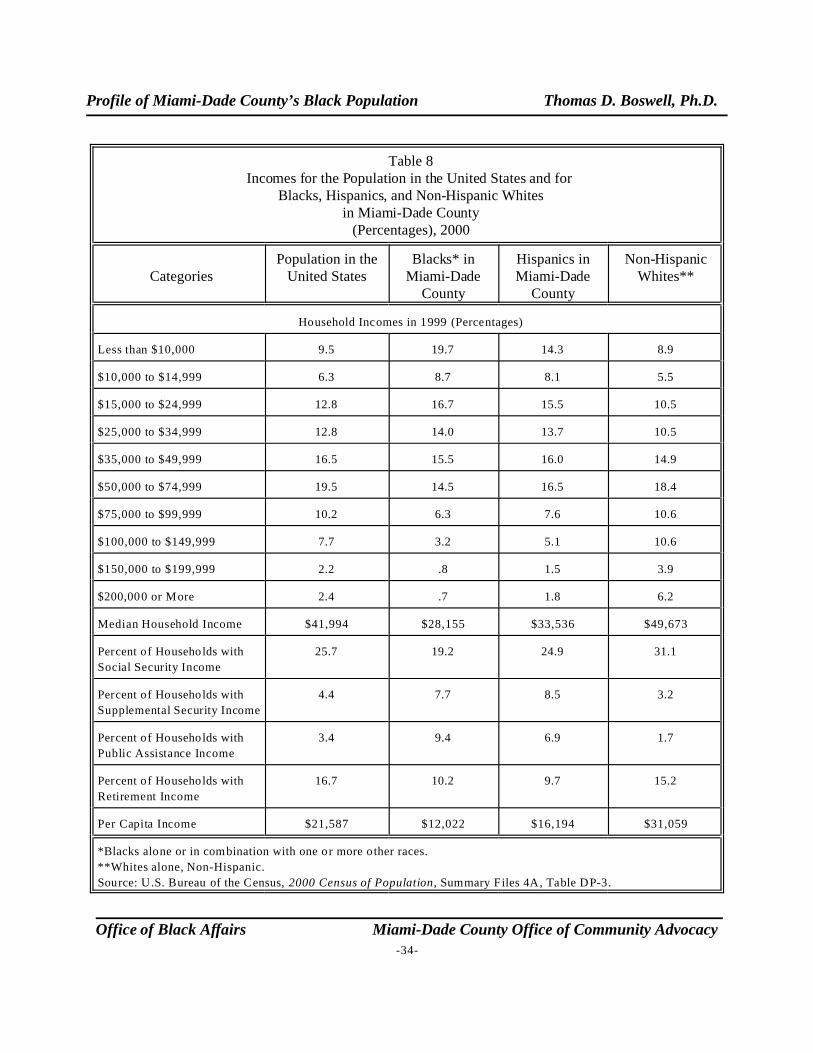
Profile of Miami-Dade County’s Black Population Thomas D. Boswell, Ph.D.
Office of Black Affairs Miami-Dade County Office of Community Advocacy-34-
Table 8Incomes for the Population in the United States and for
Blacks, Hispanics, and Non-Hispanic Whitesin Miami-Dade County
(Percentages), 2000
CategoriesPopulation in the
United StatesBlacks* in
Miami-DadeCounty
Hispanics inMiami-Dade
County
Non-HispanicWhites**
Household Incomes in 1999 (Percentages)
Less than $10,000 9.5 19.7 14.3 8.9
$10,000 to $14,999 6.3 8.7 8.1 5.5
$15,000 to $24,999 12.8 16.7 15.5 10.5
$25,000 to $34,999 12.8 14.0 13.7 10.5
$35,000 to $49,999 16.5 15.5 16.0 14.9
$50,000 to $74,999 19.5 14.5 16.5 18.4
$75,000 to $99,999 10.2 6.3 7.6 10.6
$100,000 to $149,999 7.7 3.2 5.1 10.6
$150,000 to $199,999 2.2 .8 1.5 3.9
$200,000 or More 2.4 .7 1.8 6.2
Median Household Income $41,994 $28,155 $33,536 $49,673
Percent of Households with
Social Security Income
25.7 19.2 24.9 31.1
Percent of Households with
Supplemental Security Income
4.4 7.7 8.5 3.2
Percent of Households with
Public Assistance Income
3.4 9.4 6.9 1.7
Percent of Households with
Retirement Income
16.7 10.2 9.7 15.2
Per Capita Income $21,587 $12,022 $16,194 $31,059
*Blacks alone or in combination with one or more o ther races.
**Whites alone, Non-Hispanic.
Source: U.S. Bureau of the Census, 2000 Census of Population, Summary Files 4A, Table DP-3.
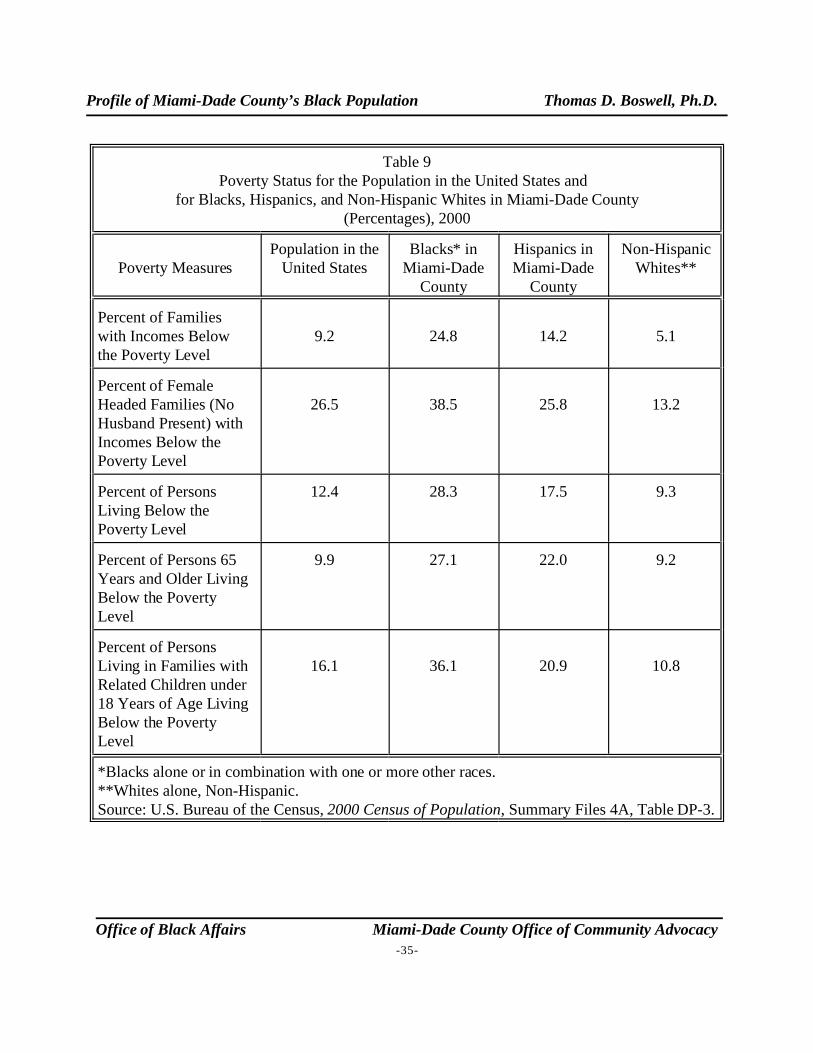
Profile of Miami-Dade County’s Black Population Thomas D. Boswell, Ph.D.
Office of Black Affairs Miami-Dade County Office of Community Advocacy-35-
Table 9Poverty Status for the Population in the United States and
for Blacks, Hispanics, and Non-Hispanic Whites in Miami-Dade County(Percentages), 2000
Poverty MeasuresPopulation in the
United StatesBlacks* in
Miami-DadeCounty
Hispanics inMiami-Dade
County
Non-HispanicWhites**
Percent of Familieswith Incomes Belowthe Poverty Level
9.2 24.8 14.2 5.1
Percent of FemaleHeaded Families (NoHusband Present) withIncomes Below thePoverty Level
26.5 38.5 25.8 13.2
Percent of PersonsLiving Below thePoverty Level
12.4 28.3 17.5 9.3
Percent of Persons 65Years and Older LivingBelow the PovertyLevel
9.9 27.1 22.0 9.2
Percent of PersonsLiving in Families withRelated Children under18 Years of Age LivingBelow the PovertyLevel
16.1 36.1 20.9 10.8
*Blacks alone or in combination with one or more other races.**Whites alone, Non-Hispanic.Source: U.S. Bureau of the Census, 2000 Census of Population, Summary Files 4A, Table DP-3.
Profile of Miami-Dade County’s Black Population Thomas D. Boswell, Ph.D.
15These are all Whites (including Hispanics), not just Non-Hispanic W hites.
16U.S. Bureau of the Census, Statistical Abstract of the United States: 2006, U.S. Government Printing
Office, Washington, D.C., 2006, Table 73, p. 64.
Office of Black Affairs Miami-Dade County Office of Community Advocacy-36-
Marital Status of Blacks
The data in Table 10 show the marital status for persons 15 years and older. This age cut-off is used because few people under the age of 15 years are or have been in marital unions. A farhigher percentage of Blacks have never been married or are not now married when compared toHispanics, Non-Hispanic Whites, and the total population of the United States. This may reflectthe higher poverty levels of Blacks, just discussed, which makes it more difficult for many of themto support a family. So a larger percentage of them never marry in the first place. This is probablyone of the reasons that Blacks have a slightly lower divorce rate and a slightly lower widowed ratethan either Hispanics or NHWs living in metropolitan Miami. Because a smaller percentage ofthem are married, relatively more of them cannot get divorced or become widowed. The lowerdivorce rate for Blacks should not be used as evidence that they live in more stable male-femaleunions because the separation rate for Blacks is somewhat higher than it is for Hispanics andNHWs.
If a lower percentage of Blacks are or have been married, then why is it that they havehigher fertility rates than the rest of the population? It is because Blacks have such a high birth rateto out-of-wedlock mothers. In 2002, more than two-thirds (68 percent) of the babies born toBlacks living in the United States were born to women who were not married at the time they gavebirth. The comparable figures for Hispanics and Whites15 were 44 percent and 28, respectively.16
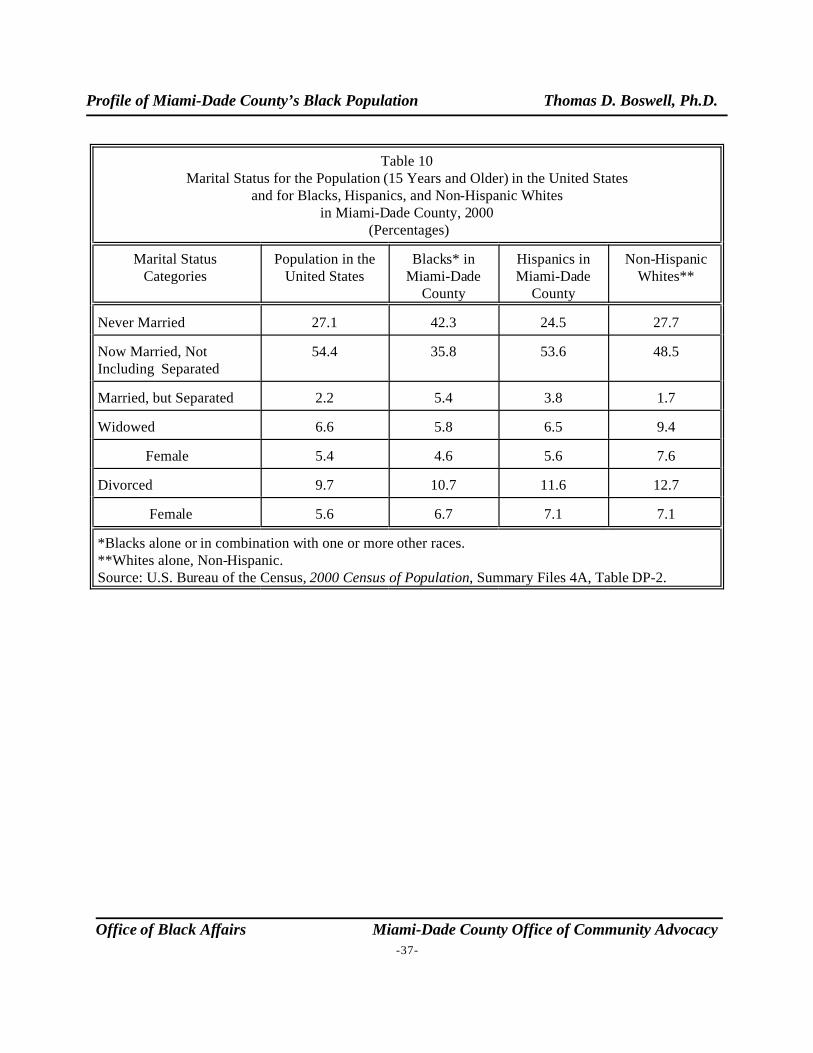
Profile of Miami-Dade County’s Black Population Thomas D. Boswell, Ph.D.
Office of Black Affairs Miami-Dade County Office of Community Advocacy-37-
Table 10Marital Status for the Population (15 Years and Older) in the United States
and for Blacks, Hispanics, and Non-Hispanic Whitesin Miami-Dade County, 2000
(Percentages)
Marital StatusCategories
Population in theUnited States
Blacks* inMiami-Dade
County
Hispanics inMiami-Dade
County
Non-HispanicWhites**
Never Married 27.1 42.3 24.5 27.7
Now Married, NotIncluding Separated
54.4 35.8 53.6 48.5
Married, but Separated 2.2 5.4 3.8 1.7
Widowed 6.6 5.8 6.5 9.4
Female 5.4 4.6 5.6 7.6
Divorced 9.7 10.7 11.6 12.7
Female 5.6 6.7 7.1 7.1
*Blacks alone or in combination with one or more other races.**Whites alone, Non-Hispanic.Source: U.S. Bureau of the Census, 2000 Census of Population, Summary Files 4A, Table DP-2.
Profile of Miami-Dade County’s Black Population Thomas D. Boswell, Ph.D.
Office of Black Affairs Miami-Dade County Office of Community Advocacy-38-
Miscellaneous Social Characteristics of Blacks
Six miscellaneous characteristics of Blacks, Hispanics, and Non-Hispanic Whites living inMiami-Dade County are shown in Table 11. Most of these figures are self-explanatory, but severalare especially interesting and warrant comment. For example, Blacks have by far the highestpercentage of grand parents who are primarily responsible for taking care of their grand children(48 percent) when they are living in households containing grandchildren.
It is often said that the American military is today primarily made-up of minorities. Thefigures in Table 11 do not indicate evidence for this for metropolitan Miami. For instance, a lowerpercentage of Blacks who are over 18 years of age in the County have served in the military forces(6 percent) when compared to Non-Hispanic Whites (13 percent). However, a higher percentage ofBlacks have served in the armed forces than have Hispanics (about 3 percent). This is becausemany of Miami’s Hispanics arrived in Miami after they were too old to serve in the U.S. military. It should also be noted that almost one-third of the Blacks living in Miami-Dade County are alsoimmigrants, a figure much higher than for Blacks living in the United States (about six percent),and this might partially account for their somewhat lower participation in the military forces thanthe national average shown in Table 11. The immigrant component of Miami’s Black populationwill be discussed in greater detail later in this report.
Blacks have higher percentages of persons in the civilian work force with disabilities acrossall age groups, when compared to Hispanics and especially NHWs in Greater Miami. This isbecause a larger proportion of the Blacks are employed in the so-called “3-D jobs.” These are thejobs that are dirty, dangerous, and physically demanding. More will be said about this in the nextchapter of this report that deals with employment and labor force characteristics.
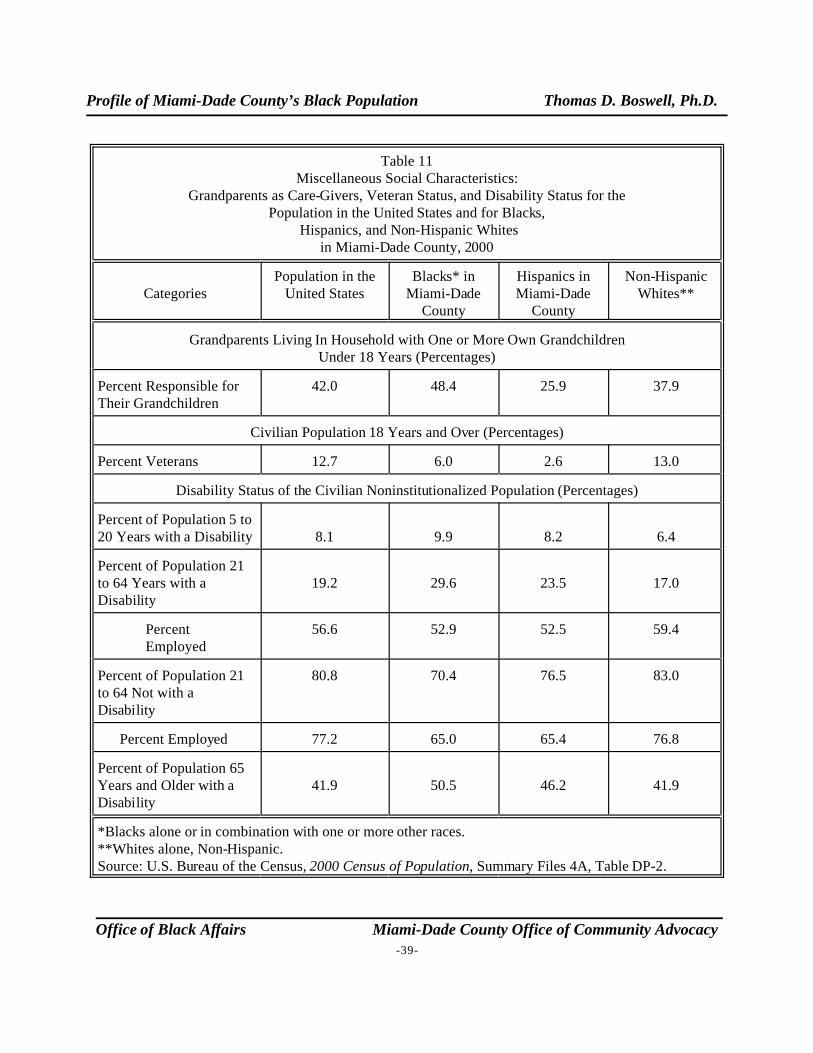
Profile of Miami-Dade County’s Black Population Thomas D. Boswell, Ph.D.
Office of Black Affairs Miami-Dade County Office of Community Advocacy-39-
Table 11Miscellaneous Social Characteristics:
Grandparents as Care-Givers, Veteran Status, and Disability Status for thePopulation in the United States and for Blacks,
Hispanics, and Non-Hispanic Whitesin Miami-Dade County, 2000
CategoriesPopulation in the
United StatesBlacks* in
Miami-DadeCounty
Hispanics inMiami-Dade
County
Non-HispanicWhites**
Grandparents Living In Household with One or More Own GrandchildrenUnder 18 Years (Percentages)
Percent Responsible forTheir Grandchildren
42.0 48.4 25.9 37.9
Civilian Population 18 Years and Over (Percentages)
Percent Veterans 12.7 6.0 2.6 13.0
Disability Status of the Civilian Noninstitutionalized Population (Percentages)
Percent of Population 5 to20 Years with a Disability 8.1 9.9 8.2 6.4
Percent of Population 21to 64 Years with aDisability
19.2 29.6 23.5 17.0
PercentEmployed
56.6 52.9 52.5 59.4
Percent of Population 21to 64 Not with aDisability
80.8 70.4 76.5 83.0
Percent Employed 77.2 65.0 65.4 76.8
Percent of Population 65Years and Older with aDisability
41.9 50.5 46.2 41.9
*Blacks alone or in combination with one or more other races.**Whites alone, Non-Hispanic.Source: U.S. Bureau of the Census, 2000 Census of Population, Summary Files 4A, Table DP-2.
Profile of Miami-Dade County’s Black Population Thomas D. Boswell, Ph.D.
17U.S. Bureau of the Census, Public Use Microdata Sample, 2000 Census of Population and Housing,
Technical Documentation, May, 2003, p. B-10.
Office of Black Affairs Miami-Dade County Office of Community Advocacy-40-
CHAPTER 4
Employment Characteristics of Blacksin Miami-Dade County
In this chapter, the labor force characteristics of Blacks are compared to those of Hispanicsand Non-Hispanic Whites living in Miami-Dade County and to the total population of the UnitedStates. More specifically, it investigates Blacks in terms of: (1) their employment status, (2) theoccupations they have, (3) the industries in which they work, (4) for whom they work, and (5) howthey commute to work and the time it takes them to get to there.
Employment Status of Blacks
Labor force participation rates are shown for the total population and for women in Miami-Dade County in Table 12. People are considered by the U.S. Bureau of the Census to be in thelabor force if they either have a job or are looking for one at the time of enumeration. If they donot have a job and are not looking for work, they are considered not to be in the labor force, andthey are not considered to be unemployed. The unemployed include only persons who are lookingfor work, but do not have a job. The civilian labor force excludes persons who are institutionalized or in the armed forces.17
The labor force participation rate (percent in the labor force) for the Black population inMiami-Dade is slightly higher than for Hispanics, but also slightly lower than for Non-HispanicWhites (Table 12). However, it should be noted that these differences are so small that they are notvery important. On the other hand, the unemployment rates for Blacks certainly are significantlyhigher than for either Hispanics or NHWs and they are also higher when compared for the UnitedStates population. Unemployment rates in Table 12 are measured two ways, as a percent of thetotal population 16 years of age and older and as a percentage of the civilian labor force. Eitherway, it is clear that Blacks have unemployment rates that are more than twice that of NHWs andmore than 60 percent higher than experienced by Hispanics in metropolitan Miami.
As was the case when considering the percentage of Blacks who were veterans of the armedforces in Chapter 3 of this report, the figures in Table 12 show that a relatively small percentage ofBlacks in Miami were participating in the armed forces in 2000 when the last census was taken. The veteran figures in Chapter 3 reflected historical participation in the military, whereas the
Profile of Miami-Dade County’s Black Population Thomas D. Boswell, Ph.D.
Office of Black Affairs Miami-Dade County Office of Community Advocacy-41-
figures in Table 12 represent the current situation as of 2000. It is relevant to note that they areboth consistent in showing a lower participation rate in the armed services for Blacks.
Adult Black women have a somewhat higher labor force participation rate than eitherHispanic or NHW women. Black women are more motivated to work by their poorer economicconditions and by the fact that more of them are heads of families without a husband present. Yetthey face the same situation as Black men with respect to higher unemployment rates, whencompared to Hispanic and NHW women. The civilian unemployment rate for Black women (14percent) in 2000 in Metropolitan Miami was almost three times higher than for NHW women (fivepercent) and 35 percent higher than for Hispanic women (10 percent).
The last row in Table 12 shows the percent of all parents with children under the age of sixyears who (the parents) are in the labor force. This is a designation established by the U.S. CensusBureau because of the importance of parental guidance for their children during the first five yearsof their lives. People who have higher incomes are better able to afford to have a single familywage earner, so one of the parents can stay home and supervise the early up-bring of their children. The data in this row show that Blacks are once again disadvantaged by this criterion, as well as byvirtually all other criteria in Miami-Dade County. Because they are generally poorer, a higherpercentage of Black women with young children find it necessary to work, rather than to stay homeand personally care for their children.
Occupational Characteristics of Blacks
Earlier, in Chapter 3 of this report, it was mentioned that Blacks are more likely to beemployed in the so-called “3-D jobs” (including those that are demanding, dangerous, and/ordirty). To some extent, the data in Table 13 verify this thought for metropolitan Miami, at leastwhen compared to the occupations of Non-Hispanic Whites. We say “to some extent” becauseBlacks have made significant progress toward joining the ranks of the middle class in SouthFlorida. In addition to being over-represented (when compared to Non-Hispanic Whites) in the“construction, extraction and maintenance occupations” and in the “production, transportation, andmaterial moving occupations,” many of which fall into the class of 3-D jobs, they are most over-represented in the “service occupations.” The service category is particularly important becausesome of its jobs are good ones with substantial salaries and benefits in the government sector. Blacks have been able to take advantage of the nation’s Affirmative Action and Equal OpportunityEmployment programs the most in this sector. However, it is important to note that the servicesector also includes many low-paying unskilled jobs as well, such as clerks and workers inconvenience stores and fast food restaurants and janitors of offices and buildings. Clearly, thefigures in Table 13 illustrate that Blacks, as a whole, are still disadvantaged occupationally whencompared to NHWs in Miami.
Profile of Miami-Dade County’s Black Population Thomas D. Boswell, Ph.D.
18Profile of the Black Population 1995, Department of Community Affairs, Office of Black Affairs,
Research Division of the Metropolitan Dade County Planing Department, December, 1995, p. 69. In 1990, what we
are calling “the production, transportation, and material moving occupations” in this report were collectively called
the “operators, fabricators, and laborers occupations.” These two categories are roughly similar in terms of the types
of jobs they employ.
Office of Black Affairs Miami-Dade County Office of Community Advocacy-42-
It is equally important, however, to note that again there are signs of job improvementamong Blacks in Miami-Dade County. In 1990, almost 20 percent of Miami’s Blacks wereemployed in high-paying “management, professional, and related occupations.” By 2000 thisshare had increased to about 23 percent. Conversely, the percentage working in 3-D jobs,represented by “production, transportation, and material moving occupations” declined from 17.1percent in 1990 to 13.7 percent in 2000.18 So, progress is being made, even though Blacks still lagsubstantially behind Non-Hispanic Whites in terms of the types of work they perform.
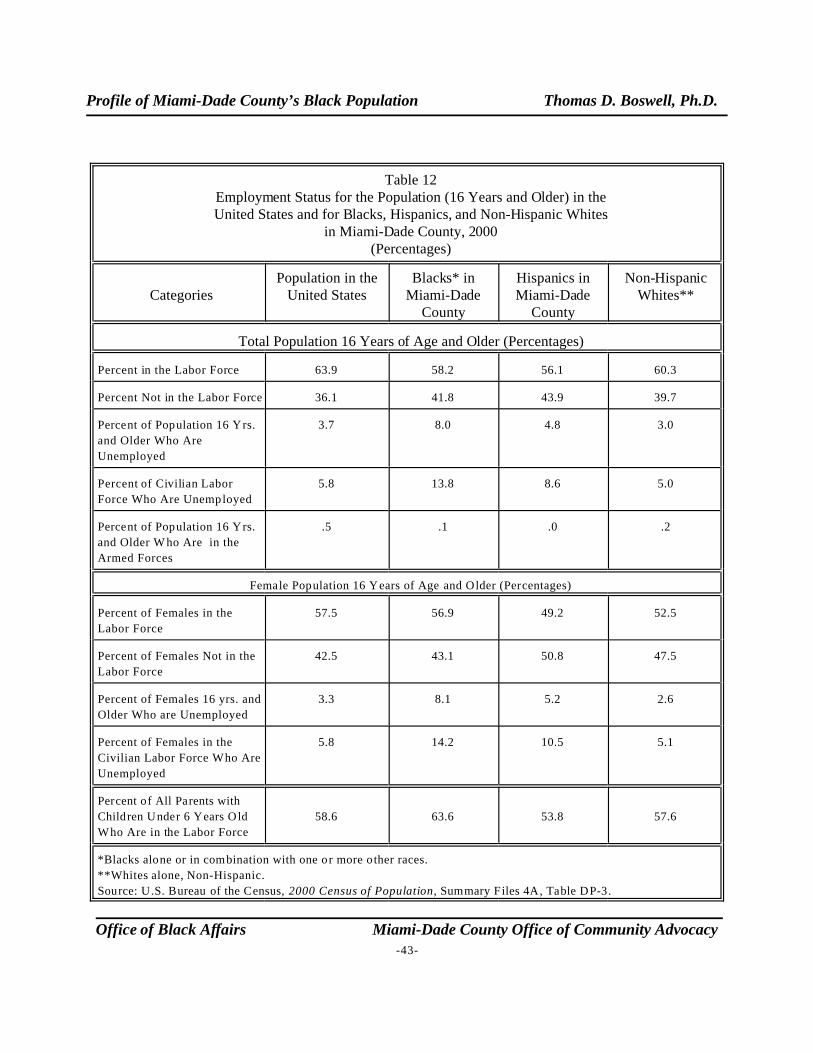
Profile of Miami-Dade County’s Black Population Thomas D. Boswell, Ph.D.
Office of Black Affairs Miami-Dade County Office of Community Advocacy-43-
Table 12Employment Status for the Population (16 Years and Older) in theUnited States and for Blacks, Hispanics, and Non-Hispanic Whites
in Miami-Dade County, 2000(Percentages)
CategoriesPopulation in the
United StatesBlacks* in
Miami-DadeCounty
Hispanics inMiami-Dade
County
Non-HispanicWhites**
Total Population 16 Years of Age and Older (Percentages)
Percent in the Labor Force 63.9 58.2 56.1 60.3
Percent Not in the Labor Force 36.1 41.8 43.9 39.7
Percent of Population 16 Yrs.
and Older Who Are
Unemployed
3.7 8.0 4.8 3.0
Percent of Civilian Labor
Force Who Are Unemployed
5.8 13.8 8.6 5.0
Percent of Population 16 Yrs.
and Older W ho Are in the
Armed Forces
.5 .1 .0 .2
Female Population 16 Years of Age and Older (Percentages)
Percent of Females in the
Labor Force
57.5 56.9 49.2 52.5
Percent of Females Not in the
Labor Force
42.5 43.1 50.8 47.5
Percent of Females 16 yrs. and
Older Who are Unemployed
3.3 8.1 5.2 2.6
Percent of Females in the
Civilian Labor Force Who Are
Unemployed
5.8 14.2 10.5 5.1
Percent of All Parents with
Children Under 6 Years Old
Who Are in the Labor Force
58.6 63.6 53.8 57.6
*Blacks alone or in combination with one or more o ther races.
**Whites alone, Non-Hispanic.
Source: U.S. Bureau of the Census, 2000 Census of Population, Summary Files 4A, Table DP-3.
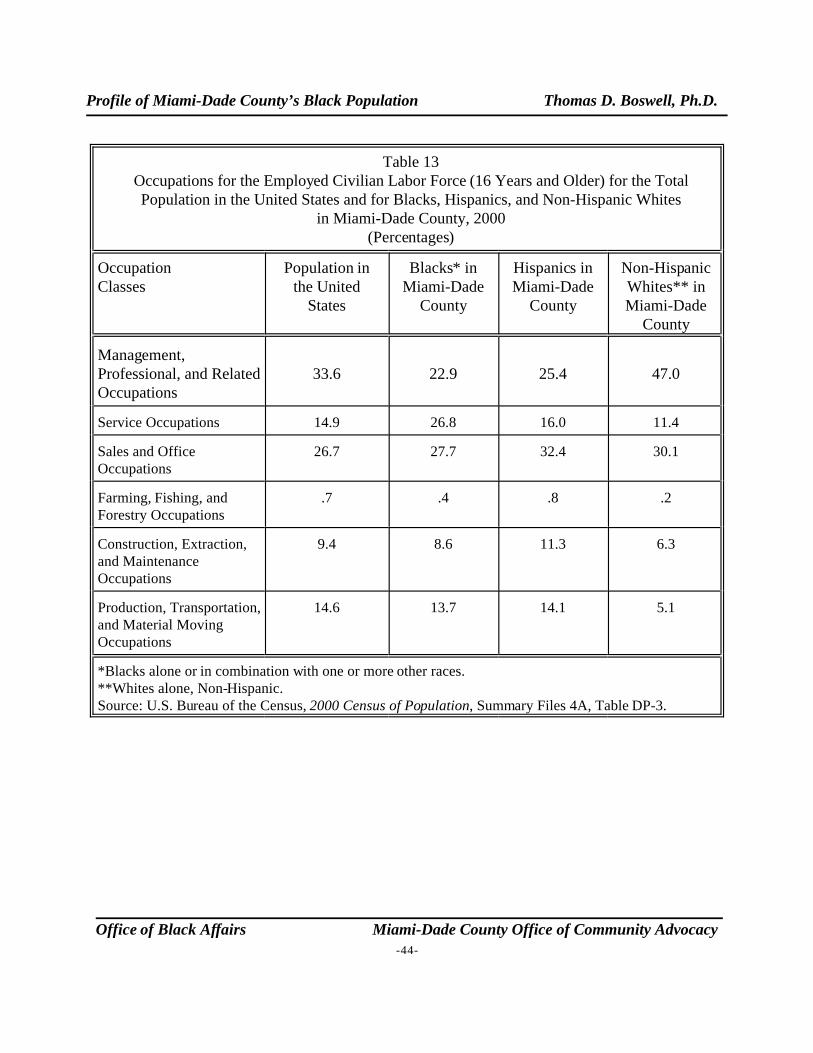
Profile of Miami-Dade County’s Black Population Thomas D. Boswell, Ph.D.
Office of Black Affairs Miami-Dade County Office of Community Advocacy-44-
Table 13Occupations for the Employed Civilian Labor Force (16 Years and Older) for the TotalPopulation in the United States and for Blacks, Hispanics, and Non-Hispanic Whites
in Miami-Dade County, 2000(Percentages)
OccupationClasses
Population inthe United
States
Blacks* inMiami-Dade
County
Hispanics inMiami-Dade
County
Non-HispanicWhites** inMiami-Dade
County
Management,Professional, and RelatedOccupations
33.6 22.9 25.4 47.0
Service Occupations 14.9 26.8 16.0 11.4
Sales and OfficeOccupations
26.7 27.7 32.4 30.1
Farming, Fishing, andForestry Occupations
.7 .4 .8 .2
Construction, Extraction,and MaintenanceOccupations
9.4 8.6 11.3 6.3
Production, Transportation,and Material MovingOccupations
14.6 13.7 14.1 5.1
*Blacks alone or in combination with one or more other races.**Whites alone, Non-Hispanic.Source: U.S. Bureau of the Census, 2000 Census of Population, Summary Files 4A, Table DP-3.
Profile of Miami-Dade County’s Black Population Thomas D. Boswell, Ph.D.
Office of Black Affairs Miami-Dade County Office of Community Advocacy-45-
Industries in Which Blacks Are Employed
The industry in which an individual is employed is different from his/her occupation. Theoccupation is the type of work a person does; while the industry is the type of business for whichhe/she works.
When compared to Non-Hispanic Whites, a lower percentage of Blacks are employed in thehigh paying so-called “FIRE” (“finance, insurance, and real estate and leasing”) industries, and inthe “professional, scientific, management, administrative, and waste management servicebusinesses” (Table 14). On the other hand, a larger percentage of Blacks work in the well-paying“educational, health, and social services” and in “public administration,” both of which have astrong government sponsored component. So, blacks are under-represented in some desirable jobsand over-represented in others. However, the net effect is for Blacks to be employed more in theless desirable businesses, when compared to Non-Hispanic Whites.
When compared to the United States labor force, Blacks in Miami are much less likely towork in manufacturing industries, but this is also true for Hispanics and NHWs. This is areflection of the employment structure of South Florida, where manufacturing activities are at alower level than in many other large American metropolitan areas.
For Whom Blacks Work
The phrase “class of worker” refers to who people work for. Blacks in Miami-DadeCounty are most likely to work for private companies as wage and salaried workers (Table 15). This is also true for the other ethnic groups working in Miami. Where Blacks differ most fromHispanics and NHWs is that a much larger share of the Blacks work as government workers, assuggested earlier in this chapter. Again, this is related to the efforts of local and nationalgovernments to diversify their work forces through Affirmative Action and Equal Opportunityprograms and to the improvements achieved by Blacks through their own efforts. In a sense,government jobs have become a niche of sorts for Miami’s Blacks, and this is true for Blacksliving in the rest of the United States as well. On the other hand, Blacks are particularly under-represented as self-employed workers when compared to Hispanics and NHWs.
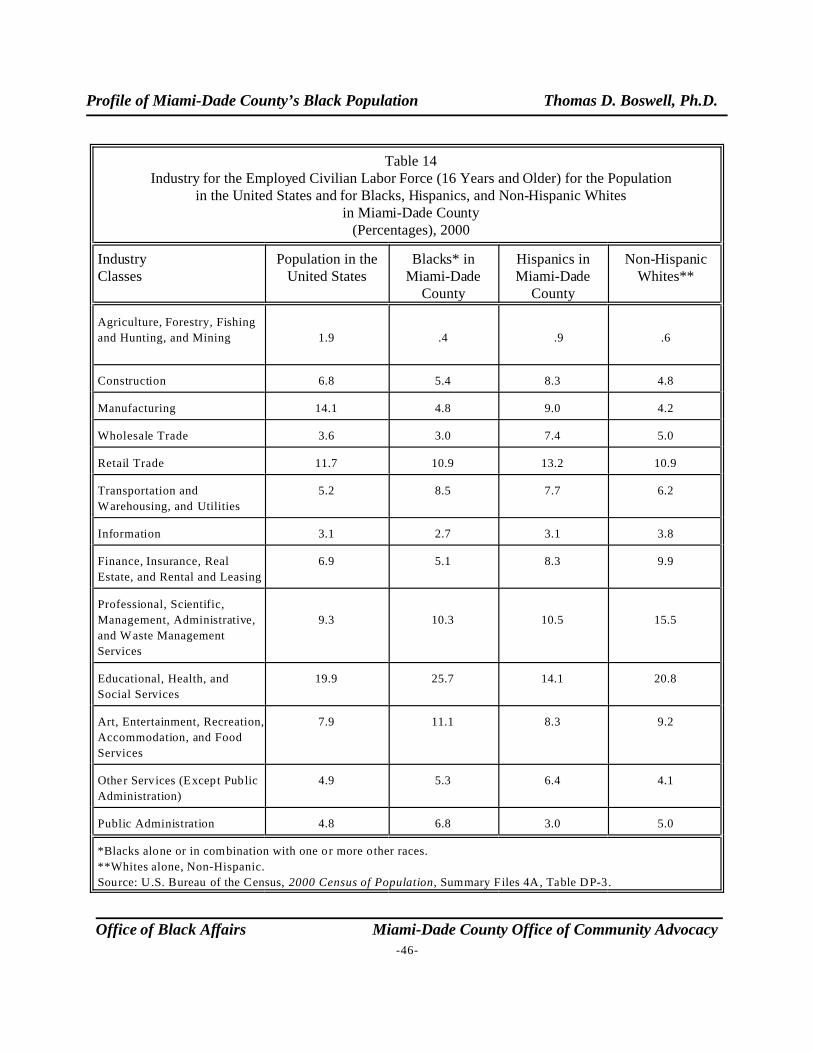
Profile of Miami-Dade County’s Black Population Thomas D. Boswell, Ph.D.
Office of Black Affairs Miami-Dade County Office of Community Advocacy-46-
Table 14Industry for the Employed Civilian Labor Force (16 Years and Older) for the Population
in the United States and for Blacks, Hispanics, and Non-Hispanic Whitesin Miami-Dade County
(Percentages), 2000
IndustryClasses
Population in theUnited States
Blacks* inMiami-Dade
County
Hispanics inMiami-Dade
County
Non-HispanicWhites**
Agriculture, Forestry, Fishing
and Hunting, and Mining 1.9 .4 .9 .6
Construction 6.8 5.4 8.3 4.8
Manufacturing 14.1 4.8 9.0 4.2
Wholesale Trade 3.6 3.0 7.4 5.0
Retail Trade 11.7 10.9 13.2 10.9
Transportation and
Warehousing, and Utilities
5.2 8.5 7.7 6.2
Information 3.1 2.7 3.1 3.8
Finance, Insurance, Real
Estate, and Rental and Leasing
6.9 5.1 8.3 9.9
Professional, Scientific,
Management, Administrative,
and Waste Management
Services
9.3 10.3 10.5 15.5
Educational, Health, and
Social Services
19.9 25.7 14.1 20.8
Art, Entertainment, Recreation,
Accommodation, and Food
Services
7.9 11.1 8.3 9.2
Other Services (Except Public
Administration)
4.9 5.3 6.4 4.1
Public Administration 4.8 6.8 3.0 5.0
*Blacks alone or in combination with one or more o ther races.
**Whites alone, Non-Hispanic.
Source: U.S. Bureau of the Census, 2000 Census of Population, Summary Files 4A, Table DP-3.
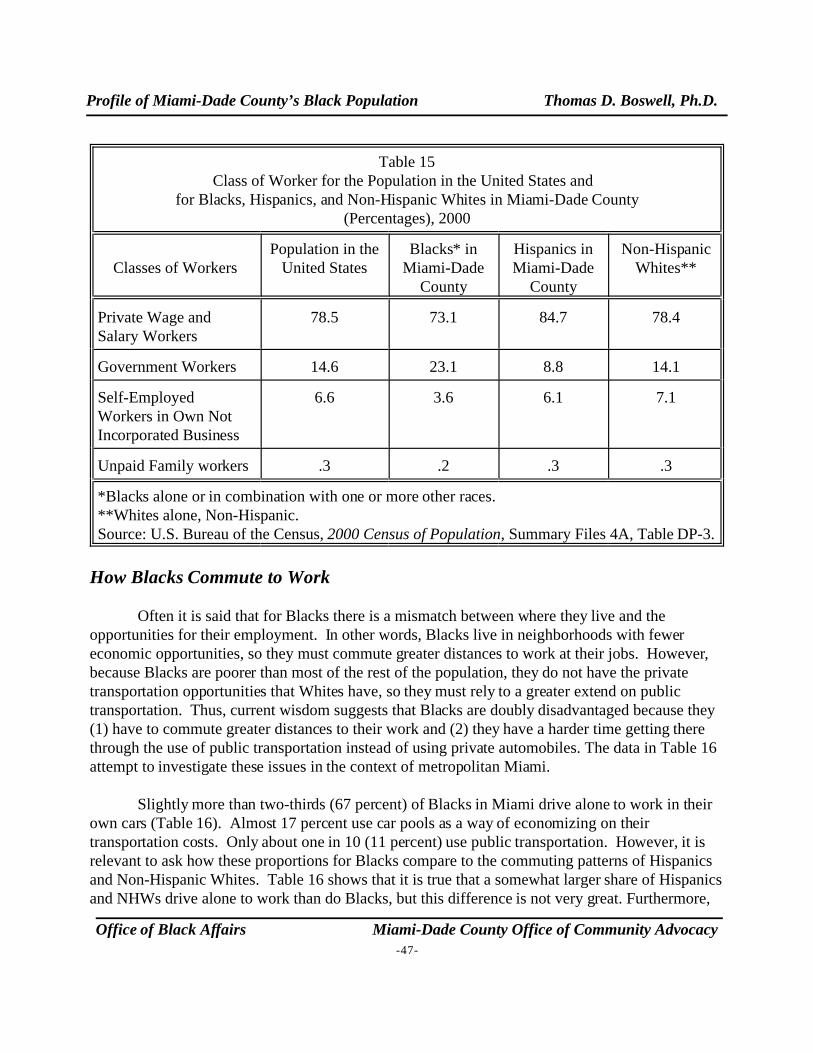
Profile of Miami-Dade County’s Black Population Thomas D. Boswell, Ph.D.
Office of Black Affairs Miami-Dade County Office of Community Advocacy-47-
Table 15Class of Worker for the Population in the United States and
for Blacks, Hispanics, and Non-Hispanic Whites in Miami-Dade County(Percentages), 2000
Classes of WorkersPopulation in the
United StatesBlacks* in
Miami-DadeCounty
Hispanics inMiami-Dade
County
Non-HispanicWhites**
Private Wage andSalary Workers
78.5 73.1 84.7 78.4
Government Workers 14.6 23.1 8.8 14.1
Self-EmployedWorkers in Own NotIncorporated Business
6.6 3.6 6.1 7.1
Unpaid Family workers .3 .2 .3 .3
*Blacks alone or in combination with one or more other races.**Whites alone, Non-Hispanic.Source: U.S. Bureau of the Census, 2000 Census of Population, Summary Files 4A, Table DP-3.
How Blacks Commute to Work
Often it is said that for Blacks there is a mismatch between where they live and theopportunities for their employment. In other words, Blacks live in neighborhoods with fewereconomic opportunities, so they must commute greater distances to work at their jobs. However,because Blacks are poorer than most of the rest of the population, they do not have the private transportation opportunities that Whites have, so they must rely to a greater extend on publictransportation. Thus, current wisdom suggests that Blacks are doubly disadvantaged because they(1) have to commute greater distances to their work and (2) they have a harder time getting therethrough the use of public transportation instead of using private automobiles. The data in Table 16attempt to investigate these issues in the context of metropolitan Miami.
Slightly more than two-thirds (67 percent) of Blacks in Miami drive alone to work in theirown cars (Table 16). Almost 17 percent use car pools as a way of economizing on theirtransportation costs. Only about one in 10 (11 percent) use public transportation. However, it isrelevant to ask how these proportions for Blacks compare to the commuting patterns of Hispanicsand Non-Hispanic Whites. Table 16 shows that it is true that a somewhat larger share of Hispanicsand NHWs drive alone to work than do Blacks, but this difference is not very great. Furthermore,
Profile of Miami-Dade County’s Black Population Thomas D. Boswell, Ph.D.
Office of Black Affairs Miami-Dade County Office of Community Advocacy-48-
Blacks and Hispanics are almost equally likely to use car pooling as a means of getting to work,although NHWs are less likely to use this mode of transportation. Also, it is correct to say thatBlacks do use public transportation more often than Hispanics and NHWs, but it is important tonote that almost 90 percent of Blacks do not use public transportation. So, yes there is a slightlyhigher tendency for Blacks to use public transportation and to car pool to get to jobs whencompared to Hispanics and NHWs, but it is also true that most Blacks drive to their jobs, just liketheir Hispanic and NHW neighbors in Miami.
Blacks averaged a 32 minute commute to their jobs in 2000 (Table 16). However, this wasonly about two minutes longer than the mean commute time for Hispanics and only about 4minutes longer than the average for Non-Hispanic Whites. These differences are probably not veryimportant, even though it is technically correct to say that Blacks do take a little more time onaverage to get to their jobs.
Ths evidence presented in Table 16 does not seem to support the notion that there is a verysignificant difference in the commuting patterns between Blacks and the rest of the workingpopulation in metropolitan Miami, although there is a slight tendency for Blacks to more often usecar pools and public transportation to get to work. It is important to remember that most Blacks(two-thirds) drive to work in private cars just like the rest of the Miami-Dade County’s workforce. There may be a mismatch between where Blacks live and where they work, but it is not muchdifferent from what it is for Hispanics and Non-Hispanic Whites living in Miami. The averageMiami worker travels about half an hour to get to his/her place of employment regardless of his/herrace or ethnicity.
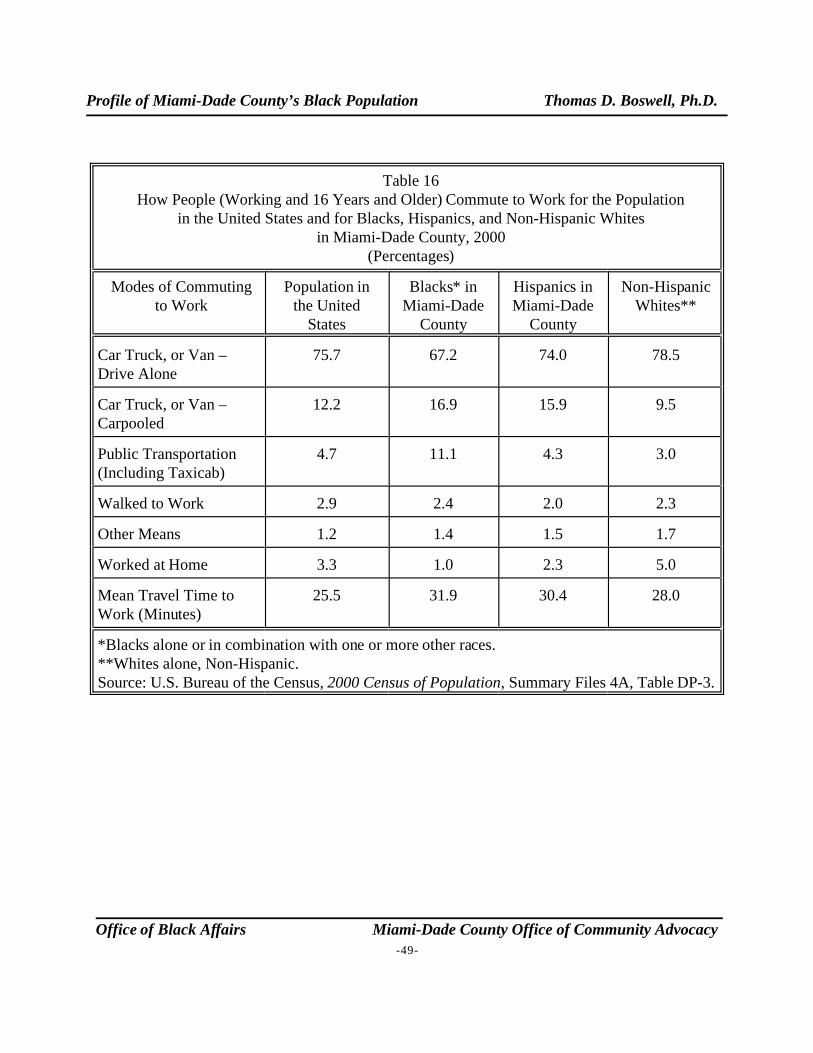
Profile of Miami-Dade County’s Black Population Thomas D. Boswell, Ph.D.
Office of Black Affairs Miami-Dade County Office of Community Advocacy-49-
Table 16How People (Working and 16 Years and Older) Commute to Work for the Population
in the United States and for Blacks, Hispanics, and Non-Hispanic Whitesin Miami-Dade County, 2000
(Percentages)
Modes of Commutingto Work
Population inthe United
States
Blacks* inMiami-Dade
County
Hispanics inMiami-Dade
County
Non-HispanicWhites**
Car Truck, or Van –Drive Alone
75.7 67.2 74.0 78.5
Car Truck, or Van –Carpooled
12.2 16.9 15.9 9.5
Public Transportation(Including Taxicab)
4.7 11.1 4.3 3.0
Walked to Work 2.9 2.4 2.0 2.3
Other Means 1.2 1.4 1.5 1.7
Worked at Home 3.3 1.0 2.3 5.0
Mean Travel Time toWork (Minutes)
25.5 31.9 30.4 28.0
*Blacks alone or in combination with one or more other races.**Whites alone, Non-Hispanic.Source: U.S. Bureau of the Census, 2000 Census of Population, Summary Files 4A, Table DP-3.
Profile of Miami-Dade County’s Black Population Thomas D. Boswell, Ph.D.
19A person’s activity space is the area in which most of a person’s movement behavior takes place during
his/her normal week. So, where a person usually goes for entertainment, shops for groceries or c lothes, goes to
work, travels to school, goes to the dentist, or journeys to visit friends are all included within that individual’s action
space.
Office of Black Affairs Miami-Dade County Office of Community Advocacy-50-
CHAPTER 5
The Mobility and Migration of Blacks in Miami-Dade County
The terms “mobility” and “migration” are both used by the U.S. Bureau of the Census torefer to people who have changed residences. However, “mobility” is more inclusive because itrefers to anybody who has moved from one residence to another, whereas migration includes onlypeople who have changed residences and crossed at least a county boundary in the process. So, aperson who moves from one county in Florida to another would be a migrant, as would a personwho moved to Miami from another state or another country. On the other hand, a person whochanged residences internally from one neighborhood to another within Miami-Dade Countywould have been mobile but would not be considered a migrant. The reason for making thisdistinction is that people who are migrants usually move greater distances than people who areresidentially mobile within the same county, and people who move greater distances usually havemore of their activity space19 altered, which in turn normally involves higher levels of adjustment. People moving within a county are likely to have only some of their activity space altered, whereasmigrants are more likely to have most or all of their activity altered.
Recent (1995-2000) Mobility and Migration of Blacks
The figures in Table 17 show that for the United States nearly half (46 percent) the U.S. population changed houses within the five-year period between 1995 and 2000. Of these persons,43 percent changed residences within the U.S. and 3 percent moved to the U.S. from a foreigncountry. Americans are among the most residentially mobile persons in the world. The averageAmerican moves 10 or 11 times in his/her lifetime. Blacks in Miami-Dade County have changedresidences at a level that is very similar to that of the total U.S. population. Forty-one percent ofthe Blacks moved from one house to another within the United States during this same five-yearperiod and almost six percent immigrated to Miami from a foreign country. These movementpatterns for Blacks are similar to those for Hispanics and Non-Hispanic Whites living in Miami,except a noticeably larger share (13 percent) of the Hispanics moved to Miami from anothercountry.
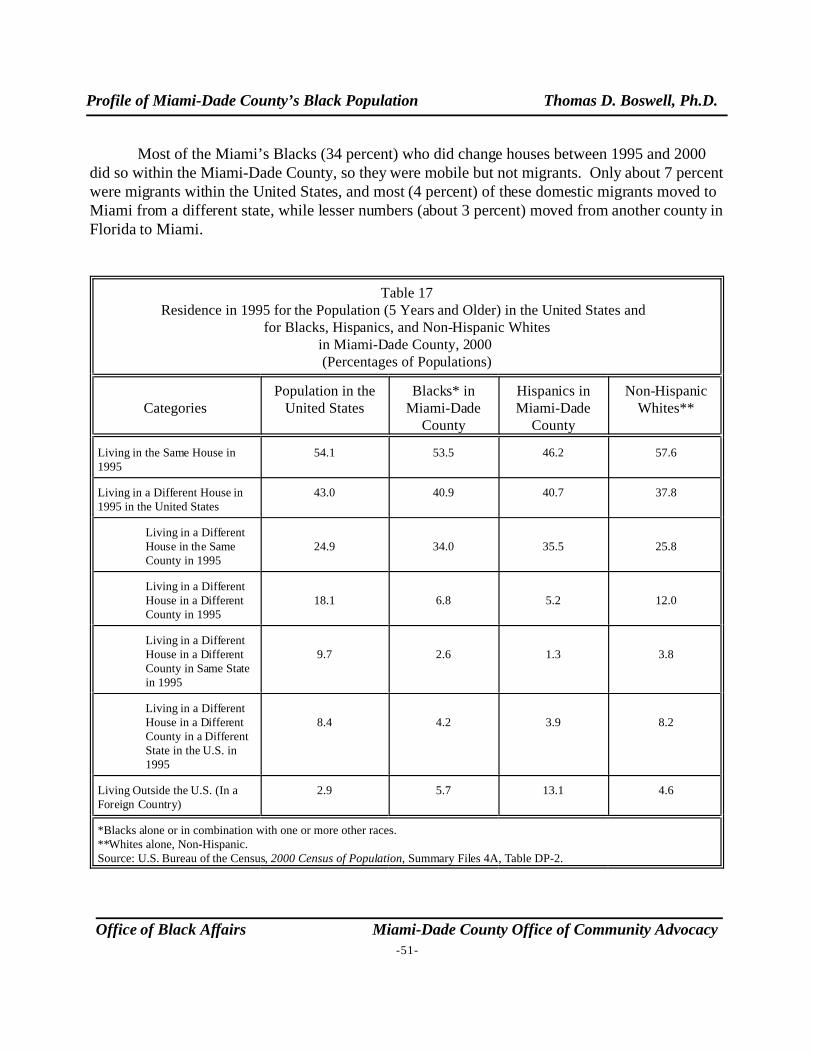
Profile of Miami-Dade County’s Black Population Thomas D. Boswell, Ph.D.
Office of Black Affairs Miami-Dade County Office of Community Advocacy-51-
Most of the Miami’s Blacks (34 percent) who did change houses between 1995 and 2000did so within the Miami-Dade County, so they were mobile but not migrants. Only about 7 percentwere migrants within the United States, and most (4 percent) of these domestic migrants moved toMiami from a different state, while lesser numbers (about 3 percent) moved from another county inFlorida to Miami.
Table 17Residence in 1995 for the Population (5 Years and Older) in the United States and
for Blacks, Hispanics, and Non-Hispanic Whitesin Miami-Dade County, 2000 (Percentages of Populations)
CategoriesPopulation in the
United StatesBlacks* in
Miami-DadeCounty
Hispanics inMiami-Dade
County
Non-HispanicWhites**
Living in the Same House in1995
54.1 53.5 46.2 57.6
Living in a Different House in1995 in the United States
43.0 40.9 40.7 37.8
Living in a DifferentHouse in the SameCounty in 1995
24.9 34.0 35.5 25.8
Living in a DifferentHouse in a DifferentCounty in 1995
18.1 6.8 5.2 12.0
Living in a DifferentHouse in a Different County in Same Statein 1995
9.7 2.6 1.3 3.8
Living in a DifferentHouse in a DifferentCounty in a DifferentState in the U.S. in1995
8.4 4.2 3.9 8.2
Living Outside the U.S. (In aForeign Country)
2.9 5.7 13.1 4.6
*Blacks alone or in combination with one or more other races.**Whites alone, Non-Hispanic.Source: U.S. Bureau of the Census, 2000 Census of Population, Summary Files 4A, Table DP-2.
Profile of Miami-Dade County’s Black Population Thomas D. Boswell, Ph.D.
Office of Black Affairs Miami-Dade County Office of Community Advocacy-52-
Place of Birth for Blacks Living in Miami-Dade County
Whereas the immediately preceding section of this chapter looked at the mobility of Blacksduring a recent five-year period, this section investigates where Miami-Dade County’s Blacksoriginally came from by studying their places of birth and their nativity. Almost 31 percent ofmetropolitan Miami’s Blacks are foreign born (Table 18). More will be said about this later in thischapter. The 69 percent of Miami’s Blacks who are natives were either born in the U.S. (68percent) or were born outside the United States to parents at least one of whom was an Americancitizen (1 percent). If one or both of their parents were a U.S. citizen at the time they were born,they automatically qualify as U.S. citizens. Also, if they were born outside the U.S. but the placein which they were born is an American possession (e.g. Puerto Rico) they qualify as a U.S.citizen at the time of their birth. Slightly more than half (52 percent) of Miami’s Blacks were bornin Florida, and 16 percent were born in another state in the United States. Of the 31 percent whowere foreign born, about 38 percent (12 percent divided by 31 percent) of them arrived within tenyears of the enumeration of the 2000 Census of Population and 42 percent (13 percent divided by31 percent) of them are now naturalized citizens.
Blacks are more likely to be foreign born than Non-Hispanic Whites living in metropolitanMiami, but they also are much less likely to be foreign born than Hispanics (Table 18). A higherpercentage of Blacks were born in the state of Florida than is the case for either Hispanics orNHWs. The percentage of foreign Blacks who arrived recently (between 1990 and 2000) is aboutthe same as for Miami’s foreign born Hispanics and NHWs, and a roughly similar percentage offoreign born Blacks have become U.S. citizens as for foreign born Hispanics (47 percent) andNHWs (49 percent).
Outside of Florida, the largest number of Miami’s Blacks born in the U.S. were born inGeorgia, New York, and South Carolina (Table 19 and Chart 6). Ninety percent of Miami’sBlacks who foreign born were born in the Caribbean, especially in Haiti and in Jamaica, with lessernumbers coming from Cuba, the Bahamas, and the Dominican Republic.
Table 20 and Chart 7 show the major source regions for all immigrants (not just Blacks)coming to Florida for five-year periods between 1960 and 2000. During this four-decade period,the number of in-migrants to Miami-Dade County from other counties in Florida steadilyincreased, but as a percentage of all migrants remained fairly steady by providing 10 to 13 percentof all people migrating to metropolitan Miami. The number of people moving to Miami fromstates in the United States outside of Florida declined drastically, both in absolute numbers andpercentage wise. Conversely, both the number and percentage of immigrants moving to Miamiincreased greatly during this period, reflecting an increase in both Hispanic and West Indianimmigrants. By the latter half of the 1980s the number of immigrants to Metropolitan Miami wasfor the first time exceeding the number of in-migrants from other states in the United States.
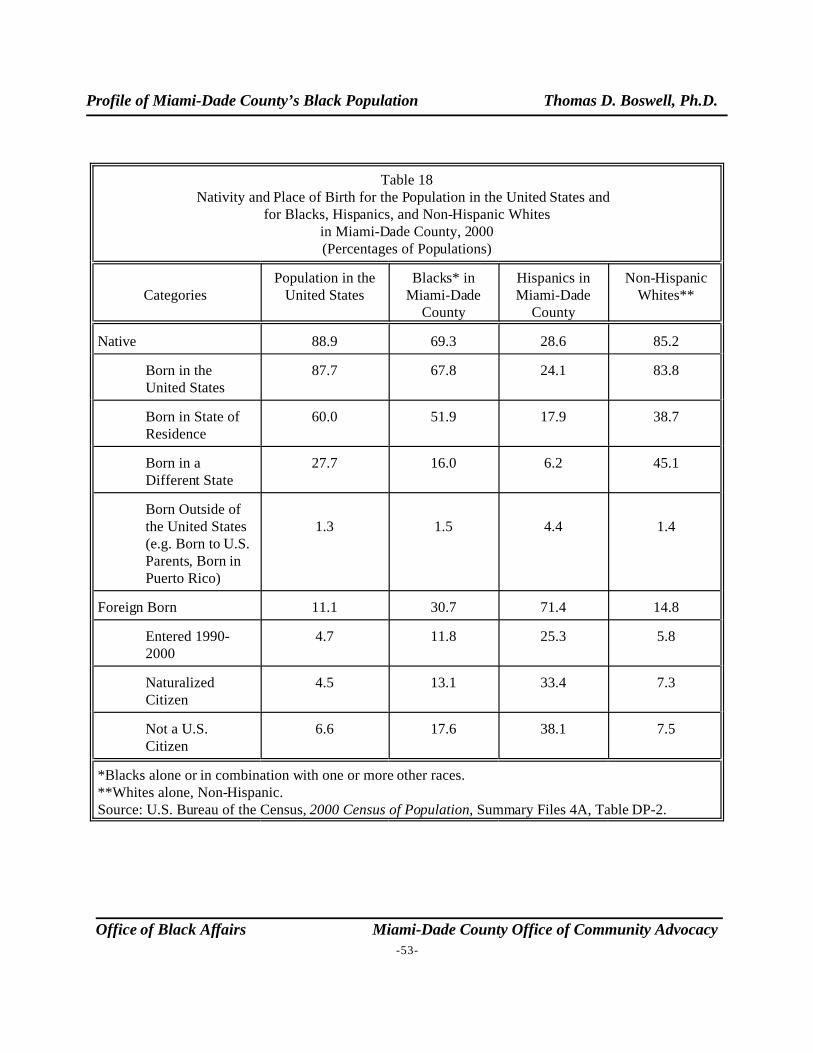
Profile of Miami-Dade County’s Black Population Thomas D. Boswell, Ph.D.
Office of Black Affairs Miami-Dade County Office of Community Advocacy-53-
Table 18Nativity and Place of Birth for the Population in the United States and
for Blacks, Hispanics, and Non-Hispanic Whitesin Miami-Dade County, 2000(Percentages of Populations)
CategoriesPopulation in the
United StatesBlacks* in
Miami-DadeCounty
Hispanics inMiami-Dade
County
Non-HispanicWhites**
Native 88.9 69.3 28.6 85.2
Born in theUnited States
87.7 67.8 24.1 83.8
Born in State ofResidence
60.0 51.9 17.9 38.7
Born in aDifferent State
27.7 16.0 6.2 45.1
Born Outside ofthe United States(e.g. Born to U.S.Parents, Born inPuerto Rico)
1.3 1.5 4.4 1.4
Foreign Born 11.1 30.7 71.4 14.8
Entered 1990-2000
4.7 11.8 25.3 5.8
NaturalizedCitizen
4.5 13.1 33.4 7.3
Not a U.S.Citizen
6.6 17.6 38.1 7.5
*Blacks alone or in combination with one or more other races.**Whites alone, Non-Hispanic.Source: U.S. Bureau of the Census, 2000 Census of Population, Summary Files 4A, Table DP-2.
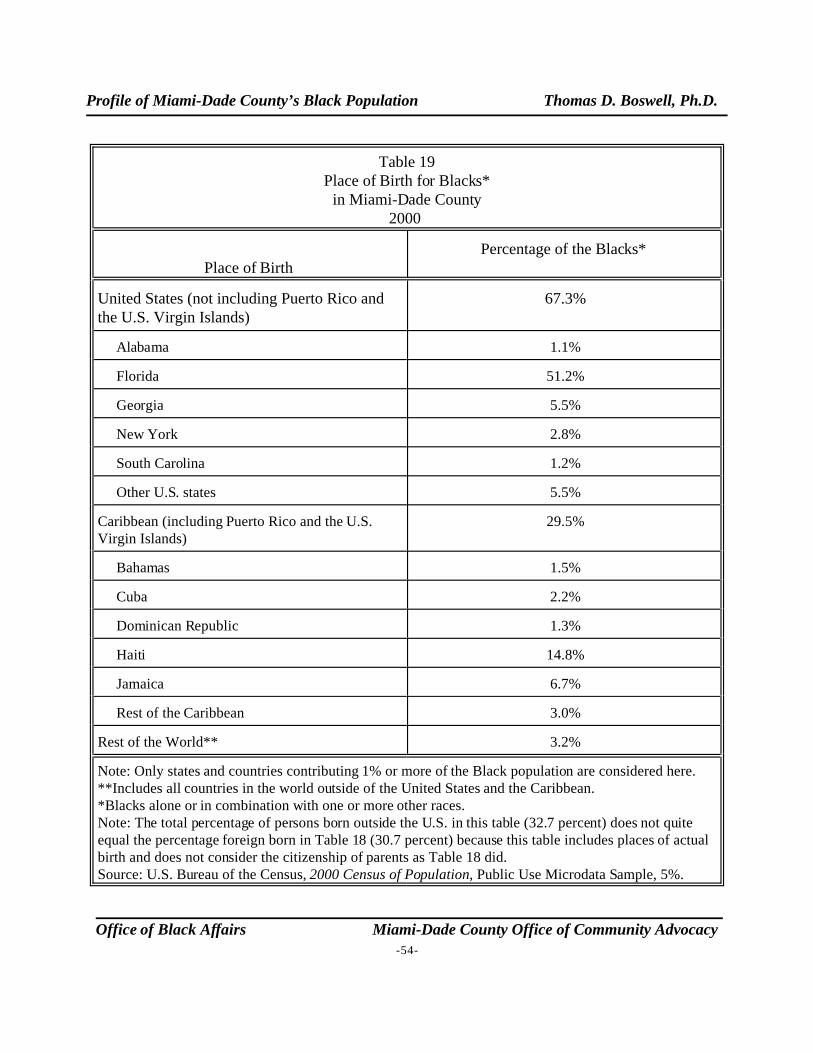
Profile of Miami-Dade County’s Black Population Thomas D. Boswell, Ph.D.
Office of Black Affairs Miami-Dade County Office of Community Advocacy-54-
Table 19Place of Birth for Blacks*
in Miami-Dade County 2000
Place of BirthPercentage of the Blacks*
United States (not including Puerto Rico andthe U.S. Virgin Islands)
67.3%
Alabama 1.1%
Florida 51.2%
Georgia 5.5%
New York 2.8%
South Carolina 1.2%
Other U.S. states 5.5%
Caribbean (including Puerto Rico and the U.S.Virgin Islands)
29.5%
Bahamas 1.5%
Cuba 2.2%
Dominican Republic 1.3%
Haiti 14.8%
Jamaica 6.7%
Rest of the Caribbean 3.0%
Rest of the World** 3.2%
Note: Only states and countries contributing 1% or more of the Black population are considered here. **Includes all countries in the world outside of the United States and the Caribbean.*Blacks alone or in combination with one or more other races.Note: The total percentage of persons born outside the U.S. in this table (32.7 percent) does not quiteequal the percentage foreign born in Table 18 (30.7 percent) because this table includes places of actualbirth and does not consider the citizenship of parents as Table 18 did. Source: U.S. Bureau of the Census, 2000 Census of Population, Public Use Microdata Sample, 5%.
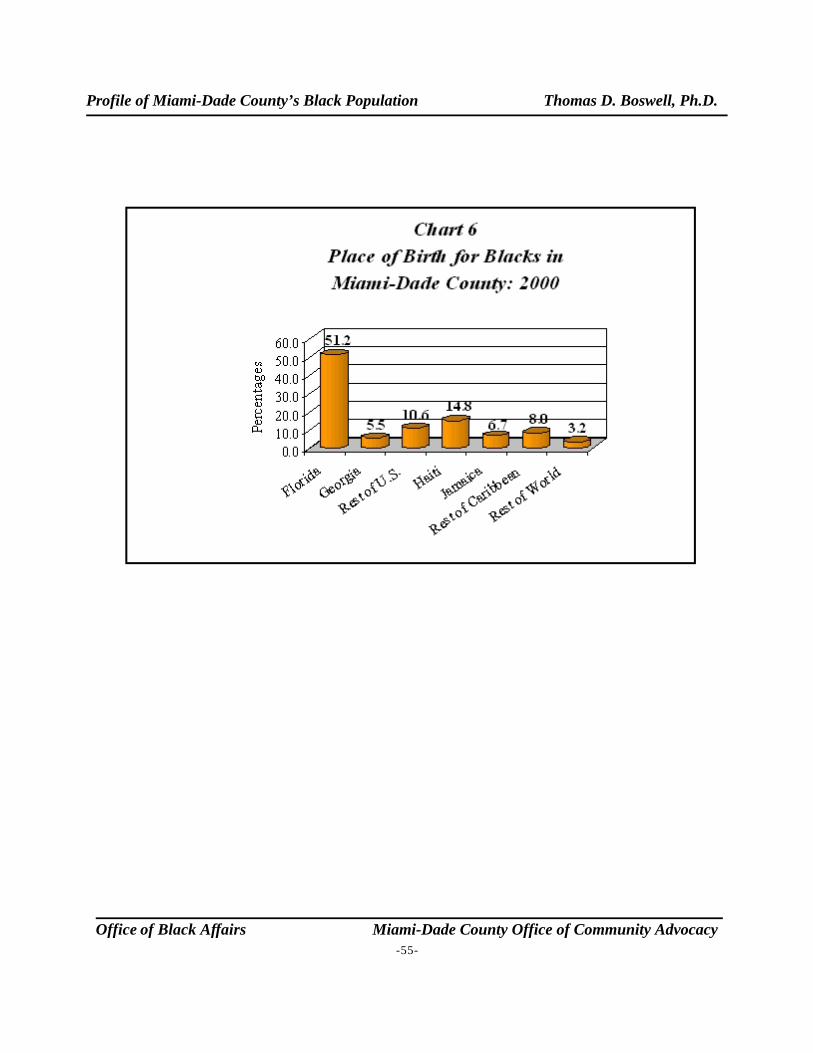
Profile of Miami-Dade County’s Black Population Thomas D. Boswell, Ph.D.
Office of Black Affairs Miami-Dade County Office of Community Advocacy-55-
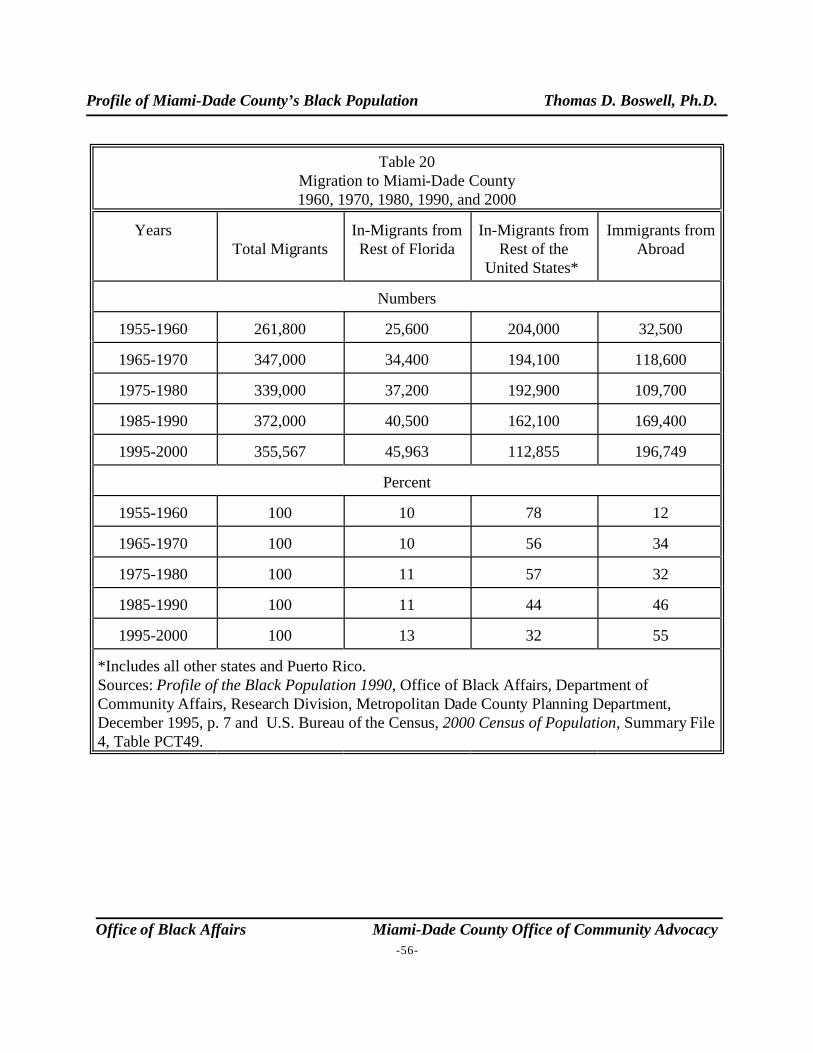
Profile of Miami-Dade County’s Black Population Thomas D. Boswell, Ph.D.
Office of Black Affairs Miami-Dade County Office of Community Advocacy-56-
Table 20Migration to Miami-Dade County1960, 1970, 1980, 1990, and 2000
YearsTotal Migrants
In-Migrants fromRest of Florida
In-Migrants fromRest of the
United States*
Immigrants fromAbroad
Numbers
1955-1960 261,800 25,600 204,000 32,500
1965-1970 347,000 34,400 194,100 118,600
1975-1980 339,000 37,200 192,900 109,700
1985-1990 372,000 40,500 162,100 169,400
1995-2000 355,567 45,963 112,855 196,749
Percent
1955-1960 100 10 78 12
1965-1970 100 10 56 34
1975-1980 100 11 57 32
1985-1990 100 11 44 46
1995-2000 100 13 32 55
*Includes all other states and Puerto Rico.Sources: Profile of the Black Population 1990, Office of Black Affairs, Department ofCommunity Affairs, Research Division, Metropolitan Dade County Planning Department,December 1995, p. 7 and U.S. Bureau of the Census, 2000 Census of Population, Summary File4, Table PCT49.
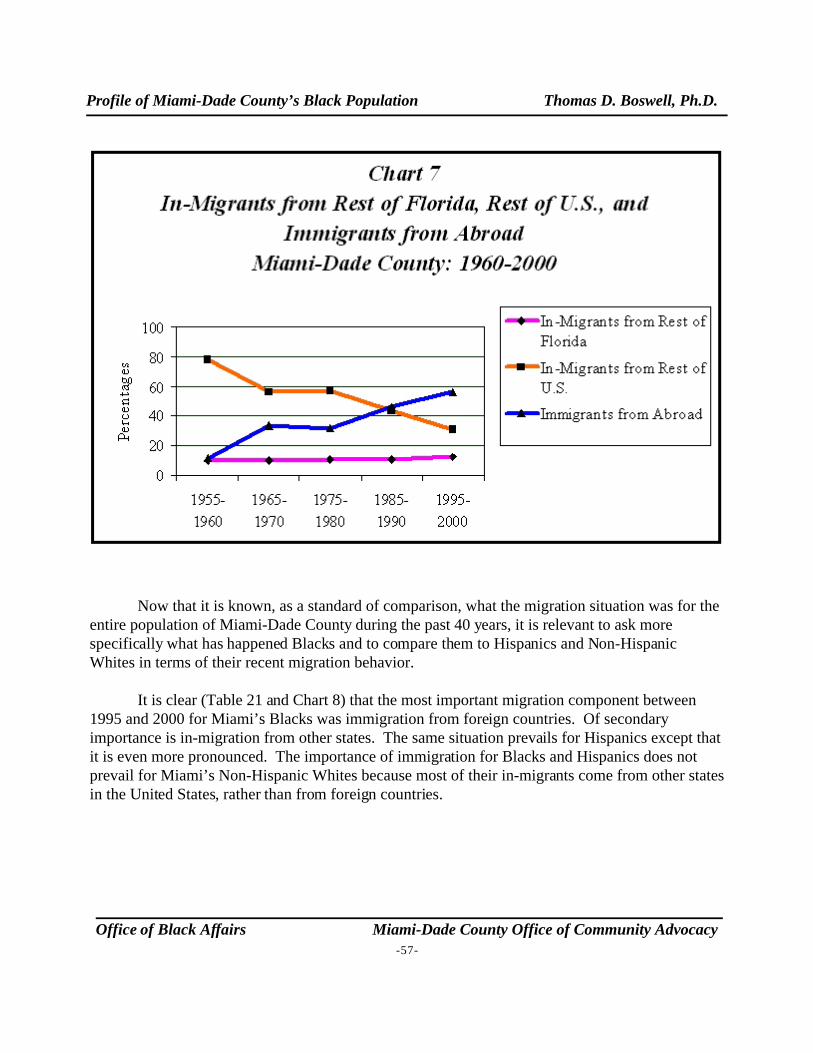
Profile of Miami-Dade County’s Black Population Thomas D. Boswell, Ph.D.
Office of Black Affairs Miami-Dade County Office of Community Advocacy-57-
Now that it is known, as a standard of comparison, what the migration situation was for theentire population of Miami-Dade County during the past 40 years, it is relevant to ask morespecifically what has happened Blacks and to compare them to Hispanics and Non-HispanicWhites in terms of their recent migration behavior.
It is clear (Table 21 and Chart 8) that the most important migration component between1995 and 2000 for Miami’s Blacks was immigration from foreign countries. Of secondaryimportance is in-migration from other states. The same situation prevails for Hispanics except thatit is even more pronounced. The importance of immigration for Blacks and Hispanics does notprevail for Miami’s Non-Hispanic Whites because most of their in-migrants come from other statesin the United States, rather than from foreign countries.
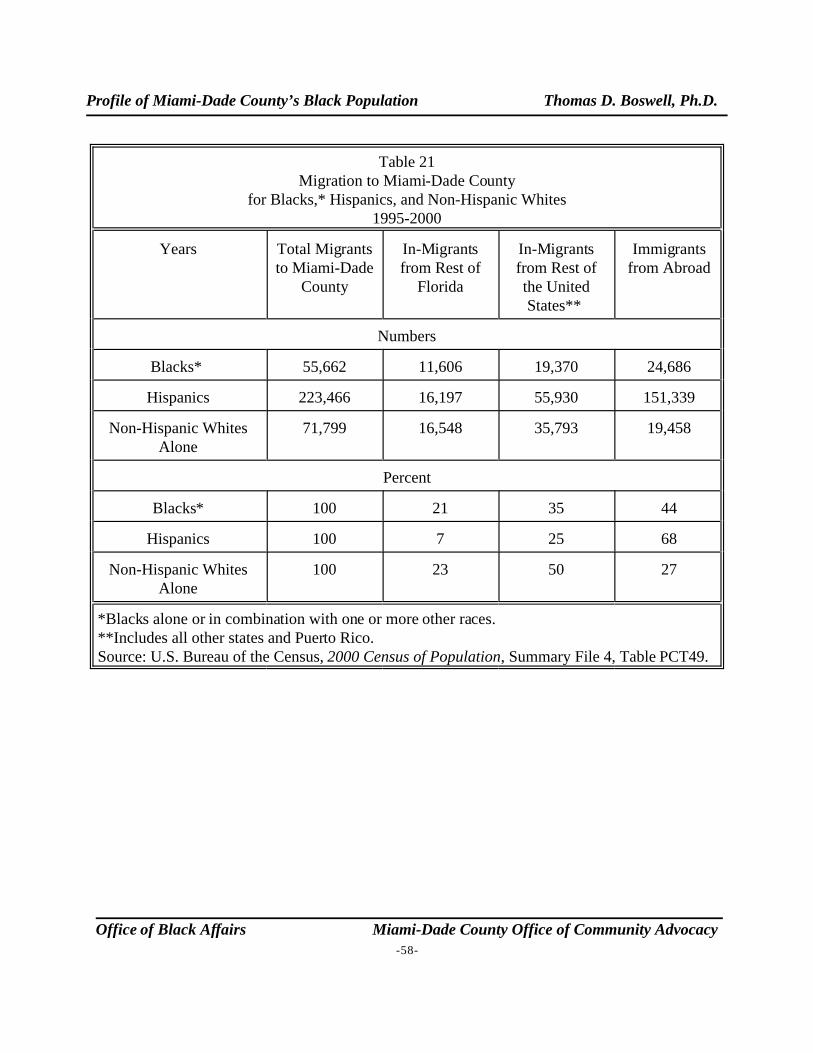
Profile of Miami-Dade County’s Black Population Thomas D. Boswell, Ph.D.
Office of Black Affairs Miami-Dade County Office of Community Advocacy-58-
Table 21Migration to Miami-Dade County
for Blacks,* Hispanics, and Non-Hispanic Whites1995-2000
Years Total Migrantsto Miami-Dade
County
In-Migrantsfrom Rest of
Florida
In-Migrantsfrom Rest ofthe UnitedStates**
Immigrantsfrom Abroad
Numbers
Blacks* 55,662 11,606 19,370 24,686
Hispanics 223,466 16,197 55,930 151,339
Non-Hispanic WhitesAlone
71,799 16,548 35,793 19,458
Percent
Blacks* 100 21 35 44
Hispanics 100 7 25 68
Non-Hispanic WhitesAlone
100 23 50 27
*Blacks alone or in combination with one or more other races.**Includes all other states and Puerto Rico.Source: U.S. Bureau of the Census, 2000 Census of Population, Summary File 4, Table PCT49.
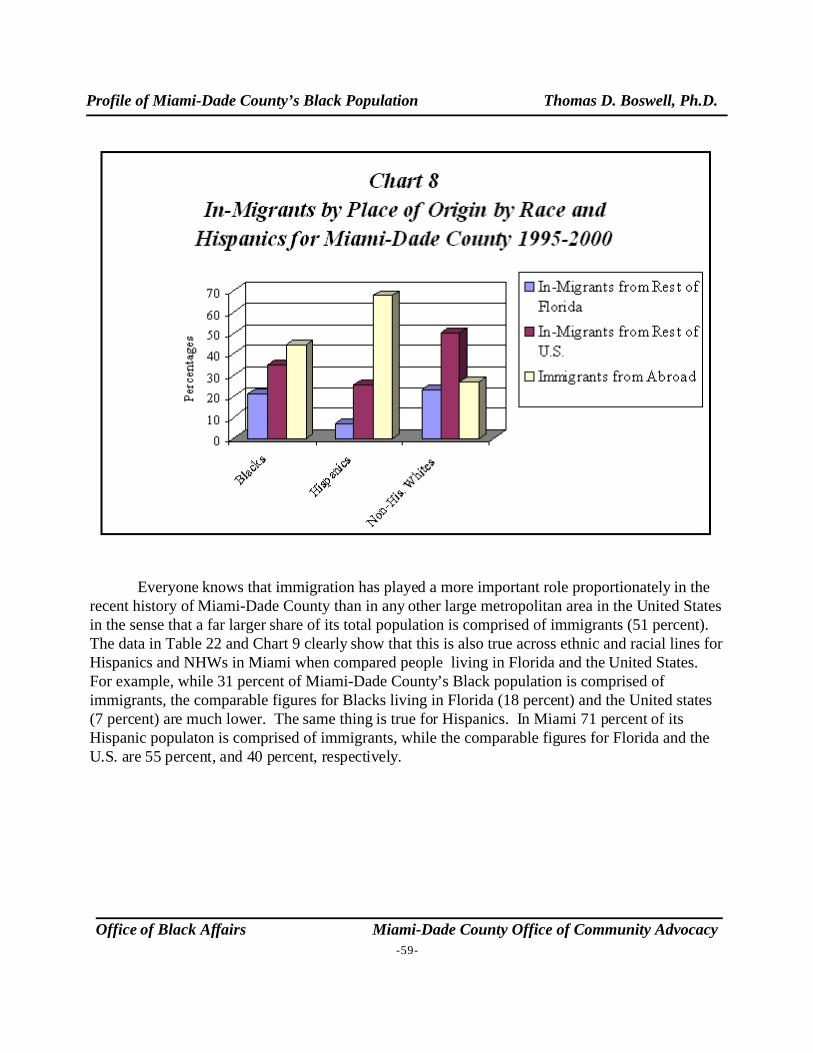
Profile of Miami-Dade County’s Black Population Thomas D. Boswell, Ph.D.
Office of Black Affairs Miami-Dade County Office of Community Advocacy-59-
Everyone knows that immigration has played a more important role proportionately in therecent history of Miami-Dade County than in any other large metropolitan area in the United Statesin the sense that a far larger share of its total population is comprised of immigrants (51 percent). The data in Table 22 and Chart 9 clearly show that this is also true across ethnic and racial lines forHispanics and NHWs in Miami when compared people living in Florida and the United States. For example, while 31 percent of Miami-Dade County’s Black population is comprised ofimmigrants, the comparable figures for Blacks living in Florida (18 percent) and the United states(7 percent) are much lower. The same thing is true for Hispanics. In Miami 71 percent of itsHispanic populaton is comprised of immigrants, while the comparable figures for Florida and theU.S. are 55 percent, and 40 percent, respectively.
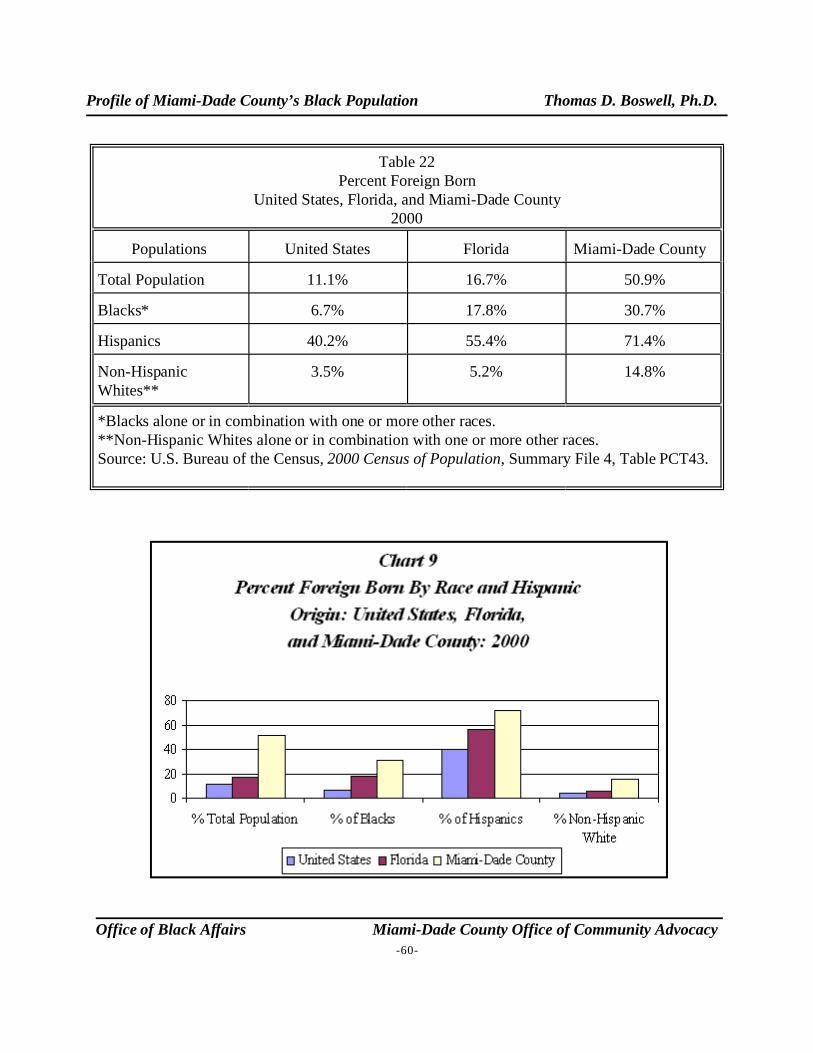
Profile of Miami-Dade County’s Black Population Thomas D. Boswell, Ph.D.
Office of Black Affairs Miami-Dade County Office of Community Advocacy-60-
Table 22Percent Foreign Born
United States, Florida, and Miami-Dade County2000
Populations United States Florida Miami-Dade County
Total Population 11.1% 16.7% 50.9%
Blacks* 6.7% 17.8% 30.7%
Hispanics 40.2% 55.4% 71.4%
Non-HispanicWhites**
3.5% 5.2% 14.8%
*Blacks alone or in combination with one or more other races.**Non-Hispanic Whites alone or in combination with one or more other races.Source: U.S. Bureau of the Census, 2000 Census of Population, Summary File 4, Table PCT43.
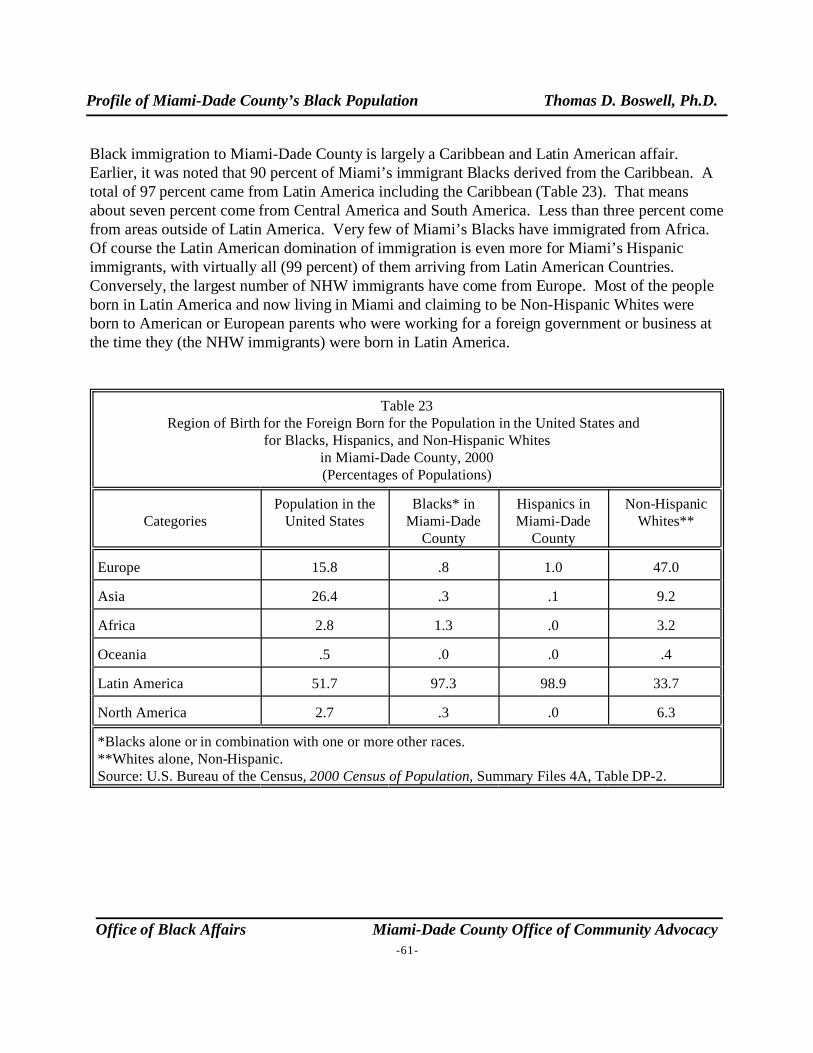
Profile of Miami-Dade County’s Black Population Thomas D. Boswell, Ph.D.
Office of Black Affairs Miami-Dade County Office of Community Advocacy-61-
Black immigration to Miami-Dade County is largely a Caribbean and Latin American affair. Earlier, it was noted that 90 percent of Miami’s immigrant Blacks derived from the Caribbean. Atotal of 97 percent came from Latin America including the Caribbean (Table 23). That means about seven percent come from Central America and South America. Less than three percent comefrom areas outside of Latin America. Very few of Miami’s Blacks have immigrated from Africa. Of course the Latin American domination of immigration is even more for Miami’s Hispanicimmigrants, with virtually all (99 percent) of them arriving from Latin American Countries. Conversely, the largest number of NHW immigrants have come from Europe. Most of the peopleborn in Latin America and now living in Miami and claiming to be Non-Hispanic Whites wereborn to American or European parents who were working for a foreign government or business atthe time they (the NHW immigrants) were born in Latin America.
Table 23Region of Birth for the Foreign Born for the Population in the United States and
for Blacks, Hispanics, and Non-Hispanic Whitesin Miami-Dade County, 2000(Percentages of Populations)
CategoriesPopulation in the
United StatesBlacks* in
Miami-DadeCounty
Hispanics inMiami-Dade
County
Non-HispanicWhites**
Europe 15.8 .8 1.0 47.0
Asia 26.4 .3 .1 9.2
Africa 2.8 1.3 .0 3.2
Oceania .5 .0 .0 .4
Latin America 51.7 97.3 98.9 33.7
North America 2.7 .3 .0 6.3
*Blacks alone or in combination with one or more other races.**Whites alone, Non-Hispanic.Source: U.S. Bureau of the Census, 2000 Census of Population, Summary Files 4A, Table DP-2.
Profile of Miami-Dade County’s Black Population Thomas D. Boswell, Ph.D.
20Haiti has two official languages, Haitian Creole and French.
21Puerto Ricans are not shown in this table because the U.S. Government does not consider them to be
immigrants or foreign born. This is because they were born as U.S. citizens in a U.S. possession.
Office of Black Affairs Miami-Dade County Office of Community Advocacy-62-
Since by far most of the Black immigrants living in Metropolitan Miami come from theCaribbean, it is now appropriate to identify in more detail their countries of origin (Table 24). Thedata in Table 24 do not completely represent the number of immigrants who came during the five-year periods shown because some of the immigrants who came to Miami have since died or movedto some place else before being enumerated in the 2000 Census. Of course this is especially truewith the earlier periods. Still, the numbers do provide a pretty good idea what was happening.
Although Miami-Dade County has a long history of Caribbean Black immigrants(especially Bahamians) dating to at least the 1890s when they came to help build the city andHenry Flagler’s Florida East Coast Railroad to Miami, the large-scale Caribbean migration ofBlacks from most of the countries shown in Table 24 dates mainly from the late 1970s or the early1980s. As noted earlier in this chapter, Haiti has sent the largest number of Caribbean immigrants,followed by Jamaica, Cuba, the Bahamas, and the Dominican Republic, in that order. Of the136,000 Caribbean Black immigrants enumerated in the 2000 Census of Population formetropolitan Miami, 74 percent came after 1980 and 39 percent came since 1990. It is reasonableto assume that more recent arrivals are more likely to be in the earlier stages of adjusting to life inMiami and many still may consider their national origins to distinguish themselves from U.S. bornBlacks living in Greater Miami. In other words, these more recent arrivals are likely to be lessassimilated into the American and Black mainstream populations than those who arrived earlier.
Language Spoken at Home and Ability to Speak English
Almost 32 percent of the Blacks living in Miami-Dade County speak a language other thanEnglish in their homes (Table 25). This is about the same as the percentage of Blacks who areimmigrants (31 percent), but this is coincidence because 44 percent of the Black immigrants toMiami come from English-speaking countries (Table 22). The largest number (22 percent) ofBlacks who immigrated from a country where English is not the native or official language, speakHaitian Creole or French (shown as “Other Indo-European Languages in Table 25).20 The secondlargest number (9 percent) speak Spanish and include mostly immigrants from Cuba and theDominican Republic.21 Sixty-eight percent of the Blacks in Miami speak only English in theirhomes. For them speaking English is not a problem. Eighty-six percent of the Blacks in Miami-Dade County say they speak English very well. Only about 14 percent of the Blacks living inMiami say that they do not speak English very well, which far lower than for Hispanics, where 53percent do not speak English very well.
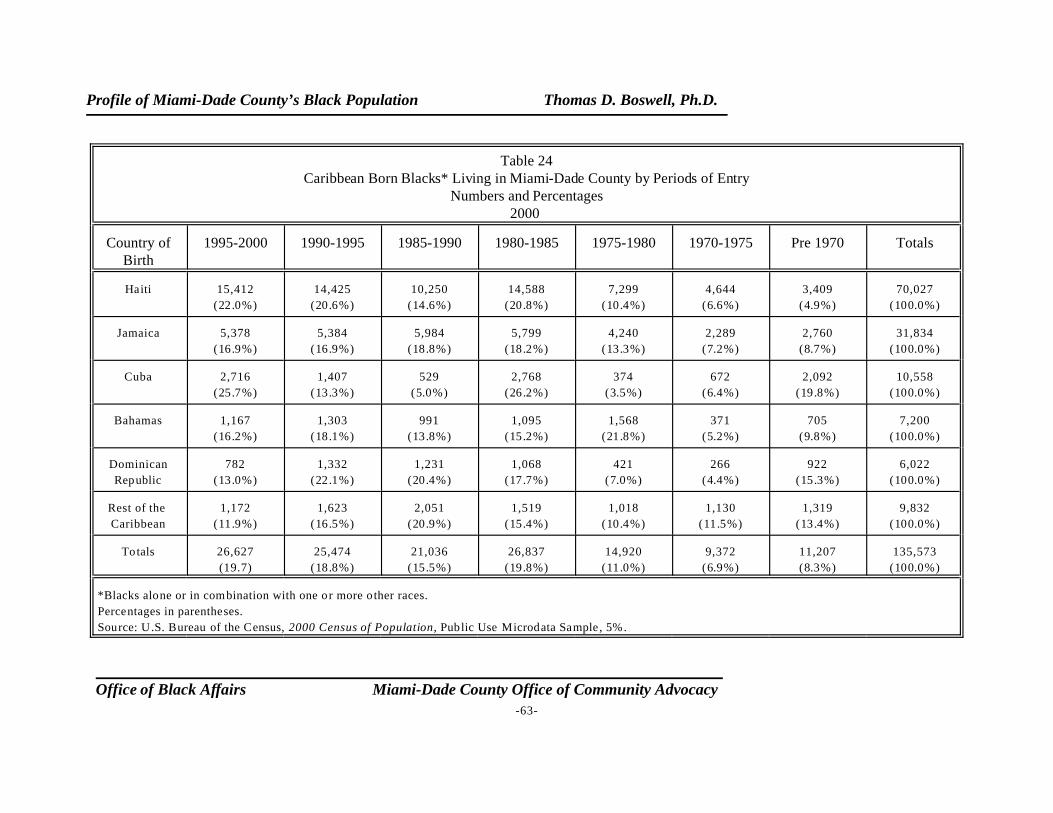
Profile of Miami-Dade County’s Black Population Thomas D. Boswell, Ph.D.
Office of Black Affairs Miami-Dade County Office of Community Advocacy-63-
Table 24Caribbean Born Blacks* Living in Miami-Dade County by Periods of Entry
Numbers and Percentages2000
Country ofBirth
1995-2000 1990-1995 1985-1990 1980-1985 1975-1980 1970-1975 Pre 1970 Totals
Haiti 15,412
(22.0%)
14,425
(20.6%)
10,250
(14.6%)
14,588
(20.8%)
7,299
(10.4%)
4,644
(6.6%)
3,409
(4.9%)
70,027
(100.0%)
Jamaica 5,378
(16.9%)
5,384
(16.9%)
5,984
(18.8%)
5,799
(18.2%)
4,240
(13.3%)
2,289
(7.2%)
2,760
(8.7%)
31,834
(100.0%)
Cuba 2,716
(25.7%)
1,407
(13.3%)
529
(5.0%)
2,768
(26.2%)
374
(3.5%)
672
(6.4%)
2,092
(19.8%)
10,558
(100.0%)
Bahamas 1,167
(16.2%)
1,303
(18.1%)
991
(13.8%)
1,095
(15.2%)
1,568
(21.8%)
371
(5.2%)
705
(9.8%)
7,200
(100.0%)
Dominican
Republic
782
(13.0%)
1,332
(22.1%)
1,231
(20.4%)
1,068
(17.7%)
421
(7.0%)
266
(4.4%)
922
(15.3%)
6,022
(100.0%)
Rest of the
Caribbean
1,172
(11.9%)
1,623
(16.5%)
2,051
(20.9%)
1,519
(15.4%)
1,018
(10.4%)
1,130
(11.5%)
1,319
(13.4%)
9,832
(100.0%)
Totals 26,627
(19.7)
25,474
(18.8%)
21,036
(15.5%)
26,837
(19.8%)
14,920
(11.0%)
9,372
(6.9%)
11,207
(8.3%)
135,573
(100.0%)
*Blacks alone or in combination with one or more o ther races.
Percentages in parentheses.
Source: U.S. Bureau of the Census, 2000 Census of Population, Public Use Microdata Sample, 5%.
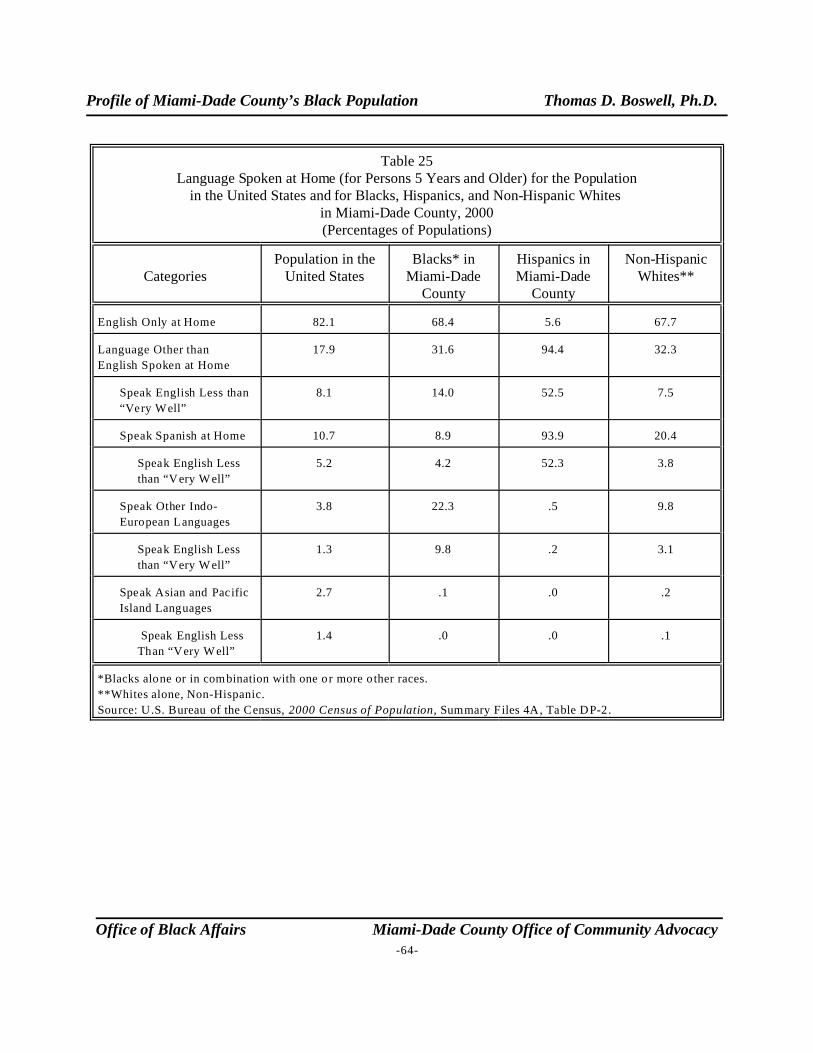
Profile of Miami-Dade County’s Black Population Thomas D. Boswell, Ph.D.
Office of Black Affairs Miami-Dade County Office of Community Advocacy-64-
Table 25Language Spoken at Home (for Persons 5 Years and Older) for the Population
in the United States and for Blacks, Hispanics, and Non-Hispanic Whites in Miami-Dade County, 2000(Percentages of Populations)
CategoriesPopulation in the
United StatesBlacks* in
Miami-DadeCounty
Hispanics inMiami-Dade
County
Non-HispanicWhites**
English Only at Home 82.1 68.4 5.6 67.7
Language Other than
English Spoken at Home
17.9 31.6 94.4 32.3
Speak English Less than
“Very Well”
8.1 14.0 52.5 7.5
Speak Spanish at Home 10.7 8.9 93.9 20.4
Speak English Less
than “Very W ell”
5.2 4.2 52.3 3.8
Speak Other Indo-
European Languages
3.8 22.3 .5 9.8
Speak English Less
than “Very W ell”
1.3 9.8 .2 3.1
Speak Asian and Pacific
Island Languages
2.7 .1 .0 .2
Speak English Less
Than “Very W ell”
1.4 .0 .0 .1
*Blacks alone or in combination with one or more o ther races.
**Whites alone, Non-Hispanic.
Source: U.S. Bureau of the Census, 2000 Census of Population, Summary Files 4A, Table DP-2.
Profile of Miami-Dade County’s Black Population Thomas D. Boswell, Ph.D.
22The index of segregation is also called the index of dissimilarity. It is represented by the following
formula: ID = G|(Xi - Yi|)/2 Where:
ID is the index of segregation
X i is the percent of the population of one component living in the ith census tract
Y i is the percent of the population of another component living in the same ith census tract
The absolute difference is taken between these two percentages and then summed
The result is divided by 2.
23A similar study of the segregation between Non-Hispanic Whites and Non-Hispanic B lacks for Miami-
Dade County in 1990 found an almost identical segregation index value (70.5 percent). Thomas D. Boswell and
Angel David Cruz-Báez, “Residential Segregation by Socioeconomic Class in Metropolitan Miami: 1990,” Urban
Geography, 1997, Vol. 18, No. 6, p. 479 and Thomas D. Boswell, “Racial and Ethnic Segregation Patterns in
Metropolitan M iami, Florida, 1980-1990, Vol 33, No. 1, May 1993, p . 474-496.
Office of Black Affairs Miami-Dade County Office of Community Advocacy-65-
CHAPTER 6
The Geography of Miami-Dade County’s Blacks:Where They Live
Neighborhoods can tell you a lot about the people who live in them. Socioeconomic classis readily apparent through the quality of housing. Racial or ethnic characteristics are also oftenvisible through the language of signs, the music heard on the streets, and the types of churches thatmark the landscape. In some ways neighborhoods not only mirror the characteristics of the peoplewho live in them but they also determine them. Poor or depressed neighborhoods may offerdifferent opportunities for attending quality schools, obtaining good jobs, and making the “rightkind” of friends than affluent areas. Ethnic and racial concentrations can be products of choice ordiscrimination. When they are the result of discrimination they usually limit opportunities. Manystudies have determined that Blacks are among the most highly segregated and disadvantagedpeople in American cities. This chapter investigates the residential distribution of Blacks and someof its component sub-populations. More specifically, it determines the extent to which Blacks aresegregated from Hispanics and Non-Hispanic Whites. Then it determines how segregated Blacksare among themselves according to their national origins and income.
Segregation is measured two ways in this report, by use of maps showing where thevarious groups of Blacks live and by a segregation index. The segregation index compares thedistributions of two groups of people and is an expression of the percentage of one of the twogroups that would have to move to have the same distribution as the other group.22 Census tractsare used as an approximation of neighborhoods in Metropolitan Miami because that is what theU.S. Bureau of the Census designed them to measure. For example, the index comparing Blackswith Whites in Miami Dade County is 71 percent (Table 26).23 This means that either 71 percent
Profile of Miami-Dade County’s Black Population Thomas D. Boswell, Ph.D.
Office of Black Affairs Miami-Dade County Office of Community Advocacy-66-
of the Black population or 71 percent of the White population (or some combination of the two)would need to be redistributed among Miami-Dade County’s 347 census tracts to have the identicalpercentage distributions. An index of higher than 60 percent is usually considered to be high. Oneof less than 30 percent is low; and one between 30 percent and 60 percent is moderate.
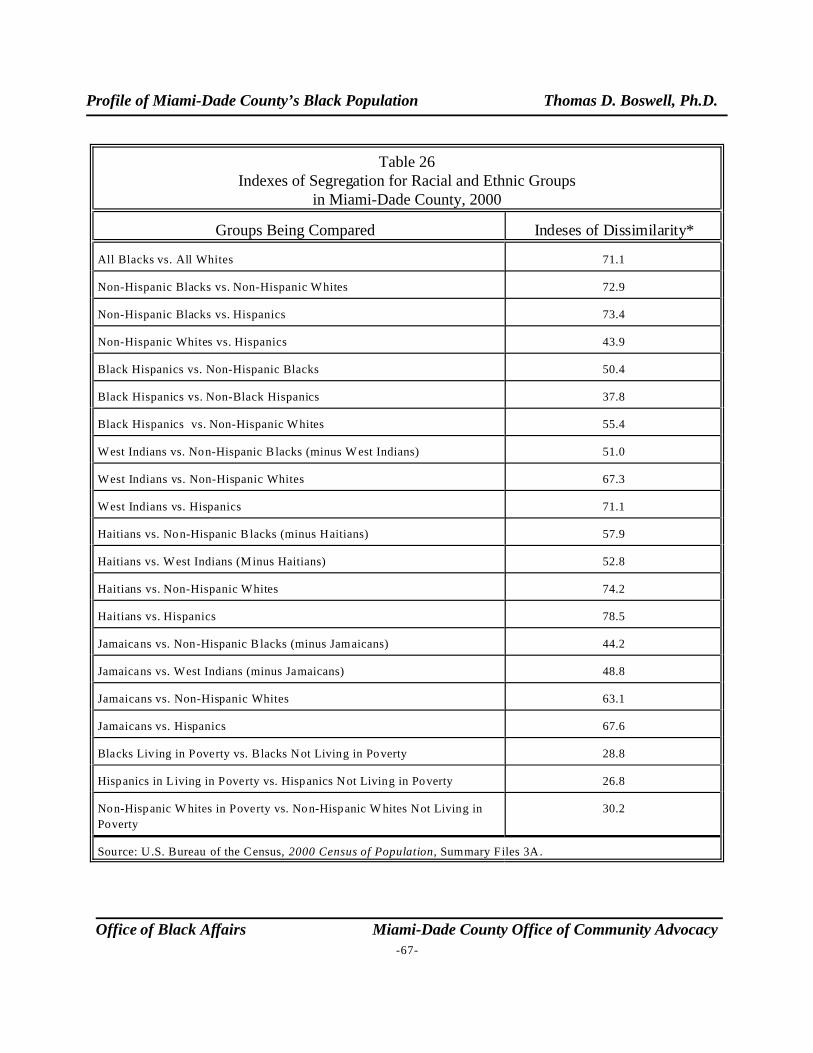
Profile of Miami-Dade County’s Black Population Thomas D. Boswell, Ph.D.
Office of Black Affairs Miami-Dade County Office of Community Advocacy-67-
Table 26Indexes of Segregation for Racial and Ethnic Groups
in Miami-Dade County, 2000
Groups Being Compared Indeses of Dissimilarity*
All Blacks vs. All Whites 71.1
Non-Hispanic Blacks vs. Non-Hispanic Whites 72.9
Non-Hispanic Blacks vs. Hispanics 73.4
Non-Hispanic Whites vs. Hispanics 43.9
Black Hispanics vs. Non-Hispanic Blacks 50.4
Black Hispanics vs. Non-Black Hispanics 37.8
Black Hispanics vs. Non-Hispanic Whites 55.4
West Indians vs. Non-Hispanic B lacks (minus W est Indians) 51.0
West Indians vs. Non-Hispanic Whites 67.3
West Indians vs. Hispanics 71.1
Haitians vs. Non-Hispanic B lacks (minus Haitians) 57.9
Haitians vs. West Indians (Minus Haitians) 52.8
Haitians vs. Non-Hispanic Whites 74.2
Haitians vs. Hispanics 78.5
Jamaicans vs. Non-Hispanic B lacks (minus Jamaicans) 44.2
Jamaicans vs. West Indians (minus Jamaicans) 48.8
Jamaicans vs. Non-Hispanic Whites 63.1
Jamaicans vs. Hispanics 67.6
Blacks Living in Poverty vs. Blacks Not Living in Poverty 28.8
Hispanics in Living in Poverty vs. Hispanics Not Living in Poverty 26.8
Non-Hispanic W hites in Poverty vs. Non-Hispanic W hites Not Living in
Poverty
30.2
Source: U.S. Bureau of the Census, 2000 Census of Population, Summary Files 3A.
Profile of Miami-Dade County’s Black Population Thomas D. Boswell, Ph.D.
24It should be noted that in 2003, M iami Gardens incorporated and annexed parts of the cities Opa-Locka
and Caro l City.
25This is almost exactly the index found for comparing Non-Hispanic Blacks and Hispanics in 1990 (73.2
percent). Thomas D. Boswell and Angel David Cruz-Báez, “Residential Segregation by Socioeconomic Class in
Metropolitan Miami: 1990,” Urban Geography, 1997, Vol. 18, No. 6, p. 479.
Office of Black Affairs Miami-Dade County Office of Community Advocacy-68-
The first map shows the distribution of all Blacks (including Black Hispanics) as apercentage of each census tract’s total population. Percentage maps like this are particularly usefulwhen a writer wants to show the degree to which Blacks dominate neighborhoods. This report refers to neighborhoods in which Blacks represent more than half the population as Black neighborhoods. It can be seen that there are eleven distinct clusters of Black neighborhoods (Map1). Four of them comprise what we call the “Northern Wedge,” extending from Carol City24 in thenorth through Opa-Locka and Liberty City to Overtown (just north of Miami’s Central BusinessDistrict). There is a smaller fifth cluster of Blacks in Coconut Grove that dates back to the late1800s. This is the oldest Black neighborhood in Miami-Dade County. Southward from CoconutGrove is a smaller sixth cluster of Blacks who live in the municipality of South Miami. Theremaining five clusters extend south from Richmond to Florida City. A comparison of Maps 1 and2 shows that for general mapping purposes, there is no need to distinguish between Blacksaccording to whether they include or exclude Black Hispanics because these two maps showvirtually identical visual patterns. Earlier in this report (Table 1) it was noted that the 2000Census of Population found there were almost 39,000 Black Hispanics living in Miami-DadeCounty. This was about eight percent of Miami’s Blacks in 2000.
Map 3 shows the distribution of Hispanics. The concentrations of Hispanics in LittleHavana, Hialeah, Westchester, and Sweetwater are apparent. It is also clear that there are somemarked differences between where Blacks and Hispanics live in Miami-Dade County. Notice thehollow area in the northeastern part of Map 3 where few Hispanic live. This is where the Blackwedge was found in Maps 1 and 2. The segregation index (73.4 percent) in Table 26 forcomparing the residential patterns of Non-Hispanic Blacks and Hispanics confirms the generalavoidance between Blacks and Hispanics in metropolitan Miami.25 This is the highest index foundin the table, but it is only slightly higher than the index comparing the distributions of Non-Hispanic Blacks and Non-Hispanic Whites (72.9 percent).
Since there is such a striking difference between where Blacks and Hispanics live, aninteresting question is where do most of the Black Hispanics live. Do they live primarily amongBlacks or among Hispanics? Map 4 shows that there is considerable overlap between Black andHispanic neighborhoods in where the Black Hispanics live. They live in Black neighborhoods likeCarol City, North Miami, and Liberty City. They also live in such Hispanic neighborhoods asLittle Havana, and Hialeah. A comparison of the indexes of segregation comparing Hispanic
Profile of Miami-Dade County’s Black Population Thomas D. Boswell, Ph.D.
26Note that in calculating this index for Non-Black Hispanics we removed from the Hispanics those who
were also Black.
Office of Black Affairs Miami-Dade County Office of Community Advocacy-69-
Blacks to Non-Hispanic Blacks and to Non-Black Hispanics26 shows that both indexes were in themoderate range, but there was more of a tendency for Black Hispanics to live among Hispanics (ID= 38 percent) than among Non Hispanic Blacks (ID = 50 percent).
Map 5 shows the distribution of Non-Hispanic Whites. They are most heavily dominantin some of the more affluent coastal neighborhoods of Greater Miami such as Aventura, NorthMiami Beach, Miami Beach, Coconut Grove, and Pinecrest. What is perhaps most striking in Map5 is how few areas the NHWs dominate. This is a reflection of the decline in the NHWs to about21 percent of the total Miami-Dade County population mentioned earlier in this report. Map 5 alsoshows that there is a general avoidance of Black neighborhoods by the NHWs, just as there wasfor the Hispanics. Notice again the hollow area immediately west of the White concentrations innorthern Miami-Dade County. The NHW’s also show a moderate avoidance of Hispanics. Still, itis obvious there is more segregation between Blacks and Non-Hispanic Whites (ID = 73 percent)than between Hispanics and Non-Hispanic Whites (ID = 44 percent). It is interesting to see thatBlack Hispanics are least segregated from Hispanics, moderately segregated from Blacks, and mostsegregated from Non-Hispanic Whites (Tale 26).
The reader will recall that the vast majority of the Blacks who immigrated to MetropolitanMiami have come from the Caribbean. The ones who came from the Non-Spanish speakingIslands (excluding those from Cuba, Puerto Rico, and the Dominican Republic) are collectivelycalled West Indians. Since more than 90 percent of the West Indians are Black it is interesting tosee if they are living in residential patterns similar to that of other Blacks living in Miami. Ofcourse, since there are many fewer West Indians (a little more than 160,000) than Non-West IndianBlacks, it should not be expected that the West Indians would be as expansive in their coverage ofMiami and Map 6 shows this. There are only three neighborhoods numerically dominated by WestIndians, North Miami, Little Haiti, and a small area near Cutler Ridge. Map 7 shows thedistribution of Haitians by numbers rather than percentages. When the numbers of an ethnic groupare relatively small, absolute numbers provide a better idea of where they live. Still, it is clearfrom both Maps 6 and 7 that West Indians are primarily living in Black neighborhoods in GreaterMiami, although they are highly concentrated in some Black neighborhoods more so than in otherones. The indexes of segregation shown in Table 26 show that the West Indians are leastsegregated from the Non-Hispanic Black population (minus the West Indians) and most segregatedfrom the County’s Hispanics, with degree of segregation with NHWs in between these extremes.
This report similarly provides maps (Maps 8-11) of the four largest nationality groupsof West Indians living in metropolitan Miami, including Haitians, Jamaicans, Bahamians, and
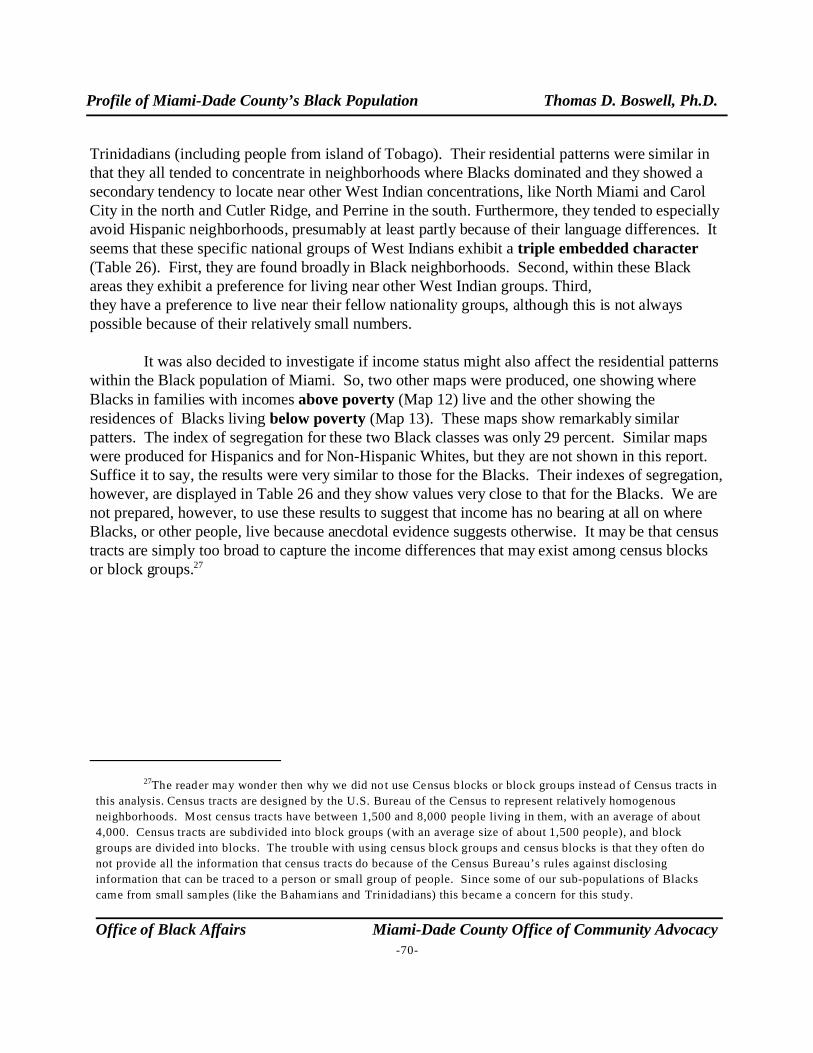
Profile of Miami-Dade County’s Black Population Thomas D. Boswell, Ph.D.
27The reader may wonder then why we did no t use Census blocks or block groups instead of Census tracts in
this analysis. Census tracts are designed by the U.S. Bureau of the Census to represent relatively homogenous
neighborhoods. Most census tracts have between 1,500 and 8,000 people living in them, with an average of about
4,000. Census tracts are subdivided into block groups (with an average size of about 1,500 people), and block
groups are divided into blocks. The trouble with using census block groups and census blocks is that they often do
not provide all the information that census tracts do because of the Census Bureau’s rules against disclosing
information that can be traced to a person or small group of people. Since some of our sub-populations of Blacks
came from small samples (like the Bahamians and Trinidadians) this became a concern for this study.
Office of Black Affairs Miami-Dade County Office of Community Advocacy-70-
Trinidadians (including people from island of Tobago). Their residential patterns were similar inthat they all tended to concentrate in neighborhoods where Blacks dominated and they showed asecondary tendency to locate near other West Indian concentrations, like North Miami and CarolCity in the north and Cutler Ridge, and Perrine in the south. Furthermore, they tended to especiallyavoid Hispanic neighborhoods, presumably at least partly because of their language differences. Itseems that these specific national groups of West Indians exhibit a triple embedded character(Table 26). First, they are found broadly in Black neighborhoods. Second, within these Blackareas they exhibit a preference for living near other West Indian groups. Third,they have a preference to live near their fellow nationality groups, although this is not alwayspossible because of their relatively small numbers.
It was also decided to investigate if income status might also affect the residential patternswithin the Black population of Miami. So, two other maps were produced, one showing whereBlacks in families with incomes above poverty (Map 12) live and the other showing theresidences of Blacks living below poverty (Map 13). These maps show remarkably similarpatters. The index of segregation for these two Black classes was only 29 percent. Similar mapswere produced for Hispanics and for Non-Hispanic Whites, but they are not shown in this report. Suffice it to say, the results were very similar to those for the Blacks. Their indexes of segregation,however, are displayed in Table 26 and they show values very close to that for the Blacks. We arenot prepared, however, to use these results to suggest that income has no bearing at all on whereBlacks, or other people, live because anecdotal evidence suggests otherwise. It may be that censustracts are simply too broad to capture the income differences that may exist among census blocksor block groups.27
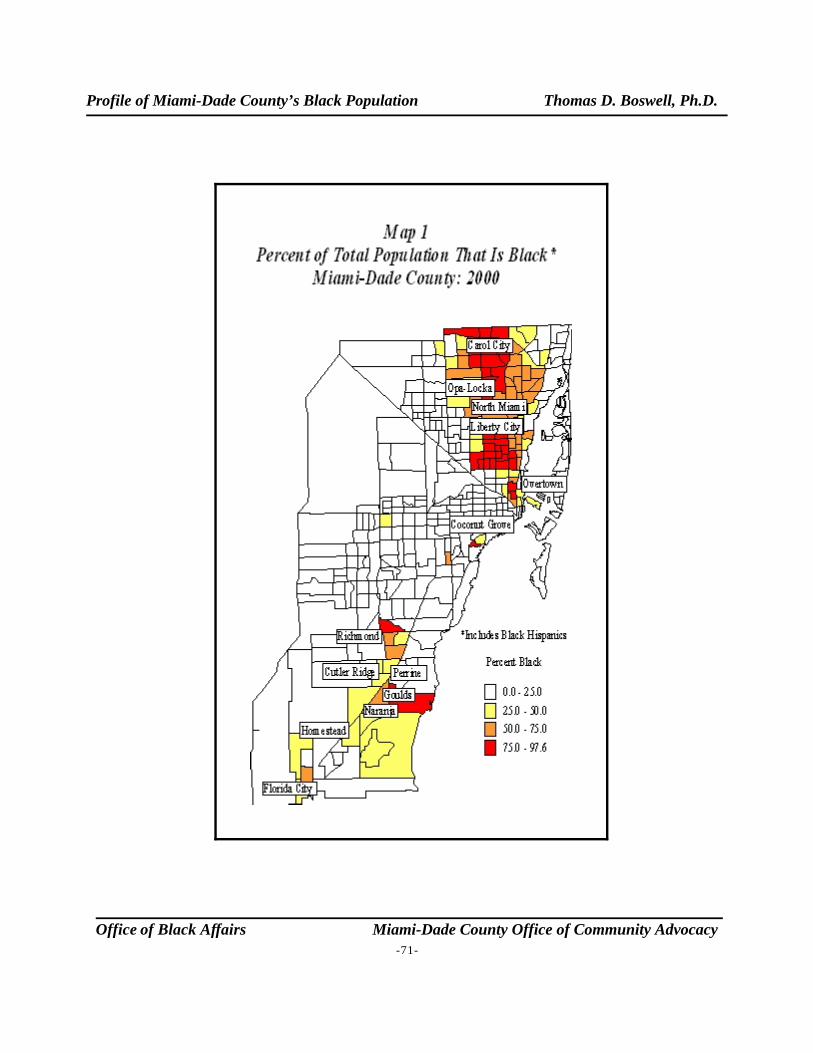
Profile of Miami-Dade County’s Black Population Thomas D. Boswell, Ph.D.
Office of Black Affairs Miami-Dade County Office of Community Advocacy-71-
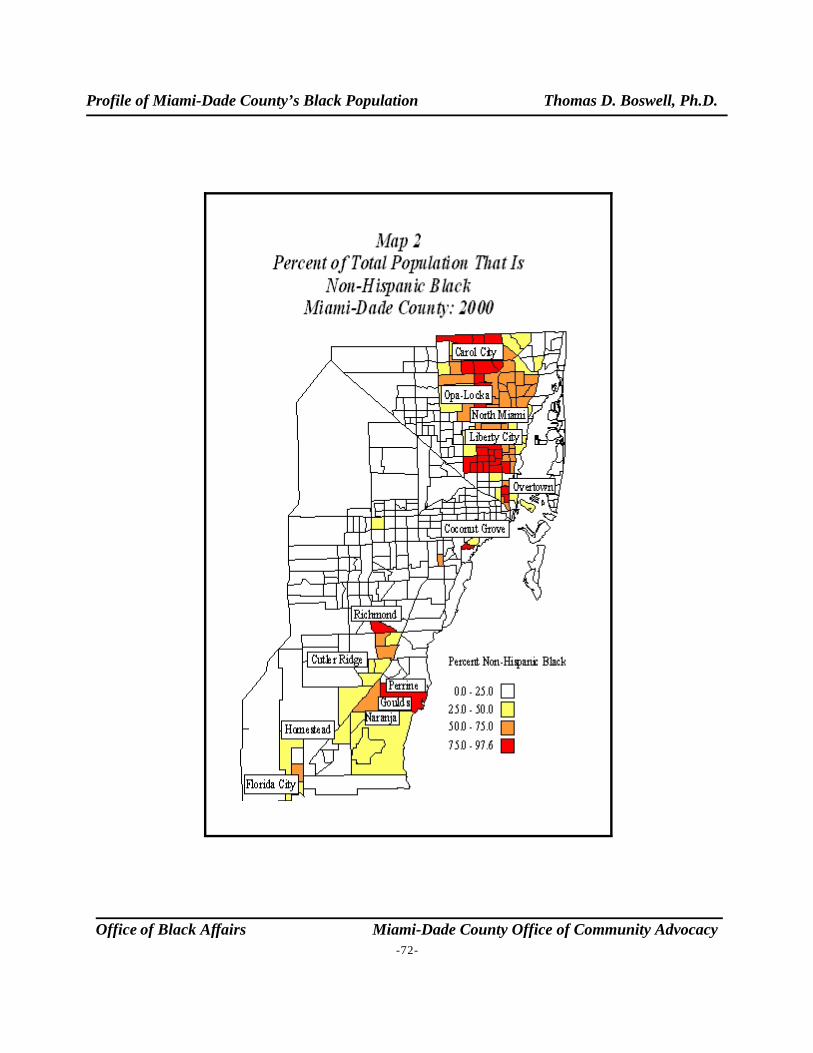
Profile of Miami-Dade County’s Black Population Thomas D. Boswell, Ph.D.
Office of Black Affairs Miami-Dade County Office of Community Advocacy-72-
Profile of Miami-Dade County’s Black Population Thomas D. Boswell, Ph.D.
Office of Black Affairs Miami-Dade County Office of Community Advocacy-73-
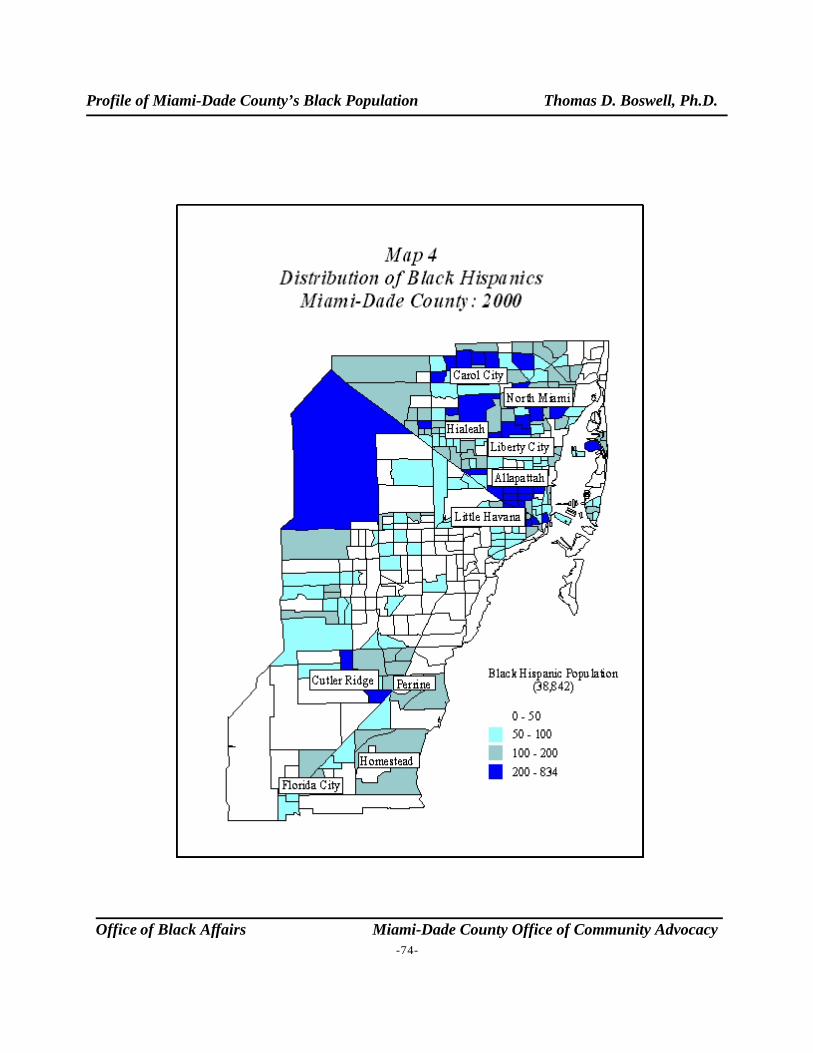
Profile of Miami-Dade County’s Black Population Thomas D. Boswell, Ph.D.
Office of Black Affairs Miami-Dade County Office of Community Advocacy-74-
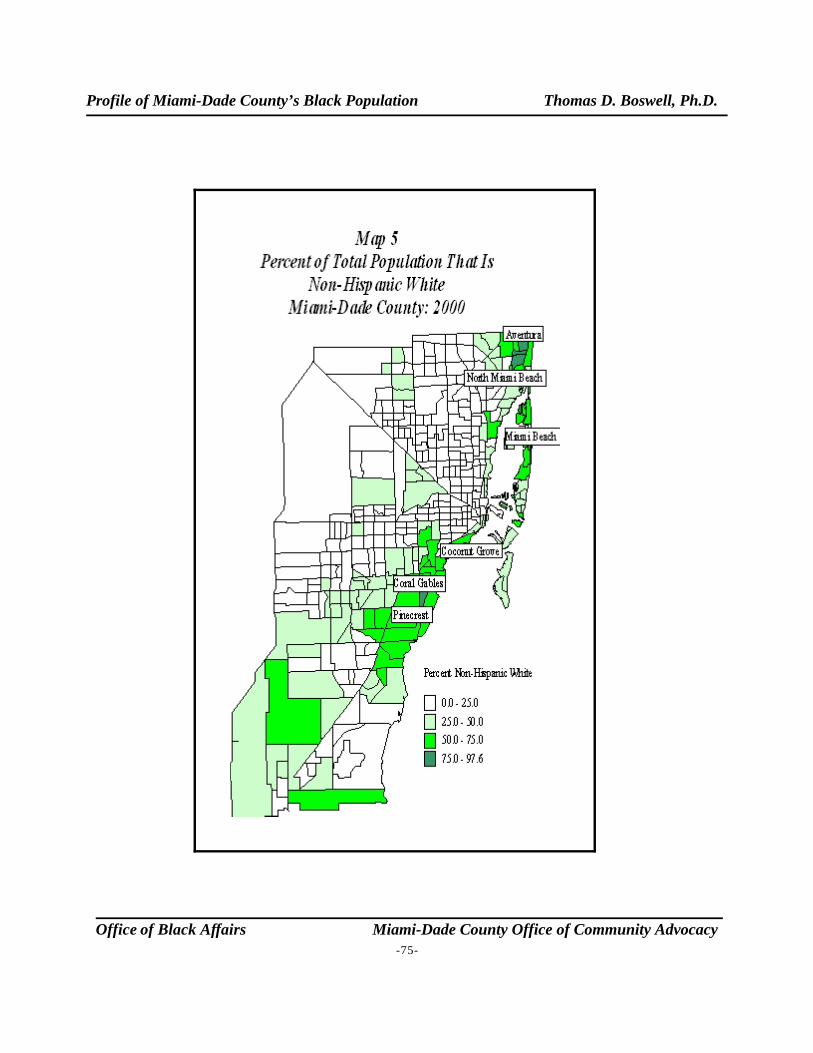
Profile of Miami-Dade County’s Black Population Thomas D. Boswell, Ph.D.
Office of Black Affairs Miami-Dade County Office of Community Advocacy-75-
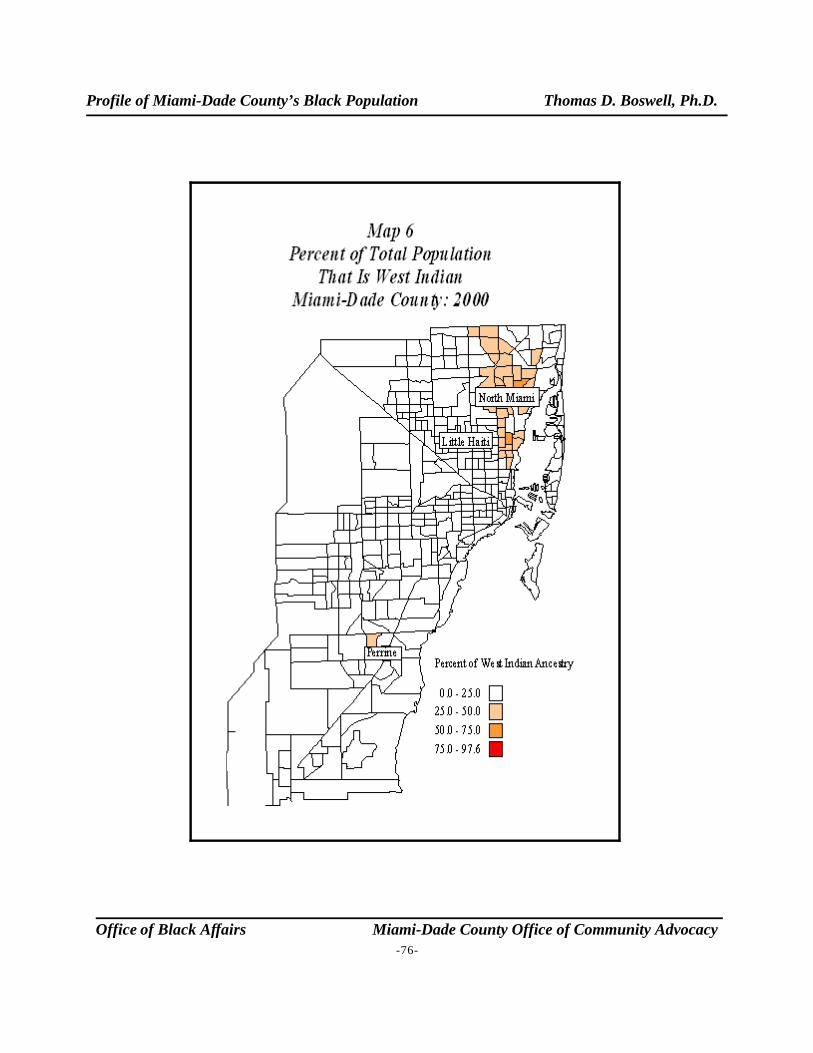
Profile of Miami-Dade County’s Black Population Thomas D. Boswell, Ph.D.
Office of Black Affairs Miami-Dade County Office of Community Advocacy-76-
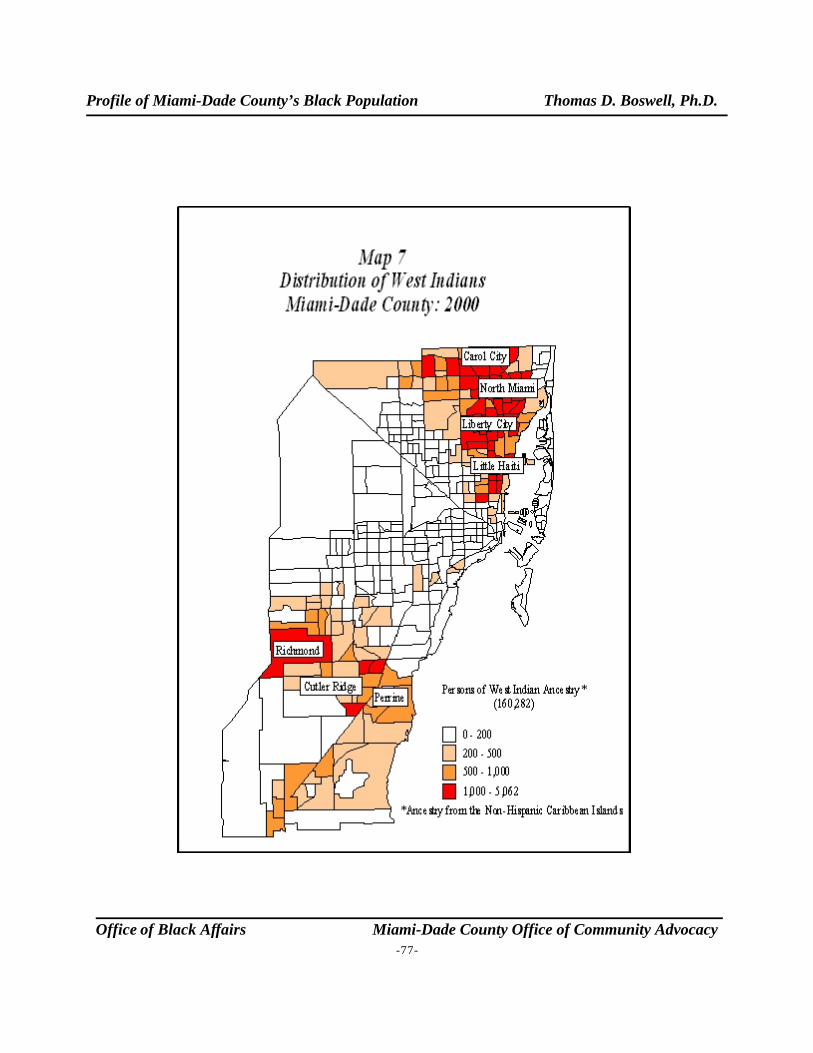
Profile of Miami-Dade County’s Black Population Thomas D. Boswell, Ph.D.
Office of Black Affairs Miami-Dade County Office of Community Advocacy-77-
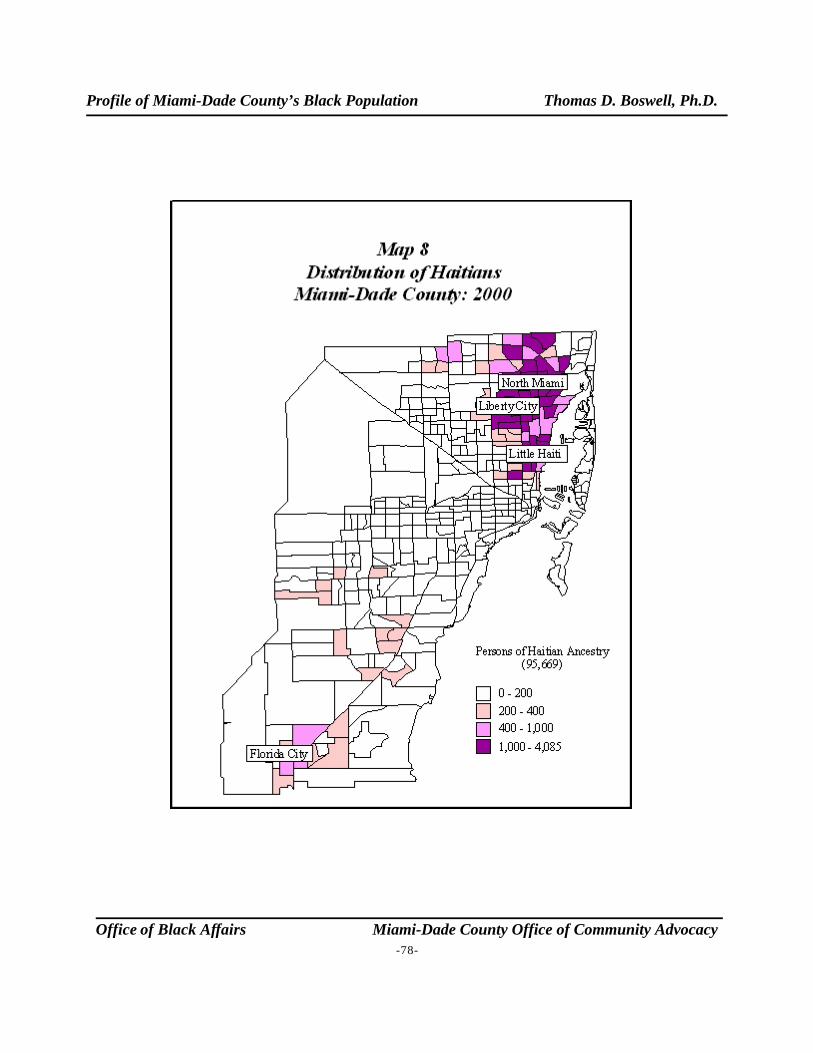
Profile of Miami-Dade County’s Black Population Thomas D. Boswell, Ph.D.
Office of Black Affairs Miami-Dade County Office of Community Advocacy-78-
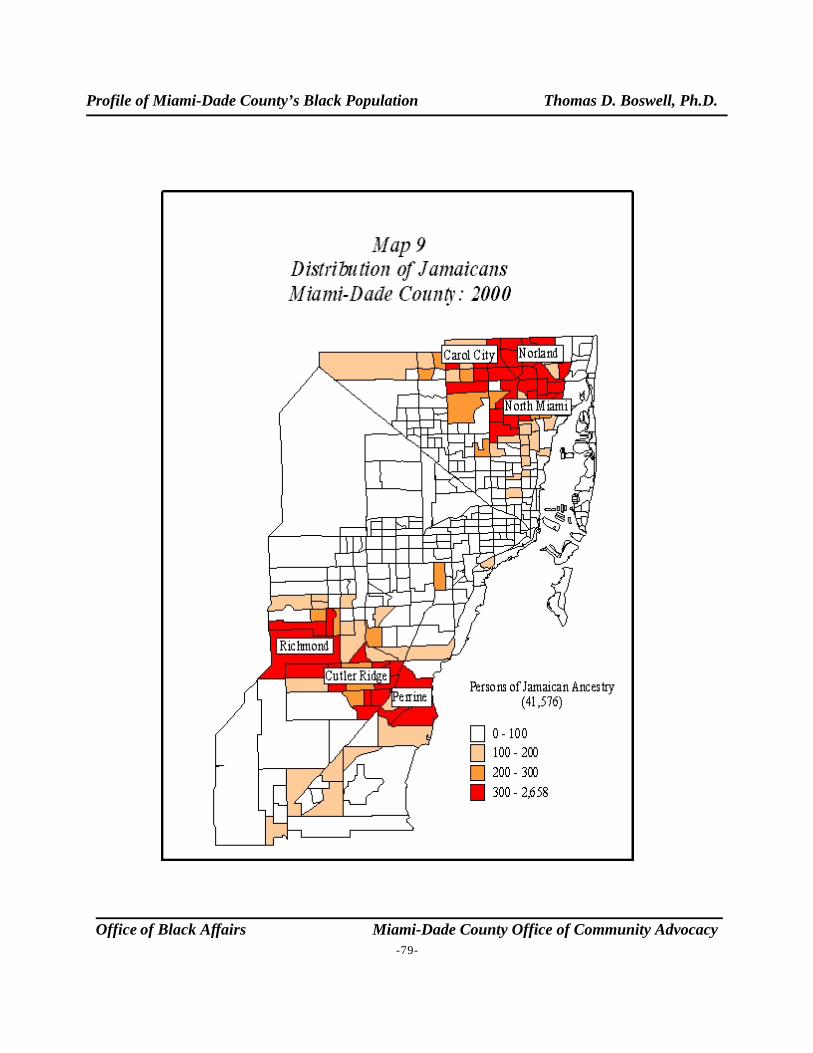
Profile of Miami-Dade County’s Black Population Thomas D. Boswell, Ph.D.
Office of Black Affairs Miami-Dade County Office of Community Advocacy-79-
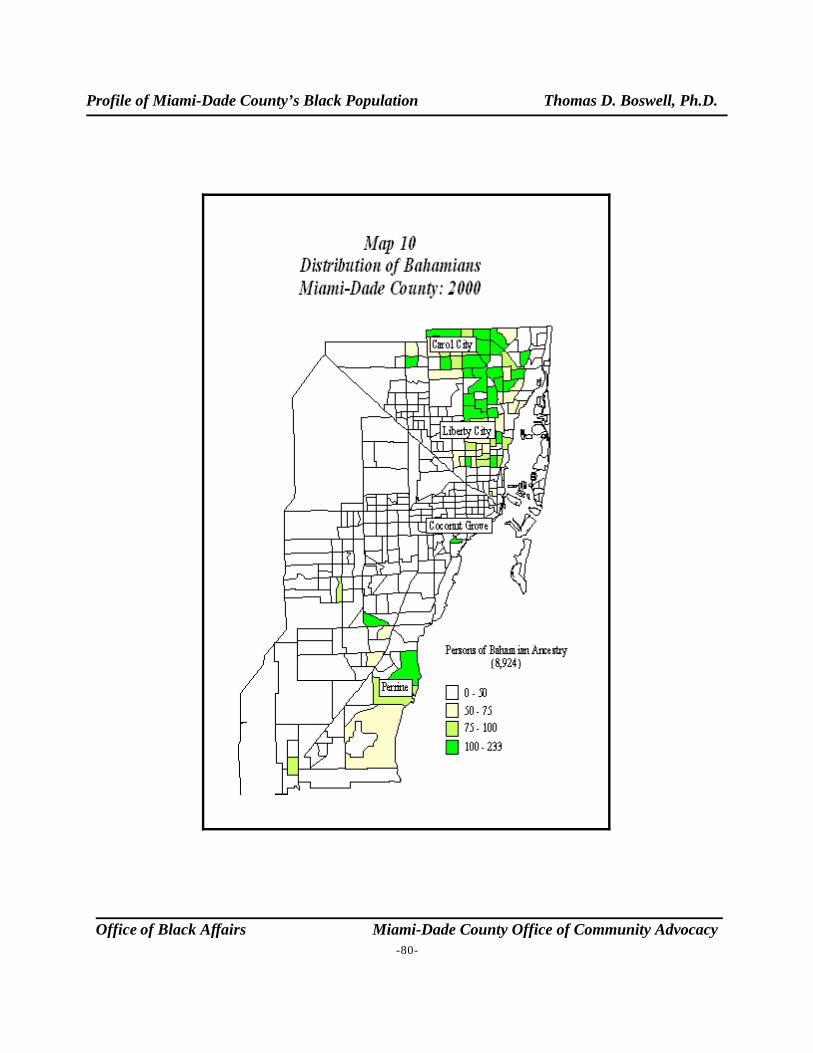
Profile of Miami-Dade County’s Black Population Thomas D. Boswell, Ph.D.
Office of Black Affairs Miami-Dade County Office of Community Advocacy-80-
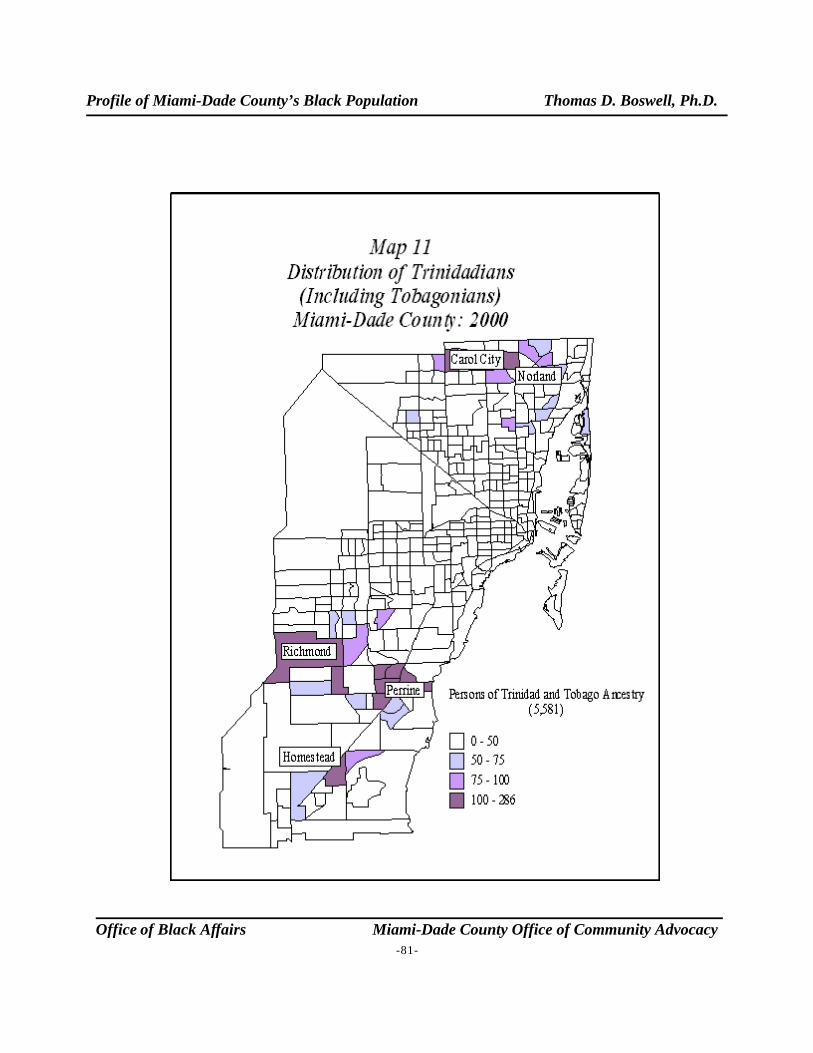
Profile of Miami-Dade County’s Black Population Thomas D. Boswell, Ph.D.
Office of Black Affairs Miami-Dade County Office of Community Advocacy-81-
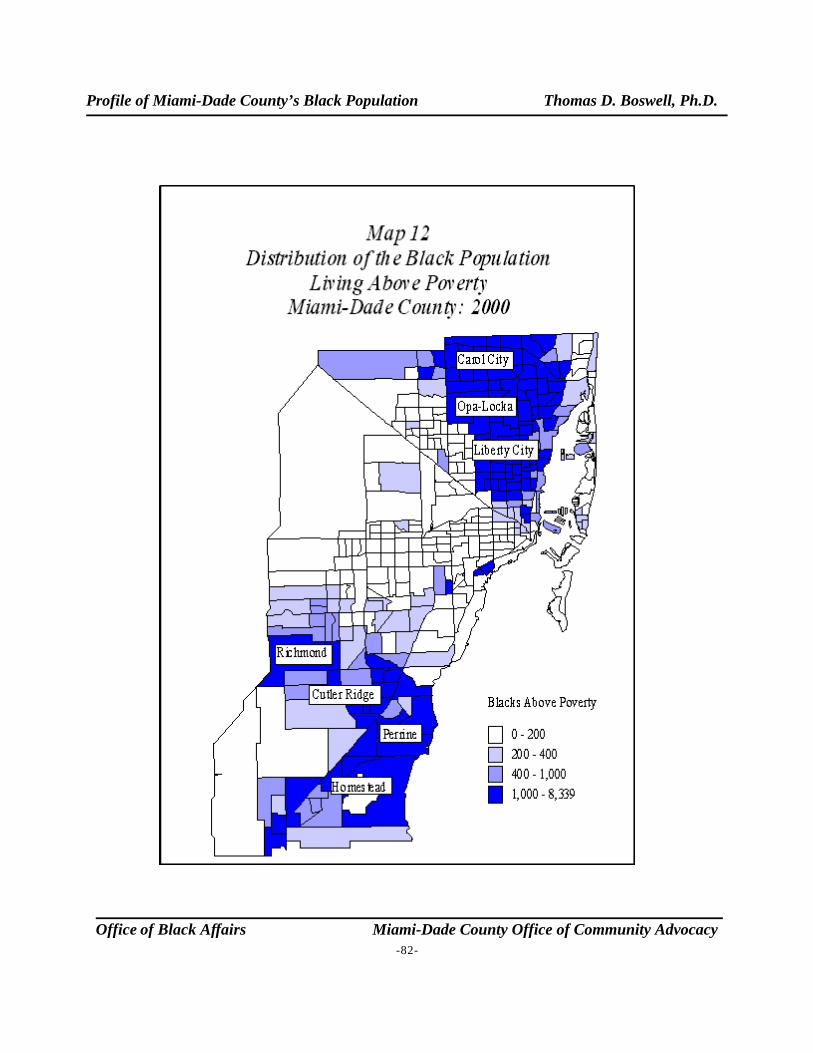
Profile of Miami-Dade County’s Black Population Thomas D. Boswell, Ph.D.
Office of Black Affairs Miami-Dade County Office of Community Advocacy-82-
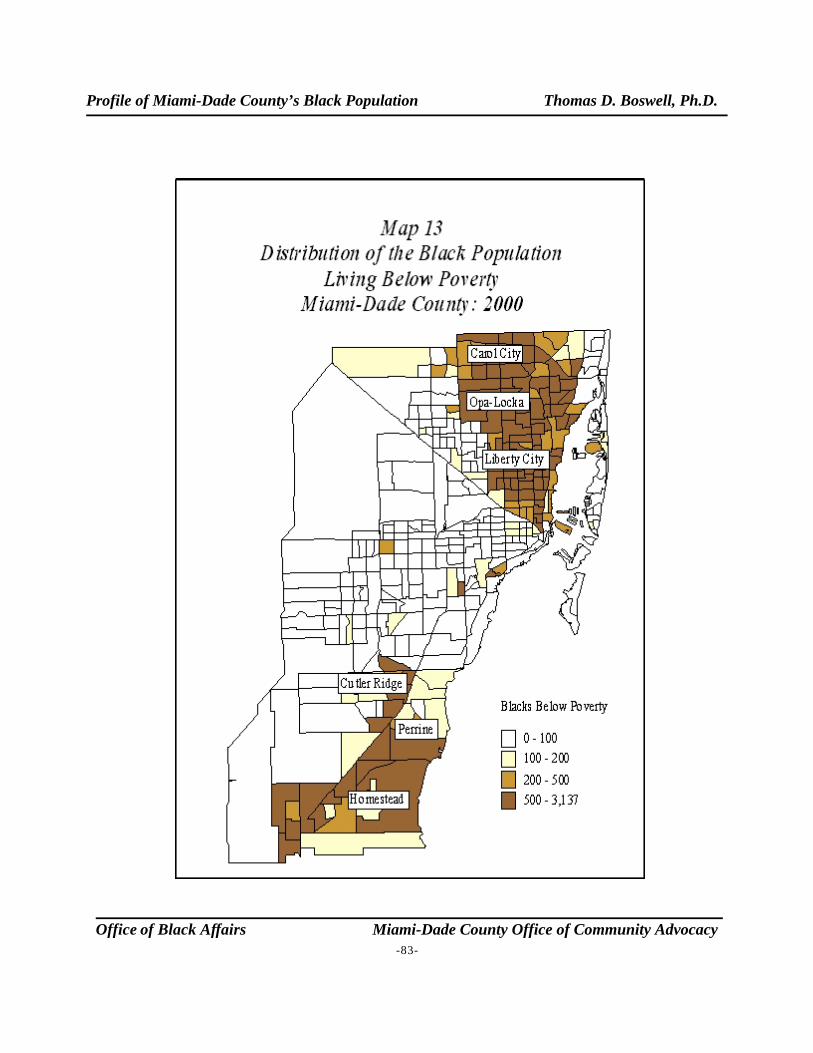
Profile of Miami-Dade County’s Black Population Thomas D. Boswell, Ph.D.
Office of Black Affairs Miami-Dade County Office of Community Advocacy-83-
Profile of Miami-Dade County’s Black Population Thomas D. Boswell, Ph.D.
Office of Black Affairs Miami-Dade County Office of Community Advocacy-84-
CHAPTER 7
The Socioeconomic Status of Blacks and Black Subgroupsin Miami-Dade County
The purpose of this chapter is to determine the socioeconomic status (SES) of Blacksrelative to that of Hispanics and Non-Hispanic Whites in Miami-Dade County and then todeconstruct the Black population into its several subgroups. When performing this latter function, the Black population was divided into Non-Hispanic Blacks, Hispanic Blacks, Black West Indians,Haitains, Jamaicans, Other West Indians, Bahamians, Trinidadians, Black Cubans, BlackDominicans, and Blacks born in Africa and living in Greater Miami. Our goal is to demonstratethe diversity that exists within Miami’s Black community, and to emphasize that Miami’s Blacksare comprised, in some respects, of several distinct populations.
It should be noted that socioeconomic status is a multiple-variable concept. A person’sSES is determined by his/her income, education level, and type of job. This chapter displays thesethree sets of variables in tables for Blacks, Hispanics, NHWs, and the various subgroups of Blacksliving in metropolitan Miami.
Blacks Compared to Hispanics and Non-Hispanic Whites In Chapter 2 of this report the education levels, incomes, and occupations of Blacks living
in Miami-Dade County were compared to those of Hispanics and Non-Hispanic Whites, so thesedifferences will be only very briefly covered in this section of this chapter. The figures in Table 27and Charts 10 and 11 show that by virtually any measure of educational achievement, occupationtype, or income it is clear that Blacks are more disadvantaged than Hispanics and NHWs. Blackshave a lower percentage obtaining college degrees, a higher percentage employed in the servicessector (a reflection of their concentration in government-provided jobs), lower average incomes,and a higher percentage living in poverty.
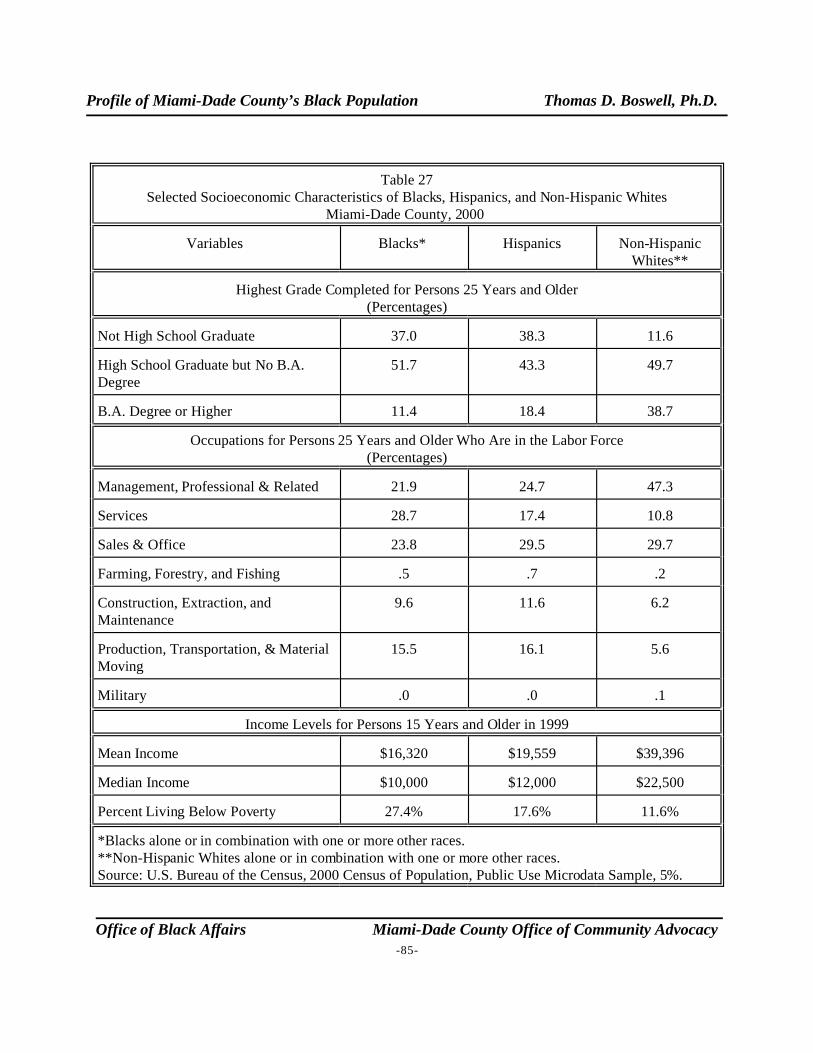
Profile of Miami-Dade County’s Black Population Thomas D. Boswell, Ph.D.
Office of Black Affairs Miami-Dade County Office of Community Advocacy-85-
Table 27Selected Socioeconomic Characteristics of Blacks, Hispanics, and Non-Hispanic Whites
Miami-Dade County, 2000
Variables Blacks* Hispanics Non-HispanicWhites**
Highest Grade Completed for Persons 25 Years and Older(Percentages)
Not High School Graduate 37.0 38.3 11.6
High School Graduate but No B.A.Degree
51.7 43.3 49.7
B.A. Degree or Higher 11.4 18.4 38.7
Occupations for Persons 25 Years and Older Who Are in the Labor Force(Percentages)
Management, Professional & Related 21.9 24.7 47.3
Services 28.7 17.4 10.8
Sales & Office 23.8 29.5 29.7
Farming, Forestry, and Fishing .5 .7 .2
Construction, Extraction, andMaintenance
9.6 11.6 6.2
Production, Transportation, & MaterialMoving
15.5 16.1 5.6
Military .0 .0 .1
Income Levels for Persons 15 Years and Older in 1999
Mean Income $16,320 $19,559 $39,396
Median Income $10,000 $12,000 $22,500
Percent Living Below Poverty 27.4% 17.6% 11.6%
*Blacks alone or in combination with one or more other races.**Non-Hispanic Whites alone or in combination with one or more other races. Source: U.S. Bureau of the Census, 2000 Census of Population, Public Use Microdata Sample, 5%.
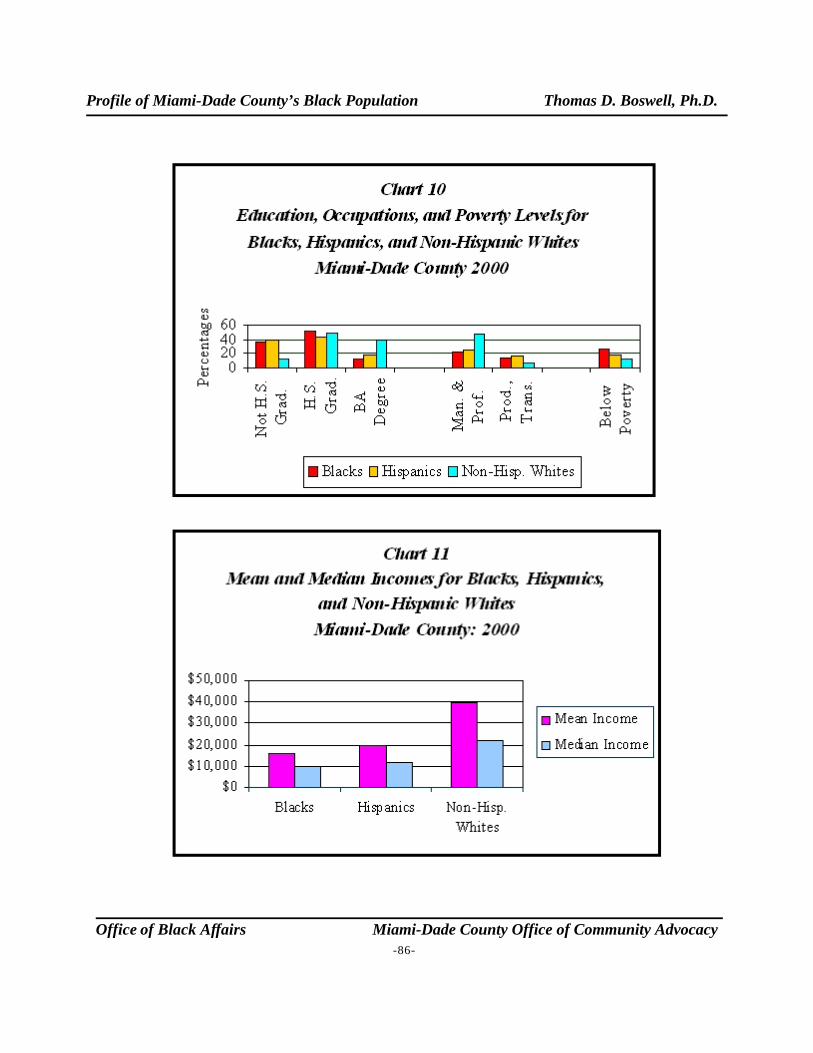
Profile of Miami-Dade County’s Black Population Thomas D. Boswell, Ph.D.
Office of Black Affairs Miami-Dade County Office of Community Advocacy-86-
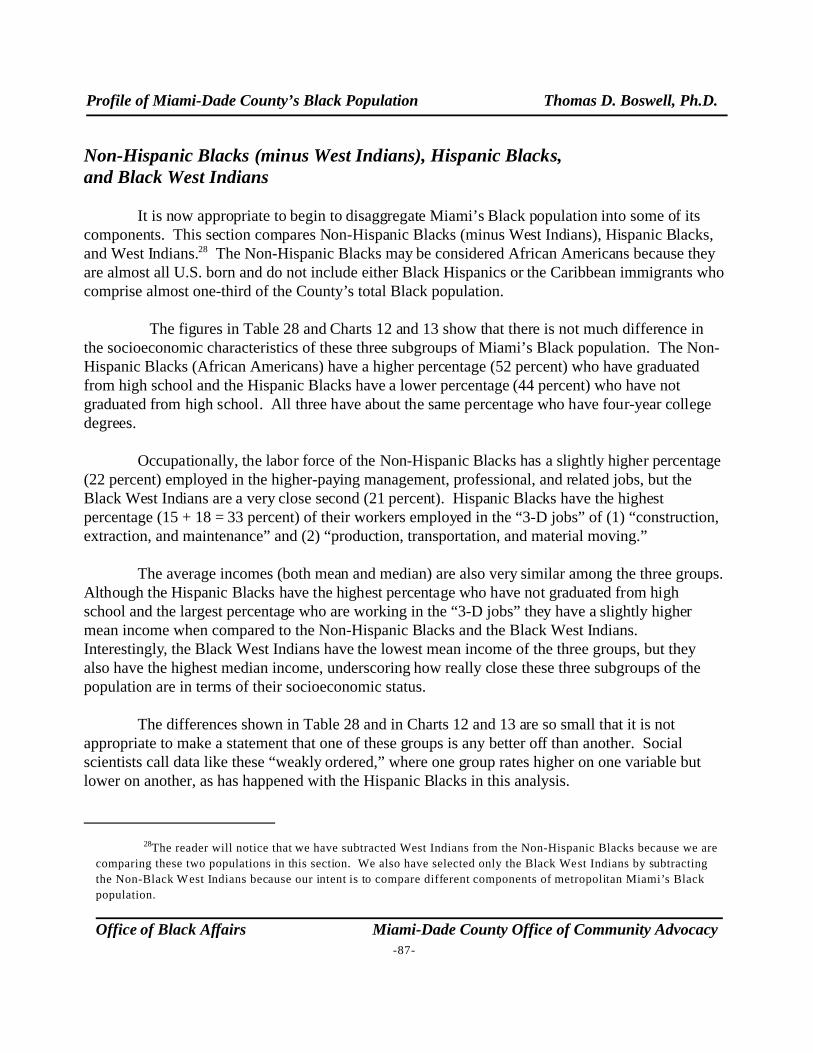
Profile of Miami-Dade County’s Black Population Thomas D. Boswell, Ph.D.
28The reader will notice that we have subtracted West Indians from the Non-Hispanic Blacks because we are
comparing these two populations in this section. We also have selected only the Black West Indians by subtracting
the Non-Black West Indians because our intent is to compare different components of metropolitan Miami’s Black
population.
Office of Black Affairs Miami-Dade County Office of Community Advocacy-87-
Non-Hispanic Blacks (minus West Indians), Hispanic Blacks, and Black West Indians
It is now appropriate to begin to disaggregate Miami’s Black population into some of itscomponents. This section compares Non-Hispanic Blacks (minus West Indians), Hispanic Blacks,and West Indians.28 The Non-Hispanic Blacks may be considered African Americans because theyare almost all U.S. born and do not include either Black Hispanics or the Caribbean immigrants whocomprise almost one-third of the County’s total Black population.
The figures in Table 28 and Charts 12 and 13 show that there is not much difference inthe socioeconomic characteristics of these three subgroups of Miami’s Black population. The Non-Hispanic Blacks (African Americans) have a higher percentage (52 percent) who have graduatedfrom high school and the Hispanic Blacks have a lower percentage (44 percent) who have notgraduated from high school. All three have about the same percentage who have four-year collegedegrees.
Occupationally, the labor force of the Non-Hispanic Blacks has a slightly higher percentage(22 percent) employed in the higher-paying management, professional, and related jobs, but theBlack West Indians are a very close second (21 percent). Hispanic Blacks have the highestpercentage (15 + 18 = 33 percent) of their workers employed in the “3-D jobs” of (1) “construction,extraction, and maintenance” and (2) “production, transportation, and material moving.”
The average incomes (both mean and median) are also very similar among the three groups. Although the Hispanic Blacks have the highest percentage who have not graduated from highschool and the largest percentage who are working in the “3-D jobs” they have a slightly highermean income when compared to the Non-Hispanic Blacks and the Black West Indians. Interestingly, the Black West Indians have the lowest mean income of the three groups, but theyalso have the highest median income, underscoring how really close these three subgroups of thepopulation are in terms of their socioeconomic status.
The differences shown in Table 28 and in Charts 12 and 13 are so small that it is notappropriate to make a statement that one of these groups is any better off than another. Socialscientists call data like these “weakly ordered,” where one group rates higher on one variable butlower on another, as has happened with the Hispanic Blacks in this analysis.
Profile of Miami-Dade County’s Black Population Thomas D. Boswell, Ph.D.
29This income is expressed as per capita purchasing power parity and comes from the Population Reference
Bureau, 2006 World Population Data Sheet, Washington, D.C., 2006.
Office of Black Affairs Miami-Dade County Office of Community Advocacy-88-
Haitian Blacks, Jamaican Blacks, and Other West Indian Blacks
It was surprising to find that West Indian Blacks did not fare better in the comparisons withNon-Hispanic Blacks and Hispanic Blacks. There seems to be a perception among Miami’sgeneral population that West Indians have been an economically successful group, more so thanBlacks in general. So, it was decided to disaggregate the West Indian Blacks into their two largestcomponents, Haitians and Jamaicans. When this was done, it was found that the lowersocioeconomic status of the Haitians drew down very significantly the SES of all West Indianswhen aggregated together.
Table 29 and Charts 14 and 15 demonstrate the lower status of Haitians in Miami-DadeCounty. They have by far the highest percentage who have not graduated from high school and thelowest percentage who have graduated from college with a B.A. degree. Occupationally the story isthe same. Haitians have the lowest percentage in the higher paying management and professionaljobs and the highest percentage employed in the “3-D jobs.” They also have the lowest mean andmedian incomes and the highest percentage living in families with incomes below the poverty level.
In casual conversations with West Indians and Haitians living in Metropolitan Miami wehave found that there is no general agreement as to whether Haitians should be included in thecategory of West Indians. Some people say they should be included with the other West Indians. And others say they should not be included because they come from a distinctly different culturethan the rest of Miami’s West Indians, most of whom come from English-speaking islands. Thedifferences in SES this report has found seem to lend further evidence to the latter opinion, thatHaitians should be considered in a separate from the rest of the West Indians.
It should not be surprising that Haitians have lower socioeconomic status than the WestIndians in general because Haiti is by far the poorest country in the Western Hemisphere. In 2006its per capita income was a mere $1,840 and 78 percent of its population lived on an expenditure ofless than $2 per day. The country with the next lowest income in the Caribbean is Jamaica, and itsincome is ($4,110) more than twice that of Haiti.29
It is relevant now to compare the SES of Black Jamaicans in Table 29 with that of Non-Hispanic Blacks minus West Indians (African Americans) in Table 28. When this is done, it isobvious that Jamaicans have excelled to a higher degree. The income levels of Jamaicans arehigher; they have somewhat higher occupational status; their mean and median incomes are higher;and their poverty levels are substantially lower. The same results are found when comparing the
Profile of Miami-Dade County’s Black Population Thomas D. Boswell, Ph.D.
30Our data for Bahamians and Trinidadians come from Summary Tape File 4 of the 2000 Population
Census. We decided not to use the Public Use Sample file (like we d id with the rest of the comparisons in this
section of Chapter 7) because our samples of these two populations were too small to be statistically reliable.
Office of Black Affairs Miami-Dade County Office of Community Advocacy-89-
SES of the “Other West Indian Blacks” sub-population in Table 29 with the African Americans. This is more the expected pattern, but before jumping to conclusions about this there is a need tolook in more detail at some of the other West Indian groups as well.
Bahamians and Trinidadians
Both Bahamians and Trinidadians have done well in terms of their SES in Metropolitan Miami (Table 30 and Charts 16 and 17). Because the figures in Table 30 come from a differentsource they are not strictly comparable (particularly the income figures) to the figures in Tables 27-29 and 31 and 32, but the are similar enough so they are better than nothing.30 Still, it is clear thatthe Trinidadians have done especially well. They have higher education levels, higher occupationalstatus, and higher incomes than Bahamians, but both Trinidadians and Bahamians have done well incomparison with other groups of Blacks living in Miami, including African Americans (Non-Hispanic Blacks minus West Indians), Haitians, and Jamaicans. Again, the SES of these twogroups, like Jamaicans and the “Other West Indians,” suggest that West Indians (minus Haitians)have done very well climbing the socioeconomic ladder in Greater Miami, better than Non-HispanicBlacks minus West Indians (African Americans) and Hispanic Blacks.
Black Cubans, Non-Black Cubans, Black Dominicans, and Non-Black Dominicans
This section compares the SES of Black Cubans with Non-Black Cubans and BlackDominicans with Non-Black Dominicans to determine if there is an effect of race on Cubans andDominicans living in Metropolitan Miami. Then Black Cubans and Black Dominicans arecompared with Non-Hispanic Blacks (African Americans) and West Indians to see how theycompare within Miami-Dade County’s Black community.
The figures in Table 31 and in Charts 18 and 19 show clearly that Black Cubans are not aswell off as Non-Black Cubans by virtually any measure. The Black Cubans have lowereducational achievement levels, lower occupational status, lower mean and median incomes, and ahigher percentage living in poverty.
On the other hand, there is not much of a difference in SES terms between BlackDominicans and Non-Black Dominicans. The Non-Black Dominicans are perhaps a little betteroff, but the difference is slight. For example, Black Dominicans have a higher mean income thanNon-Black Dominicans, but they also have a lower median income. Black Dominicans seem to be
Profile of Miami-Dade County’s Black Population Thomas D. Boswell, Ph.D.
31U.S. Bureau of the Census, 2000 Census of Population, “Place of Birth by Year of Entry by Citizenship
Status for the Foreign-Born Population,” For Blacks Alone or in Combination W ith One or M ore O ther Races,”
Table PCT 48, Summary File 4, 2003.
Office of Black Affairs Miami-Dade County Office of Community Advocacy-90-
better off than the Black Cubans. However, the Non-Black Cubans are better off than the Non-Black Dominicans in terms of their respective socioeconomic statuses.
Black Cubans (Table 31) are poorer in general than Non-Hispanic Blacks (AfricanAmericans), Hispanic Blacks, and Black West Indians (including Haitians) (Table 28). Conversely,Black Dominicans are similar when compared to Non-Hispanic Blacks (African Americans),Hispanic Blacks, and Black West Indians. However, it is important to note that when Haitians areremoved from the category of West Indians, then the Black West Indians fare considerablybetter than either the Black Cubans or the Black Dominicans.
African Born Blacks in Miami-Dade County and in the United States
African born Blacks have done well as a group in the United States because they tend tocome from the upper and middle classes within Africa. This is so because poorer Africans canseldom afford to pay for the airfare to fly to the United States. Therefore, it is reasonable to wonderhow well the African born Blacks have progressed in Miami-Dade County. In 2000 there were1,876 Blacks living in the County who were born in Africa.31 The Census Bureau produced verylittle data for these people in their tables derived from the 2000 Census of Population. As aconsequence, it was necessary to rely on data we processed from the five percent Public UseMicrodata Sample from the 2000 Census of Population. The trouble with this sample is that itcontained only 93 people (Table 32). This is too small a sample to be statistically significant. Still, it can be used in this report with a word of caution, to get some hint, at least, of how the Africanborn have fared in Greater Miami. To provide a back-up or cross-check, data for the Black Africanborn population in the United States can be used because the U.S. sample is a much larger sampleand its data are reliable. If the U.S. and Miami African born show similar patterns this lendscredence to results from using our much smaller sample for Miami.
The data in Table 32 and in Charts 20 and 22 imply that African born Blacks have donevery well in metropolitan Miami. They have educational achievement levels that comparefavorably with those of Non-Hispanic Whites and that are considerably above those for Blacks andHispanics in Miami (Table 27). Their occupational structure is also similar to that of the NHWsand higher than for either Hispanics or Blacks. However, their incomes (both mean and median) aresurprisingly well below that of NHWs, but they are substantially higher than for the general Blackpopulation of Miami. Also, their poverty rates are comparable to those of Blacks in general.
Profile of Miami-Dade County’s Black Population Thomas D. Boswell, Ph.D.
Office of Black Affairs Miami-Dade County Office of Community Advocacy-91-
The general conclusion that can be reached with respect to the socioeconomic status ofAfrican born Blacks in Miami is that they are doing quite well when compared to Blacks andHispanics living in the County, but they are somewhat lower in status when compared the NHWpopulation living in Miami, to the extent that the data from the smaller sample for Miami can betrusted. The African born Blacks in Miami are very similar to the County’s West Indian population,particularly the Trinidadians, in terms of their SES development. It should be noted that the data forthe African born Blacks living in the United States generally confirm these results for Miami,although it is apparent from the data in Table 32 that Miami’s African born Blacks are not exactlythe exactly the same as the African born Blacks in United States. The small sample may randomlyinflate somewhat the estimates of the SES variables for African born Blacks living in metropolitanMiami, but there is no certainty about this. Because the African born population in the U.S. is alsoquite successful, we feel safe in inferring that the African born in Miami are doing at least as well asthey are nationally and that means they are doing very well in comparison to African Americansand Hispanics living in Miami.
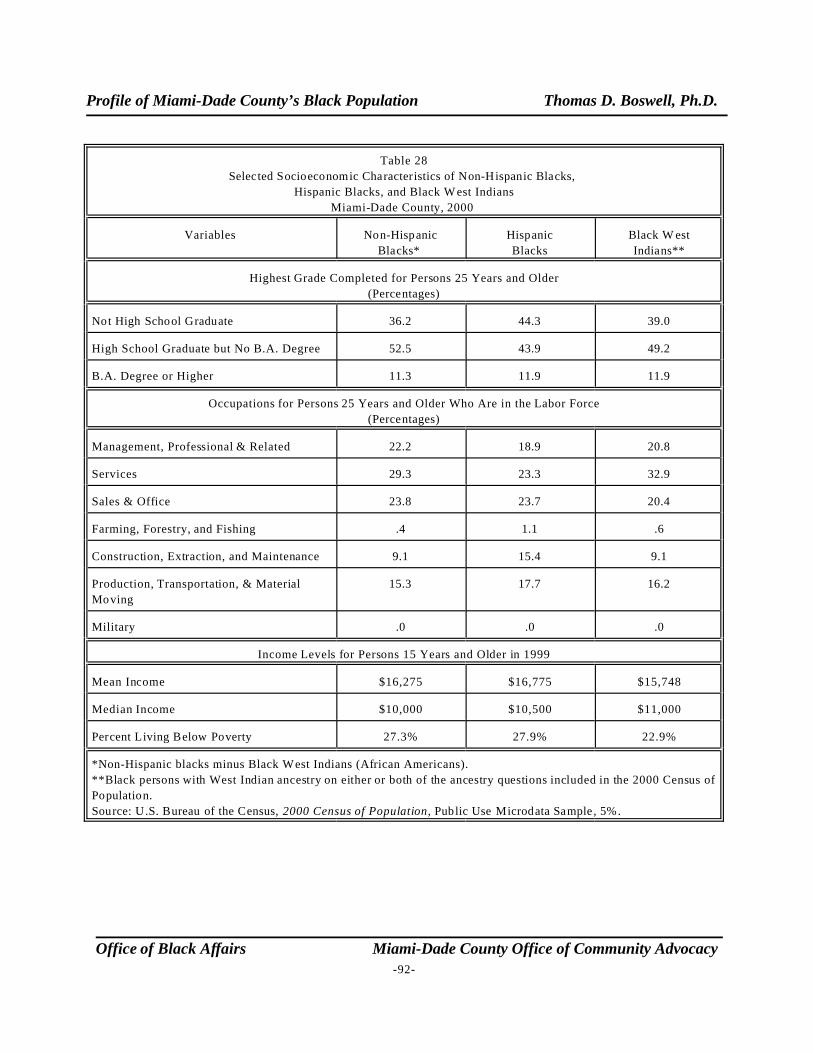
Profile of Miami-Dade County’s Black Population Thomas D. Boswell, Ph.D.
Office of Black Affairs Miami-Dade County Office of Community Advocacy-92-
Table 28
Selected Socioeconomic Characteristics of Non-Hispanic Blacks,
Hispanic Blacks, and Black W est Indians
Miami-Dade County, 2000
Variables Non-Hispanic
Blacks*
Hispanic
Blacks
Black W est
Indians**
Highest Grade Completed for Persons 25 Years and Older
(Percentages)
Not High School Graduate 36.2 44.3 39.0
High School Graduate but No B.A. Degree 52.5 43.9 49.2
B.A. Degree or Higher 11.3 11.9 11.9
Occupations for Persons 25 Years and Older Who Are in the Labor Force
(Percentages)
Management, Professional & Related 22.2 18.9 20.8
Services 29.3 23.3 32.9
Sales & Office 23.8 23.7 20.4
Farming, Forestry, and Fishing .4 1.1 .6
Construction, Extraction, and Maintenance 9.1 15.4 9.1
Production, Transportation, & Material
Moving
15.3 17.7 16.2
Military .0 .0 .0
Income Levels for Persons 15 Years and Older in 1999
Mean Income $16,275 $16,775 $15,748
Median Income $10,000 $10,500 $11,000
Percent Living Below Poverty 27.3% 27.9% 22.9%
*Non-Hispanic blacks minus Black West Indians (African Americans).
**Black persons with West Indian ancestry on either or both of the ancestry questions included in the 2000 Census of
Population.
Source: U.S. Bureau of the Census, 2000 Census of Population, Public Use Microdata Sample, 5%.
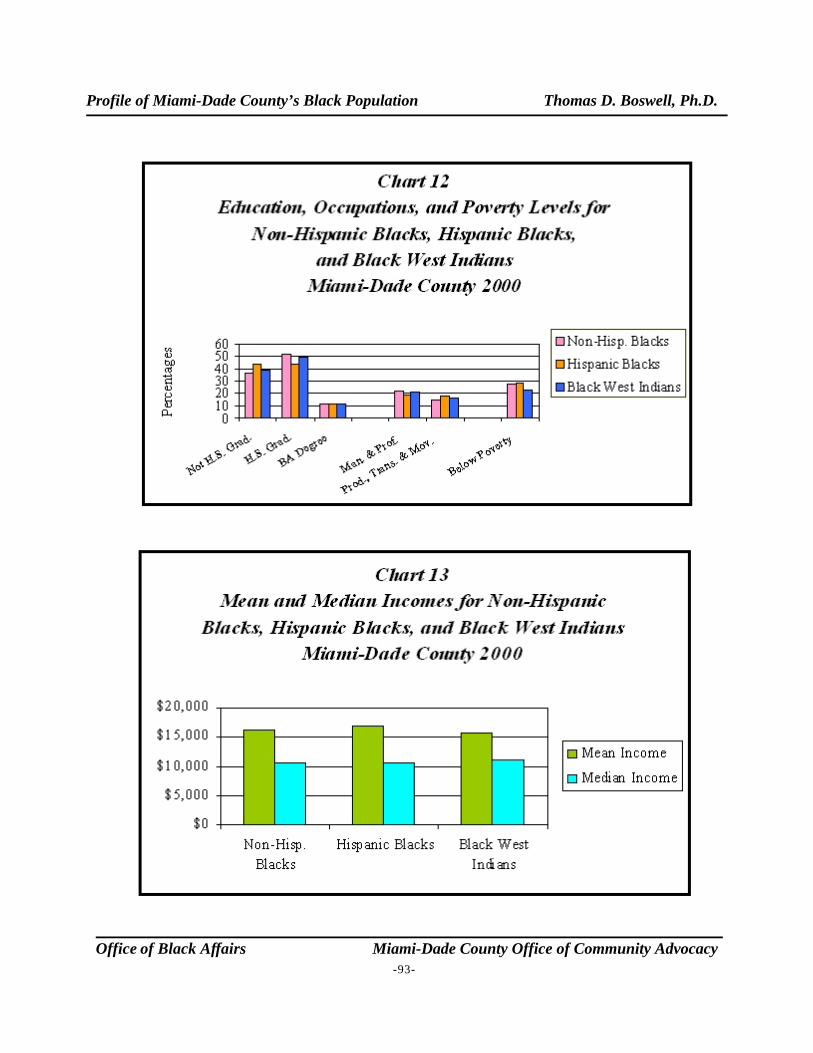
Profile of Miami-Dade County’s Black Population Thomas D. Boswell, Ph.D.
Office of Black Affairs Miami-Dade County Office of Community Advocacy-93-
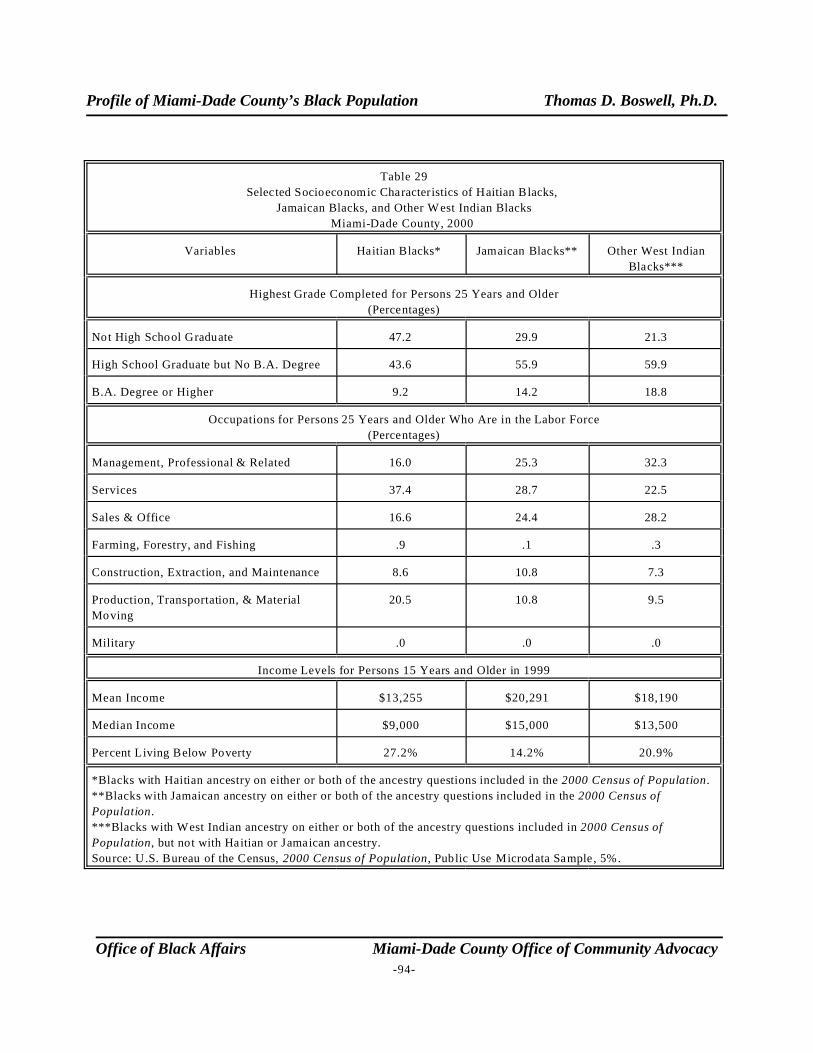
Profile of Miami-Dade County’s Black Population Thomas D. Boswell, Ph.D.
Office of Black Affairs Miami-Dade County Office of Community Advocacy-94-
Table 29
Selected Socioeconomic Characteristics of Haitian Blacks,
Jamaican Blacks, and Other W est Indian Blacks
Miami-Dade County, 2000
Variables Haitian Blacks* Jamaican Blacks** Other West Indian
Blacks***
Highest Grade Completed for Persons 25 Years and Older
(Percentages)
Not High School Graduate 47.2 29.9 21.3
High School Graduate but No B.A. Degree 43.6 55.9 59.9
B.A. Degree or Higher 9.2 14.2 18.8
Occupations for Persons 25 Years and Older Who Are in the Labor Force
(Percentages)
Management, Professional & Related 16.0 25.3 32.3
Services 37.4 28.7 22.5
Sales & Office 16.6 24.4 28.2
Farming, Forestry, and Fishing .9 .1 .3
Construction, Extraction, and Maintenance 8.6 10.8 7.3
Production, Transportation, & Material
Moving
20.5 10.8 9.5
Military .0 .0 .0
Income Levels for Persons 15 Years and Older in 1999
Mean Income $13,255 $20,291 $18,190
Median Income $9,000 $15,000 $13,500
Percent Living Below Poverty 27.2% 14.2% 20.9%
*Blacks with Haitian ancestry on either or both of the ancestry questions included in the 2000 Census of Population.
**Blacks with Jamaican ancestry on either or both of the ancestry questions included in the 2000 Census of
Population.
***Blacks with West Indian ancestry on either or both of the ancestry questions included in 2000 Census of
Population, but not with Haitian or Jamaican ancestry.
Source: U.S. Bureau of the Census, 2000 Census of Population, Public Use Microdata Sample, 5%.
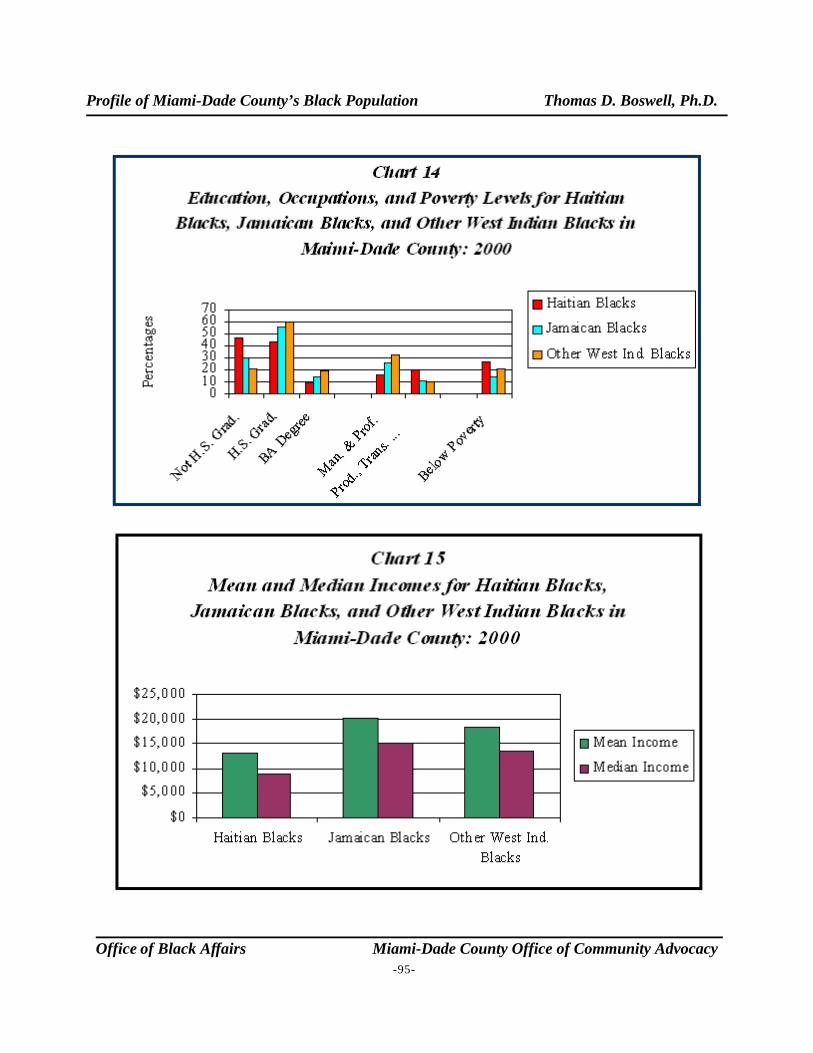
Profile of Miami-Dade County’s Black Population Thomas D. Boswell, Ph.D.
Office of Black Affairs Miami-Dade County Office of Community Advocacy-95-
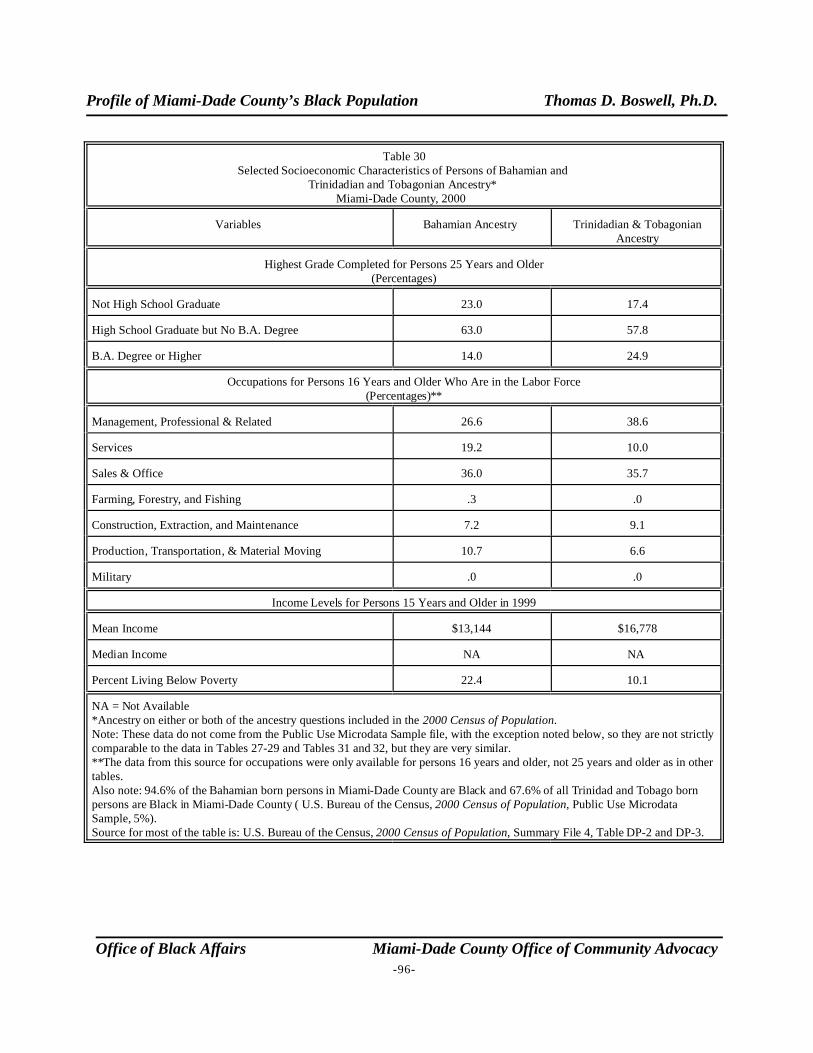
Profile of Miami-Dade County’s Black Population Thomas D. Boswell, Ph.D.
Office of Black Affairs Miami-Dade County Office of Community Advocacy-96-
Table 30Selected Socioeconomic Characteristics of Persons of Bahamian and
Trinidadian and Tobagonian Ancestry* Miami-Dade County, 2000
Variables Bahamian Ancestry Trinidadian & TobagonianAncestry
Highest Grade Completed for Persons 25 Years and Older(Percentages)
Not High School Graduate 23.0 17.4
High School Graduate but No B.A. Degree 63.0 57.8
B.A. Degree or Higher 14.0 24.9
Occupations for Persons 16 Years and Older Who Are in the Labor Force(Percentages)**
Management, Professional & Related 26.6 38.6
Services 19.2 10.0
Sales & Office 36.0 35.7
Farming, Forestry, and Fishing .3 .0
Construction, Extraction, and Maintenance 7.2 9.1
Production, Transportation, & Material Moving 10.7 6.6
Military .0 .0
Income Levels for Persons 15 Years and Older in 1999
Mean Income $13,144 $16,778
Median Income NA NA
Percent Living Below Poverty 22.4 10.1
NA = Not Available*Ancestry on either or both of the ancestry questions included in the 2000 Census of Population.Note: These data do not come from the Public Use Microdata Sample file, with the exception noted below, so they are not strictlycomparable to the data in Tables 27-29 and Tables 31 and 32, but they are very similar.**The data from this source for occupations were only available for persons 16 years and older, not 25 years and older as in othertables. Also note: 94.6% of the Bahamian born persons in Miami-Dade County are Black and 67.6% of all Trinidad and Tobago bornpersons are Black in Miami-Dade County ( U.S. Bureau of the Census, 2000 Census of Population, Public Use MicrodataSample, 5%).Source for most of the table is: U.S. Bureau of the Census, 2000 Census of Population, Summary File 4, Table DP-2 and DP-3.
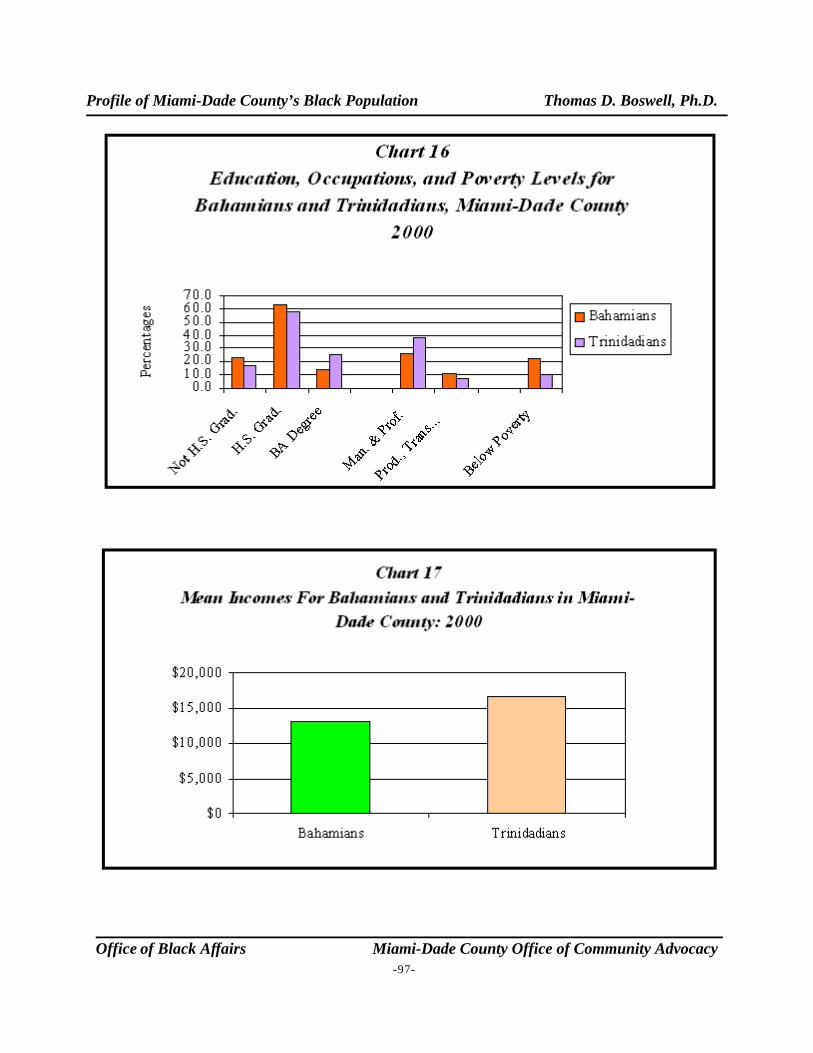
Profile of Miami-Dade County’s Black Population Thomas D. Boswell, Ph.D.
Office of Black Affairs Miami-Dade County Office of Community Advocacy-97-
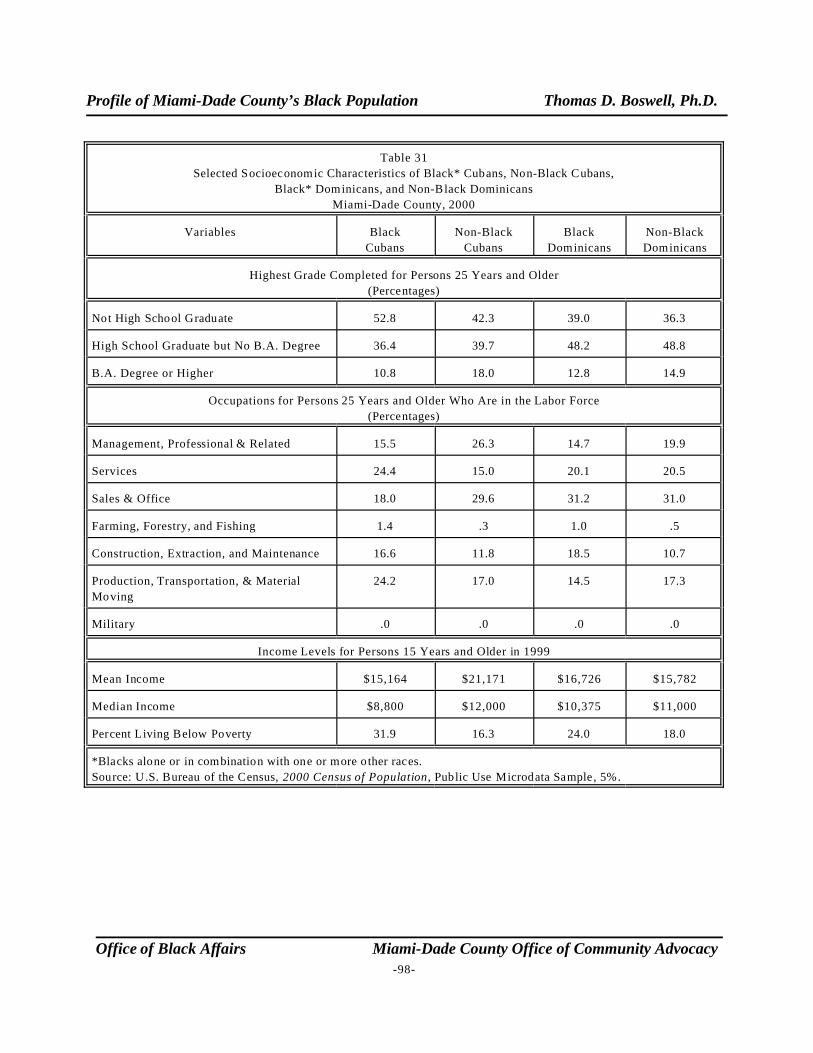
Profile of Miami-Dade County’s Black Population Thomas D. Boswell, Ph.D.
Office of Black Affairs Miami-Dade County Office of Community Advocacy-98-
Table 31
Selected Socioeconomic Characteristics of Black* Cubans, Non-Black Cubans,
Black* Dominicans, and Non-Black Dominicans
Miami-Dade County, 2000
Variables Black
Cubans
Non-Black
Cubans
Black
Dominicans
Non-Black
Dominicans
Highest Grade Completed for Persons 25 Years and Older
(Percentages)
Not High School Graduate 52.8 42.3 39.0 36.3
High School Graduate but No B.A. Degree 36.4 39.7 48.2 48.8
B.A. Degree or Higher 10.8 18.0 12.8 14.9
Occupations for Persons 25 Years and Older Who Are in the Labor Force
(Percentages)
Management, Professional & Related 15.5 26.3 14.7 19.9
Services 24.4 15.0 20.1 20.5
Sales & Office 18.0 29.6 31.2 31.0
Farming, Forestry, and Fishing 1.4 .3 1.0 .5
Construction, Extraction, and Maintenance 16.6 11.8 18.5 10.7
Production, Transportation, & Material
Moving
24.2 17.0 14.5 17.3
Military .0 .0 .0 .0
Income Levels for Persons 15 Years and Older in 1999
Mean Income $15,164 $21,171 $16,726 $15,782
Median Income $8,800 $12,000 $10,375 $11,000
Percent Living Below Poverty 31.9 16.3 24.0 18.0
*Blacks alone or in combination with one or more o ther races.
Source: U.S. Bureau of the Census, 2000 Census of Population, Public Use Microdata Sample, 5%.
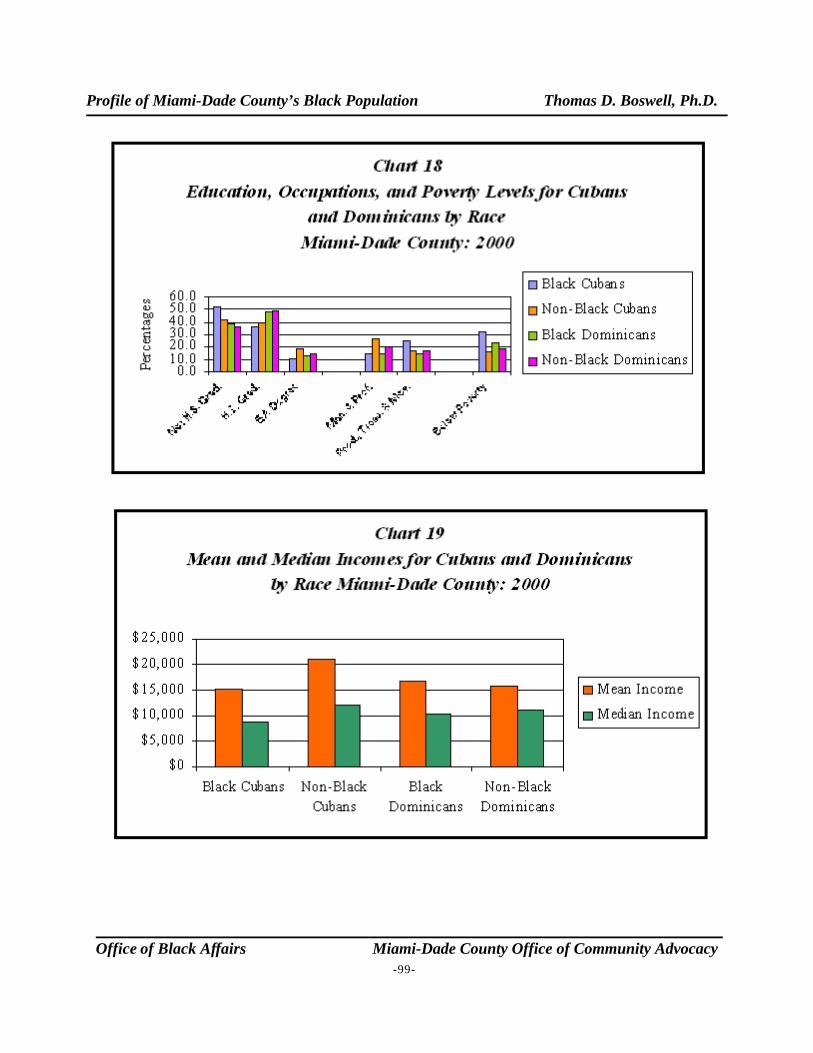
Profile of Miami-Dade County’s Black Population Thomas D. Boswell, Ph.D.
Office of Black Affairs Miami-Dade County Office of Community Advocacy-99-
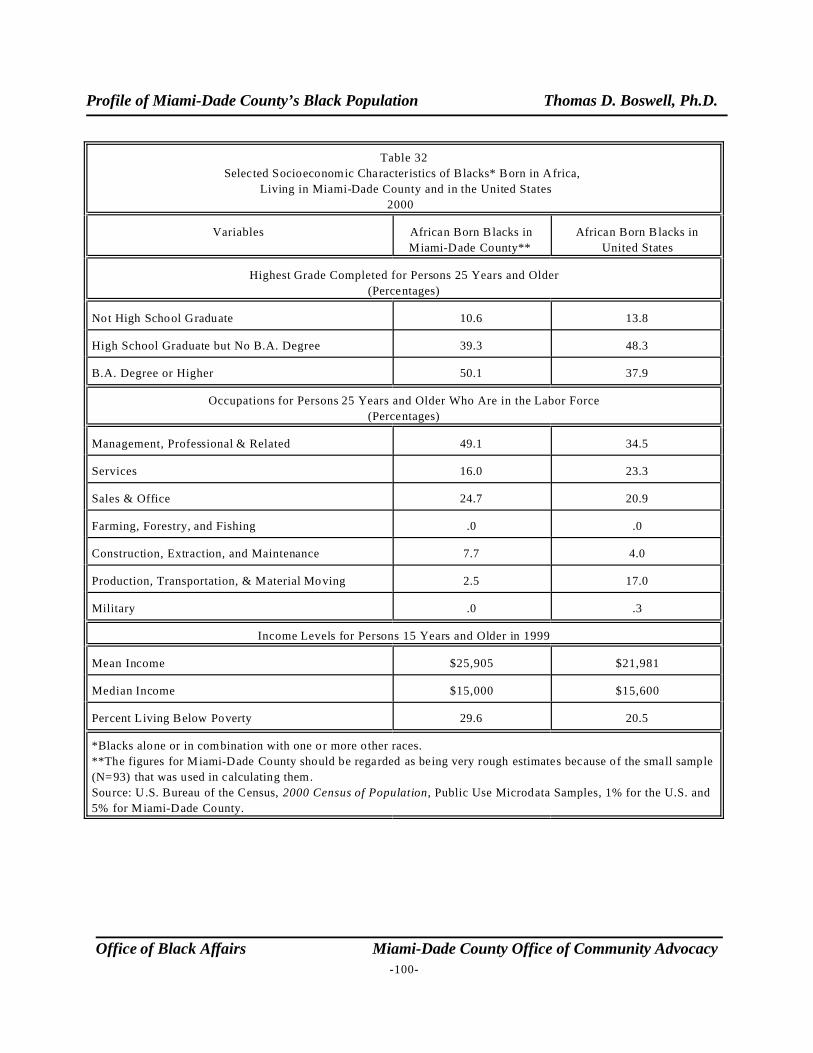
Profile of Miami-Dade County’s Black Population Thomas D. Boswell, Ph.D.
Office of Black Affairs Miami-Dade County Office of Community Advocacy-100-
Table 32
Selected Socioeconomic Characteristics of Blacks* Born in Africa,
Living in Miami-Dade County and in the United States
2000
Variables African Born B lacks in
Miami-Dade County**
African Born B lacks in
United States
Highest Grade Completed for Persons 25 Years and Older
(Percentages)
Not High School Graduate 10.6 13.8
High School Graduate but No B.A. Degree 39.3 48.3
B.A. Degree or Higher 50.1 37.9
Occupations for Persons 25 Years and Older Who Are in the Labor Force
(Percentages)
Management, Professional & Related 49.1 34.5
Services 16.0 23.3
Sales & Office 24.7 20.9
Farming, Forestry, and Fishing .0 .0
Construction, Extraction, and Maintenance 7.7 4.0
Production, Transportation, & Material Moving 2.5 17.0
Military .0 .3
Income Levels for Persons 15 Years and Older in 1999
Mean Income $25,905 $21,981
Median Income $15,000 $15,600
Percent Living Below Poverty 29.6 20.5
*Blacks alone or in combination with one or more o ther races.
**The figures for Miami-Dade County should be regarded as being very rough estimates because of the small sample
(N=93) that was used in calculating them.
Source: U.S. Bureau of the Census, 2000 Census of Population, Public Use Microdata Samples, 1% for the U.S. and
5% for Miami-Dade County.
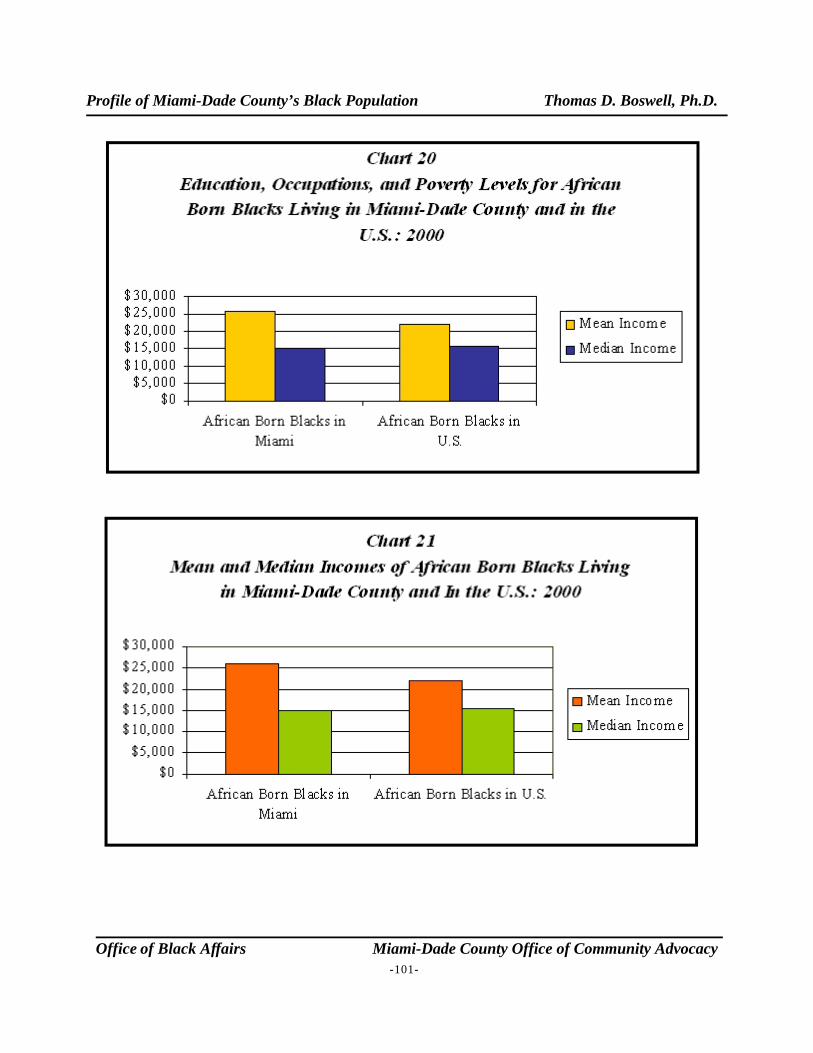
Profile of Miami-Dade County’s Black Population Thomas D. Boswell, Ph.D.
Office of Black Affairs Miami-Dade County Office of Community Advocacy-101-
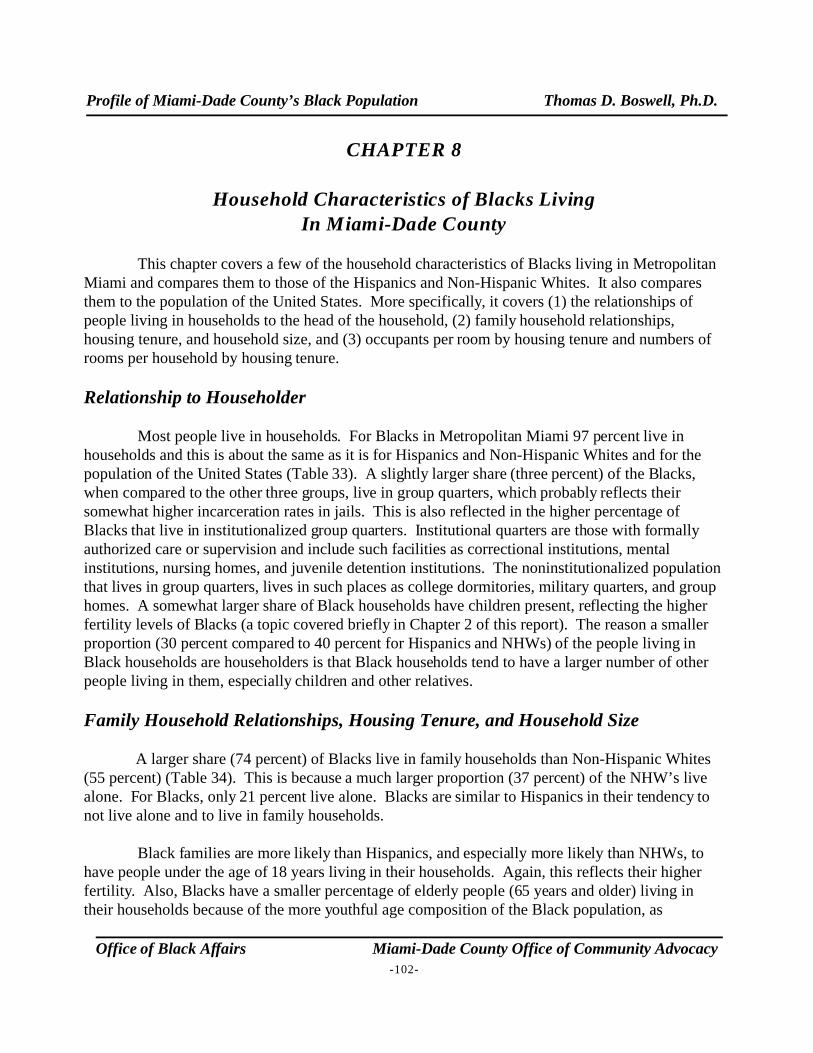
Profile of Miami-Dade County’s Black Population Thomas D. Boswell, Ph.D.
Office of Black Affairs Miami-Dade County Office of Community Advocacy-102-
CHAPTER 8
Household Characteristics of Blacks LivingIn Miami-Dade County
This chapter covers a few of the household characteristics of Blacks living in MetropolitanMiami and compares them to those of the Hispanics and Non-Hispanic Whites. It also comparesthem to the population of the United States. More specifically, it covers (1) the relationships ofpeople living in households to the head of the household, (2) family household relationships, housing tenure, and household size, and (3) occupants per room by housing tenure and numbers ofrooms per household by housing tenure.
Relationship to Householder
Most people live in households. For Blacks in Metropolitan Miami 97 percent live inhouseholds and this is about the same as it is for Hispanics and Non-Hispanic Whites and for thepopulation of the United States (Table 33). A slightly larger share (three percent) of the Blacks,when compared to the other three groups, live in group quarters, which probably reflects theirsomewhat higher incarceration rates in jails. This is also reflected in the higher percentage ofBlacks that live in institutionalized group quarters. Institutional quarters are those with formallyauthorized care or supervision and include such facilities as correctional institutions, mentalinstitutions, nursing homes, and juvenile detention institutions. The noninstitutionalized populationthat lives in group quarters, lives in such places as college dormitories, military quarters, and grouphomes. A somewhat larger share of Black households have children present, reflecting the higherfertility levels of Blacks (a topic covered briefly in Chapter 2 of this report). The reason a smallerproportion (30 percent compared to 40 percent for Hispanics and NHWs) of the people living inBlack households are householders is that Black households tend to have a larger number of otherpeople living in them, especially children and other relatives.
Family Household Relationships, Housing Tenure, and Household Size
A larger share (74 percent) of Blacks live in family households than Non-Hispanic Whites(55 percent) (Table 34). This is because a much larger proportion (37 percent) of the NHW’s livealone. For Blacks, only 21 percent live alone. Blacks are similar to Hispanics in their tendency tonot live alone and to live in family households.
Black families are more likely than Hispanics, and especially more likely than NHWs, tohave people under the age of 18 years living in their households. Again, this reflects their higherfertility. Also, Blacks have a smaller percentage of elderly people (65 years and older) living intheir households because of the more youthful age composition of the Black population, as
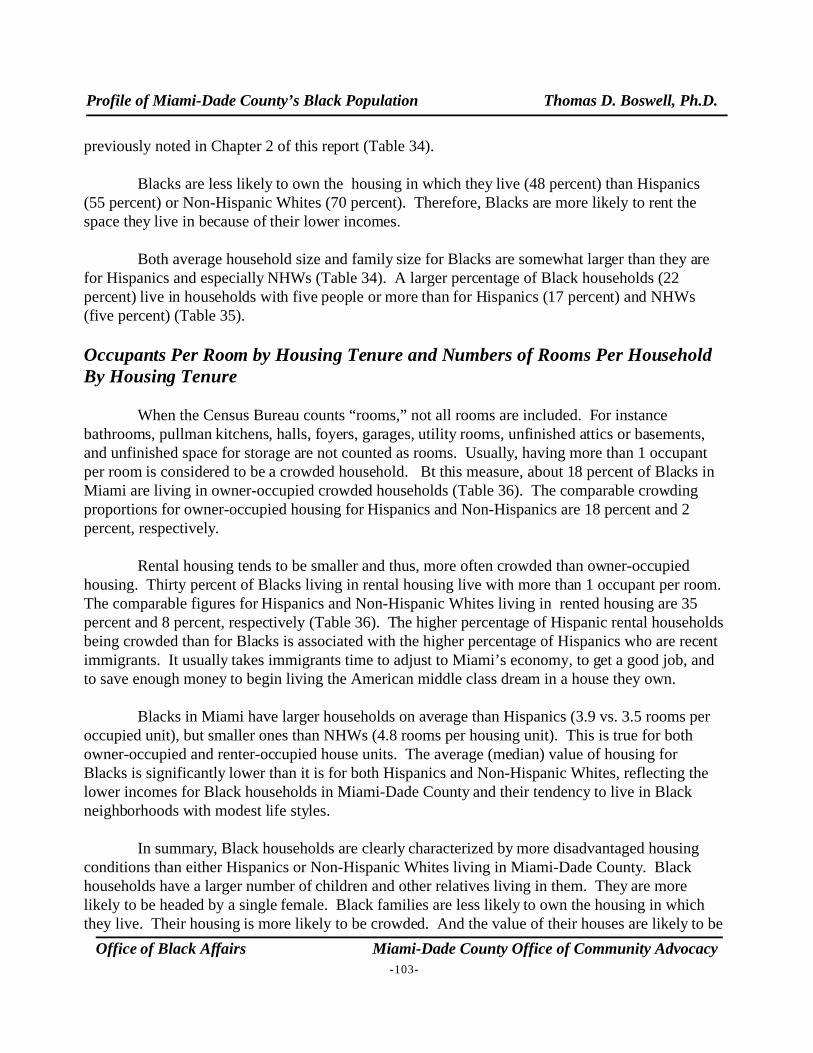
Profile of Miami-Dade County’s Black Population Thomas D. Boswell, Ph.D.
Office of Black Affairs Miami-Dade County Office of Community Advocacy-103-
previously noted in Chapter 2 of this report (Table 34).
Blacks are less likely to own the housing in which they live (48 percent) than Hispanics(55 percent) or Non-Hispanic Whites (70 percent). Therefore, Blacks are more likely to rent thespace they live in because of their lower incomes.
Both average household size and family size for Blacks are somewhat larger than they arefor Hispanics and especially NHWs (Table 34). A larger percentage of Black households (22percent) live in households with five people or more than for Hispanics (17 percent) and NHWs(five percent) (Table 35).
Occupants Per Room by Housing Tenure and Numbers of Rooms Per HouseholdBy Housing Tenure
When the Census Bureau counts “rooms,” not all rooms are included. For instancebathrooms, pullman kitchens, halls, foyers, garages, utility rooms, unfinished attics or basements,and unfinished space for storage are not counted as rooms. Usually, having more than 1 occupantper room is considered to be a crowded household. Bt this measure, about 18 percent of Blacks inMiami are living in owner-occupied crowded households (Table 36). The comparable crowdingproportions for owner-occupied housing for Hispanics and Non-Hispanics are 18 percent and 2percent, respectively.
Rental housing tends to be smaller and thus, more often crowded than owner-occupiedhousing. Thirty percent of Blacks living in rental housing live with more than 1 occupant per room. The comparable figures for Hispanics and Non-Hispanic Whites living in rented housing are 35percent and 8 percent, respectively (Table 36). The higher percentage of Hispanic rental householdsbeing crowded than for Blacks is associated with the higher percentage of Hispanics who are recentimmigrants. It usually takes immigrants time to adjust to Miami’s economy, to get a good job, andto save enough money to begin living the American middle class dream in a house they own.
Blacks in Miami have larger households on average than Hispanics (3.9 vs. 3.5 rooms peroccupied unit), but smaller ones than NHWs (4.8 rooms per housing unit). This is true for both owner-occupied and renter-occupied house units. The average (median) value of housing forBlacks is significantly lower than it is for both Hispanics and Non-Hispanic Whites, reflecting thelower incomes for Black households in Miami-Dade County and their tendency to live in Blackneighborhoods with modest life styles.
In summary, Black households are clearly characterized by more disadvantaged housingconditions than either Hispanics or Non-Hispanic Whites living in Miami-Dade County. Blackhouseholds have a larger number of children and other relatives living in them. They are morelikely to be headed by a single female. Black families are less likely to own the housing in whichthey live. Their housing is more likely to be crowded. And the value of their houses are likely to be
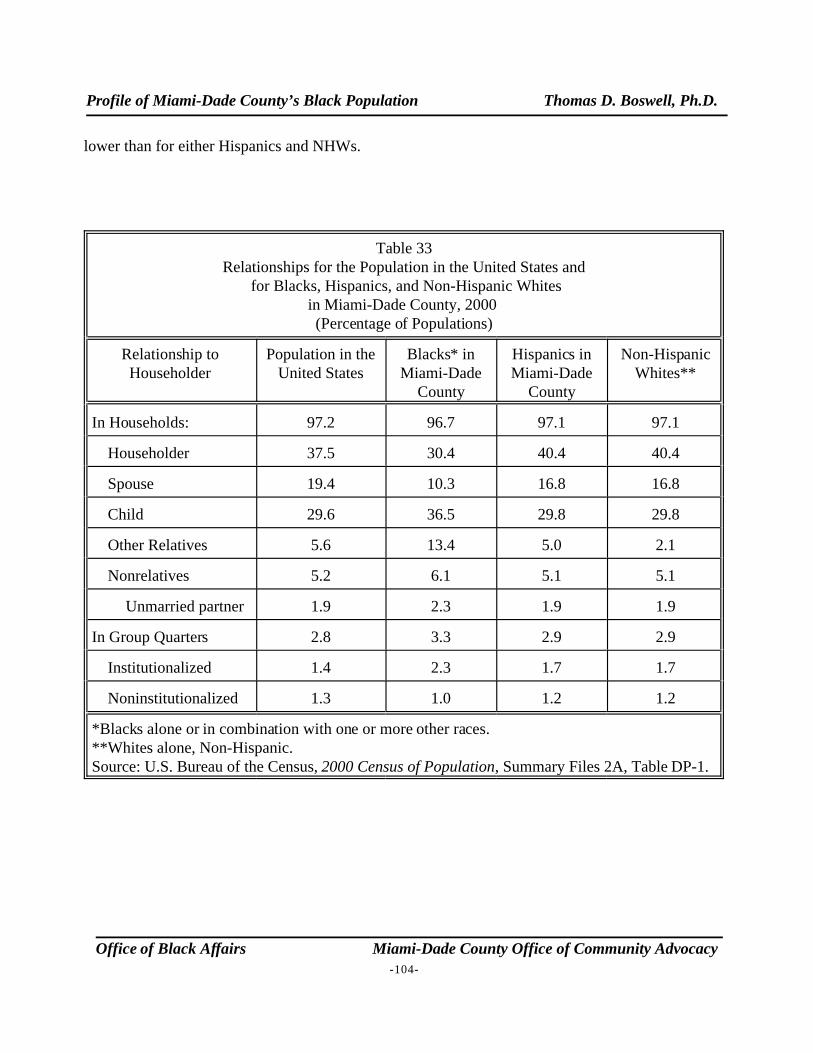
Profile of Miami-Dade County’s Black Population Thomas D. Boswell, Ph.D.
Office of Black Affairs Miami-Dade County Office of Community Advocacy-104-
lower than for either Hispanics and NHWs.
Table 33Relationships for the Population in the United States and
for Blacks, Hispanics, and Non-Hispanic Whitesin Miami-Dade County, 2000 (Percentage of Populations)
Relationship toHouseholder
Population in theUnited States
Blacks* inMiami-Dade
County
Hispanics inMiami-Dade
County
Non-HispanicWhites**
In Households: 97.2 96.7 97.1 97.1
Householder 37.5 30.4 40.4 40.4
Spouse 19.4 10.3 16.8 16.8
Child 29.6 36.5 29.8 29.8
Other Relatives 5.6 13.4 5.0 2.1
Nonrelatives 5.2 6.1 5.1 5.1
Unmarried partner 1.9 2.3 1.9 1.9
In Group Quarters 2.8 3.3 2.9 2.9
Institutionalized 1.4 2.3 1.7 1.7
Noninstitutionalized 1.3 1.0 1.2 1.2
*Blacks alone or in combination with one or more other races.**Whites alone, Non-Hispanic.Source: U.S. Bureau of the Census, 2000 Census of Population, Summary Files 2A, Table DP-1.
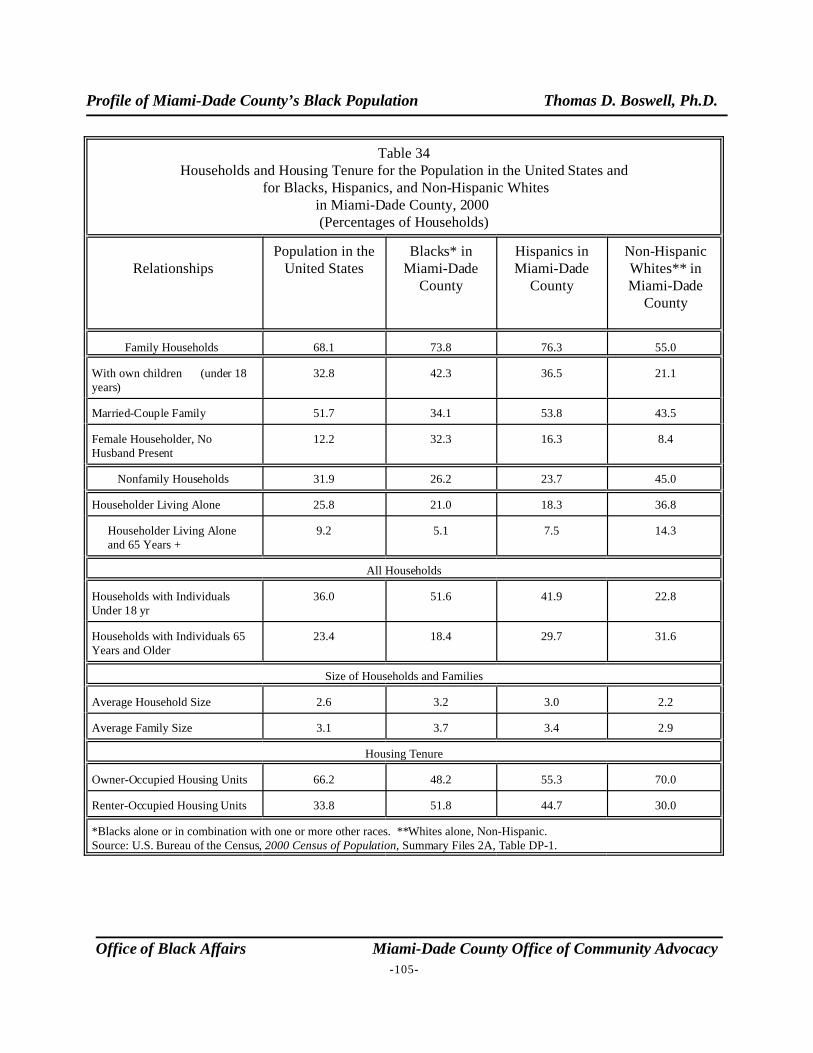
Profile of Miami-Dade County’s Black Population Thomas D. Boswell, Ph.D.
Office of Black Affairs Miami-Dade County Office of Community Advocacy-105-
Table 34Households and Housing Tenure for the Population in the United States and
for Blacks, Hispanics, and Non-Hispanic Whitesin Miami-Dade County, 2000 (Percentages of Households)
RelationshipsPopulation in the
United StatesBlacks* in
Miami-DadeCounty
Hispanics inMiami-Dade
County
Non-HispanicWhites** inMiami-Dade
County
Family Households 68.1 73.8 76.3 55.0
With own children (under 18years)
32.8 42.3 36.5 21.1
Married-Couple Family 51.7 34.1 53.8 43.5
Female Householder, NoHusband Present
12.2 32.3 16.3 8.4
Nonfamily Households 31.9 26.2 23.7 45.0
Householder Living Alone 25.8 21.0 18.3 36.8
Householder Living Aloneand 65 Years +
9.2 5.1 7.5 14.3
All Households
Households with IndividualsUnder 18 yr
36.0 51.6 41.9 22.8
Households with Individuals 65Years and Older
23.4 18.4 29.7 31.6
Size of Households and Families
Average Household Size 2.6 3.2 3.0 2.2
Average Family Size 3.1 3.7 3.4 2.9
Housing Tenure
Owner-Occupied Housing Units 66.2 48.2 55.3 70.0
Renter-Occupied Housing Units 33.8 51.8 44.7 30.0
*Blacks alone or in combination with one or more other races. **Whites alone, Non-Hispanic.Source: U.S. Bureau of the Census, 2000 Census of Population, Summary Files 2A, Table DP-1.
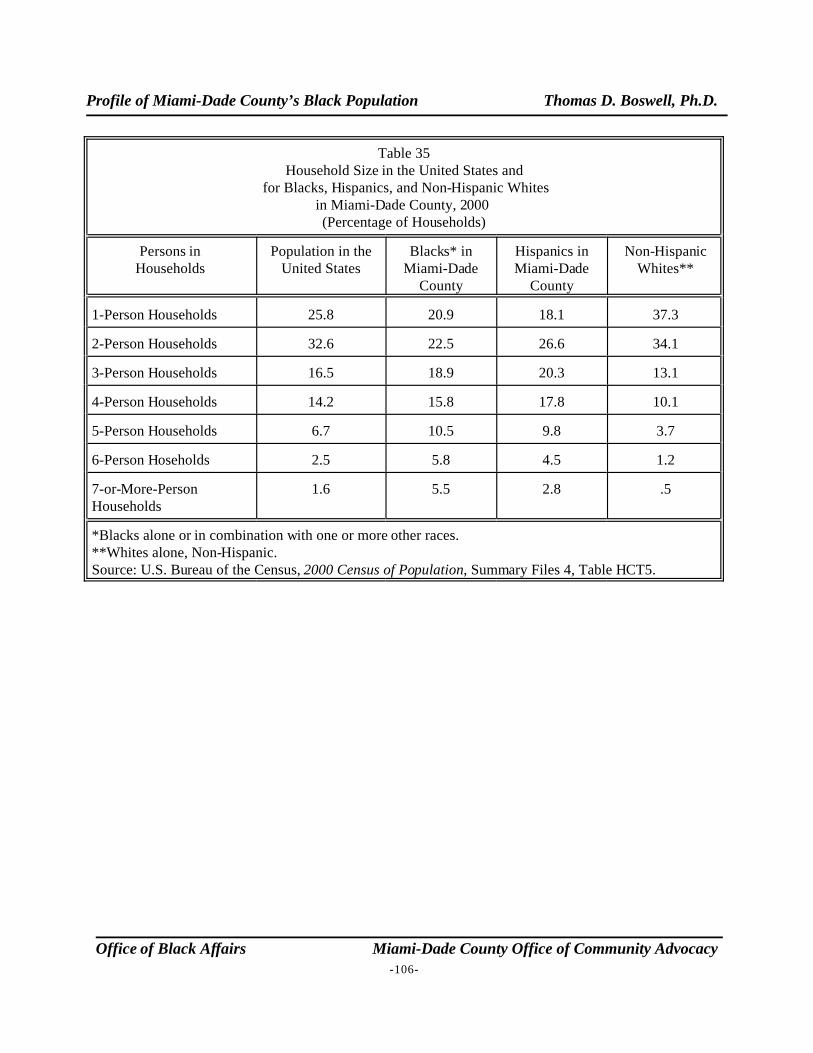
Profile of Miami-Dade County’s Black Population Thomas D. Boswell, Ph.D.
Office of Black Affairs Miami-Dade County Office of Community Advocacy-106-
Table 35Household Size in the United States and
for Blacks, Hispanics, and Non-Hispanic Whitesin Miami-Dade County, 2000 (Percentage of Households)
Persons inHouseholds
Population in theUnited States
Blacks* inMiami-Dade
County
Hispanics inMiami-Dade
County
Non-HispanicWhites**
1-Person Households 25.8 20.9 18.1 37.3
2-Person Households 32.6 22.5 26.6 34.1
3-Person Households 16.5 18.9 20.3 13.1
4-Person Households 14.2 15.8 17.8 10.1
5-Person Households 6.7 10.5 9.8 3.7
6-Person Hoseholds 2.5 5.8 4.5 1.2
7-or-More-PersonHouseholds
1.6 5.5 2.8 .5
*Blacks alone or in combination with one or more other races.**Whites alone, Non-Hispanic.Source: U.S. Bureau of the Census, 2000 Census of Population, Summary Files 4, Table HCT5.
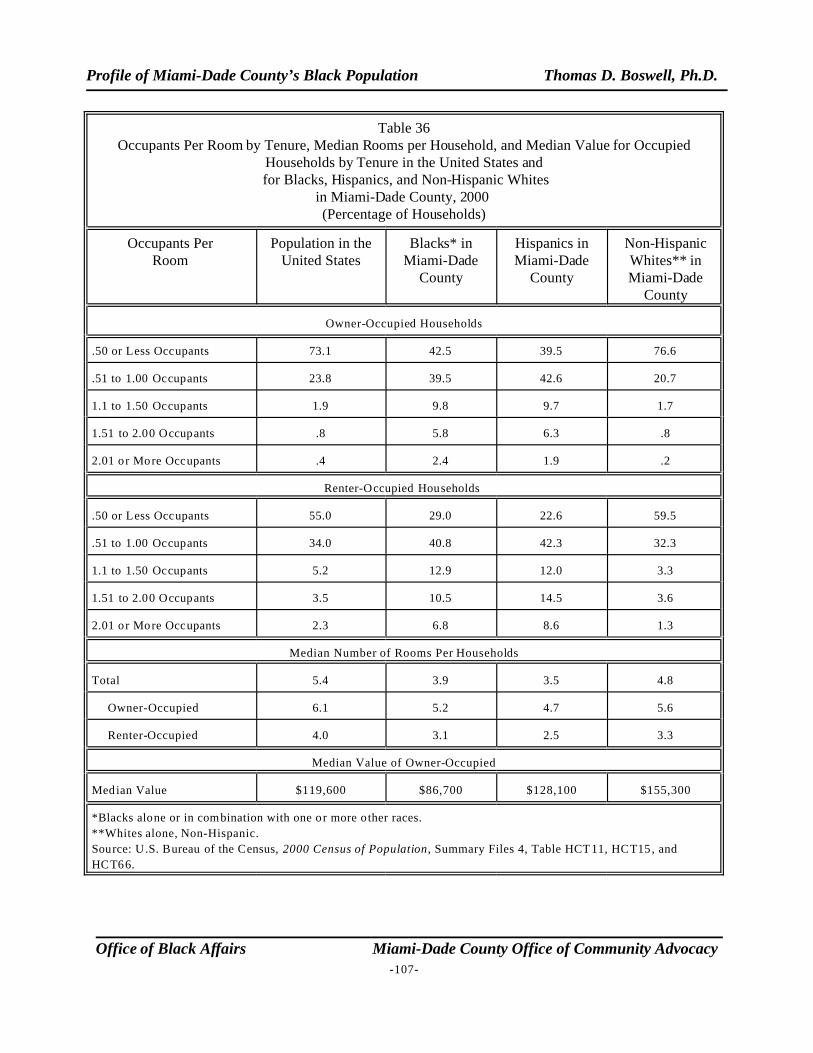
Profile of Miami-Dade County’s Black Population Thomas D. Boswell, Ph.D.
Office of Black Affairs Miami-Dade County Office of Community Advocacy-107-
Table 36Occupants Per Room by Tenure, Median Rooms per Household, and Median Value for Occupied
Households by Tenure in the United States and for Blacks, Hispanics, and Non-Hispanic Whites
in Miami-Dade County, 2000 (Percentage of Households)
Occupants PerRoom
Population in theUnited States
Blacks* inMiami-Dade
County
Hispanics inMiami-Dade
County
Non-HispanicWhites** inMiami-Dade
County
Owner-Occupied Households
.50 or Less Occupants 73.1 42.5 39.5 76.6
.51 to 1.00 Occupants 23.8 39.5 42.6 20.7
1.1 to 1.50 Occupants 1.9 9.8 9.7 1.7
1.51 to 2.00 Occupants .8 5.8 6.3 .8
2.01 or More Occupants .4 2.4 1.9 .2
Renter-Occupied Households
.50 or Less Occupants 55.0 29.0 22.6 59.5
.51 to 1.00 Occupants 34.0 40.8 42.3 32.3
1.1 to 1.50 Occupants 5.2 12.9 12.0 3.3
1.51 to 2.00 Occupants 3.5 10.5 14.5 3.6
2.01 or More Occupants 2.3 6.8 8.6 1.3
Median Number of Rooms Per Households
Total 5.4 3.9 3.5 4.8
Owner-Occupied 6.1 5.2 4.7 5.6
Renter-Occupied 4.0 3.1 2.5 3.3
Median Value of Owner-Occupied
Median Value $119,600 $86,700 $128,100 $155,300
*Blacks alone or in combination with one or more o ther races.
**Whites alone, Non-Hispanic.
Source: U.S. Bureau of the Census, 2000 Census of Population, Summary Files 4, Table HCT 11, HCT15, and
HCT66.
Profile of Miami-Dade County’s Black Population Thomas D. Boswell, Ph.D.
32Thirty-Year Retrospective: The Status of the Black Community in M iami-Dade County, Metropolitan
Center, Florida International University, 2007, p. 307, sponsored by the Metro Miami Action Plan, pp. 89-96.
Office of Black Affairs Miami-Dade County Office of Community Advocacy-108-
CONCLUSIONS FROM THIS REPORT
This report has determined that Blacks living in Miami-Dade County are disadvantaged byvirtually any measure when compared to Hispanics and Non-Hispanic Whites. This finding will notsurprise anybody who lives in South Florida. It is an update of three earlier similar profiles of theCounty’s Black population produced in 1979, 1984, and 1995 by Metropolitan Miami-DadeCounty’s Department of Planning and Zoning. What this report does is document some of thedetails of the situation Blacks find themselves in today. It looks at their population growth withinthe context of a metropolitan area whose racial and ethnic composition has changed more than anyother major metropolitan area in the United States during the past 45 years. As this change hastaken place what has happened to Blacks? Have they kept up with the economic well-being of theother major components of the population or have they fallen further behind.
Whereas this report represents more of a snapshot of Miami’s Black population in 2000,another study just released looked at this population from a 30-year perspective. It developed 16indexes that it followed in 1983, 1993, and 2007. It found that there has been an improvement inseven, no change in four, and a worsening in five. So, the results were mixed. It noted that Blacksstill were significantly disadvantaged when compared to Hispanics and Non-Hispanic Whites inMiami-Dade County.32
So, both studies agree that Blacks have not been able to catch up with the advancementstaking place in the Hispanic and NHW populations of Greater Miami. This is discouraging becausemajor efforts have been made to improve the well-being of Blacks. How could it be that Hispanicshave been able to achieve higher incomes, obtain better jobs, and have better housing than theBlacks living in Miami. The reader may recall that 71 percent of Miami’s Hispanics are immigrants(foreign born) compared to 31 percent of the County’s Blacks. How can immigrants who comepredominantly from Third World Latin American countries, where their native language is notEnglish but Spanish, wind up being better off economically than the County’s Black population,most (69 percent) of whom have lived in the United States all their lives and most of whom speakEnglish as their native language? The answer lies in the selectivity of Miami’s Hispanicimmigrants.
It is an axiom of migration theory that immigration is a selective process. The Hispanicimmigrants who have come to Miami are different from those that have migrated to some other U.S.cities. Miami’s Latin American immigrants come disproportionately from the upper and middleclasses. For example, most of the Cubans and many of the Nicaraguans came from the middle andupper classes because of the Marxist revolutions that occurred in both countries. As a result, it wasthe middle and upper classes that had the most to lose when those revolutions occurred andtherefore they had the greatest incentive to emigrate. The large numbers of the South Americans
Profile of Miami-Dade County’s Black Population Thomas D. Boswell, Ph.D.
Office of Black Affairs Miami-Dade County Office of Community Advocacy-109-
that have come to Miami from such countries as Colombia, Venezuela, and Peru also came mainlyform the middle and upper classes simple because poor people cannot walk or float on a raft toUnited States from these countries and they cannot afford the airfare to fly. Even when Miami’simmigrants arrived from Cuba and Nicaragua as refugees with very little money in their pocketsthey brought “human capital” with them. Many were well educated and had entreprenueral skillsthat helped them “hit the ground running” when they arrived in Miami. They possessedtremendous ambition, had good abilities, and had work experiences that helped them to rapidlyadjust to Miami. In addition, the large Hispanic (Cuban) enclave economy that developed inMetropolitan Miami became a business incubator of sorts for the newly arriving Hispanics. All ofthis served the Latino community of Miami very well and helped it prosper.
Some readers might think that the immigration of Blacks from the Caribbean might be amajor factor in the lowering the SES of Blacks living in Miami. After all, these people also comefrom Third World countries. Furthermore, it has been pointed out in this report that Haitians areespecially poor when compared to the rest of Miami’s population and they comprise almost 60percent of Miami’s West Indian immigrants. Does the poor status of Haitians significantly drawdown the average SES of Miami’s Blacks? Although the data in this report did show that Haitianswere poorer on average than most Blacks, the West Indian immigration (including Haitians) doesnot seem to have significantly affected the SES of Blacks living in Miami. For example, Table 27in this study shows that about 37 percent of Miami’s Blacks over the age of 25 years have notgraduated from high school. When the Black Hispanics and West Indians (most of whom areimmigrants) were removed (Table 28) from the Black population, leaving behind mostly AfricanAmericans, the percentage who had not graduated from high school dropped only one percentagepoint to 36 percent. Similarly, the mean and median incomes for Miami Blacks were $16,320 and$10,000, respectively. When the Black Hispanics and West Indians were removed the comparablemean and median incomes were $16,275 and $10,000, respectively. Again, showing virtually nodifference. Finally, 27 percent of the all Blacks 15 years and older in Miami lived below thepoverty level in 2000. When the Black Hispanics and Black West Indians were removed, thepercentage was identical at 27 percent again. This is evidence that the lower SES of Haitians wascompensated for by the higher SES of the rest of the other non-Haitian West Indians, so the affect ofimmigration was virtually nil on Miami’s Black population in terms of its SES. This, however,does not mean that there has not been competition for Blacks, especially lower-income Blacks, fromMiami’s immigrants. Immigrant competition could depress wages for African Americans living inMiami, but data are not available to be able to test this thought. It is almost certain that there hasbeen some job competition based on evidence from casual conversations we have had withAmerican Blacks in Miami. How serious a problem this is not known. However, this much can besaid: there is no evidence to suggest that the average educational achievement levels, incomes, andpoverty levels of Blacks living in Miami have been depressed by those of immigrant Blacks.
So, what is keeping the Black population of from catching up with the Hispanics andNHWs in metropolitan Miami, or for that matter in any metropolitan area in the United States? There are several clues in that emerge in this report that may help answer this question. First, it hasbeen pointed out that Blacks in Miami continue to remain strongly segregated in predominantly
Profile of Miami-Dade County’s Black Population Thomas D. Boswell, Ph.D.
33When questioned about why they live in predominantly Black neighborhoods, most often Blacks say that
is where they want to live. A survey of 432 Black heads of Households living in M iami in 1997 found that almost all
respondents said they thought the neighborhood they were living in were desirable, but they also said they feel
unwelcome in White neighborhoods and they feared the embarrassment of housing discrimination. Thomas D.
Boswell, Angel David Cruz-Báez, and Pauline Zijlstra, “Housing Preferences and Attitudes of Blacks Toward
Housing Discrimination in Metropolitan Miami,” Urban Geography, 1998, Vol 19, No. 3, pp. 189-210.
34Note that this is one percent higher that the figure of 27 percent quoted on the preceding page. This 28
percent is for all Blacks; whereas the 27 percent figure was for Blacks over the age of 15 years.
35U.S. Bureau of the Census, Statistical Abstract of the United States: 2006, U.S. Government Printing
Office, Washington, D.C., 2006, Table 693, p. 472.
Office of Black Affairs Miami-Dade County Office of Community Advocacy-110-
Black neighborhoods where the poverty rates are high.33 This can be a problem in the sense that itmay slow the assimilation of Blacks into the American mainstream, although discrimination hasdefinitely also limited this adjustment. It also means that many of the Black neighborhoods,because they are poor, are tainted by a culture of poverty, just like some poor Hispanic and Non-Hispanic White areas in other parts of the United States. Regardless of color or ethnicity, thisculture of poverty affects children especially. It affects the quality of their schools, attitudes towardgetting a good education, gang membership, the friendships children form, gender attitudes,attitudes toward protected sex, and births out-of-wedlock. The Hispanic ghettos of East LosAngeles and the “White trash” pockets of poor rural eastern Kentucky and West Virginia exhibit thesame problems as Miami’s Black ghettos.
The second clue, observed in this report, that may help explain the continueddisadvantaged position of Blacks in Miami is the much higher poverty rate that Blacks (28 percent -Table 934) have had to endure when compared to Hispanics (18 percent) and especially to Non-Hispanic Whites (nine percent). Most Blacks are living a lot better today than they were 20 or 30years ago as they have improved their education levels, obtained better jobs, and earned higherincomes. However, there is a very significant component of the Black population that has somehowdropped between the cracks of development. These are the poor Blacks. These poor people, as wellas poor Hispanics and poor Whites, and the neighborhoods in which they live should be the targetsof this Nation’s greatest renewed efforts to eradicate the shame of having 36 million people livingin families with incomes below the poverty level.35
A third clue, is the out-migration of Blacks. Earlier in this report it was noted that therewas a net loss of 28,000 Blacks from Miami-Dade County to other places in the United Statesduring the 1990 to 2000 period (Table 5). The recent study by FIU mentioned earlier hasdetermined that this out-migration is disproportionately comprised of well-educated Blacks seekingjobs elsewhere in the country, thereby creating a “brain drain” among Miami’s Black population. Asurvey of Blacks that was conducted as part of this study found that 30 percent of Miami’s Blackshave plans to leave the Metropolitan Miami area. For Blacks with a college degree (B.A.) the
Profile of Miami-Dade County’s Black Population Thomas D. Boswell, Ph.D.
36Thirty-Year Retrospective: The Status of the Black Community in M iami-Dade County, Metropolitan
Center, Florida International University, 2007, p. 20.
Office of Black Affairs Miami-Dade County Office of Community Advocacy-111-
proportion is 40 percent.36 Clearly, this type of selective migration could have a significant impactin lowering the average SES of Miami’s Blacks population.
A fourth possible factor that has inhibited Blacks from catching up with Non-HispanicWhites is related to their out-migration. It was noted earlier in Table 5 of Chapter 2 of this reportthat there was a net loss of almost 167,000 Non-Hispanic Whites in Miami-Dade County between1990 and 2000. We think that this out-flow was disproportionately comprised of blue collarworkers because they are the ones who would be most likely to experience competition from thelow-cost immigrant labor force of Miami-Dade County in such industries as construction,restaurants, and tourism. The upper class Non-Hispanics Whites who had higher educations andmore skills would be more likely to be insulated from this immigrant competition. If this is thecase, the disproportionate out-migration of NHWs with lower skills would subtract some of thiselement from the NHW population, thereby increasing their average SES and making it moredifficult for Blacks to catch up.
Of course, a fifth factor (not suggested by the data used in this report) that has made itdifficult for Blacks to catch up with both Hispanics and Non-Hispanic Whites is the long history ofdiscrimination that Blacks have faced in South Florida and other parts of the United States. TheBlack middle class has really only recently become a significantly large element of the Blackpopulation, largely since passage of the Civil Rights Act of 1964 and the Fair Housing Act of 1968. Of course, there were some middle class Blacks before these pieces of legislation were passed bythe U.S. Congress, but they did not become a major component of the Black population until thepast 40 years (since 1964). Forty years is simply not sufficient time to allow an entire population tocatch up with another one that dominated it for centuries.
Profile of Miami-Dade County’s Black Population Thomas D. Boswell, Ph.D.
Office of Black Affairs Miami-Dade County Office of Community Advocacy-112-
APPENDIX – Estimates and Projections by Oliver Kerr
Population by Race and Hispanic Origin in 2005
The total population estimate for 2005 published by Miami-Dade County was 2,402,113. The following breakdown by race and Hispanic Origin is based on my analysis of natural increaseand migration flows between 2000 and 2005 and updated published projections for 2005.. TheBlack population was 495,000. Hispanics numbered 1,466,821, and Non-Hispanic Whites andOthers were estimated at 489,792.
Population Projections by Race and Hispanic Origin
The population projections by race and Hispanic Origin were made using a componentmethod. The projections of total population are those currently adopted by the County. They arethe official planning numbers although they will be revised in 2008. The components of change byrace and Hispanic Origin are my estimates based on an extrapolation of the migration componentsof change for the 1990 to 2000 period and a review of recently released Census estimates of netimmigration.
The domestic migration flow data was obtained from the New York State Data Centercourtesy of Leonard Gaines. This agency assembled the census records from every state of thosewho reported living in Miami-Dade in 1995. These figures showed higher gross flows in and out ofthe County than appear in the County’s published estimates. The net outflow of 16,000 a year waslower than the net outflow of 17,500 a year that the County had projected. The key piece ofinformation in this data set was the revelation of a net loss of Black population in the 1995 to 2000period of 40,000 persons, or 8,000 a year. It should be noted that many of the out-migrants wereyounger and better educated Blacks, a movement of some concern to the Black community. Also ofnote, was the inflow of persons of Hispanic Origin, about 2,000 a year in this period. The netchange was the result of much larger flows—23,800 a year in and 21,800 a year out. Futureresearch should reveal differences in the demographic characteristics of these movers. If pastpatterns continue one would expect the in-migrants to be older than those moving out.
The foreign migration flows were derived from new Census population estimates for the2000 to 2005 period which showed net immigration at about 20,900 a year, much lower than the38,700 a year projected by the County. The current Census estimates are based on an apportionmentof national figures to States and metropolitan areas based on the Census 2000 distribution ofimmigrants. It seems that the implicit assumption of no change in the Miami-Dade County share ofnational net immigration does not allow for the increasing social ties between the increasing numberof foreign-born residents of Miami-Dade and their family and friends in foreign countries. TheCensus reliance on master address files to reach and count households and the persons inhouseholds may undercount Blacks and persons of Hispanic Origin, particularly recent immigrants,who may live in housing units that are not on official residential mailing lists.