Embed Size (px)
Citation preview
DevelopmentProgress
Development Progress
DevelopmentProgress
Development Progress
Development Progress
Rwanda’s progress in health:Leadership, performance and insurance
This paper was authored by Romina Rodriguez Pose and Fiona Samuels. The authors gratefully acknowledge inputs from Carmen Calabuig (Biryogo Community Health Centre ‘Kwa Nyiranuma’), Remo Meloni (BTC), Jenifer Kjibwami and Katherine Turakwizeye (Cyanika Sector Community Health Centre), Joseph Muteba (FHI), Emily Sempabwa (Hewlett Packard Foundation/IntraHealth International), Junior Tumba (Kaduha District Hospital), Casian Gatoya and Innocent Munyampeta (Kigeme District Hospital), Donatha Gihana (Ministry of Education), Emmanuel Mugenzi, Emilie Nkusi, Justin Ntaganda and Vincent Rusanganwa (MoH), Mushingantahe Jules (Muhima District Hospital), Sabine Musange (National University of Rwanda), Collette Katitesi and Immaculee Mukarwego (Nyamagabe District Local Government), Gemma Williams (ODI), Callixte Gatsimbanyi (SDA – IRIBA), Guy Mbayo Kakumbi (UNICEF) and Simon Ntare (WE-ACT). The authors would also like to acknowledge support from their local partner in Rwanda, David Rugero (Independent Consultant) and editorial support from Roo Griffiths. The views in this paper are those of the authors alone. The story is part of a larger project that includes 24 stories of progress on development, led by Liesbet Steer and Alison Evans on behalf of the Overseas Development Institute.
For more information, contact Romina Rodriquez Pose ([email protected]), Fiona Samuels ([email protected]) or Liesbet Steer ([email protected]).
Readers are encouraged to quote or reproduce material from this publication, as long as the resulting works are not being sold commercially and that due acknowledgement is given to the author(s). A copy of the publications should be sent to:
ODI publications, 111 Westminster Bridge Road, London SE1 7JD, UK © Overseas Development Institute, 2011
1
Table of contents
List of abbreviations 2
1. Introduction 4
2. Context 52.1 Country and historical context 52.1.1 Territory and population characteristics 52.1.2 Political and economic sphere 62.2 Sectoral context 72.2.1 Health policy 72.2.2 Health care delivery system characteristics 8
3. What has been achieved 103.1 Life expectancy 103.2 Child mortality 113.3 Immunisation coverage 133.4 Malnutrition 143.5 Maternal mortality 153.6 Births attended by skilled health personnel 163.7 Antenatal care coverage 173.8 Family planning 183.9 Malaria 193.10 HIV and AIDS 203.11 Health infrastructure and personnel 21
4. Drivers of progress 224.1 The demand side: the Mutuelle de Santé 224.2 The supply side: performance-based financing and human resources 244.2.1 Availability and motivation of staff 244.2.2 Performance-based financing 244.3 Political leadership, accountability mechanisms and policymaking 264.3.1 Strong leadership and high political commitment 264.3.2 Good governance: accountability and control mechanisms 274.3.3 Policymaking according to the reality: scaling up pilots based on evidence 274.4 Decentralisation and community participation 284.4.1 Government working closer to the population 284.4.2 Targeting the rural poor: community health workers 294.5 Coordination of development partners 30
5. Conclusions 325.1 Key lessons 325.2 Challenges 33
References 34
Annex 1: Use of Rwandan cultural values and traditions as catalysts for development 36 Annex 2: Development partners in the health sector 37
RWANDA’S PROGRESS IN HEALTH: Leadership, performance and insurance
2
List of abbreviations and glossary
AIDS Acquired Immune Deficiency Syndrome
BTC Belgian Technical Cooperation
DHS Demographic and Health Survey
DRC Democratic Republic of Congo
EDPRS Economic Development and Poverty Reduction Strategy
EPI Expanded Programme on Immunization
EU European Union
FHI Family Health International
GDP Gross Domestic Product
GNU Government of National Unity
GoR Government of Rwanda
GPOBA Global Partnership on Output-Based Aid
HIPC Heavily Indebted Poor Countries
HIV Human Immunodeficiency Virus
HSP Health Sector Policy
HSSP Health Sector Strategic Plan
IDHS Interim DHS
MDG Millennium Development Goal
MDRI Multilateral Debt Relief Initiative
MoFEP Ministry of Finance and Economic Planning
MoH Ministry of Health
NGO Non-Governmental Organisation
NISR National Institute of Statistics of Rwanda
ODI Overseas Development Institute
ONAPO National Population Office
PBF Performance-Based Financing
PRSP Poverty Reduction Strategy Paper
RPF Rwanda Patriotic Front
SDA-IRIBA Servicing the Development of Associations
SWAp Sector-Wide Approach
3
U5MR Under-Five Mortality Rate
UK United Kingdom
UN United Nations
UNAIDS Joint UN Programme on HIV/AIDS
UNICEF UN Children’s Fund
US United States
USAID US Agency for International Development
WE-ACT Women’s Equity in Access to Care & Treatment
WFP World Food Programme
WHO World Health Organization
RWANDA’S PROGRESS IN HEALTH: Leadership, performance and insurance
4
1. Introduction
By 1994, after four years of civil war and genocide which took the lives of almost 1 million people, Rwanda was in a state of almost total collapse. The consequences in terms of the health of the population were particularly devastating. Health infrastructure and human capital were almost completely destroyed, and there were thousands of injured and displaced people. And yet, in only 16 years, and although poverty remains extremely high (around 60% of people live below the poverty line), the country has made remarkable improvements in the health status of its population, particularly among the most vulnerable, related to life expectancy; infant and child mortality; immunisation; family planning; HIV; malaria; and infrastructure, among others. It is important to recognise, though, that improvements came from a very low base after the civil war and genocide.
Key factors leading to these achievements include the introduction of a community health insurance scheme that contributed to the removal of barriers to access to health services while at the same time transforming health-seeking behaviour; the provision of quality health services boosted by staff incentives and performance-based financing (PBF) schemes; strong leadership, commitment and vision leading to innovative reforms and evidence-based strategies and policies based on realities on the ground; and the decentralisation of the health sector, which brought services closer to communities and empowered them to participate in identifying the best solutions for their needs as well as in monitoring health system performance. All these reforms would not have been possible without the effective coordination of donor assistance, which has been instrumental in achieving such remarkable outcomes in the health sector in Rwanda.
51. At Kigali Genocide Memorial Centre.
2. Context
2.1 Country and historical context
Rwanda’s population consists of three main social groups: the Hutus, the Tutsis and the small minority Twa. Although the groups have historically had a number of similarities, European colonialists in the 19th century exaggerated and exploited existing tribal differences and inequalities to meet their own objectives (Lemarchand, 1995). For example, Belgian rule (1919-1962) used identity cards specifying ethnic origin according to physical appearance, wealth and social status. During this period, Tutsis were seen as the superior race, chosen by the colonisers as their allies in ruling the country, with extensive powers over the majority Hutus. The widespread discontent these divisions engendered eventually resulted in revolts and unrest that spread throughout the country.
With independence and democracy in 1962, the situation changed radically. Tutsis were murdered across the country and became the victims of official discrimination in politics and virtually all public services as the Hutu majority took up power. Propaganda campaigns presented the Tutsis as ‘cockroaches that needed to be eliminated,’1 and resulted in violence that left thousands of Tutsis dead, with thousands more fleeing as refugees into neighbouring countries.
Finally, in 1990, the Rwanda Patriotic Front (RPF), a group made up of Tutsis in exile led by Paul Kagame, launched an invasion from Uganda that led to civil war. During this period, the government and the RPF signed a series of agreements backed by the international community that aimed to reach a peaceful end to the crisis. On 6 April 1994, a peace agreement was signed, but the plane carrying the Rwandan and Burundian presidents was shot down, triggering another wave of violence. This time, the Hutu radical leadership, with the close involvement of senior levels of government, aimed to incite violence to annihilate both Rwanda’s Tutsi population and moderate Hutus. A massacre of unprecedented scale ensued. While the international community withdrew from the country, the RPF continued advancing, and on 4 July 1994 it finally won the war.
The genocide left behind almost 1 million dead and a legacy of poverty, ill-health and human devastation. Thousands were injured or disabled, and there were innumerable rape cases (which subsequently led to an HIV/AIDS explosion), as well as a major reduction in the number of adult men and large numbers of orphans. With no infrastructure left, almost no human resources and widespread displacement, a completely new country had to be built. This was made possible mainly by means of the large amounts of money injected into the country in the form of emergency humanitarian aid. From 1996, humanitarian relief aid began to transform into reconstruction and development assistance, and the country became heavily dependent on donor support for its development. By 2006, the country was receiving more than $400 million per year in foreign aid (Development Partners, 2006).
2.1.1 Territory and population characteristics
Rwanda is a small, landlocked country of 26,338 km2. Known as the ‘land of a thousand hills,’ its mountainous relief, with an average elevation of 1,700 m, is not only prone to soil erosion but salso represents a barrier in terms of physical accessibility of remote villages (Abbott and Rwirahira, 2010).
The population is currently estimated to be just under 10 million people, which makes Rwanda the most densely populated country in Sub-Saharan Africa, with around 365 inhabitants per km2 in 2008 (Thaxton, 2009; World Bank, 2009). In the aftermath of the genocide, people felt the need to reproduce themselves; this translated into rapid population growth that the government has identified as contributing to poverty, malnutrition and poor health among the population as well as to environmental degradation (Solo, 2008; Thaxton, 2009; respondents).
RWANDA’S PROGRESS IN HEALTH: Leadership, performance and insurance
6
In 2002, 52% of the population were women and almost 70% Rwandans were less than 20 years old. In terms of religious affiliation, around 95% are Christian. The country’s first official language is Kinyarwanda, spoken by 99% of Rwandans. French and English are also official languages. The population is broadly rural, with 86% of Rwandans residing in the countryside (Interim Demographic and Health Survey (IDHS) 2007-2008). More than half the population lives below the national poverty line, decreasing only from 60.4% in 2000 to 59.9% in 2005. Poverty remains disproportionately rural, with nearly 92% of the poor living in rural areas (World Bank, 2009).
2.1.2 Political and economic sphere
After gaining control of the country in 1994, the RPF formed an interim Government of National Unity (GNU) – made up of Hutus and Tutsis – which served until 2003, when a new Constitution was enacted. The first multiparty presidential and parliamentary elections were held in August and September of 2003, resulting in the election of Paul Kagame, who was re-elected in 2010 with 93% of the vote (Abbot and Rwirahira, 2010).
The post-genocide government initiated a reconciliation process, which included bringing the perpetrators to justice, and started rebuilding the country through a consultative process that involved all sectors of Rwandan society. The process resulted in the Vision 2020 document, which sets the framework for Rwanda’s long-term development and outlines a number of ambitious goals to be accomplished by 2020. The government, together with partners, donors, civil society and the private sector, has formulated detailed sectoral plans in order to attain these. In the area of health, the objectives are linked closely to the health-related Millennium Development Goals (MDGs), and aim to boost health policies that target the poorest sectors of society to improve access to quality health care and reduce its cost (MoFEP, 2000).
The government has also been widely acknowledged for its zero tolerance of corruption, having put in place a sound economic governance framework, including independent regulatory agencies, stronger public expenditure management with independent audit agencies and hard punishments (e.g. after three months of tolerance there is a 45% fine on taxes not paid) (World Bank, 2009; respondents). The government has also actively promoted gender equality: it is the only country in the world that has more than 50% of women as members of parliament (Abbot and Rwirahira, 2010).
In the economic sphere, Rwanda has made considerable progress. In the aftermath of the genocide, the government managed to stabilise the economy and promote rapid economic growth. By 1998, gross domestic product (GDP) had surpassed its pre-1994 level. However, although GDP growth averaged 5-6% per year from 2002 to 2006, GDP per capita is still low, at only $359 in 2007, which places Rwanda among the poorest countries in the world (World Bank, 2009). In addition, ‘growth has […] not been pro-poor in the strict sense, since the majority of the population has experienced a rather modest income growth compared to the highest income deciles’ (Bigsten and Isaksson, 2008).
In order to achieve the goals set in Vision 2020 as well as the MDGs, the government developed a poverty reduction strategy paper (PRSP) and a successor, the current Economic Development and Poverty Reduction Strategy (EDPRS) 2008-2012. These have been successful in terms of reallocating funds to priority areas, while reducing military spending, improving social service delivery and implementing reforms in the education and health sectors. However, they have been slower in terms of fostering private sector development and export promotion (Abbot and Rwirahira, 2010).
Rwanda’s economy is based primarily on rain-fed agriculture from small and semi-subsistence farms. Although the services sector has grown rapidly in recent years, agriculture is still the primary source of livelihood, with around 80% of the population dependent on the sector. Meanwhile, Rwanda lacks mineral and other natural resources on which to base its development. Being a landlocked country, the government has acknowledged the need to develop a friendly environment for business, thus it has implemented a set of macroeconomic reforms that enhance economic freedom (open trade policy, tax incentives for business). Together with cheap and abundant labour, stable internal security, low levels of corruption and low crime rates, they are thought to have created a favourable investment climate (Abbot and Rwirahira, 2010).
Rwanda’s broad programme of economic reforms allowed it to be part of the Heavily Indebted Poor Countries (HIPC) Initiative and to qualify for the Multilateral Debt Relief Initiative (MDRI) in March 2006 (World Bank, 2009). However, as noted above, the country remains heavily dependent on foreign aid. Imports are much larger than exports, and inflation may become a problem as a consequence of the amount of donor funds flowing into the country. The global economic crisis and downturn, with its potential reduction in aid allocations from developed countries, along with the effects of climate change on a country dependent on agriculture, may also place Rwanda in a vulnerable position in the near future (Kironde, 2008, in Abbot and Rwirahira, 2010).
7
2. The country is subdivided into four administrative provinces, then subdivided into 30 administrative districts, 416 sectors, 2,148 cells and 14,980 villages.3. The Mutuelle de Santé covers mainly informal labourers and the general population; other health insurance and private schemes in the country, such as the Rwanda Medical Insurance Company, represent government officials and civil servants.
2.2 Sectoral context
2.2.1 Health policy
Rwanda adopted a primary health care strategy after the International Conference on Primary Health Care in Alma-Ata in 1978 and achieved some progress, but the 1994 genocide brought the country back to its 1980s level. The GNU was faced with a completely destroyed health system and one which lacked resources, having lost 75% of its human capital and almost all its health facilities (Basinga et al., 2008).
Supported by the donor community, the government has undertaken a series of health reforms and policies to rebuild the sector. These can be framed in three different phases. After the genocide and until 1998, there was stagnation. Barriers such as sporadic conflict, insurgence, infiltration and attacks from the refugee camps remained. Efforts focused on re-establishing minimum basic health services and infrastructure, supported by emergency aid from development partners.
It was not until the late 1990s and early 2000s that tangible measures were taken. From the late 1990s to 2005, the country defined and designed strategies and planned their implementation. This period was characterised by political reconstruction, situation analysis and discussions on ‘what to do’ involving all stakeholders. Health policies and strategies were piloted at small scale; however, real implementation took place from the mid-2000s, when many of the pilots were scaled up to national level and when reforms were increasingly implemented.
After the genocide, international donors provided free health services to the people of Rwanda. In 1996, as emergency aid started being withdrawn, the government established user fees as a means of cost recovery; this resulted in a negative impact on demand for health services. As such, by 2000, most health indicators were still below the levels prevailing before the genocide (World Bank, 2009). In 2004, the government established the Health Sector Policy (HSP) and the Ministry of Health (MoH) formulated the first Health Sector Strategic Plan 2005-2009 (HSSP I) to operationalise the 2002 PRSP, including several measures to address demand constraints.
By the end of 2007, most activities had been implemented and many targets had already been attained. Thus, a second HSSP, for the period 2009-2012, was developed a year earlier than planned, to operationalise the HSP and the new EDPRS and to guide health sector reforms in the medium term (World Bank, 2009). HSSP II establishes interventions along three strategic objectives: 1) maternal and child health, family planning, reproductive health and nutrition; 2) prevention of diseases and promotion of health; and 3) treatment and control of diseases. A National Policy for Quality Health Care, introduced in 2008, focuses on strengthening the supervisory system at facility and community levels to achieve and sustain high quality health services (IntraHealth, 2009).
The major reforms and initiatives that have taken place since mid-2000 to increase the coverage and quality of primary health care include (see Section 4 for more):
• Administrativereformsthatcreatedadministrativedistrictsthatareoperationalinalldevelopmentsectors,including health, and autonomous from the central level, although they have to follow strict accountability mechanisms and still come under national supervision. These reforms implied that the primary health care strategy would be implemented through districts that worked as autonomous planning and implementation units dealing with the health problems of the population in their catchment area;2
• Thepilotingofthecommunityhealthinsurancescheme,theMutuelle de Santé, which was initiated in 1999 with technical support from the US Agency for International Development (USAID), building on initial efforts that go back to the 1960s (MoH, 2004). This was later scaled up nationally, achieving large coverage with a national subsidy for those too poor to pay for health insurance;3
• RollingoutPBFforhealthcentresanddistricthospitalsandintroducingcommunityPBF;
• Developingkeymechanismstomobilisecommunityparticipationinthesenewlyintroducedinitiatives(Basingaetal., 2008; IntraHealth, 2009).
RWANDA’S PROGRESS IN HEALTH: Leadership, performance and insurance
8
Health financing is heavily dependent on external assistance. Out of total health expenditure per capita in 2006, 53% was financed from external sources, 28% from internal private sources, including the Mutuelle, and 19% from government sources (which includes loans and grants) (MoH, 2009b). The national aid policy advocates for budget support and a sector-wide approach (SWAp), and an increasing number of partners have gone with this, including UN agencies, by signing the memorandum of understanding for a health SWAp and through their active participation in operationalising the country’s policies and strategies. In 2006, 26% of external assistance was in the form of budget support, and this increased to 30% in 2007. The main partners of the government are, in order of importance, the US, the World Bank, the UK, the European Union (EU) and the UN system. In the health sector in Rwanda, 16 actors are operating: 7 bilateral cooperation agencies, 3 international institutions and 6 UN agencies (WHO, 2009) (see Annex 2).
2.2.2 Health care delivery system characteristics
Health care in Rwanda is delivered by governmental and faith-based organisations recognised by MoH. Although the latter belong to the church, they are authorised facilities working under MoH’s policies and strategies: MoH nominates the directors and provides personnel and materials. There are also some private health providers, oriented towards curative activities, located mainly in urban settlements. The activities of these providers do not always take into account the needs of the population, but rather are based on capacity to pay; the sector is also poorly organised and inadequately regulated, with ill-defined relationships between it and the public sector (WHO, 2009).
Health care delivery is organised around a decentralised referral system with a pyramid structure. At the top are the referral hospitals, which provide tertiary care. The district hospitals (one for each of the country’s 30 districts) deal with secondary care, including surgery and management of complicated cases such as severe malaria. There are currently 406 health centres (legislation establishes there should be at least one for each of the country’s 416 sectors) (MoH, 2009a), which provide primary health care, including outpatient and inpatient services and preventive services such as immunisation. The first point of contact in the referral system, particularly in rural areas, is the community health worker, who is trained to deal with basic illnesses. Some villages also have community health posts (IntraHealth, 2009; World Bank, 2009; respondents). As Table 1 outlines, health care responsibilities vary according to administrative level.
Table 1: Health care responsibilities by administrative level
Central level (Kigali)
•IncludescentraldirectoratesandprogrammesofMoHandthenationalreferralhospitals•Elaboratespoliciesandstrategies,ensuresmonitoringandevaluationandregulatesthesector•Organisesandcoordinatesintermediaryandperipherallevels,providingthemwith
administrative, technical and logistical support
Intermediary (provincial level)
•Dealswithmanagementandpolicyissuesbutisnotaproviderofhealthservices• Isresponsibleforimplementinghealthpolicies,coordinatingactivitiesandproviding
technical, administrative and logistical support• Ensuresequitabledistributionandefficientutilisationofresourcesamongdistricts
Peripheral (health district)
•Consistsofanadministrativeoffice,adistricthospitalandanetworkofhealthcentres• Addressesthehealthproblemsofitscatchmentpopulation• Organiseshealthservicesinhealthcentresandthedistricthospitalintermsofboththe
minimum and the complementary package of activities• Isinchargeofadministrativefunctionsandlogistics,includingthemanagementofresources
and supply of drugs • Supervisescommunityhealthworkers
Source: IntraHealth (2009); World Bank (2009).
9
Although since 1994 more doctors have graduated in Rwanda than ever before, there is still a shortage of doctors and medical staff in general. As Section 4 discusses, strategies have been put in place in recent years to increase and maintain health staff numbers. Human resource development, while of critical concern in the health sector, is also a core objective in the development of the country as a whole, as established in the Vision 2020 document. In relation to this, non-medical health staff, such as community health workers, have been trained to deliver child, maternal and basic health care to make up for the scarcity of personnel, particularly in rural areas.
In addition to formally trained health providers, people still appeal to traditional practitioners. In the past, Rwandans often sought care from traditional healers because they were able to pay in kind instead of in cash. However, with the increase in Mutuelle coverage, availability of cash has stopped being a barrier to access to health facilities, thus the tendency has been to move away from traditional medicine. Traditional healers still represented 11% of consultations in 2000, but this figure fell to 7% towards the end of the decade (World Bank, 2009).
RWANDA’S PROGRESS IN HEALTH: Leadership, performance and insurance
10
3. What has been achieved
In only 16 years since the genocide and civil war, Rwanda has been able to bring health outcomes/indicators back to the level reached before the genocide, with the exception of fertility and malnutrition among children under five, with some even surpassing their previous level. There are still inequalities between urban and rural areas, among income quintiles and by gender, but most improvements have benefited the poor and have enhanced equity. As this section shows, in many cases progress has in fact been greatest for the poorest. It is also important to point out that even the upper three quintiles (except the very top few percent) are still poor by global standards.
Here, improvements in health are measured according to a set of indicators and within the post-genocide period. Where possible, data on the situation before 1994 are shown to put this progress into perspective. Most health outcomes have improved simultaneously, as improvements on one indicator have enhanced progress on others (e.g. improvements on skilled birth attendance have led to reduced maternal and child mortality). Linkages between indicators are analysed where possible.
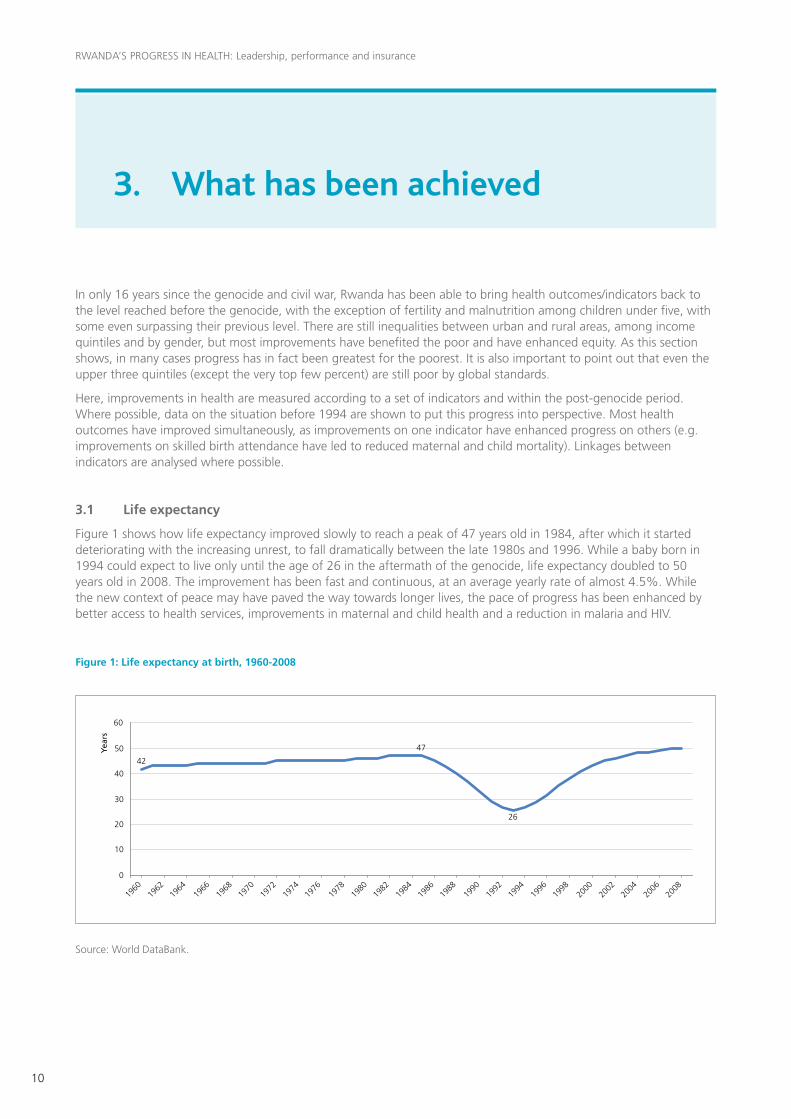
3.1 Life expectancy
Figure 1 shows how life expectancy improved slowly to reach a peak of 47 years old in 1984, after which it started deteriorating with the increasing unrest, to fall dramatically between the late 1980s and 1996. While a baby born in 1994 could expect to live only until the age of 26 in the aftermath of the genocide, life expectancy doubled to 50 years old in 2008. The improvement has been fast and continuous, at an average yearly rate of almost 4.5%. While the new context of peace may have paved the way towards longer lives, the pace of progress has been enhanced by better access to health services, improvements in maternal and child health and a reduction in malaria and HIV.
Figure 1: Life expectancy at birth, 1960-2008
Source: World DataBank.
0
20
10
30
40
42
47
26
50
60
1962
1960
1964
1966
1968
1974
1972
1970
1976
1980
1978
1982
1986
1984
1988
1992
1990
1994
1998
1996
2000
2002
2004
2006
2008
Yea
rs
11
3.2 Child mortality
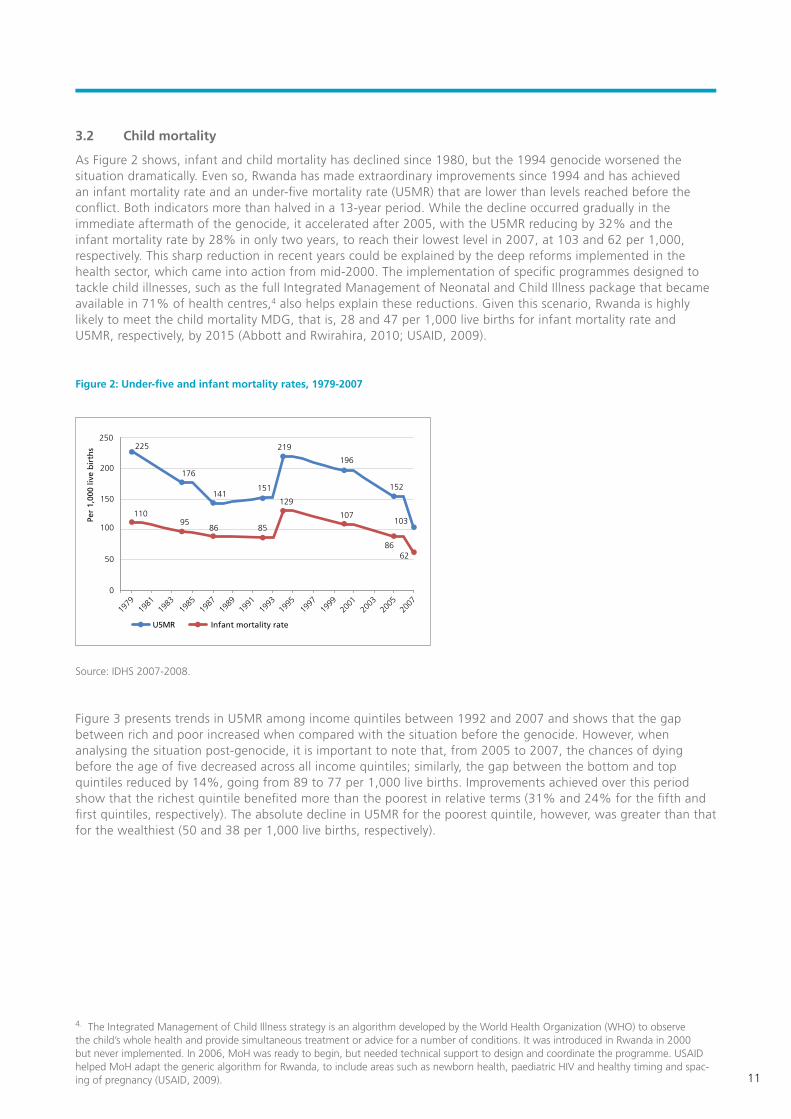
As Figure 2 shows, infant and child mortality has declined since 1980, but the 1994 genocide worsened the situation dramatically. Even so, Rwanda has made extraordinary improvements since 1994 and has achieved an infant mortality rate and an under-five mortality rate (U5MR) that are lower than levels reached before the conflict. Both indicators more than halved in a 13-year period. While the decline occurred gradually in the immediate aftermath of the genocide, it accelerated after 2005, with the U5MR reducing by 32% and the infant mortality rate by 28% in only two years, to reach their lowest level in 2007, at 103 and 62 per 1,000, respectively. This sharp reduction in recent years could be explained by the deep reforms implemented in the health sector, which came into action from mid-2000. The implementation of specific programmes designed to tackle child illnesses, such as the full Integrated Management of Neonatal and Child Illness package that became available in 71% of health centres,4 also helps explain these reductions. Given this scenario, Rwanda is highly likely to meet the child mortality MDG, that is, 28 and 47 per 1,000 live births for infant mortality rate and U5MR, respectively, by 2015 (Abbott and Rwirahira, 2010; USAID, 2009).
Figure 2: Under-five and infant mortality rates, 1979-2007
Source: IDHS 2007-2008.
Figure 3 presents trends in U5MR among income quintiles between 1992 and 2007 and shows that the gap between rich and poor increased when compared with the situation before the genocide. However, when analysing the situation post-genocide, it is important to note that, from 2005 to 2007, the chances of dying before the age of five decreased across all income quintiles; similarly, the gap between the bottom and top quintiles reduced by 14%, going from 89 to 77 per 1,000 live births. Improvements achieved over this period show that the richest quintile benefited more than the poorest in relative terms (31% and 24% for the fifth and first quintiles, respectively). The absolute decline in U5MR for the poorest quintile, however, was greater than that for the wealthiest (50 and 38 per 1,000 live births, respectively).
4. The Integrated Management of Child Illness strategy is an algorithm developed by the World Health Organization (WHO) to observe the child’s whole health and provide simultaneous treatment or advice for a number of conditions. It was introduced in Rwanda in 2000 but never implemented. In 2006, MoH was ready to begin, but needed technical support to design and coordinate the programme. USAID helped MoH adapt the generic algorithm for Rwanda, to include areas such as newborn health, paediatric HIV and healthy timing and spac-ing of pregnancy (USAID, 2009).
0
100
50
150
200
250225
11095
86 85
129
107
8662
176
141151
219
196
152
103
1981
1979
1983
1985
1987
1993
1991
1989
1995
1999
1997
2001
2005
2003
2007
Per
1,00
0 liv
e b
irth
s
U5MR Infant mortality rate
RWANDA’S PROGRESS IN HEALTH: Leadership, performance and insurance
12
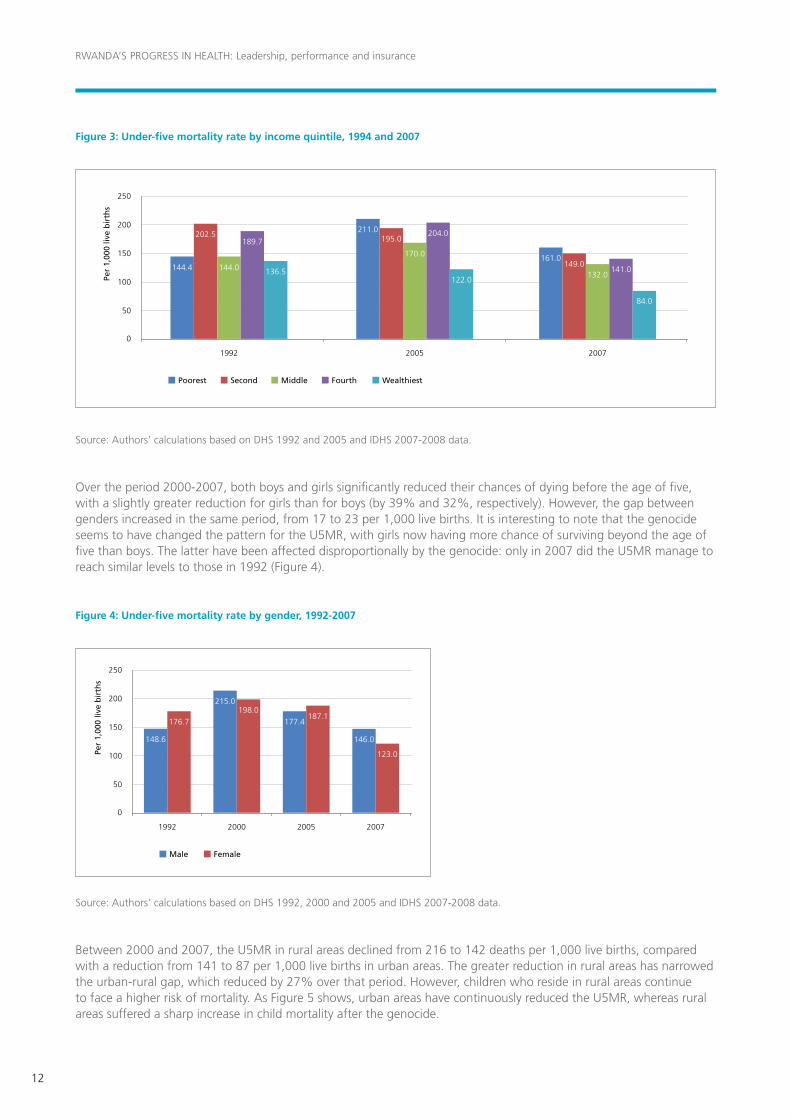
Figure 3: Under-five mortality rate by income quintile, 1994 and 2007
Source: Authors’ calculations based on DHS 1992 and 2005 and IDHS 2007-2008 data.
Over the period 2000-2007, both boys and girls significantly reduced their chances of dying before the age of five, with a slightly greater reduction for girls than for boys (by 39% and 32%, respectively). However, the gap between genders increased in the same period, from 17 to 23 per 1,000 live births. It is interesting to note that the genocide seems to have changed the pattern for the U5MR, with girls now having more chance of surviving beyond the age of five than boys. The latter have been affected disproportionally by the genocide: only in 2007 did the U5MR manage to reach similar levels to those in 1992 (Figure 4).
Figure 4: Under-five mortality rate by gender, 1992-2007
Source: Authors’ calculations based on DHS 1992, 2000 and 2005 and IDHS 2007-2008 data.
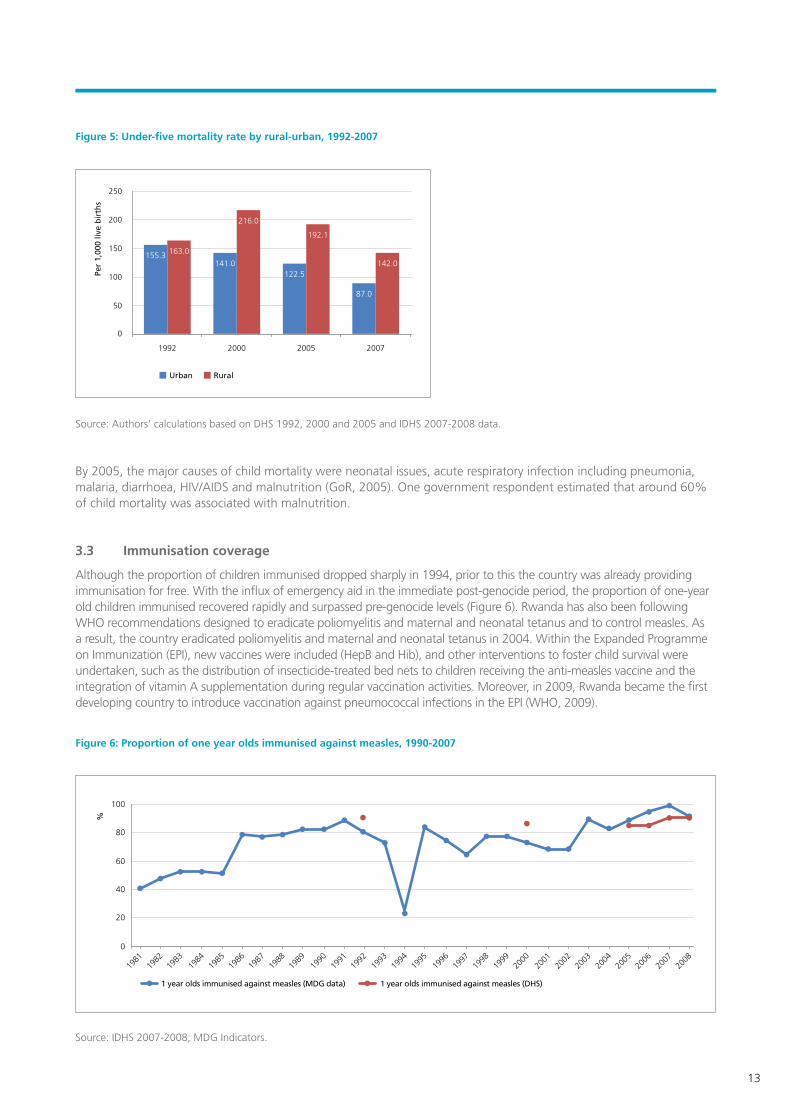
Between 2000 and 2007, the U5MR in rural areas declined from 216 to 142 deaths per 1,000 live births, compared with a reduction from 141 to 87 per 1,000 live births in urban areas. The greater reduction in rural areas has narrowed the urban-rural gap, which reduced by 27% over that period. However, children who reside in rural areas continue to face a higher risk of mortality. As Figure 5 shows, urban areas have continuously reduced the U5MR, whereas rural areas suffered a sharp increase in child mortality after the genocide.
1992 2005 2007
100
50
0
150
200
250
Poorest Second Middle Fourth Wealthiest
Per
1,00
0 liv
e b
irth
s
144.0144.4
211.0195.0
170.0
204.0
122.0
161.0149.0
132.0141.0
84.0
202.5189.7
136.5
1992 2000 2005 2007
100
50
0
150
200
250
Male Female
Per
1,00
0 liv
e b
irth
s
148.6
176.7
215.0198.0
177.4
146.0
123.0
187.1
13
Figure 5: Under-five mortality rate by rural-urban, 1992-2007
Source: Authors’ calculations based on DHS 1992, 2000 and 2005 and IDHS 2007-2008 data.
By 2005, the major causes of child mortality were neonatal issues, acute respiratory infection including pneumonia, malaria, diarrhoea, HIV/AIDS and malnutrition (GoR, 2005). One government respondent estimated that around 60% of child mortality was associated with malnutrition.
3.3 Immunisation coverage
Although the proportion of children immunised dropped sharply in 1994, prior to this the country was already providing immunisation for free. With the influx of emergency aid in the immediate post-genocide period, the proportion of one-year old children immunised recovered rapidly and surpassed pre-genocide levels (Figure 6). Rwanda has also been following WHO recommendations designed to eradicate poliomyelitis and maternal and neonatal tetanus and to control measles. As a result, the country eradicated poliomyelitis and maternal and neonatal tetanus in 2004. Within the Expanded Programme on Immunization (EPI), new vaccines were included (HepB and Hib), and other interventions to foster child survival were undertaken, such as the distribution of insecticide-treated bed nets to children receiving the anti-measles vaccine and the integration of vitamin A supplementation during regular vaccination activities. Moreover, in 2009, Rwanda became the first developing country to introduce vaccination against pneumococcal infections in the EPI (WHO, 2009).
Figure 6: Proportion of one year olds immunised against measles, 1990-2007
Source: IDHS 2007-2008; MDG Indicators.
1992 2000 2005 2007
100
50
0
150
200
250
Urban Rural
Per
1,00
0 liv
e b
irth
s
155.3 163.0
141.0
216.0
122.5
87.0
142.0
192.1
0
40
20
60
80
100
1982
1981
1983
1984
1985
1988
1987
1986
1989
1991
1990
1992
1994
1993
1995
1997
1996
1998
2000
1999
2001
2002
2003
2004
2005
2006
2008
2007
%
1 year olds immunised against measles (MDG data) 1 year olds immunised against measles (DHS)
RWANDA’S PROGRESS IN HEALTH: Leadership, performance and insurance
14
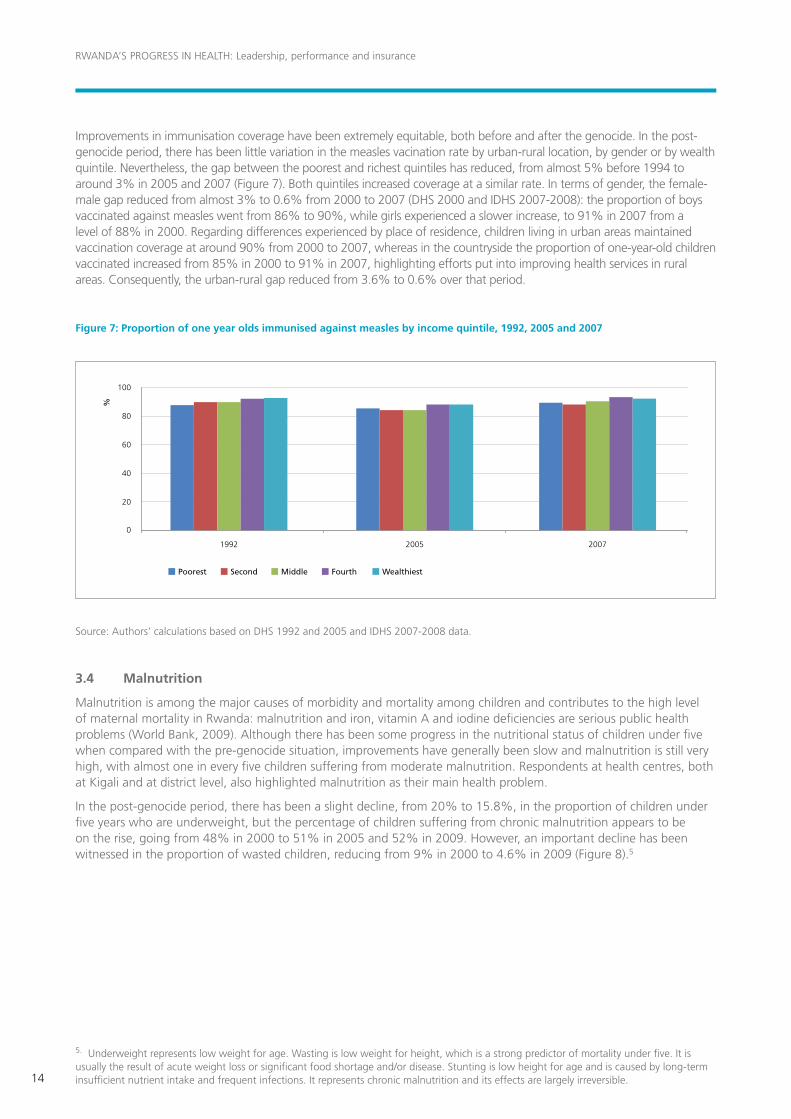
Improvements in immunisation coverage have been extremely equitable, both before and after the genocide. In the post-genocide period, there has been little variation in the measles vacination rate by urban-rural location, by gender or by wealth quintile. Nevertheless, the gap between the poorest and richest quintiles has reduced, from almost 5% before 1994 to around 3% in 2005 and 2007 (Figure 7). Both quintiles increased coverage at a similar rate. In terms of gender, the female-male gap reduced from almost 3% to 0.6% from 2000 to 2007 (DHS 2000 and IDHS 2007-2008): the proportion of boys vaccinated against measles went from 86% to 90%, while girls experienced a slower increase, to 91% in 2007 from a level of 88% in 2000. Regarding differences experienced by place of residence, children living in urban areas maintained vaccination coverage at around 90% from 2000 to 2007, whereas in the countryside the proportion of one-year-old children vaccinated increased from 85% in 2000 to 91% in 2007, highlighting efforts put into improving health services in rural areas. Consequently, the urban-rural gap reduced from 3.6% to 0.6% over that period.
Figure 7: Proportion of one year olds immunised against measles by income quintile, 1992, 2005 and 2007
Source: Authors’ calculations based on DHS 1992 and 2005 and IDHS 2007-2008 data.
3.4 Malnutrition
Malnutrition is among the major causes of morbidity and mortality among children and contributes to the high level of maternal mortality in Rwanda: malnutrition and iron, vitamin A and iodine deficiencies are serious public health problems (World Bank, 2009). Although there has been some progress in the nutritional status of children under five when compared with the pre-genocide situation, improvements have generally been slow and malnutrition is still very high, with almost one in every five children suffering from moderate malnutrition. Respondents at health centres, both at Kigali and at district level, also highlighted malnutrition as their main health problem.
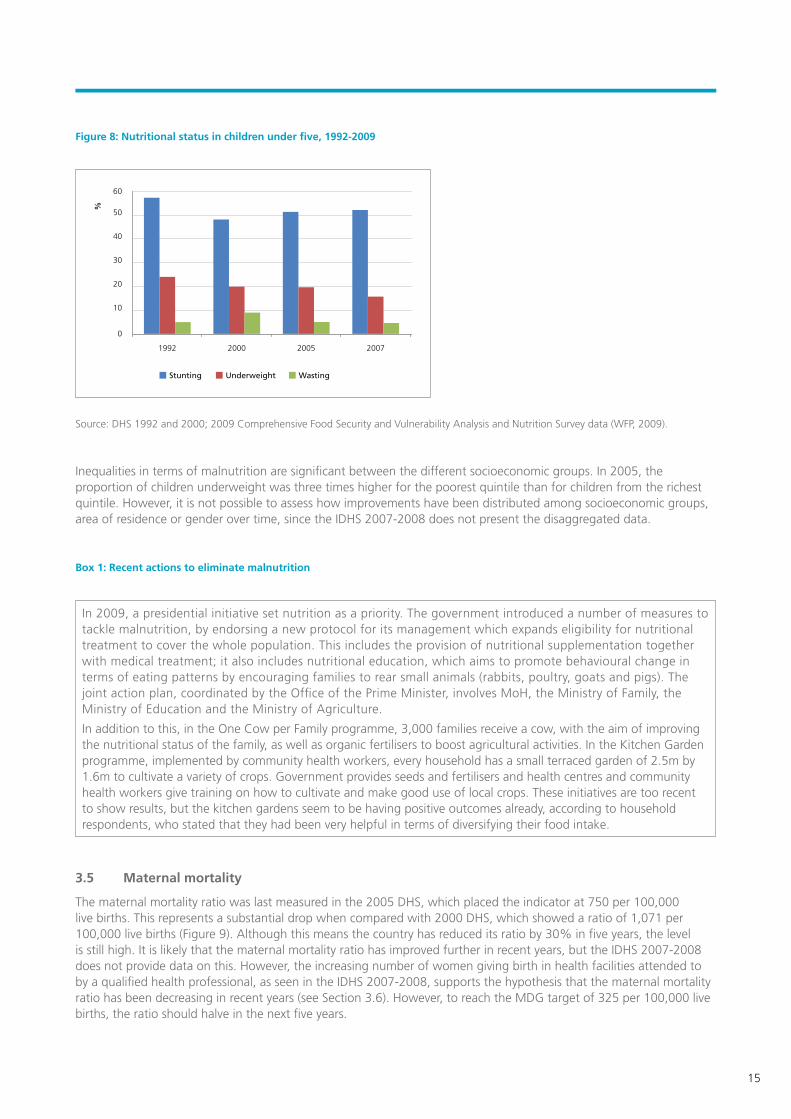
In the post-genocide period, there has been a slight decline, from 20% to 15.8%, in the proportion of children under five years who are underweight, but the percentage of children suffering from chronic malnutrition appears to be on the rise, going from 48% in 2000 to 51% in 2005 and 52% in 2009. However, an important decline has been witnessed in the proportion of wasted children, reducing from 9% in 2000 to 4.6% in 2009 (Figure 8).5
5. Underweight represents low weight for age. Wasting is low weight for height, which is a strong predictor of mortality under five. It is usually the result of acute weight loss or significant food shortage and/or disease. Stunting is low height for age and is caused by long-term insufficient nutrient intake and frequent infections. It represents chronic malnutrition and its effects are largely irreversible.
1992 2005 2007
40
20
0
60
80
100
Poorest Second Middle Fourth Wealthiest
%
15
Figure 8: Nutritional status in children under five, 1992-2009
Source: DHS 1992 and 2000; 2009 Comprehensive Food Security and Vulnerability Analysis and Nutrition Survey data (WFP, 2009).
Inequalities in terms of malnutrition are significant between the different socioeconomic groups. In 2005, the proportion of children underweight was three times higher for the poorest quintile than for children from the richest quintile. However, it is not possible to assess how improvements have been distributed among socioeconomic groups, area of residence or gender over time, since the IDHS 2007-2008 does not present the disaggregated data.
Box 1: Recent actions to eliminate malnutrition
3.5 Maternal mortality
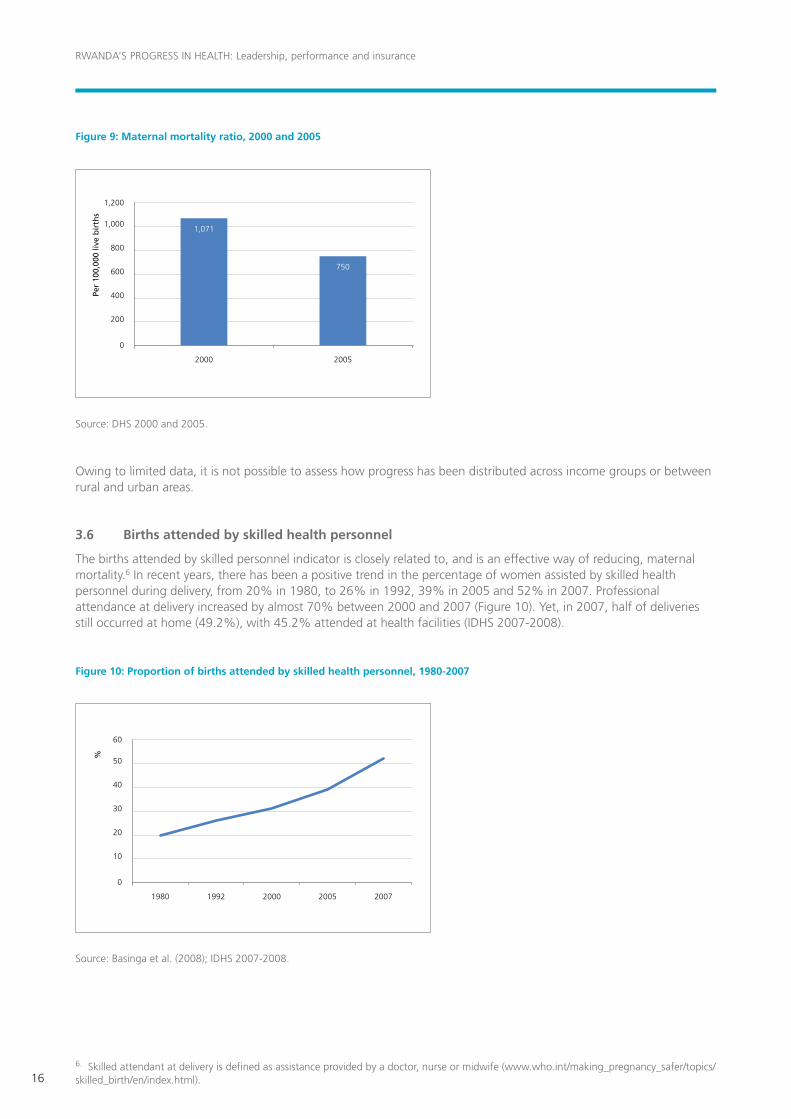
The maternal mortality ratio was last measured in the 2005 DHS, which placed the indicator at 750 per 100,000 live births. This represents a substantial drop when compared with 2000 DHS, which showed a ratio of 1,071 per 100,000 live births (Figure 9). Although this means the country has reduced its ratio by 30% in five years, the level is still high. It is likely that the maternal mortality ratio has improved further in recent years, but the IDHS 2007-2008 does not provide data on this. However, the increasing number of women giving birth in health facilities attended to by a qualified health professional, as seen in the IDHS 2007-2008, supports the hypothesis that the maternal mortality ratio has been decreasing in recent years (see Section 3.6). However, to reach the MDG target of 325 per 100,000 live births, the ratio should halve in the next five years.
In 2009, a presidential initiative set nutrition as a priority. The government introduced a number of measures to tackle malnutrition, by endorsing a new protocol for its management which expands eligibility for nutritional treatment to cover the whole population. This includes the provision of nutritional supplementation together with medical treatment; it also includes nutritional education, which aims to promote behavioural change in terms of eating patterns by encouraging families to rear small animals (rabbits, poultry, goats and pigs). The joint action plan, coordinated by the Office of the Prime Minister, involves MoH, the Ministry of Family, the Ministry of Education and the Ministry of Agriculture.
In addition to this, in the One Cow per Family programme, 3,000 families receive a cow, with the aim of improving the nutritional status of the family, as well as organic fertilisers to boost agricultural activities. In the Kitchen Garden programme, implemented by community health workers, every household has a small terraced garden of 2.5m by 1.6m to cultivate a variety of crops. Government provides seeds and fertilisers and health centres and community health workers give training on how to cultivate and make good use of local crops. These initiatives are too recent to show results, but the kitchen gardens seem to be having positive outcomes already, according to household respondents, who stated that they had been very helpful in terms of diversifying their food intake.
1992 2000 2005 2007
20
10
0
30
40
50
60
Stunting Underweight Wasting
%
RWANDA’S PROGRESS IN HEALTH: Leadership, performance and insurance
16
Figure 9: Maternal mortality ratio, 2000 and 2005
Source: DHS 2000 and 2005.
Owing to limited data, it is not possible to assess how progress has been distributed across income groups or between rural and urban areas.
3.6 Births attended by skilled health personnel
The births attended by skilled personnel indicator is closely related to, and is an effective way of reducing, maternal mortality.6 In recent years, there has been a positive trend in the percentage of women assisted by skilled health personnel during delivery, from 20% in 1980, to 26% in 1992, 39% in 2005 and 52% in 2007. Professional attendance at delivery increased by almost 70% between 2000 and 2007 (Figure 10). Yet, in 2007, half of deliveries still occurred at home (49.2%), with 45.2% attended at health facilities (IDHS 2007-2008).
Figure 10: Proportion of births attended by skilled health personnel, 1980-2007
Source: Basinga et al. (2008); IDHS 2007-2008.
6. Skilled attendant at delivery is defined as assistance provided by a doctor, nurse or midwife (www.who.int/making_pregnancy_safer/topics/skilled_birth/en/index.html).
2000 2005
400
200
0
600
800
1,000
1,200
Per
100,
000
live
bir
ths
1,071
750
1992 20001980 2005 2007
20
10
0
30
40
50
60
%
17
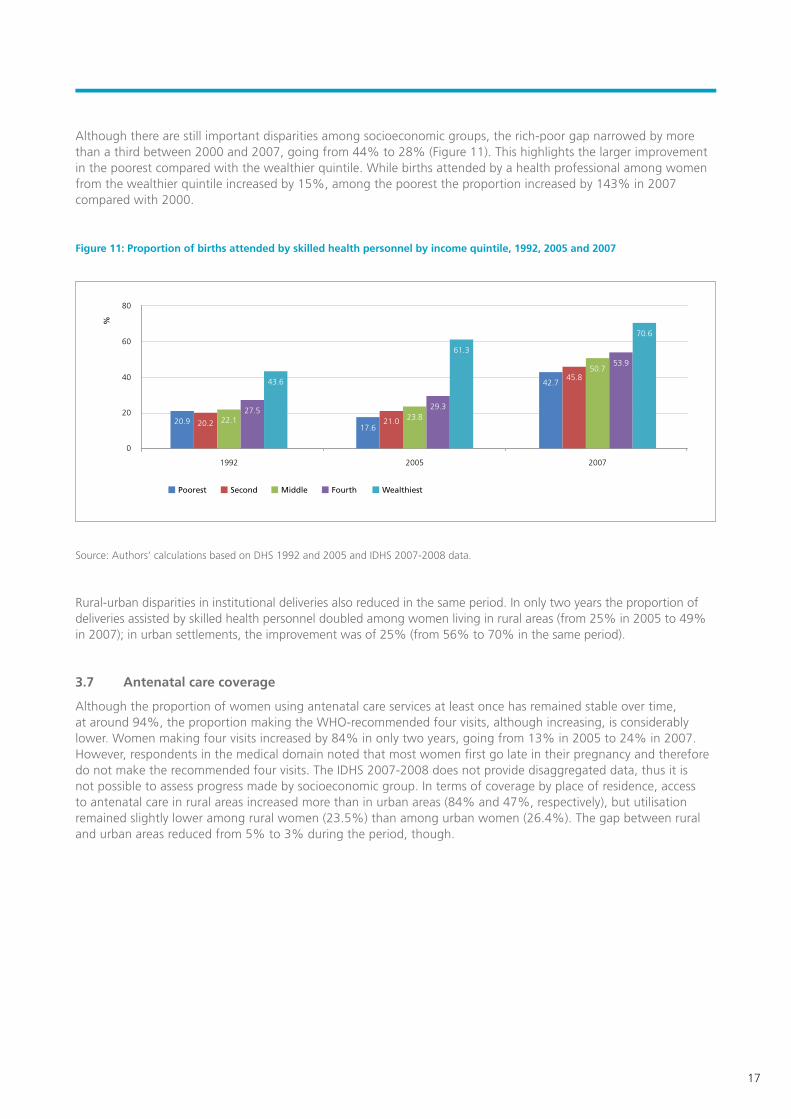
Although there are still important disparities among socioeconomic groups, the rich-poor gap narrowed by more than a third between 2000 and 2007, going from 44% to 28% (Figure 11). This highlights the larger improvement in the poorest compared with the wealthier quintile. While births attended by a health professional among women from the wealthier quintile increased by 15%, among the poorest the proportion increased by 143% in 2007 compared with 2000.
Figure 11: Proportion of births attended by skilled health personnel by income quintile, 1992, 2005 and 2007
Source: Authors’ calculations based on DHS 1992 and 2005 and IDHS 2007-2008 data.
Rural-urban disparities in institutional deliveries also reduced in the same period. In only two years the proportion of deliveries assisted by skilled health personnel doubled among women living in rural areas (from 25% in 2005 to 49% in 2007); in urban settlements, the improvement was of 25% (from 56% to 70% in the same period).
3.7 Antenatal care coverage
Although the proportion of women using antenatal care services at least once has remained stable over time, at around 94%, the proportion making the WHO-recommended four visits, although increasing, is considerably lower. Women making four visits increased by 84% in only two years, going from 13% in 2005 to 24% in 2007. However, respondents in the medical domain noted that most women first go late in their pregnancy and therefore do not make the recommended four visits. The IDHS 2007-2008 does not provide disaggregated data, thus it is not possible to assess progress made by socioeconomic group. In terms of coverage by place of residence, access to antenatal care in rural areas increased more than in urban areas (84% and 47%, respectively), but utilisation remained slightly lower among rural women (23.5%) than among urban women (26.4%). The gap between rural and urban areas reduced from 5% to 3% during the period, though.
1992 2005 2007
40
20
0
60
80
Poorest Second Middle Fourth Wealthiest
%
22.120.917.6
21.0 23.829.3
61.3
42.745.8
50.753.9
70.6
20.2
27.5
43.6
RWANDA’S PROGRESS IN HEALTH: Leadership, performance and insurance
18
Figure 12: Antenatal care coverage, 1992-2007
Source: DHS 2005 and IDHS 2007-2008; World Databank.
3.8 Family planning
Although the Family Planning Programme, offering modern contraception methods, has been running in Rwanda since 1962, in recent years the government has recognised that family planning is crucial in terms of poverty reduction, development and improved health status of the population. The country’s first-ever national Family Planning Policy was developed in 2005. A year later, President Kagame declared family planning a development priority, and it became a core strategy component along with population growth in the EDPRS (Solo, 2008; respondents).
Family planning has been a major challenge in Rwanda as, after the 1994 genocide, people felt the need to reproduce in order to overcome the loss of lives during the years of conflict. Additionally, having many children has always been the norm in the country. Even so, the government has slowly managed to introduce the concept into the mindset of the population, and in recent years the speed of progress in the use of family planning methods has been remarkable.
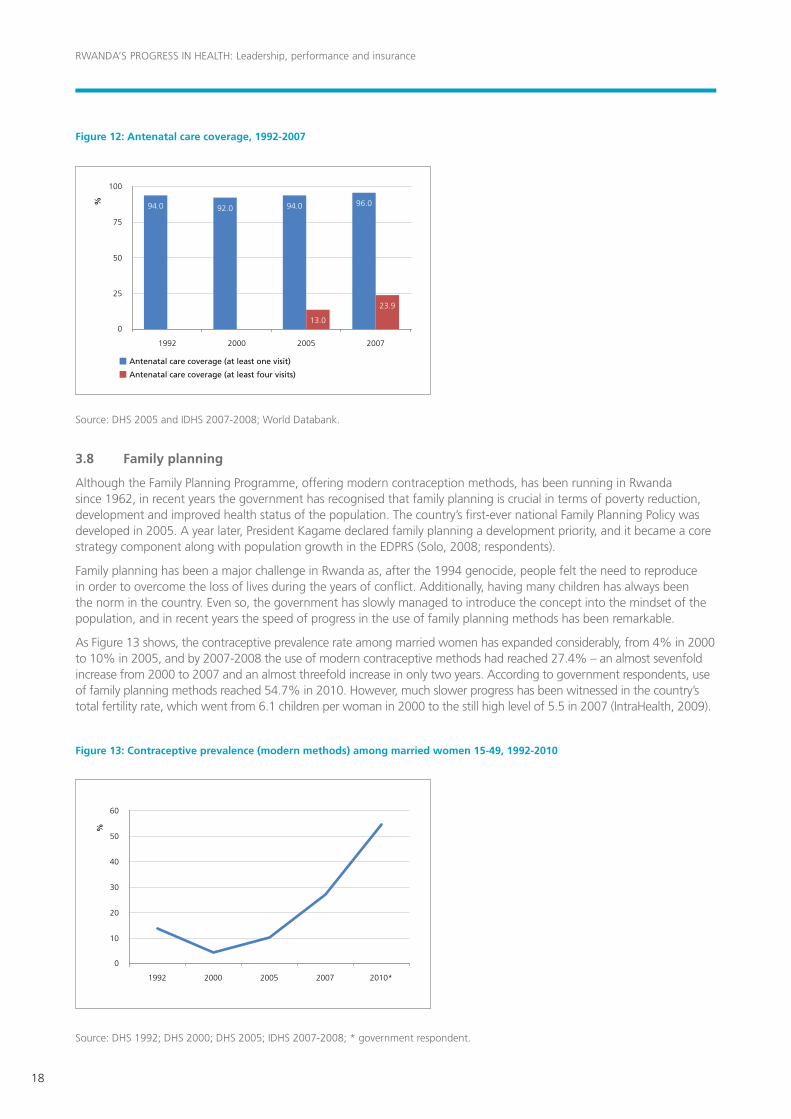
As Figure 13 shows, the contraceptive prevalence rate among married women has expanded considerably, from 4% in 2000 to 10% in 2005, and by 2007-2008 the use of modern contraceptive methods had reached 27.4% – an almost sevenfold increase from 2000 to 2007 and an almost threefold increase in only two years. According to government respondents, use of family planning methods reached 54.7% in 2010. However, much slower progress has been witnessed in the country’s total fertility rate, which went from 6.1 children per woman in 2000 to the still high level of 5.5 in 2007 (IntraHealth, 2009).
Figure 13: Contraceptive prevalence (modern methods) among married women 15-49, 1992-2010
Source: DHS 1992; DHS 2000; DHS 2005; IDHS 2007-2008; * government respondent.
1992 2000 2005 2007
25
0
50
75
100
Antenatal care coverage (at least one visit)
Antenatal care coverage (at least four visits)
% 94.0 92.0 94.0 96.0
23.9
13.0
1992 2000 2005 2007 2010*
10
0
30
20
40
50
60
%
19
Box 2: Family planning secondary posts
3.9 Malaria
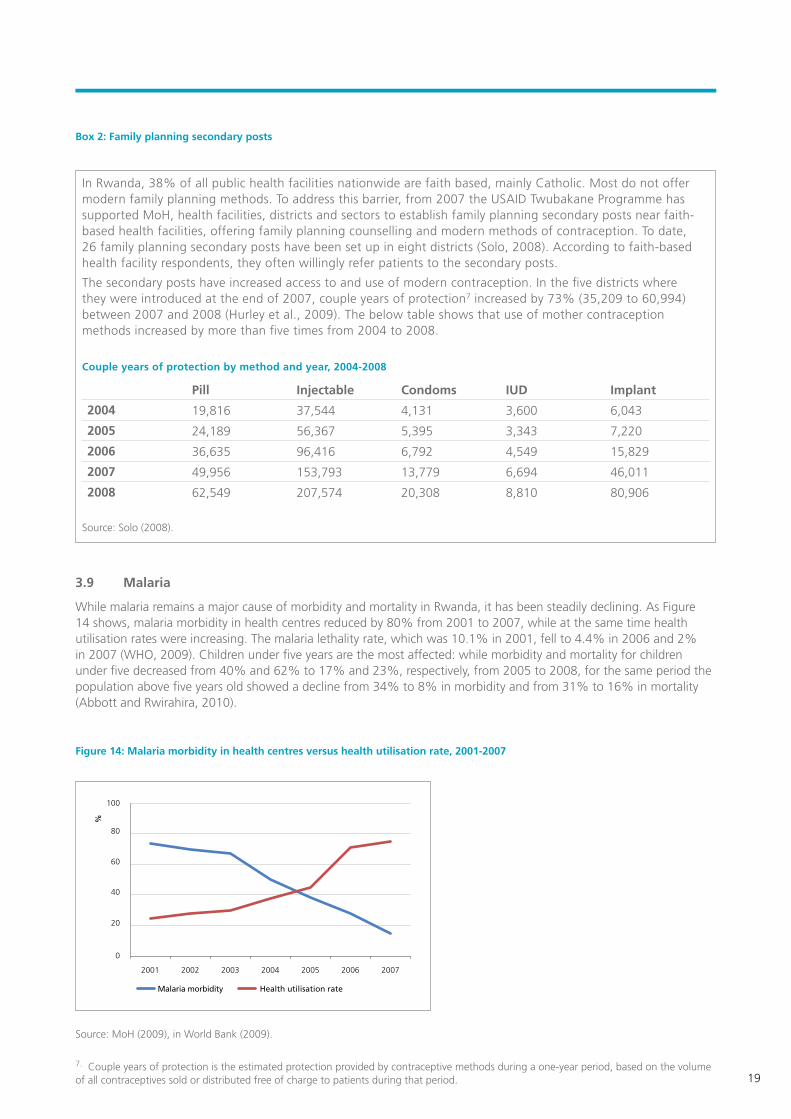
While malaria remains a major cause of morbidity and mortality in Rwanda, it has been steadily declining. As Figure 14 shows, malaria morbidity in health centres reduced by 80% from 2001 to 2007, while at the same time health utilisation rates were increasing. The malaria lethality rate, which was 10.1% in 2001, fell to 4.4% in 2006 and 2% in 2007 (WHO, 2009). Children under five years are the most affected: while morbidity and mortality for children under five decreased from 40% and 62% to 17% and 23%, respectively, from 2005 to 2008, for the same period the population above five years old showed a decline from 34% to 8% in morbidity and from 31% to 16% in mortality (Abbott and Rwirahira, 2010).
Figure 14: Malaria morbidity in health centres versus health utilisation rate, 2001-2007
Source: MoH (2009), in World Bank (2009).
In Rwanda, 38% of all public health facilities nationwide are faith‐based, mainly Catholic. Most do not offer modern family planning methods. To address this barrier, from 2007 the USAID Twubakane Programme has supported MoH, health facilities, districts and sectors to establish family planning secondary posts near faith-based health facilities, offering family planning counselling and modern methods of contraception. To date, 26 family planning secondary posts have been set up in eight districts (Solo, 2008). According to faith-based health facility respondents, they often willingly refer patients to the secondary posts.
The secondary posts have increased access to and use of modern contraception. In the five districts where they were introduced at the end of 2007, couple years of protection7 increased by 73% (35,209 to 60,994) between 2007 and 2008 (Hurley et al., 2009). The below table shows that use of mother contraception methods increased by more than five times from 2004 to 2008.
Couple years of protection by method and year, 2004-2008
Pill Injectable Condoms IUD Implant
2004 19,816 37,544 4,131 3,600 6,043
2005 24,189 56,367 5,395 3,343 7,220
2006 36,635 96,416 6,792 4,549 15,829
2007 49,956 153,793 13,779 6,694 46,011
2008 62,549 207,574 20,308 8,810 80,906
Source: Solo (2008).
7. Couple years of protection is the estimated protection provided by contraceptive methods during a one-year period, based on the volume of all contraceptives sold or distributed free of charge to patients during that period.
2001 2002 2003 2004 2005 2006 2007
Malaria morbidity Health utilisation rate
0
20
40
60
80
100
%
RWANDA’S PROGRESS IN HEALTH: Leadership, performance and insurance
20
According to a respondent from MoH, the government started fighting malaria seriously from 2004, using different policies and strategies. These included the distribution of insecticide-treated bed nets among pregnant women making antenatal care visits and within immunisation campaigns, which increased the percentage of people sleeping under nets from 4% to 70% between 2004 and 2007; implementation of the Home-Based Management of Malaria Strategy; and preventative treatment at health facilities. The increased rate of subscription to the Mutuelle has also played a key role in progress made in terms of reducing malaria-related morbidity and mortality (see Section 4).
3.10 HIV and AIDS
The first case of AIDS in Rwanda was detected in 1983. The HIV epidemic spread rapidly during the genocide as a consequence of the mass rapes that took place. Therefore, although statistics for the period are not reliable, it is generally acknowledged that, after the genocide, HIV prevalence was high. The reported figure for 2000 was 13.9%, although this is likely to be overestimated (Abbott and Rwirahira, 2010). Whatever the prevalence, significant improvements have been made in terms of fighting the disease, and most recent estimates (from 2007) place HIV prevalence in adults (15-49 years) at between 2.9% and 3.2% (UNAIDS, in Abbot and Rwirahira, 2010). The latter figure matches data in the DHS 2005, which placed prevalence at between 2.6% and 3.5%, suggesting that Rwanda may have been experiencing a stabilisation of the epidemic in the past few years.
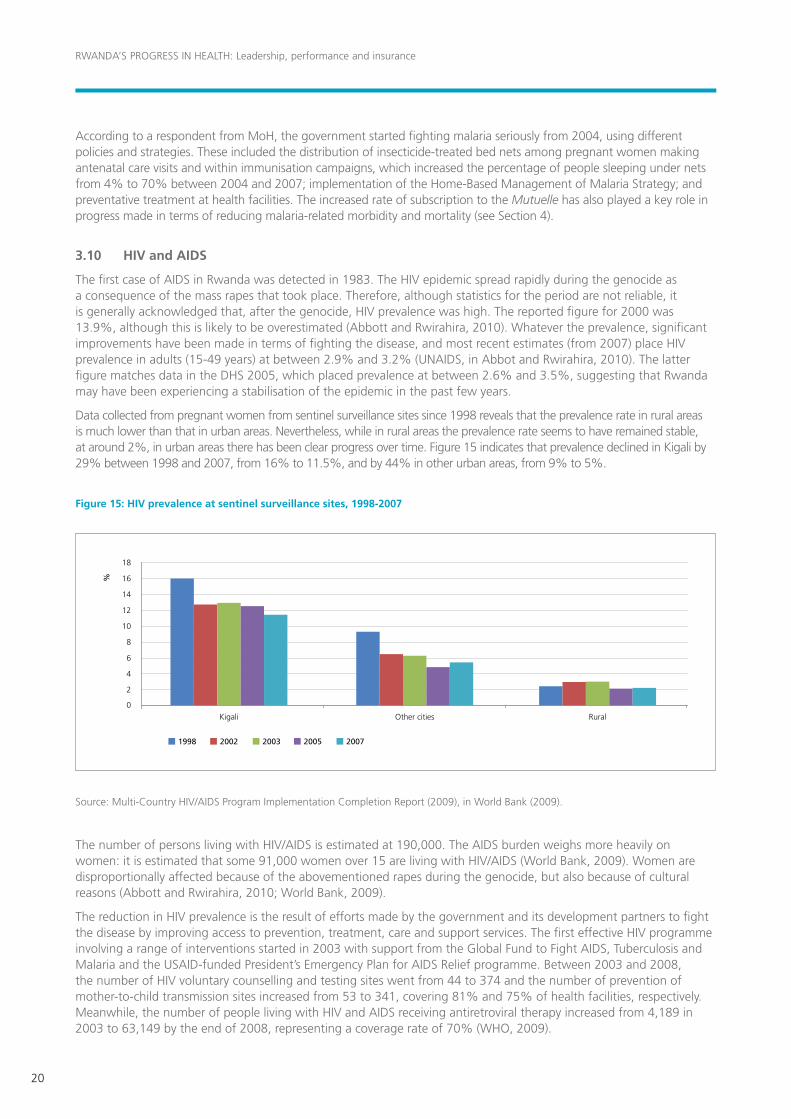
Data collected from pregnant women from sentinel surveillance sites since 1998 reveals that the prevalence rate in rural areas is much lower than that in urban areas. Nevertheless, while in rural areas the prevalence rate seems to have remained stable, at around 2%, in urban areas there has been clear progress over time. Figure 15 indicates that prevalence declined in Kigali by 29% between 1998 and 2007, from 16% to 11.5%, and by 44% in other urban areas, from 9% to 5%.
Figure 15: HIV prevalence at sentinel surveillance sites, 1998-2007
Source: Multi-Country HIV/AIDS Program Implementation Completion Report (2009), in World Bank (2009).
The number of persons living with HIV/AIDS is estimated at 190,000. The AIDS burden weighs more heavily on women: it is estimated that some 91,000 women over 15 are living with HIV/AIDS (World Bank, 2009). Women are disproportionally affected because of the abovementioned rapes during the genocide, but also because of cultural reasons (Abbott and Rwirahira, 2010; World Bank, 2009).
The reduction in HIV prevalence is the result of efforts made by the government and its development partners to fight the disease by improving access to prevention, treatment, care and support services. The first effective HIV programme involving a range of interventions started in 2003 with support from the Global Fund to Fight AIDS, Tuberculosis and Malaria and the USAID-funded President’s Emergency Plan for AIDS Relief programme. Between 2003 and 2008, the number of HIV voluntary counselling and testing sites went from 44 to 374 and the number of prevention of mother-to-child transmission sites increased from 53 to 341, covering 81% and 75% of health facilities, respectively. Meanwhile, the number of people living with HIV and AIDS receiving antiretroviral therapy increased from 4,189 in 2003 to 63,149 by the end of 2008, representing a coverage rate of 70% (WHO, 2009).
Kigali Other cities Rural
8
4
0
12
10
6
2
18
16
14
1998 2002 2003 2005 2007
%
21
3.11 Health infrastructure and personnel
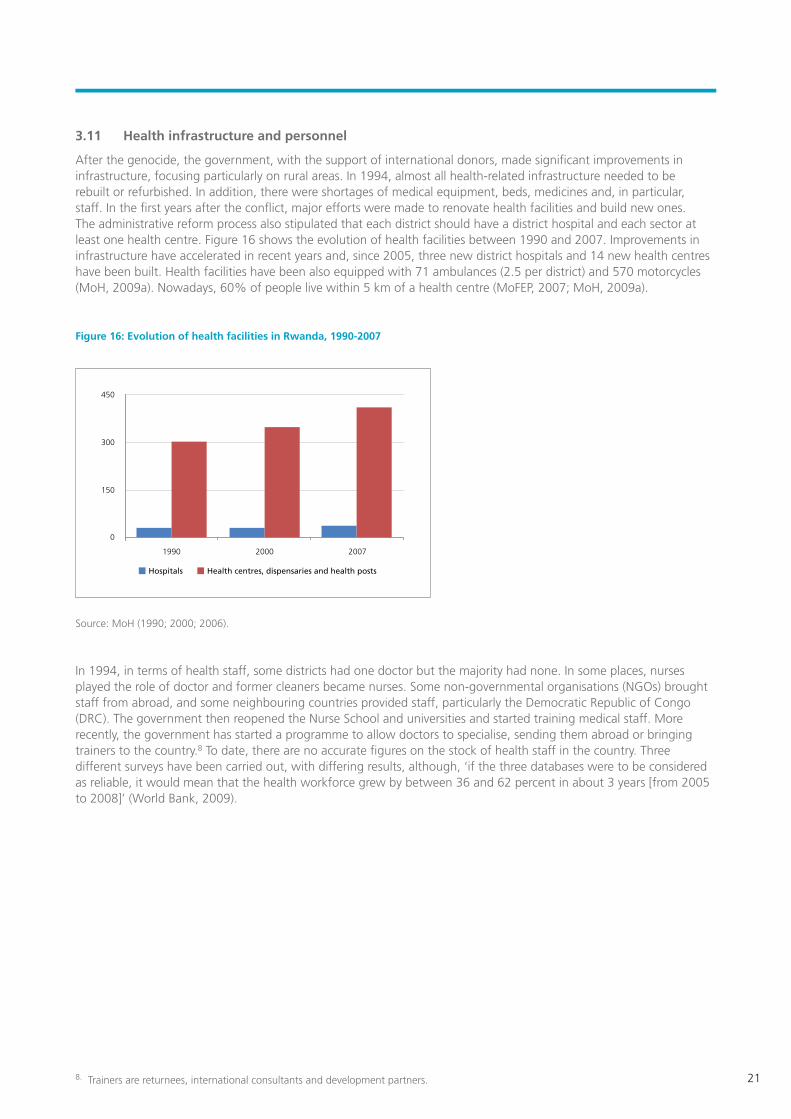
After the genocide, the government, with the support of international donors, made significant improvements in infrastructure, focusing particularly on rural areas. In 1994, almost all health-related infrastructure needed to be rebuilt or refurbished. In addition, there were shortages of medical equipment, beds, medicines and, in particular, staff. In the first years after the conflict, major efforts were made to renovate health facilities and build new ones. The administrative reform process also stipulated that each district should have a district hospital and each sector at least one health centre. Figure 16 shows the evolution of health facilities between 1990 and 2007. Improvements in infrastructure have accelerated in recent years and, since 2005, three new district hospitals and 14 new health centres have been built. Health facilities have been also equipped with 71 ambulances (2.5 per district) and 570 motorcycles (MoH, 2009a). Nowadays, 60% of people live within 5 km of a health centre (MoFEP, 2007; MoH, 2009a).
Figure 16: Evolution of health facilities in Rwanda, 1990-2007
Source: MoH (1990; 2000; 2006).
In 1994, in terms of health staff, some districts had one doctor but the majority had none. In some places, nurses played the role of doctor and former cleaners became nurses. Some non-governmental organisations (NGOs) brought staff from abroad, and some neighbouring countries provided staff, particularly the Democratic Republic of Congo (DRC). The government then reopened the Nurse School and universities and started training medical staff. More recently, the government has started a programme to allow doctors to specialise, sending them abroad or bringing trainers to the country.8 To date, there are no accurate figures on the stock of health staff in the country. Three different surveys have been carried out, with differing results, although, ‘if the three databases were to be considered as reliable, it would mean that the health workforce grew by between 36 and 62 percent in about 3 years [from 2005 to 2008]’ (World Bank, 2009).
8. Trainers are returnees, international consultants and development partners.
1990 2000 2007
150
0
300
450
Hospitals Health centres, dispensaries and health posts
RWANDA’S PROGRESS IN HEALTH: Leadership, performance and insurance
22
4. Drivers of progress
Rwanda’s achievements can be linked to a series of reforms and policies made in an effort to rebuild the country after the genocide in 1994. Other broader factors have contributed both directly and indirectly to impressive improvements in health, including the attainment of peace and stability and the process of reconciliation in the post-genocide period. In the health sector in particular, progress can be explained as resulting from the combined impact of a number of factors, as outlined below.
4.1 The demand side: the Mutuelle de Santé
After the genocide, one of the challenges Rwanda faced in health was how to solve the issue of health financing. In the previous system, people were supposed to receive health care, treatment and drugs free of charge, but in reality services were not available and access depended on people’s ability to pay. Additionally, because of these barriers to access, people relied heavily on traditional medicine, traditional birth attendants and midwives and family members. They approached health facilities only when they were extremely sick, thus mortality rates were high.
The community health insurance scheme, or the Mutuelle de Santé, was proposed to respond to low utilisation of health services by improving financial access to health services, particularly for underserved populations. They were conceived of as being able to spread the financial risk of seeking care across their membership base. Although some schemes were first set up in the 1960s, it was in 1999 that the scheme was piloted in three districts (Byumba, Kabgayi and Kabutare), showing encouraging outcomes in terms of health service utilisation (MoH, 2004). In 2004, the government, based on lessons learnt, slowly scaled up the Mutuelle system, and by 2006 all health facilities were working with a Mutuelle.
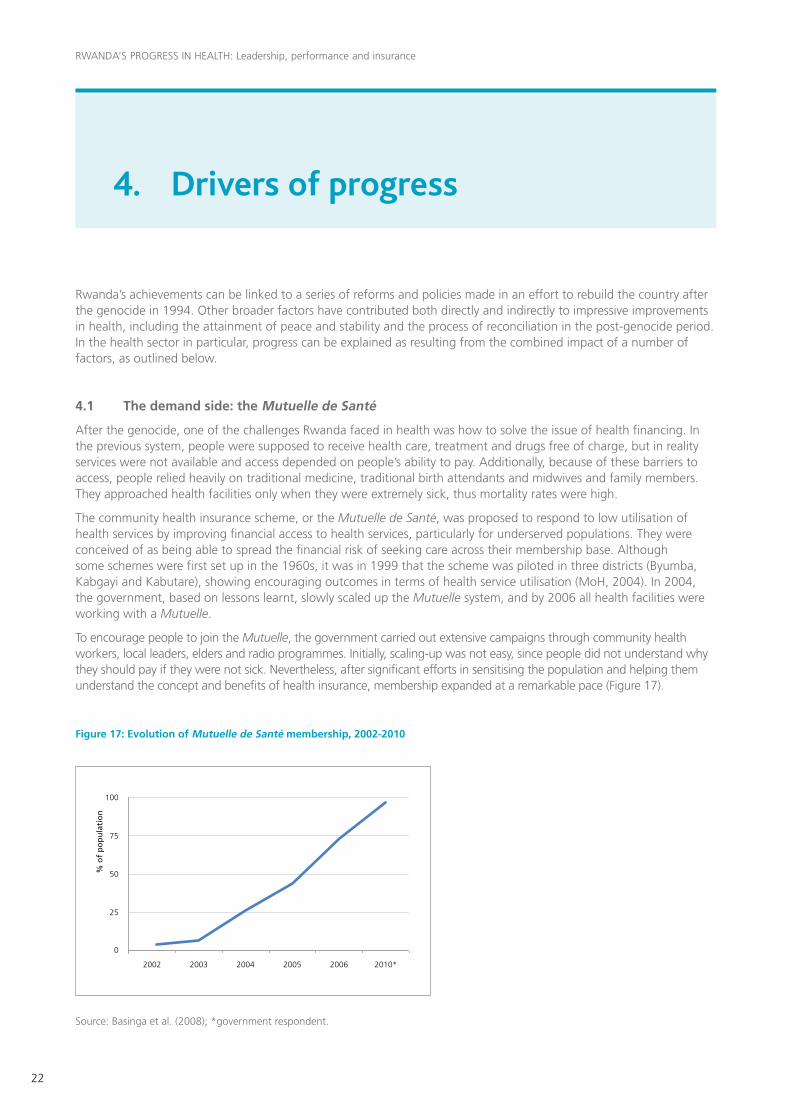
To encourage people to join the Mutuelle, the government carried out extensive campaigns through community health workers, local leaders, elders and radio programmes. Initially, scaling-up was not easy, since people did not understand why they should pay if they were not sick. Nevertheless, after significant efforts in sensitising the population and helping them understand the concept and benefits of health insurance, membership expanded at a remarkable pace (Figure 17).
Figure 17: Evolution of Mutuelle de Santé membership, 2002-2010
Source: Basinga et al. (2008); *government respondent.
2002 2003 2004 2005 2006 2010*
25
75
0
50
100
% o
f p
op
ula
tio
n
23
Box 3: Mutuelle de Santé scheme
The impact of the Mutuelle de Santé in terms of improving access to services has been remarkable. It has given the population the chance to access health services at an affordable cost and before conditions worsen; the latter also helps reduce the cost of services, since less severe cases are now treated. Meanwhile, reduced sickness also lets people work and engage in productive activities, which in turn improves their livelihoods and leads to better living conditions.
‘Before the introduction of the Mutuelle people were dying at home because they did not have the money to pay for health. Now, because of the nominal amount paid, nobody fears to approach the health facilities’ (MoH district official in charge of Mutuelle, Nyamagabe).
The change in health-seeking behaviours has been impressive. Uptake of HIV-related services is a case in point: previously, people were not seeking services; now, according to one health centre respondent, more than 2,000 people have approached the centre to use HIV-related services (voluntary counselling and testing, prevention of mother-to-child transmission, etc.). This, in turn, is having an impact on HIV prevalence.
‘Since the introduction of the Mutuelle, even if I have a headache I come to the health centre. Sickness has reduced dramatically; we can tell because the queues are much less’ (HIV-positive patient, Biryogo Health Centre).
Thus, according to local respondents in the medical field, the Mutuelle has had a major impact in terms of controlling and diminishing the prevalence of epidemics, as it has made drugs available to everybody at an affordable cost.
‘As people were not able to buy drugs, they were dying of malaria. Nowadays, although malarias is still present in the country, it is not a major public health issue anymore’ (district hospital staff in charge of monitoring and evaluation, Nyamagabe).
Challenges do exist. Some respondents noted that the Mutuelle has run into significant debts with the health facilities, leading to a critical gap in the health facility’s finances. This translates into the facilities being unable to buy drugs and laboratory materials. However, others stated that, although the Mutuelle had financial challenges at the beginning, and although health facilities had issues getting the payments, these were initial teething problems and the situation was improving. Data suggest that Mutuelle contributions towards total health expenditure are included in the 28% financed from internal private sources, but gathering accurate figures on the share of total costs financed by Mutuelle membership contributions has been difficult.
At the beginning, the Mutuelle covered health centres at district level, which provided only basic care services; therefore, the money collected was enough to cover the cost of services. With the integration of secondary and tertiary care, the Mutuelle now also covers the provision of more expensive treatments; the level of funding needed to cover these costs might threaten the sustainability of the scheme. Currently, MoH is evaluating a new policy in which contributions will be according to members’ ability to pay.9 Additionally, the government, with assistance from WHO, is exploring the creation of a new structure that will integrate all health insurance schemes.
9. So far, the Mutuelle de Santé and the Rwanda Medical Insurance Company and other schemes have operated independently, with other schemes contributing 1% of collection to the Mutuelle.
Within the Mutuelle, each person contributes RWF1,000 (less than $2) per year, with MoH covering an extra RWF1,000 per capita. MoH or development partners pay for those who cannot. Each member of the family needs to be affiliated. Additionally, when someone goes to the health centre, they pay a flat fee of RWF200.
The Mutuelle system follows the health care delivery system of referral. Thus, if a person cannot be treated at the health centre, they are referred to the district hospital, where they have to pay 10% of the treatment, with 90% paid by the Mutuelle fund at district level. If the case exceeds the competence of the district hospital, the patient goes to a referral hospital, where 10% is paid by the beneficiary and the other 90% by MoH.
Each district has a director appointed by MoH to manage and administer the Mutuelle, and in each health facility there is a special office that deals with the Mutuelle. A Mutuelle supervisor checks that the money is actually spent (e.g. all the medicines at the health centre are provided by MoH together with a list of prices so the centre cannot inflate the invoices). Every month, the health centre makes an invoice for the Mutuelle to be reimbursed to the health facility. There are tight supervision and control measures in place, with one evaluation per quarter, an audit once a year and continuous and strict supervision of finance and invoices.
RWANDA’S PROGRESS IN HEALTH: Leadership, performance and insurance
24
4.2 The supply side: performance-based financing and human resources
With the Mutuelle working on the demand side of health services, the need to improve service delivery was addressed by improving the quantity and quality of staff.
4.2.1 Availability and motivation of staff
To increase the number of staff, the government decided to increase the salaries of health personnel compared with other civil servants. According to a government respondent from MoH, since 2006 a general practitioner has been paid three times more than other civil servants with a similar level of qualifications, and nurses are paid four times more than other professionals with similar qualifications.10 As salaries have increased, medical staff working in the private sector have started joining health facilities.
Another measure that helped was the harmonisation of health sector salaries into categories, to eliminate disparities between salaries paid by development partners. Thus, all health personnel have the same salary, whether they are paid by NGOs, donors or the government. Additionally, non-qualified health workers have been removed from the system and, more recently, efforts have been put in place to train and encourage staff as well as community health workers to improve their qualifications. To address the shortage of doctors in some districts, MoH is piloting ‘task shifting’ from doctors to nurses. For instance, with guidance from doctors, nurses are in charge of HIV testing, classifying people according to their status, CD4 count and making decisions on treatment eligibility.
4.2.2 Performance-based financing
The government has also instituted a new mechanism to boost quality and quantity of services, which essentially consists of attaching monetary incentives to performance contracts. The PBF scheme is funded mainly through the HIPC Initiative. It started as a pilot in two districts (Butare and Cyangugu) in 2001, and in 2006 was approved by the cabinet and scaled up. PBF establishes a direct link between service delivery, results and payment. The government ‘buys’ health outputs by supplementing health workers’ salaries on a performance basis. Health facilities also receive additional money on the basis of institutional performance.
As with any other performance contract, PBF establishes a set of indicators covering quantitative and qualitative aspects of health service delivery, against which performance is measured. Performance indicators are strict, but they are also achievable, practical and feasible to reach, according to respondents. While measuring quantity may be relatively straightforward, though, to measure quality evaluators need to verify patients’ files against a set of procedures that need to be fulfilled. In addition, and to triangulate with patients’ files, evaluators carry out spot checks with patients to obtain feedback and check coherence. Overall, 40% of the total PBF score is assessed by peer evaluators and 60% by MoH personnel.
Quality evaluations are carried out quarterly, whereas quantitative indicators are followed up on monthly, using data uploaded regularly onto a server directly linked into MoH. At every administrative level, there are rankings in place that motivate staff on two fronts: 1) the motivation is monetary, with institutions that perform better receiving more money; and 2) those who perform better receive performance awards that speak to issues of honour and competitiveness embedded in the culture. This system enhances commitment, and staff take it seriously.
10. Better salaries have also attracted medical staff from neighbouring countries, which explains the large number of Congolese doctors in the country: ’If there are three doctors in the district, one is Congolese’ (health researcher, Kigali).
25
Box 4: PBF evaluation process
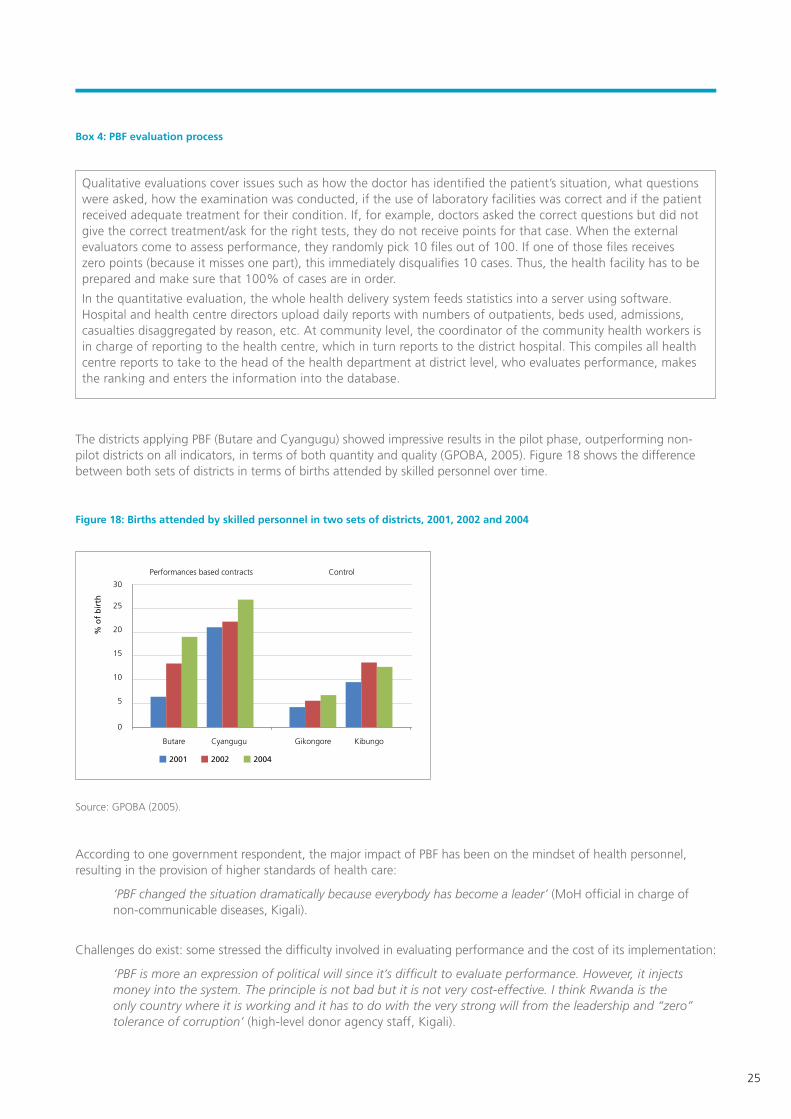
The districts applying PBF (Butare and Cyangugu) showed impressive results in the pilot phase, outperforming non-pilot districts on all indicators, in terms of both quantity and quality (GPOBA, 2005). Figure 18 shows the difference between both sets of districts in terms of births attended by skilled personnel over time.
Figure 18: Births attended by skilled personnel in two sets of districts, 2001, 2002 and 2004
Source: GPOBA (2005).
According to one government respondent, the major impact of PBF has been on the mindset of health personnel, resulting in the provision of higher standards of health care:
‘PBF changed the situation dramatically because everybody has become a leader’ (MoH official in charge of non-communicable diseases, Kigali).
Challenges do exist: some stressed the difficulty involved in evaluating performance and the cost of its implementation:
‘PBF is more an expression of political will since it’s difficult to evaluate performance. However, it injects money into the system. The principle is not bad but it is not very cost-effective. I think Rwanda is the only country where it is working and it has to do with the very strong will from the leadership and “zero” tolerance of corruption’ (high-level donor agency staff, Kigali).
Qualitative evaluations cover issues such as how the doctor has identified the patient’s situation, what questions were asked, how the examination was conducted, if the use of laboratory facilities was correct and if the patient received adequate treatment for their condition. If, for example, doctors asked the correct questions but did not give the correct treatment/ask for the right tests, they do not receive points for that case. When the external evaluators come to assess performance, they randomly pick 10 files out of 100. If one of those files receives zero points (because it misses one part), this immediately disqualifies 10 cases. Thus, the health facility has to be prepared and make sure that 100% of cases are in order.
In the quantitative evaluation, the whole health delivery system feeds statistics into a server using software. Hospital and health centre directors upload daily reports with numbers of outpatients, beds used, admissions, casualties disaggregated by reason, etc. At community level, the coordinator of the community health workers is in charge of reporting to the health centre, which in turn reports to the district hospital. This compiles all health centre reports to take to the head of the health department at district level, who evaluates performance, makes the ranking and enters the information into the database.
Butare
Performances based contracts Control
Cyangugu Gikongore Kibungo
10
5
0
15
20
25
30
2001 2002 2004
% o
f b
irth
RWANDA’S PROGRESS IN HEALTH: Leadership, performance and insurance
26
One respondent also challenged the effectiveness of the PBF in relation to achieving a better quality of services, as well as its success in motivating staff:
‘I have my doubts as to whether it improves quality, but it does improve quantity. Not sure if you attend patients better because of the PBF, for sure you attend more. [...] Some criteria to measure performance can act in the opposite direction; for instance, health centres have to meet every month and attendees have to sign the agenda; if a signature is missing then the health centre gets zero points. In certain cases it is the law of “everything or nothing,” so if someone realises they are not going to reach the target set, it becomes a negative incentive, why make the effort?’ (director of health centre, Kigali).
Some believe PBF may be a donor trend with no real impact on service delivery. Critics consider it just a payment mechanism that incentivises providers to focus on certain aspects while neglecting others. Others sustain that PBF can trigger comprehensive reforms by addressing structural problems of public health services (e.g. low responsiveness, inefficiency and inequity) (Meessen et al., 2010). This debate exceeds the scope of this case study, but it is clear that PBF is important in Rwanda, and that political commitment at the highest level and strong accountability and control mechanisms have been essential to its development and success so far (Rusa and Fritsche, 2007).
4.3 Political leadership, accountability mechanisms and policymaking
4.3.1 Strong leadership and high political commitment
The government has shown strong political leadership in rebuilding the country since the genocide. Similarly, it has committed to ensuring the well-being of all citizens and to pursuing universal health care for all (IntraHealth, 2009). This strong leadership has been crucial in fostering the strategies and policies that lie behind the country’s ambitious health sector reforms. All respondents identified political leadership as the most important factor in driving improvements in the health sector:
‘The magic bullet of Rwanda: government leadership. For example, the Mutuelle; it started in Burundi but it never worked there, even the donor coordination system has succeeded because of that’ (donor health specialist, Kigali).
‘If authorities are interested and committed to any programme or domain, then you can be sure that you will have results’ (high-level donor agency staff, Kigali).
‘All over the world you have people starting health insurance schemes but here you have the government encouraging it’ (high-level donor agency staff, Kigali).
‘In terms of political determination to improve conditions of ordinary people, Rwanda’s leadership stands out in Africa’ (executive director of Africa Progress Panel).
The current president has been instrumental in the process of change in Rwanda. Despite the controversy surrounding President Kagame on issues to do with political freedom, his role in the civil war, interventions in DRC and his degree of authoritarianism, he is widely admired and respected by the population for his accomplishments in development and in restoring security and stability. Several respondents from different spheres stressed that, if the president says something, the population will do what he says. Presidential initiatives are behind most successful policies and programmes implemented. The best example of this is the Vision 2020 document, which did involve extensive consultations but was instigated following a presidential initiative (MoFEP, 2000).
Top leadership is complemented by leadership at various levels. This has been found to be critical to progress, as local authorities represent a reference for their population. Strong leadership, from the president to village-level traditional leaders, has been crucial in motivating and engaging the population in the task of reconciling and rebuilding the country. In doing so, Rwandan policymakers have deliberately brought back traditional values from the past to reinsert them in the mindset of the population. Such values not only have contributed to the process of reconciliation but also have been applied strategically to policies aiming to foster the country’s development (see Annex 1).
27
Leadership has been also instrumental in attracting international support from multilaterals, bilaterals and NGOs:
‘It’s a proactive government that knows how to get support and it has a strong position that makes it able to negotiate with development partners on an equal basis, even receiving a significant amount of aid’ (high-level donor agency staff, Kigali).
4.3.2 Good governance: accountability and control mechanisms
Leadership has also played a key role in developing and supporting procedures of good governance and accountability, through which policies are implemented, which in turn have been important drivers of progress. Supported by development partners, MoH has developed control mechanisms and standards at various levels to ensure that rules and regulations are followed and objectives are accomplished. The system in place to operationalise accountability thus ensures that there is constant feedback from the bottom to the central level and vice versa. When policy moves to the implementation phase, for example, external and internal evaluations against verifiable objectives are conducted on a regular basis. Accountability mechanisms also apply to the financial sphere, where funds are controlled at every level of implementation.
In addition to systematic evaluations and standards with which all levels have to comply,11 the Kagame administration has introduced imihigo agreements, or performance contracts, as a means of enforcing social contracts and obligations. The imihigo agreements are embedded in precolonial Rwandan culture, when a cohesive society predominated and moral standards and commitment to the community were high (see Annex 1).
This traditional system has been modernised: since 2006, every civil servant has a performance contract associated with their post to which they have to commit and, more recently, on which they have to swear an oath. Each performance contract is linked to a set of achievement indicators that make up an individual score. The score takes into account what has been done as a team but also what has been done as an individual, thus both team and personal objectives are involved. There is a minimum score that every staff member needs to meet; reaching less than 70% of achievement means the person may lose their job. Assessment of performance contracts is a twofold process: each individual evaluates themselves against the set of objectives established and an external evaluator also assesses performance. This avoids disagreements over the evaluation.
Performance contacts are made at all levels. At district level, mayors sign them directly with the president; districts have them with sectors, which in turn have them with cells, which in turn have them with villages. Village chiefs have them with families, on issues such as sending children to school, affiliating every member of the family with the Mutuelle, giving birth at clinics, HIV testing and having a kitchen garden. Since 2005, some districts have had fines in place, for instance for households where women deliver at home instead of at the health centre (Chambers, 2010).12 In the health sector, the performance contract comes under the unique PBF scheme (see Section 4.2.2).
4.3.3 Policymaking according to the reality: scaling up pilots based on evidence
The success of many of the government’s policies and strategies can be attributed in large part to the process of policymaking. To formulate policies that match the needs of the population, Rwandan policymakers apply a participatory approach, involving communities in identifying their own problems. In the field of health, the government, with support and technical assistance from development partners, has carried out extensive and continuous consultations and assessments to identify bottlenecks in provision as well as determinants of the health status of the population. Thus, most of the policies that this section identifies as drivers of progress are the result of sound assessment of the challenges and extensive participatory discussions on how to overcome them. Rwanda is continuously learning from and adapting its health service delivery strategy to the reality on the ground. For instance, one successful practice has involved bringing doctors’ academic knowledge together with people’s understanding of their own problems at grassroots level, narrowing the gap in knowledge between people belonging to two different realities. This ensures community ownership of policies, which in turn contributes to the quality of services.
‘Doctors and community members sit together as partners and they are able to discuss and plan what is best to meet people’s needs’ (high-level donor agency staff, Kigali).
11. Evaluations can come at any time without notice.12. The fine was originally set at RWF1,000-2,000 in 2005-2006, but in 2008 it was increased to RWF5,000. A health centre director explained that, ‘women would come and pay the RWF2,000 easily; it wasn’t enough of a disincentive; since we raised it, no-one delivers at home.’ Likewise, it has become an obligation for pregnant women to attend their first antenatal care visit accompanied by their husband so they can undergo joint HIV testing. To enforce the national policy requirement and to increase the number of women taking up antenatal care, the health centre has begun fining women who attend their first consultation after the first trimester RWF500.
RWANDA’S PROGRESS IN HEALTH: Leadership, performance and insurance
28
Policies and strategies implemented in Rwanda often start as pilot initiatives, usually under NGO supervision. If they show results, the government scales them up at national level. For instance, good results from pilots spurred rollout of the Mutuelle and PBF, tailored to the national context. The government’s ability to adapt strategies in light of local realities has also been essential to strengthen health services.
‘Any policy made starts from the bottom. People come from central level, sit with the district, analyse and even go to grassroots level to gather information. Then they go back and design a policy that comes back to the district, which can modify it and make innovations in its implementation’ (district government officer in charge of health, Nyamagabe).
Thus, information flows from grassroots level to district level up to central level, and comes back to the district in the form of policies and strategies. All policies are designed at central level, with the district and communities planning how to implement them. For instance, Nyamagabe district is the only one that has family planning clubs (made up of elders and opinion leaders), which were designed with the community to meet local realities.
‘If people are not involved, it is difficult to implement the policy’ (district government officer in charge of health, Nyamagabe).
Additionally, the government is reported to be unafraid of trying different strategies and to be receptive to ideas and initiatives that have shown good results in other countries, in many cases following suggestions from development partners and piloting them at small scale to gather evidence on whether their application suits the Rwandan reality. This was the case with the WHO Integrated Management of Child Illness strategy, which was adapted to the Rwandan reality by including neonatal diseases (see Section 3.2).
4.4 Decentralisation and community participation
4.4.1 Government working closer to the population
Critical to the government’s full reform of the health sector is the National Decentralisation Policy, adopted in 2000 with support from development partners.13 The main objective of decentralisation in Rwanda is to empower people to determine their own future by being involved in the planning and management of their own development process. It has been successful because it has been supported by strong national leadership and effective systems of accountability.
Decentralisation of health came into practice in 2006, with the alignment of health districts with administrative districts.14 Policymaking and administrative responsibility for health centre management and hospital supervision were transferred to district health departments. The latter became the operational unit for health, with the following new responsibilities: organisation of health services in health centres and the district; management of resources and supply of drugs by district hospitals; and supervision of community health workers (Basinga et al., 2008).
‘The process of decentralisation of health translated into a well-synchronised health structure in which every level of the health care delivery system has its job description with well-defined responsibilities and activities. There is a clear structure of vertical responsibilities in place, in which everyone knows what they should be doing, which allows for minimum overlap’ (district hospital medical staff, Nyamagabe).
Within the district, health decisions are made through various committees, in which the participation of the community is integral. The community plays a role in the planning, execution and monitoring of primary health care activities, including the provision of certain services (e.g. nutrition, mental health, family planning) at the grassroots level (World Bank, 2009). This has helped in meeting the population’s needs, as problems are solved jointly at local level.
13. Decentralisation in Rwanda is being implemented in three phases: Phase 1 (2000-2003) concentrated on devolution of functions and responsibilities, supporting legislation and policy reforms, and design of intergovernmental financial transfers. Phase 2 (2004-2010) concen-trated on strengthening districts and local resource management and mobilisation, participatory planning and the design of accountability mechanisms. Phase 3 (2011-2015) will concentrate on decentralising to the sector level and below, down to the cells, and on expanding and deepening local citizen participation and accountability (Brinkerhoff et al., 2009). 14. Territorial administrative reform transformed Rwanda from a country of 12 provinces, 40 health districts and 106 administrative districts to one of 4 provinces and 30 districts. In the previous structure, health districts were defined according to the location of district hospitals and operated relatively independently of administrative districts, which complicated collaboration at both central and local levels (Brinkerhoff et al., 2009; interviews).
29
Along with involving the community in decision making, the new structure has brought health services closer to the people, since each sector has to have at least one health centre. For instance, in the previous structure, it was a challenge to reach HIV-positive people: even if they came for testing, they would then go back to their community without knowing the results, as the samples had to be sent to the laboratories in Kigali. Nowadays, most health centres have the equipment to provide the test results on the spot, and eligibility for treatment is also carried out at the health centre at sector level.
Decentralisation thus redirects some responsibilities from MoH to the district, which now deals directly with its catchment area. Being closer to the people, the district knows the needs of its population better. It is also better positioned to address them in a more efficient way, as it is no longer necessary to go up to central level to find solutions to local problems. As local authorities are close to the community, messages can be communicated easily.
Decentralisation has also favoured multi-disciplinary approaches to health, since sectoral departments at district level are working in close proximity. For example, the department of health can work together with the department of agriculture to deal with malnutrition.
Another major outcome of decentralisation has been strengthened planning at every level. As health facilities have become autonomous, they have begun to manage their own resources, to develop their own activity plans and to hire their own staff. The district has a budget line for health facilities and requests funding for them, but the money goes directly to the facilities.
Decentralisation has also had an important impact in terms of retaining personnel, particularly in remote areas. Previously, staff were hired at central level and allocated to districts or sectors; doctors would accept a job in a rural area but ask to be transferred to more central locations soon after. Now, funding is allocated to the health facility instead of to a specific job or person. Instead of moving within the health system if they want to move out from remote areas, people need to leave the job and look for a position elsewhere, that is, their post is not guaranteed.
4.4.2 Targeting the rural poor: community health workers
Alongside the process of decentralisation that empowered communities to participate in planning and implementation, health service delivery was brought closer to the population through the integration of community health workers into the local government health structure. These workers became the last level in the decentralisation of health care at the village level and enabled the expansion of health care services to rural areas.
The concept of community health workers was introduced in the late 1990s to respond to the shortage of health staff after the death of many medical personnel; prior to this, there were community health mobilisers, who worked only in the field of family planning. Community health workers live and work in their own community. Since 1995, MoH’s Community Health Unit has trained about 12,000 people from communities in basic health care (World Bank, 2009). Many of them having worked informally for a long time, their role was formalised within the health system in 2008 with the introduction of the National Community Health Policy.
Nowadays, community health workers are elected by their community and are trained to deliver basic health care services and to promote behavioural change. They receive training to cure basic diseases in the village and are equipped with a basic medical kit, which includes Oral Rehydration Therapy, antibiotics for respiratory infections and medicines for malaria. They have many responsibilities, including sanitation, hygiene, maternal and child health,15 family planning and contraceptive distribution, HIV testing, nutrition and malaria prevention. They also need to report on a monthly basis into a server that is connected directly to the district.
Initially, there were two community health workers per village, a man and a woman; this number was then increased to four, each with specific responsibilities.16 Additionally, every health centre has a fulltime non-medical coordinator for community health workers in the sector. In turn, the district organises and supervises the coordinator (Chambers, 2010). Community health workers also meet the president once a year and share their problems with him, which indicates the importance government gives to this cadre.
Community health workers are thus a central factor of progress in health, as they intervene in and prevent health problems before they become serious. They have a key role in sensitising the population about HIV, the importance of vaccinating children, using family planning, undertaking antenatal care and ensuring birth delivery at health centres, as well as promoting basic hygiene and sanitation measures such as hand washing, wearing shoes, having covered toilets, drinking boiled water, clearing bushes and maintaining general cleanliness. They were also vital in helping people understand the dynamics and importance of the Mutuelle.
15. Community health workers check the nutritional status of children once a month, examine, prescribe and administer first-level medica-tion to treat common illnesses and refer those needing further attention to health centres. 16. In the past year, some districts have started electing two more workers to take care of non-communicable diseases and palliative care.
RWANDA’S PROGRESS IN HEALTH: Leadership, performance and insurance
30
According to the World Bank (2009), the use of community health workers has contributed to immunisation, improved family planning and reproductive health and malaria prevention. Additionally, their work on the nutrition front, although relatively recent, has started to show positive results. They have also had a significant impact on maternal and child mortality.17
In recent years, with support from development partners, the scheme has been strengthened through the introduction of ambulances located in strategic places, which community health workers can request by making calls without charge on mobile phones provided to them for this purpose.18 Additionally, MoH is piloting a set of measures to support them by grouping them in cooperatives that receive a small amount of money to start income-generating activities. The idea is to help them at the beginning and once they are settled incorporate them into PBF. They also receive small monetary incentives, such as RWF500 for each woman they bring to deliver at health centres.
4.5 Coordination of development partners
The progress made in Rwanda and the reforms carried out in the health sector would not have been possible without the support of development partners. But, and critically, the government has managed to relate to donors as true partners. Development partners have not only played a financial role but also have been included in planning and implementation, sitting with government authorities and other stakeholders at both central and local level. They have also had a positive role in terms of the spread of ideas and good practice.
Assistance is framed in a way that meets the needs identified in government strategic plans, rather than being donor-driven, and partners have to align with government policies, mainly the HSSP.
‘Development partners have no choice but to align. There is strong coordination. [...] We were going to build a health centre, but the government says, “no, we need a road to improve access to the health centre instead”’ (donor health specialist, Kigali).
The government encourages assistance that is channelled through the sector budget support mechanism, and an increasing number of donors are complying with this. Major efforts are also underway towards the consolidation of aid coordination and harmonisation. A SWAp document is being finalised, but its implementation is already occurring. Harmonisation and mobilisation of funds for the health sector have helped in framing and making more efficient use of external funds.
In addition, the government has been skilled at integrating vertical funds into health services and programmes to strengthen the health system. The use of an integrated approach to the provision of funds for HIV/AIDS, tuberculosis and malaria, among others, through health facilities has allowed for the reinforcement of other underfunded components of primary health care while scaling up HIV services, for instance. One evaluation shows that key indicators of primary health care increased significantly after the introduction of HIV services in those health facilities (Basinga et al., 2008).
‘We were supposed to work on HIV but in reality we support all the needs of the health centre, from repairing the building, to training staff to providing materials and equipment’ (international NGO staff, Nyamagabe).
MoH is the focal point for partner coordination and, under its leadership, the Health Sector Cluster Group operates as a forum for the coordination of all partners, supported by Technical Working Groups. This is the formal forum for government and development partners to meet to exchange and discuss sector policy and planning and to set priorities.
However, even before Rwanda passed its Aid Policy in 2006, which sets objectives for the negotiation and management of aid according to the country’s development requirements, the government was working to coordinate development partners, directing their activities according to the country’s needs. Both the kind of activity and the geographical location of the work are controlled to minimise overlap and duplication and to ensure that rural areas are also supported through donor programmes and funding.19/20
17. According to the director of Cyanika Health Centre, the centre has not recorded a single maternal mortality since 2005.18. Mobile phones also help to integrate isolated villages into the health system. 19. In the past, partners were concentrated mainly in towns and next to main roads, and their projects and activities were independent from the public health system. Most development partners provided assistance to the districts from Kigali, thus were far from the reality. 20. MoH conducted a donor mapping study in which all donors were asked to classify their support in terms of the HSSP and the geography of intervention.
31
Although all activities are controlled centrally, since decentralisation came into place partners have discussed, planned and evaluated needs directly with local authorities and health facilities. The mechanism for coordination at the local level is the Joint Action Development Forum, which takes place quarterly and is the entry point for planning and action in health. At health facility level, planning is carried out in collaboration with donors and needs to be approved by the department in charge of health in the district.
‘We [the donor community] participate in planning at local level; we meet with all health facility directors and with the local authorities for two or three days. The health facilities bring their problems and all together we plan and discuss them and prioritise what is feasible to do and try to fill the gaps. [...] In this way, the ownership of activities remains in the district’ (international NGO staff, Nyamagabe).
After discussions with health facilities, development partners contribute with equipment, materials and support to staff salaries (e.g. each hospital and most health centres have an ambulance provided by donors). They also support health facilities in running campaigns and providing materials (e.g. leaflets and brochures).
‘For instance, in Nyamagabe district, Kigeme Hospital did not even have an X-ray machine, and few doctors were in post. Nowadays, the equipment is really good, the laboratory is excellent and they have more than 12 staff, including two doctors supported by FHI’ (district hospital staff, Nyamagabe).
Donors also give technical assistance on hospital administration, financial management, reporting and monitoring. They also support the Mutuelle and in many cases pay the contributions for those who cannot. Since 2005, donor intervention has been key to training health staff, especially community health workers, in areas such as nutrition, hygiene and family planning.
While Rwanda is heavily dependent on aid, which might represent a challenge to the sustainability of progress made, development partner respondents nevertheless stressed that resources were being used effectively, with positive outcomes widely visible: ‘for instance, the country is now paying for all vaccines and every year is covering more health expenses’(donor health specialist, Kigali). Rwanda seems to be working towards being less aid-dependent in the future. The president has also been spreading the message among the population of the importance of self-sufficiency.
RWANDA’S PROGRESS IN HEALTH: Leadership, performance and insurance
32
5. Conclusions
Rwanda emerged in 1994 from a genocide that took its toll on every aspect of development, particularly in the health sector. Since then, however, the country’s progress has been impressive, particularly since, by the year 2000, it still had catastrophic health indicators and one of the weakest health care systems in the world. Thus, Rwanda’s story of progress is that of a country that has successfully improved its health indicators at a very rapid pace and transformed its health system into an example of best practice. Although it still faces many challenges in health, the significant reforms implemented in health sector have shown very encouraging results that can serve as an example for other countries.
5.1 Key lessons
Rwanda’s highly centralised and effective governance and its commitment to addressing issues at local level means that programmes are implemented much more successfully than in most other countries (African or otherwise). This includes community health insurance and reducing corruption to near zero. The commitment of very powerful national leadership to effective implementation and accountability at local level has been key to progress. Other countries will have differing capacities to take advantage of these lessons, but it is nevertheless important to take them into account.
• Community health insurance schemes (Mutuelle de Santé) have proven a successful strategy to increase utilisation of health services by removing financial barriers for underserved populations. It has also achieved major changes in health-seeking behaviour and reduced sicknesses, as people approach health facilities before their health condition becomes too serious, which translates into reduced cost of health services.
• Paying health service providers for performance incentivises staff and enhances their commitment to work at higher quality standards in the delivery of services. Strong controls and quality checks are essential for monitoring and evaluating performance of individuals and health facilities.
• Political leadership has been crucial to achieve results. Strong government leadership and vision has set the pace for a successful story and has been instrumental in fostering the strategies and policies that lie behind the reforms implemented in the health sector. Leadership has also been decisive in motivating and engaging the population in the country’s development process.
• Effective governance, strong accountability mechanisms and zero tolerance of corruption are essential to the successful implementation of strategies and policies. The regulatory framework applied at all levels; good communication and feedback from bottom to central level and vice versa; and effective reporting systems and regular evaluations ensure that rules are followed and objectives accomplished according to quality standards.
• Employing evidence-based assessment of the situation on the ground and piloting strategies ensures the adequacy of policies that match people’s needs, as well as the likelihood of successful outcomes. The ability of government to adapt successful strategies from other countries to the Rwandan reality has also contributed to strengthening health services. Involving all stakeholders in the planning process, including development partners and the community itself, ensures that all efforts go in the same direction.
• Decentralisation of the health system allows local government to deal directly with the needs of its catchment area. Being closer to the population places districts in a better position to identify requirements and address them in a more efficient way. Empowering communities by involving them in planning, management and implementation also guarantees ownership of policies, ultimately contributing to better quality services. The decentralisation process, with a clear structure of responsibilities, also reduces overlap between different administrative levels and favours multi-disciplinary approaches to health, owing to the proximity of sectoral departments. Effectiveness in decentralisation depends on national leadership and on strong accountability systems, which have been present in Rwanda.
33
• Effectively integrating volunteer community health workers into the health delivery system allows basic health care services to reach remote rural areas. Since people now receive treatment at village level, community health workers have been key to preventing health problems before they become severe. Additionally, their role in sensitising community members on health, hygiene, nutrition and sanitation issues has helped increase people’s awareness of the importance of taking care of their own health.
• International donors can be instrumental in countries’ development by supporting governments’ budgets. They can also play an important role by presenting evidence of schemes that have proven successful in similar countries. The government has related to donors in true partnership by including them in planning and implementation processes. Constant dialogue and coordination with donors has ensured that funding is aligned with the country’s national priorities and is used effectively and efficiently.
• Integrating vertical funds in the health sector has strengthened the whole system, allowing underfunded components of the health care system to be covered too.
5.2 Challenges
• AlthoughprogressinhealthinRwandahasbeenremarkable,thecountrystillhasalongwaytogo,particularly in the area of malnutrition. Agriculture still depends on the weather, and a bad rainy season has negative effects in terms of harvest and, therefore, nutrition. Meanwhile, population growth is still high, seriously undermining the levels of food produced. Thus, among other things, more efforts need to be put into sensitising people on family planning. Additionally, some regions still experience food insecurity as a result of the acidic characteristics of the land and soil erosion. There are already strategies in place to address these issues, including hill terracing programmes, kitchen gardens and nutrition campaigns on using local food wisely. A presidential initiative to fight malnutrition became active in 2009, together with a new protocol and strategic plan on malnutrition.
• Closelyrelatedtothemalnutritionsituationisthehighlevelofpoverty, with low standards of living impacting on the health status of the population. In spite of rapid sustained growth, poverty reduction has been weak.
• Thereformsimplementedhavebeenfastandefficientandhavebroughtaboutdramaticimprovementstothe health system. However, this progress has also increased the workload of health facilities. In the new administrative system, district hospitals now have a double role: treatment and supervision. Additionally, the success of the Mutuelle in terms of changing health-seeking behaviours means the number of patients has increased considerably, thus many health facilities are overwhelmed.
• InspiteofeffortsbyMoHtoincentiviseandincreasethenumberofmedicalstaff,thereisstillashortage of manpower and in some cases also a shortage of beds and equipment to adequately meet needs.
• Theremoteness of some hospitals and health centres remains problematic; many also do not have a continuous electricity supply. This not only hampers service quality but also translates into staff instability, as they prefer to live near urban centres. Thus, staff turnover in remote areas is significant, and health facilities continually have to train new staff.
• Currently,technicalsupervisionofhealthcentresbyhospitalsfocusesmoreonevaluationthanontraining.As some respondents pointed out, the supervision methodology needs to be educational rather than descriptive, and there is a need to set up ‘on-the-job training’ to allow supervisors to evaluate and teach at the same time. Within the current system, personnel do not receive points on their role as supervisors.
• Thefinancial sustainability of the Mutuelle may be a challenge in the future, particularly given its scale-up to cover secondary and tertiary services. Additionally, the system is still regressive: everyone is paying the same fees and there is a need to make it more equitable. Implementation of a system of premiums according to ability to pay is being considered, and this may resolve both situations. Many people still cannot pay the Mutuelle contribution and depend on MoH and donors to pay for them. In some areas, this means the Mutuelle is not sustainable.
• Rwandaishighlyaid-dependent, representing a major challenge in terms of sustainability. While donors stressed that this should not be a problem, because Rwanda is showing results and good use of resources, economic development is still weak. There is still need for the country to generate more resources by boosting the private sector, attracting foreign capital and improving the mechanisms of taxation.
RWANDA’S PROGRESS IN HEALTH: Leadership, performance and insurance
34
References
Abbott, P. and Rwirahira, J. (2010) ‘Rwanda MDG Country Report 2010.’ Kigali: UNDP.
Basinga P., Sekabaraga C. and Soucat A. (2008) ‘Scaling Up Innovation in Service Delivery of Primary Health Care: Case of Rwanda.’ Prince Mahidol Award Conference. Bangkok, 30 January-2 February.
Bigsten, A. and Isaksson, A. (2008) ‘Growth and Poverty in Rwanda: Evaluating the EDPRS 2008–2012.’ Country Eco-nomic Report 2008:3. Stockholm: Department for Policy and Methodology, Sida.
Brinkerhoff, D.W., Fort, C. and Stratton, S. (2009) ‘Good Governance and Health: Assessing Progress in Rwanda.’ Kigali: TWUBAKANE Decentralization and Health Program Rwanda, USAID.
Chambers, V. (2010) ‘Maternal Health Services in Nyanza and Kavumu Villages, Nyamagabe District, Rwanda.’ Prelimi-nary fieldwork findings.
Development Partners (2006) ‘Adoption of Rwanda Aid Policy by Cabinet.’ Press Release. Kigali, 27 July.
GoR (2005) ‘Health Sector Policy.’ Kigali: GoR.
GPOBA (2005) ‘Comparison of Two Output-Based Schemes in Butare and Cyangugu Provinces with Two Control Prov-inces in Rwanda.’ Kigali: GPOBA, World Bank and MoH.
Hurley, L., Mukakabanda, S. and Bayigane, G. (2009) ‘Partnering with Faith-Based Organizations to Diminish Unmet Need for Family Planning in Rwanda.’ International Conference on Family Planning: Research and Best Practices. Kampala, 15-18 November.
IntraHealth (2009) ‘Community-Provider Partnerships for Quality Improvement in Rwanda.’ Assessment of the Parte-nariat pour l’Amélioration de la Qualité Approach. Kigali: USAID, TWUBAKANE and Government of Rwanda and IntraHealth International.
Lemarchand, R. (1995) ‘Rwanda: The Rationality of Genocide.’ Issue: A Journal of Opinion 23(2): 8-11.
Meessen, B., Soucatb, A. and Sekabaragab, C. (2010) ‘Performance-Based financing: Just a Donor Fad or a Catalyst Towards Comprehensive Health Care Reform?’ Bulletin of the World Health Organization 89: 153-156.
MoFEP (2000) ‘Vision 2020.’ Kigali: MoFEP.
MoFEP (2007) ‘Economic Development and Poverty Reduction Strategy, 2008-2012.’ Kigali: MoFEP.
MoH (1990) ‘Annual Report 1990.’ Kigali: MoH.
MoH (2000) ‘Annual Report 2000.’ Kigali: MoH.
MoH (2004) ‘Mutual Health Insurance Policy in Rwanda.’ Kigali: MoH.
MoH (2006) ‘Annual Report 2006.’ Kigali: MoH.
MoH (2009a) ‘Health Sector Strategic Plan July 2009-June 2012.’ Kigali: MoH.
MoH (2009b) ‘Rwanda Health Financing Policy.’ Kigali: MoH.
MoH, NISR and ICF Macro (2009) ‘Rwanda Interim Demographic and Health Survey 2007-2008.’ Kigali and Calverton, MD: MoH, NIS and ICF Macro.
NISR, MoFEP and Orc Macro (2002) ‘Rwanda Demographic and Health Survey 2002.’ Kigali and Calverton, MD: NIS, MoFEP and Orc Macro.
NISR, MoFEP and Orc Macro (2005) ‘Rwanda Demographic and Health Survey 2005.’ Kigali and Calverton, MD: NIS, MoFEP and Orc Macro.
35
ONAPO and Macro International Inc. (1992) ‘Rwanda Demographic and Health Survey 1992.’ Kigali and Calverton, MD: ONAPO and Macro International Inc.
Rusa, L. and Fritsche, G. (2007) ‘Rwanda.’ In World Bank (2007) Performance-Based Financing in Health, Sourcebook on Emerging Good Practice. Second Edition. Washington, DC: World Bank.
Solo, J. (2008) ‘Family Planning in Rwanda. How a Taboo Topic Became Priority Number One.’ Kigali: IntraHealth International.
Thaxton, M. (2009) ‘Integrating Population, Health, and Environment in Rwanda.’ Policy Brief. New York: Population Reference Bureau.
USAID (2009) ‘Improving Child Health in Rwanda. BASICS III.’ Kigali: USAID.
WFP (2009) ‘Comprehensive Food Security and Vulnerability Analysis and Nutrition Survey 2009.’ VAM Food Security Analysis. Kigali: WFP.
WHO (2009) ‘Country Cooperation Strategy 2009-2013 Rwanda.’ Brazzaville: WHO Regional Office for Africa.
World Bank (2009) ‘Rwanda: A Country Status Report on Health and Poverty.’ Kigali: Ministry of Health Rwanda & World Bank Africa Region.
RWANDA’S PROGRESS IN HEALTH: Leadership, performance and insurance
36
Annex 1: Use of Rwandan cultural values and traditions as catalysts for development
Rwanda’s achievements in different sectors, including the health sector, may be attributed to a number of causes, one of which is the way Rwandans have decided to seek solutions to their development problems by using practices found in Rwandan culture and traditions. In ancient Rwanda, society sustained itself through institutions and cultural values that guided the conduct of every member of society, ascribing roles and responsibilities to each, and also sought accountability from those entrusted with leadership roles. Rwandans were also guided by approved good values (indangagaciro) and taboos (kirazira) which restricted them from wrongdoing. This kept Rwanda as a stable, self-sustaining unified society for many centuries before colonialism.
Rwanda has revived some of its cultural practices and traditional institutions to address the challenges met in its quest for accelerated development. For example, old traditional institutions like gacaca courts have been revived to address the problem of big court caseloads in relation to the genocidaires and also to promote reconciliation through forgiveness among Rwandans.
Gacaca courts are based on the traditional system for settling local disputes, without causing further consequences to the accused or to the complainant. The objective is not to determine individual guilt or to apply state law in a coherent and consistent manner (as one expects from state courts of law), but to restore harmony and social order in the given community and to reintegrate the person who was the source of the disorder.
Imihigo are annual performance contracts signed by leaders from village to district level to achieve certain tasks of development within one year. Traditionally, imihigo were pledged in public before the king by ancient warriors to show their commitment to the kingdom’s protection and security, and also to showcase in advance their achievements if the kingdom were to go to war with its enemies. Failure to accomplish the pledge would be regarded as shameful and would lead an individual to social disgrace. Imihigo would therefore encourage bravery and compel people to work hard towards the achievement of the pledged tasks, which would then be proclaimed in public again before the king (guhigura imihigo). This was a kind of accountability: reporting back on the status of accomplishment of pledged activities.
Itorero was traditionally a kind of school where patriotism and selflessness in terms of serving the country and fellow country people was taught. Attendees were also given military, poetry, music, dance and etiquette training. Kirazira and indangagaciro were also taught, to guide day-to-day conduct. Itorero helped sustain Rwanda as a stable, secure and unified kingdom for six centuries.
The concept of ubudehe (meaning ‘collective communal work’ or ‘local collective action’) encourages people, with support from the local government, NGOs and development partners, to work collectively to solve their own problems, that is, by the people, for the people. Ubudehe contributes to strengthening democratic processes and governance.
These old practices have been adopted by the present-day Rwandan leadership. Through the decentralised system of governance, people at different administrative levels make performance contracts on what they will achieve within a given year. Guhiga (pledging to achieve certain tasks) and the spirit of volunteerism are deeply embedded in Rwandan culture, with a great deal of respect and prestige going to those who pledge. Many local leaders (from village chiefs, to members of the village executive committee, to cell-level leaders) are volunteers, as are other members of the community, like community health workers and members of different committees based at village level, who assist with the implementation of sector-wide government development programmes. This kind of arrangement creates local ownership of development programmes introduced by the government, which also helps in their rapid implementation and ensures sustainability.
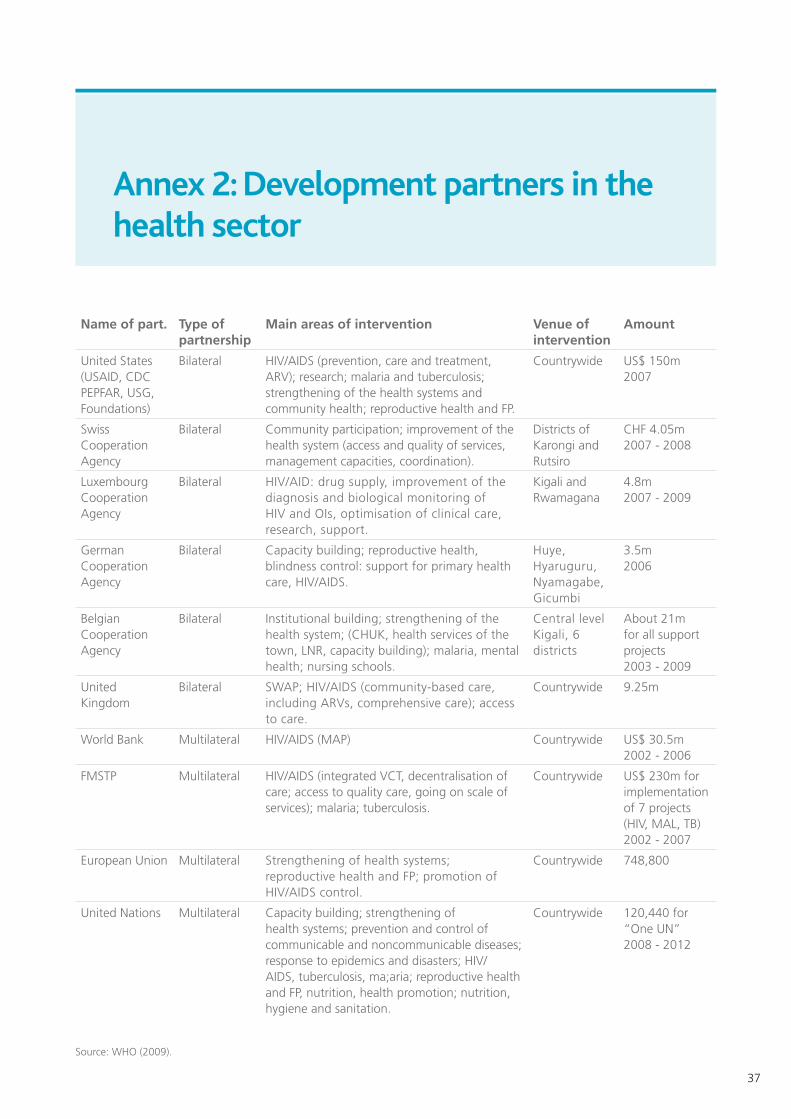
37
Annex 2: Development partners in the health sector
Name of part. Type of partnership
Main areas of intervention Venue of intervention
Amount
United States (USAID, CDC PEPFAR, USG, Foundations)
Bilateral HIV/AIDS (prevention, care and treatment, ARV); research; malaria and tuberculosis; strengthening of the health systems and community health; reproductive health and FP.
Countrywide US$ 150m 2007
Swiss Cooperation Agency
Bilateral Community participation; improvement of the health system (access and quality of services, management capacities, coordination).
Districts of Karongi and Rutsiro
CHF 4.05m 2007 - 2008
Luxembourg Cooperation Agency
Bilateral HIV/AID: drug supply, improvement of the diagnosis and biological monitoring of HIV and OIs, optimisation of clinical care, research, support.
Kigali and Rwamagana
4.8m 2007 - 2009
German Cooperation Agency
Bilateral Capacity building; reproductive health, blindness control: support for primary health care, HIV/AIDS.
Huye, Hyaruguru, Nyamagabe, Gicumbi
3.5m2006
Belgian Cooperation Agency
Bilateral Institutional building; strengthening of the health system; (CHUK, health services of the town, LNR, capacity building); malaria, mental health; nursing schools.
Central level Kigali, 6 districts
About 21m for all support projects2003 - 2009
United Kingdom
Bilateral SWAP; HIV/AIDS (community-based care, including ARVs, comprehensive care); access to care.
Countrywide 9.25m
World Bank Multilateral HIV/AIDS (MAP) Countrywide US$ 30.5m2002 - 2006
FMSTP Multilateral HIV/AIDS (integrated VCT, decentralisation of care; access to quality care, going on scale of services); malaria; tuberculosis.
Countrywide US$ 230m for implementation of 7 projects (HIV, MAL, TB) 2002 - 2007
European Union Multilateral Strengthening of health systems; reproductive health and FP; promotion of HIV/AIDS control.
Countrywide 748,800
United Nations Multilateral Capacity building; strengthening of health systems; prevention and control of communicable and noncommunicable diseases; response to epidemics and disasters; HIV/AIDS, tuberculosis, ma;aria; reproductive health and FP, nutrition, health promotion; nutrition, hygiene and sanitation.
Countrywide 120,440 for “One UN”2008 - 2012
Source: WHO (2009).