Embed Size (px)
Citation preview
1
Progress Towards Global
Immunization Goals - 2012
Summary presentation of
key indicators Updated July 2013
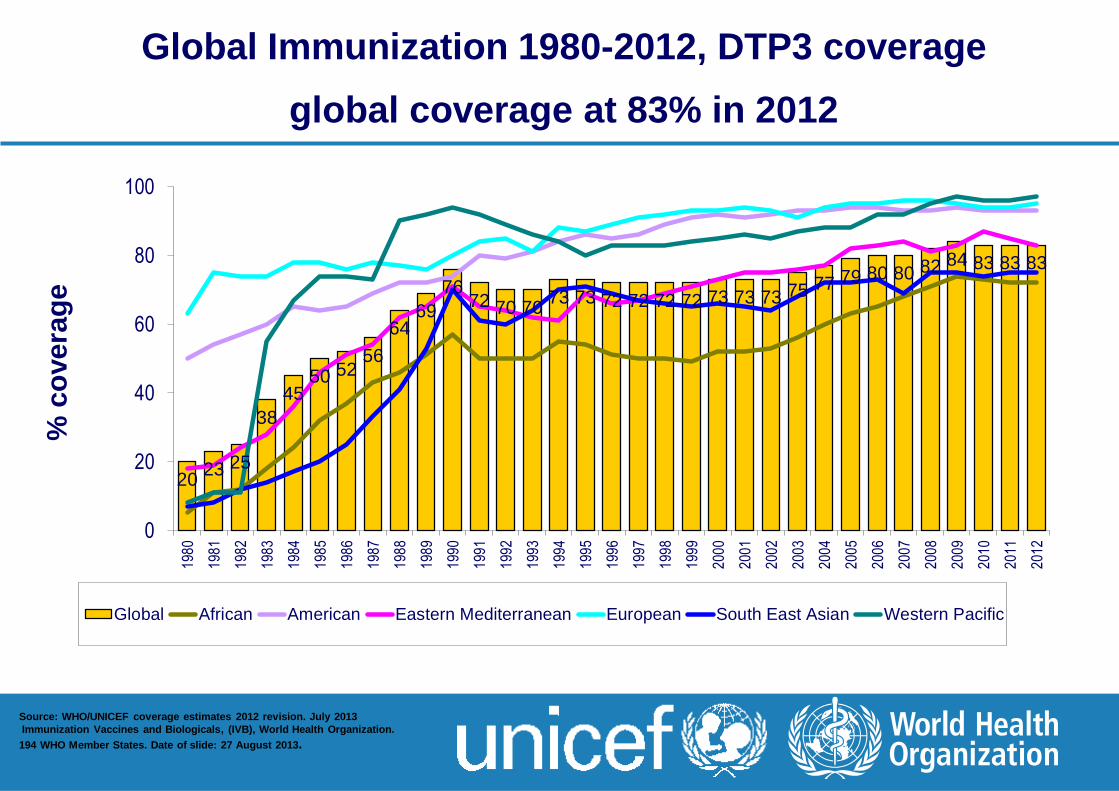
Global Immunization 1980-2012, DTP3 coverage
global coverage at 83% in 2012
Source: WHO/UNICEF coverage estimates 2012 revision. July 2013
Immunization Vaccines and Biologicals, (IVB), World Health Organization.
194 WHO Member States. Date of slide: 27 August 2013.
20 23 25
38
45 50 52
56
64 69
76 72 70 70
73 73 72 72 72 72 73 73 73 75 77 79 80 80 82 84 83 83 83
0
20
40
60
80
10019
80
1981
1982
1983
1984
1985
1986
1987
1988
1989
1990
1991
1992
1993
1994
1995
1996
1997
1998
1999
2000
2001
2002
2003
2004
2005
2006
2007
2008
2009
2010
2011
2012
% c
overa
ge
Global African American Eastern Mediterranean European South East Asian Western Pacific
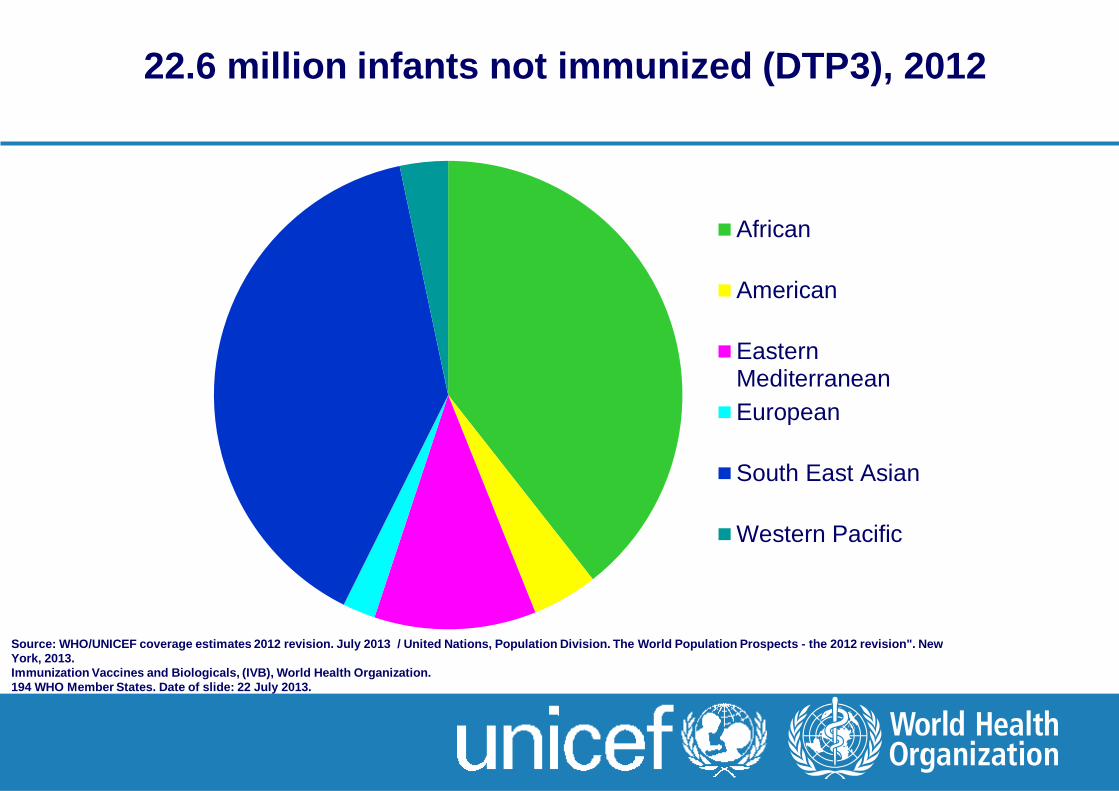
22.6 million infants not immunized (DTP3), 2012
African
American
EasternMediterranean
European
South East Asian
Western Pacific
Source: WHO/UNICEF coverage estimates 2012 revision. July 2013 / United Nations, Population Division. The World Population Prospects - the 2012 revision". New
York, 2013.
Immunization Vaccines and Biologicals, (IVB), World Health Organization.
194 WHO Member States. Date of slide: 22 July 2013.
4
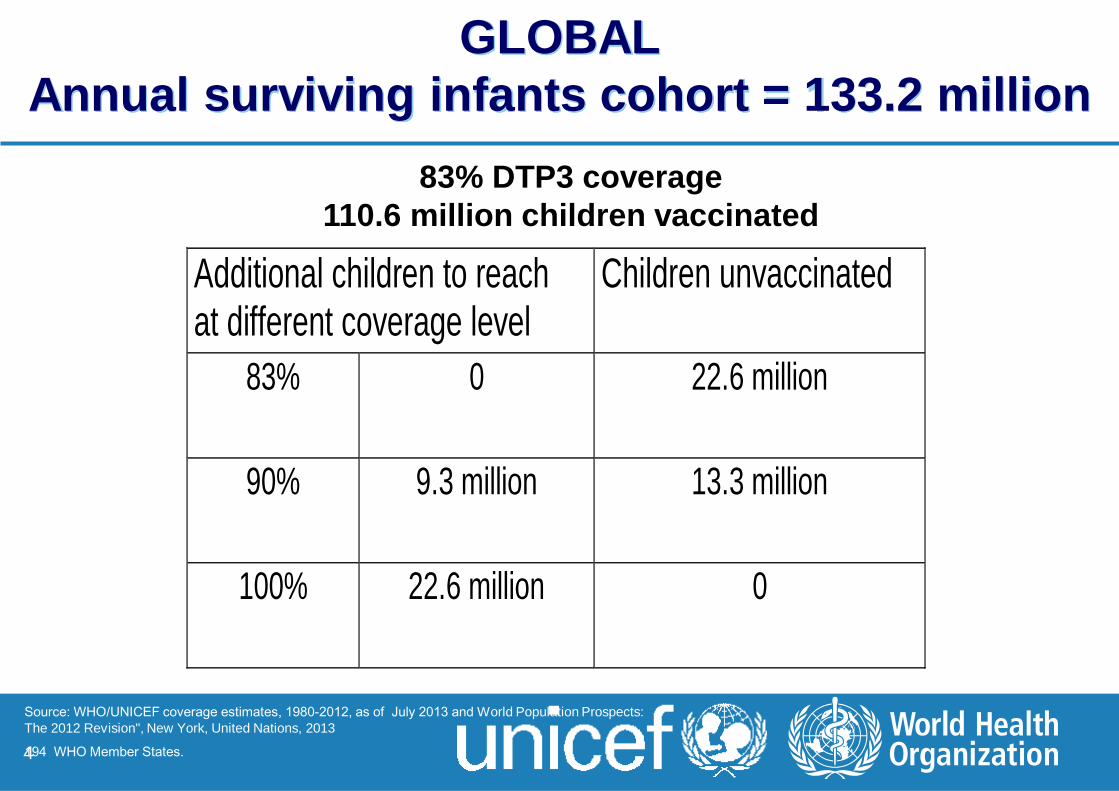
GLOBAL
Annual surviving infants cohort = 133.2 million
Additional children to reach at different coverage level
Children unvaccinated
83% 0 22.6 million
90% 9.3 million 13.3 million
100% 22.6 million 0
83% DTP3 coverage
110.6 million children vaccinated
Source: WHO/UNICEF coverage estimates, 1980-2012, as of July 2013 and World Population Prospects:
The 2012 Revision", New York, United Nations, 2013
194 WHO Member States.
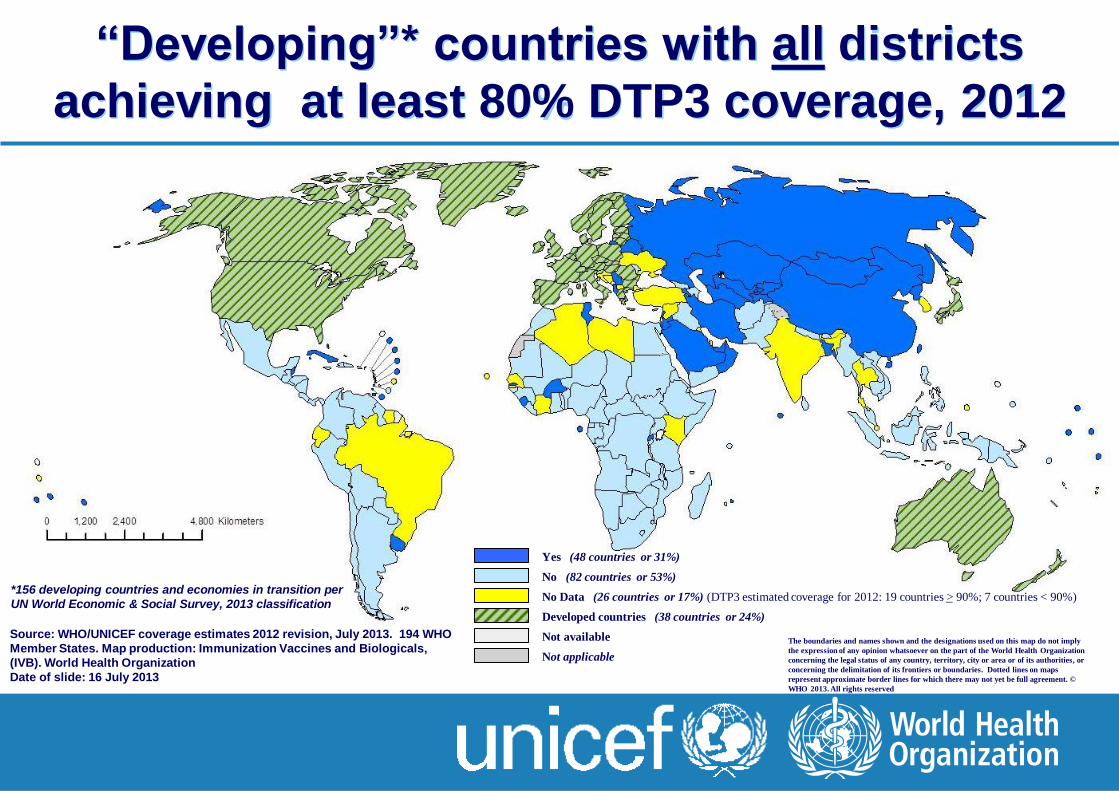
“Developing”* countries with all districts
achieving at least 80% DTP3 coverage, 2012
The boundaries and names shown and the designations used on this map do not imply
the expression of any opinion whatsoever on the part of the World Health Organization
concerning the legal status of any country, territory, city or area or of its authorities, or
concerning the delimitation of its frontiers or boundaries. Dotted lines on maps
represent approximate border lines for which there may not yet be full agreement. ©
WHO 2013. All rights reserved
Yes (48 countries or 31%)
No (82 countries or 53%)
%)90countries < 7 %; 90 >countries 19 : 2012estimated coverage for 3 (DTP%) 17countries or 26 ( No Data
Developed countries (38 countries or 24%)
Not available
Not applicable
Source: WHO/UNICEF coverage estimates 2012 revision, July 2013. 194 WHO
Member States. Map production: Immunization Vaccines and Biologicals,
(IVB). World Health Organization
Date of slide: 16 July 2013
*156 developing countries and economies in transition per
UN World Economic & Social Survey, 2013 classification
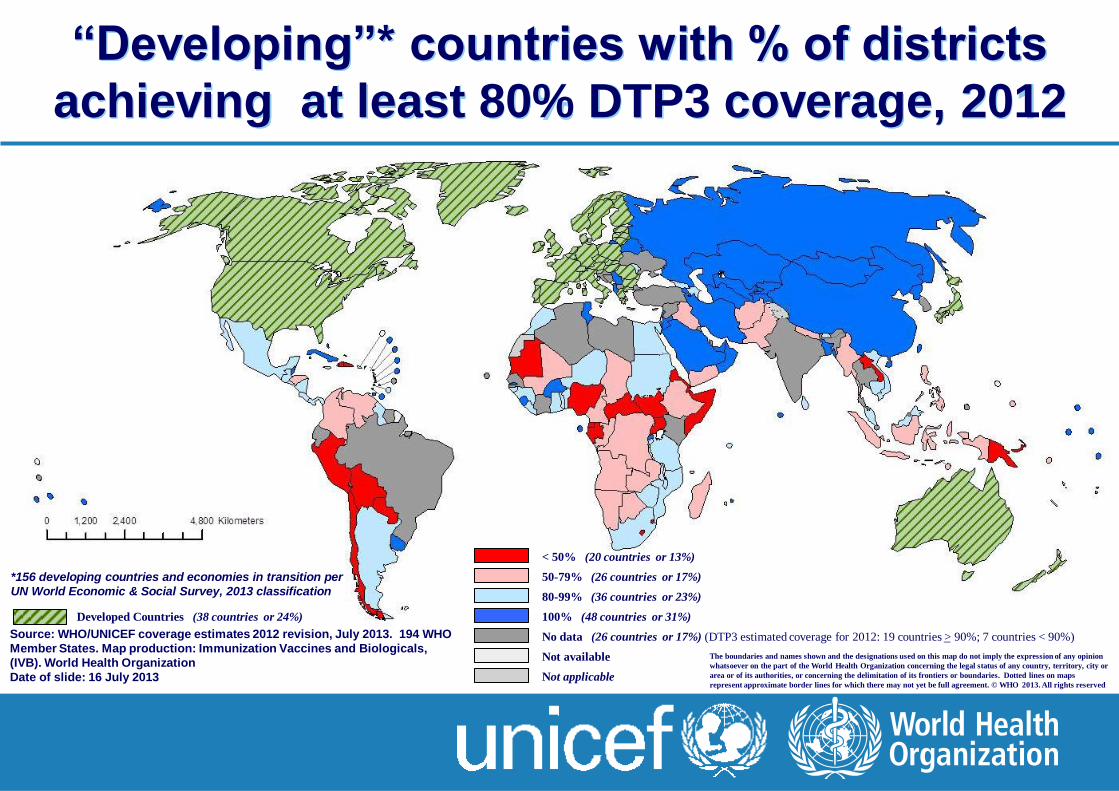
“Developing”* countries with % of districts
achieving at least 80% DTP3 coverage, 2012
The boundaries and names shown and the designations used on this map do not imply the expression of any opinion
whatsoever on the part of the World Health Organization concerning the legal status of any country, territory, city or
area or of its authorities, or concerning the delimitation of its frontiers or boundaries. Dotted lines on maps
represent approximate border lines for which there may not yet be full agreement. © WHO 2013. All rights reserved
< 50% (20 countries or 13%)
50-79% (26 countries or 17%)
80-99% (36 countries or 23%)
100% (48 countries or 31%)
%)90< countries 7 %; 90 >countries 19 : 2012estimated coverage for 3 (DTP%) 17countries or 26 ( No data
Not available
Not applicable
Developed Countries (38 countries or 24%)
Source: WHO/UNICEF coverage estimates 2012 revision, July 2013. 194 WHO
Member States. Map production: Immunization Vaccines and Biologicals,
(IVB). World Health Organization
Date of slide: 16 July 2013
*156 developing countries and economies in transition per
UN World Economic & Social Survey, 2013 classification
7
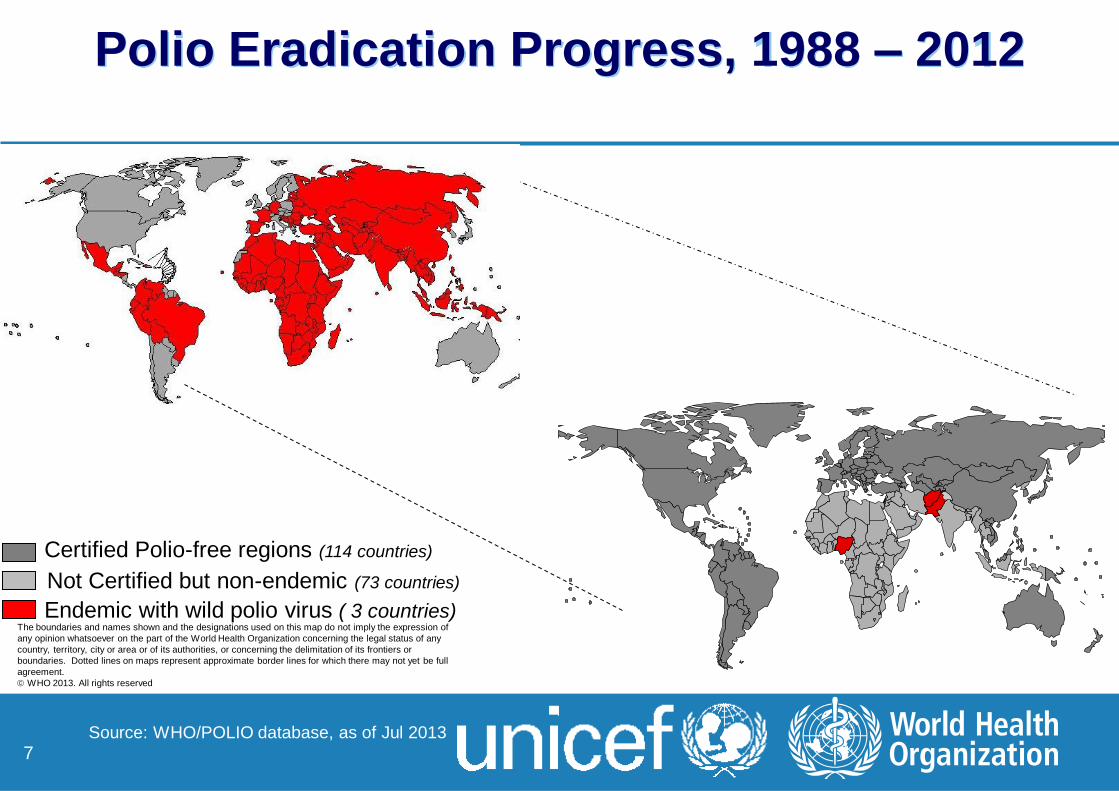
Polio Eradication Progress, 1988 – 2012
Source: WHO/POLIO database, as of Jul 2013
The boundaries and names shown and the designations used on this map do not imply the expression of
any opinion whatsoever on the part of the World Health Organization concerning the legal status of any
country, territory, city or area or of its authorities, or concerning the delimitation of its frontiers or
boundaries. Dotted lines on maps represent approximate border lines for which there may not yet be full
agreement.
WHO 2013. All rights reserved
Certified Polio-free regions (114 countries)
Endemic with wild polio virus ( 3 countries)
Not Certified but non-endemic (73 countries)
8
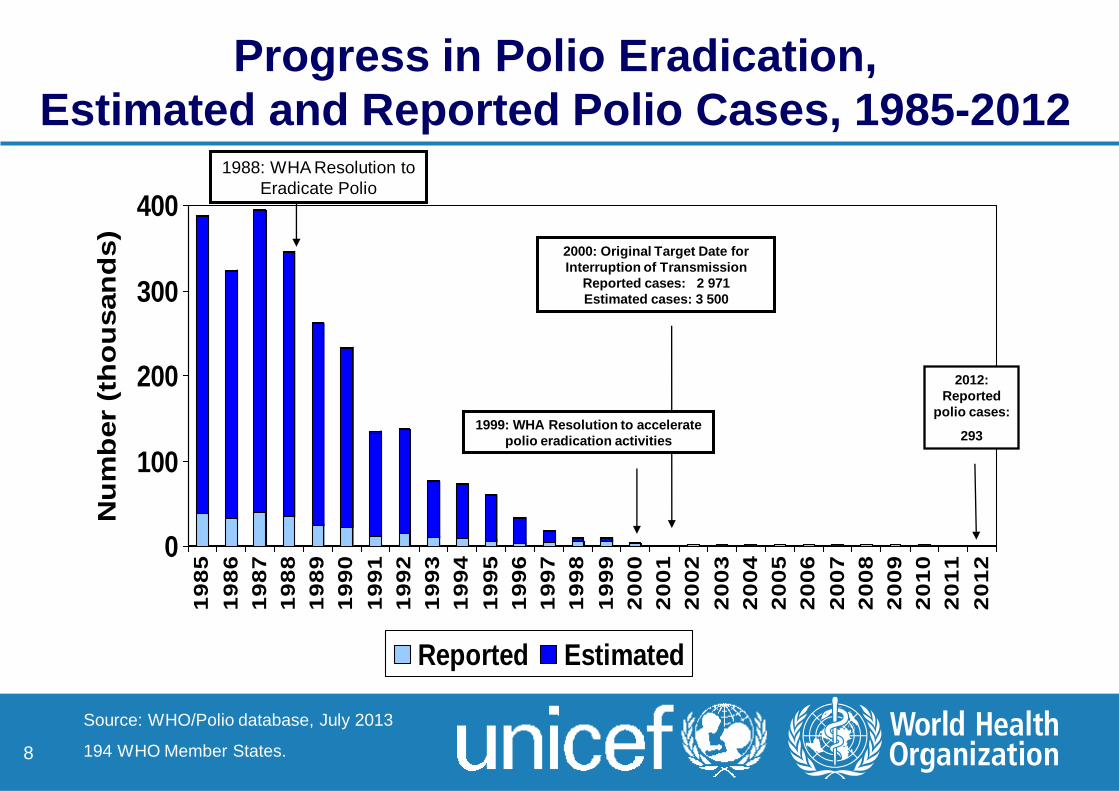
Progress in Polio Eradication,
Estimated and Reported Polio Cases, 1985-2012
Source: WHO/Polio database, July 2013
194 WHO Member States.
0
100
200
300
400
Nu
mb
er
(th
ou
san
ds)
19
85
19
86
19
87
19
88
19
89
19
90
19
91
19
92
19
93
19
94
19
95
19
96
19
97
19
98
19
99
20
00
20
01
20
02
20
03
20
04
20
05
20
06
20
07
20
08
20
09
20
10
20
11
20
12
Reported Estimated
1988: WHA Resolution to
Eradicate Polio
2000: Original Target Date for
Interruption of Transmission
Reported cases: 2 971
Estimated cases: 3 500
1999: WHA Resolution to accelerate
polio eradication activities
2012:
Reported
polio cases:
293
0 2'400 4'8001'200 Kilometers
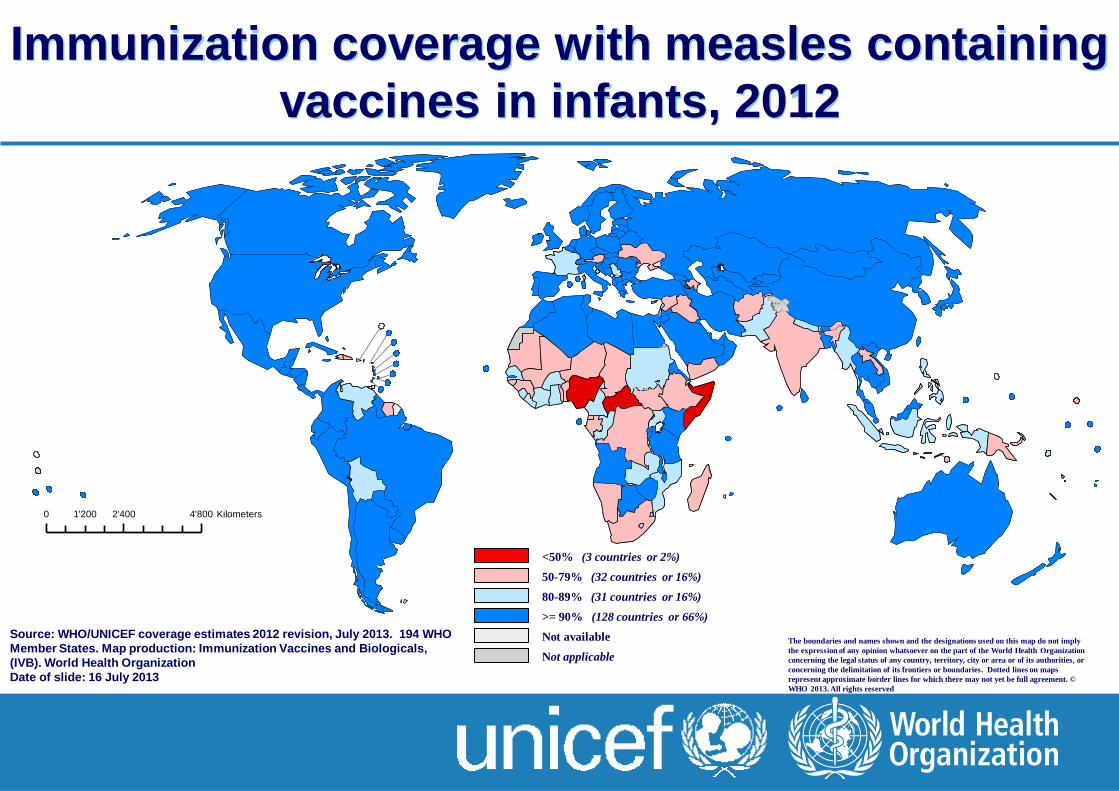
Immunization coverage with measles containing
vaccines in infants, 2012
Source: WHO/UNICEF coverage estimates 2012 revision, July 2013. 194 WHO
Member States. Map production: Immunization Vaccines and Biologicals,
(IVB). World Health Organization
Date of slide: 16 July 2013
The boundaries and names shown and the designations used on this map do not imply
the expression of any opinion whatsoever on the part of the World Health Organization
concerning the legal status of any country, territory, city or area or of its authorities, or
concerning the delimitation of its frontiers or boundaries. Dotted lines on maps
represent approximate border lines for which there may not yet be full agreement. ©
WHO 2013. All rights reserved
<50% (3 countries or 2%)
50-79% (32 countries or 16%)
80-89% (31 countries or 16%)
>= 90% (128 countries or 66%)
Not available
Not applicable
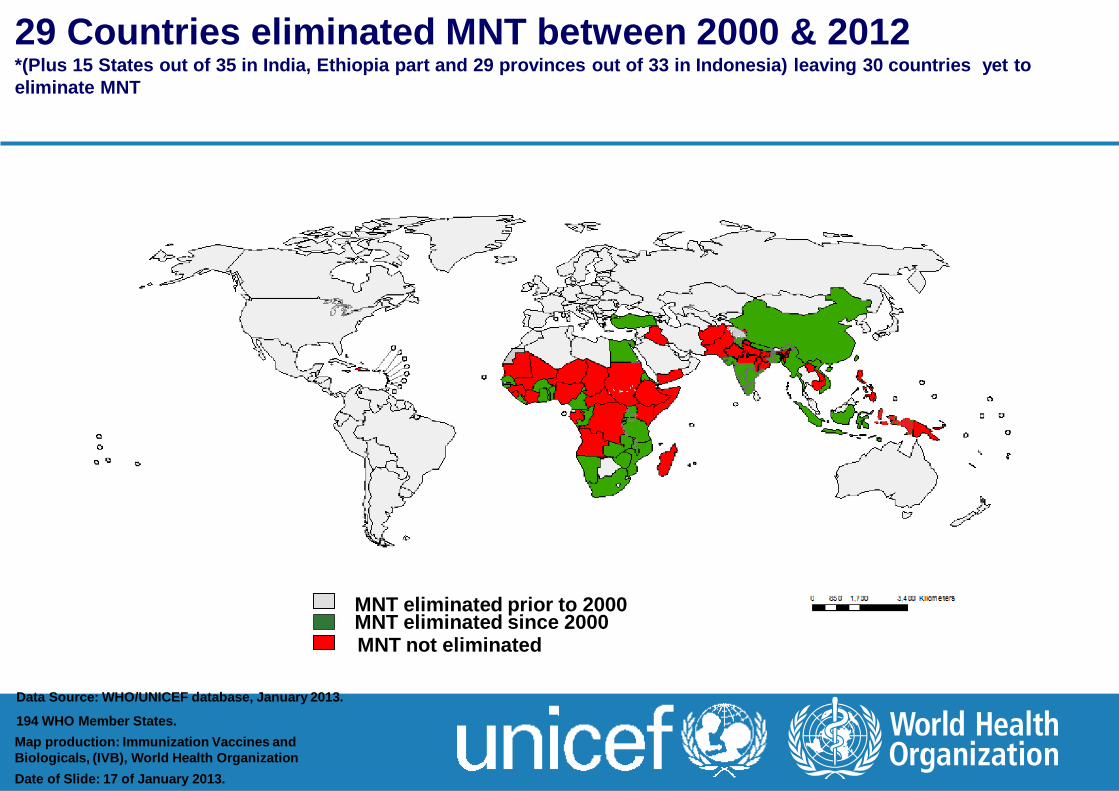
29 Countries eliminated MNT between 2000 & 2012 *(Plus 15 States out of 35 in India, Ethiopia part and 29 provinces out of 33 in Indonesia) leaving 30 countries yet to
eliminate MNT
Data Source: WHO/UNICEF database, January 2013.
194 WHO Member States.
Map production: Immunization Vaccines and
Biologicals, (IVB), World Health Organization
Date of Slide: 17 of January 2013.
MNT not eliminated
MNT eliminated prior to 2000 MNT eliminated since 2000
11
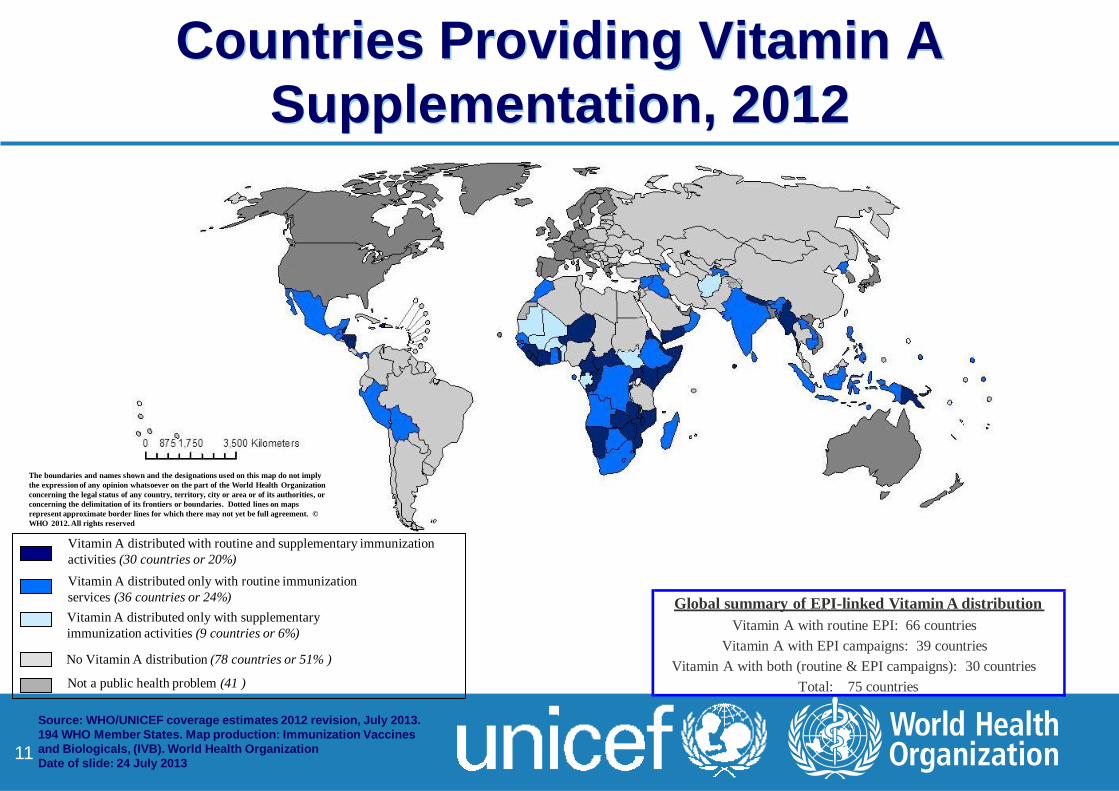
Countries Providing Vitamin A
Supplementation, 2012
The boundaries and names shown and the designations used on this map do not imply
the expression of any opinion whatsoever on the part of the World Health Organization
concerning the legal status of any country, territory, city or area or of its authorities, or
concerning the delimitation of its frontiers or boundaries. Dotted lines on maps
represent approximate border lines for which there may not yet be full agreement. ©
WHO 2012. All rights reserved
Vitamin A distributed with routine and supplementary immunization
activities (30 countries or 20%)
Vitamin A distributed only with supplementary
immunization activities (9 countries or 6%)
Not a public health problem (41 )
No Vitamin A distribution (78 countries or 51% )
Vitamin A distributed only with routine immunization
services (36 countries or 24%) Global summary of EPI-linked Vitamin A distribution
Vitamin A with routine EPI: 66 countries
Vitamin A with EPI campaigns: 39 countries
Vitamin A with both (routine & EPI campaigns): 30 countries
Total: 75 countries
Source: WHO/UNICEF coverage estimates 2012 revision, July 2013.
194 WHO Member States. Map production: Immunization Vaccines
and Biologicals, (IVB). World Health Organization
Date of slide: 24 July 2013
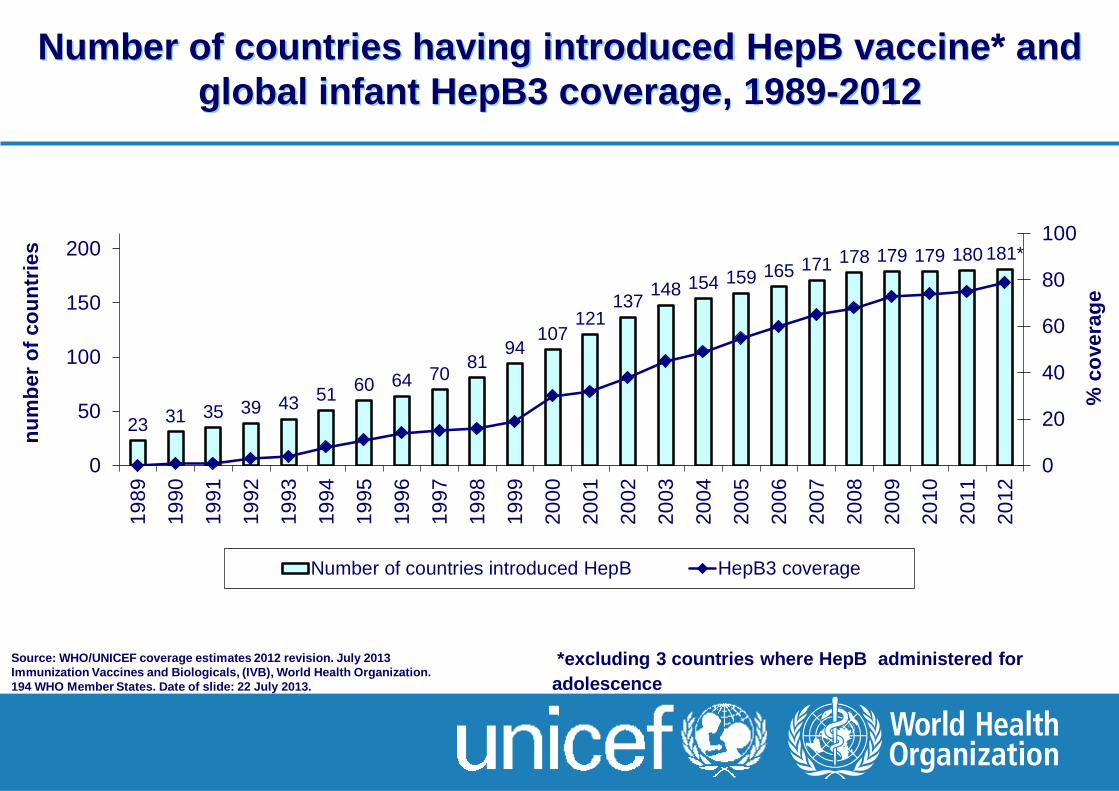
23 31 35 39 43 51 60 64 70
81 94
107 121
137 148 154 159 165 171 178 179 179 180 181*
0
20
40
60
80
100
0
50
100
150
200
19
89
19
90
19
91
19
92
19
93
19
94
19
95
19
96
19
97
19
98
19
99
20
00
20
01
20
02
20
03
20
04
20
05
20
06
20
07
20
08
20
09
20
10
20
11
20
12
% c
overa
ge
nu
mb
er
of
co
un
trie
s
Number of countries introduced HepB HepB3 coverage
Number of countries having introduced HepB vaccine* and
global infant HepB3 coverage, 1989-2012
*excluding 3 countries where HepB administered for
adolescence
Source: WHO/UNICEF coverage estimates 2012 revision. July 2013
Immunization Vaccines and Biologicals, (IVB), World Health Organization.
194 WHO Member States. Date of slide: 22 July 2013.
0 2'400 4'8001'200 Kilometers
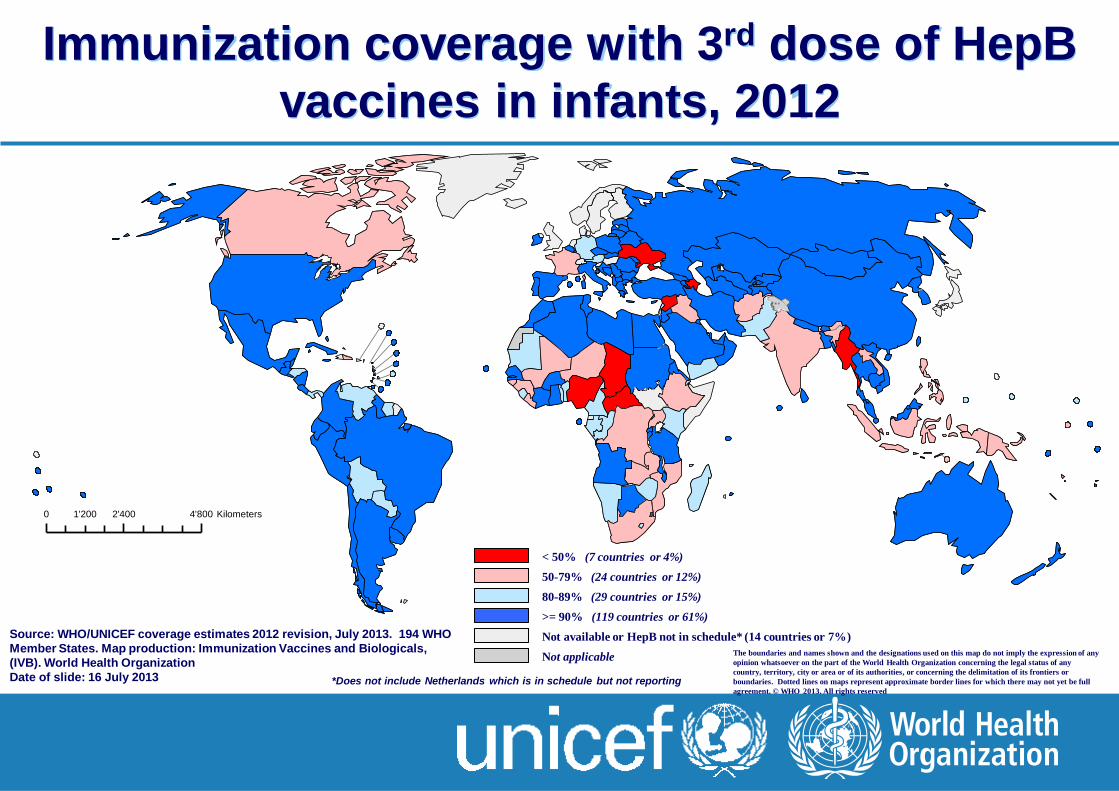
Immunization coverage with 3rd dose of HepB
vaccines in infants, 2012
The boundaries and names shown and the designations used on this map do not imply the expression of any
opinion whatsoever on the part of the World Health Organization concerning the legal status of any
country, territory, city or area or of its authorities, or concerning the delimitation of its frontiers or
boundaries. Dotted lines on maps represent approximate border lines for which there may not yet be full
agreement. © WHO 2013. All rights reserved
< 50% (7 countries or 4%)
50-79% (24 countries or 12%)
80-89% (29 countries or 15%)
>= 90% (119 countries or 61%)
Not available or HepB not in schedule* (14 countries or 7%)
Not applicable
Source: WHO/UNICEF coverage estimates 2012 revision, July 2013. 194 WHO
Member States. Map production: Immunization Vaccines and Biologicals,
(IVB). World Health Organization
Date of slide: 16 July 2013 *Does not include Netherlands which is in schedule but not reporting
0 2,400 4,8001,200 Kilometers
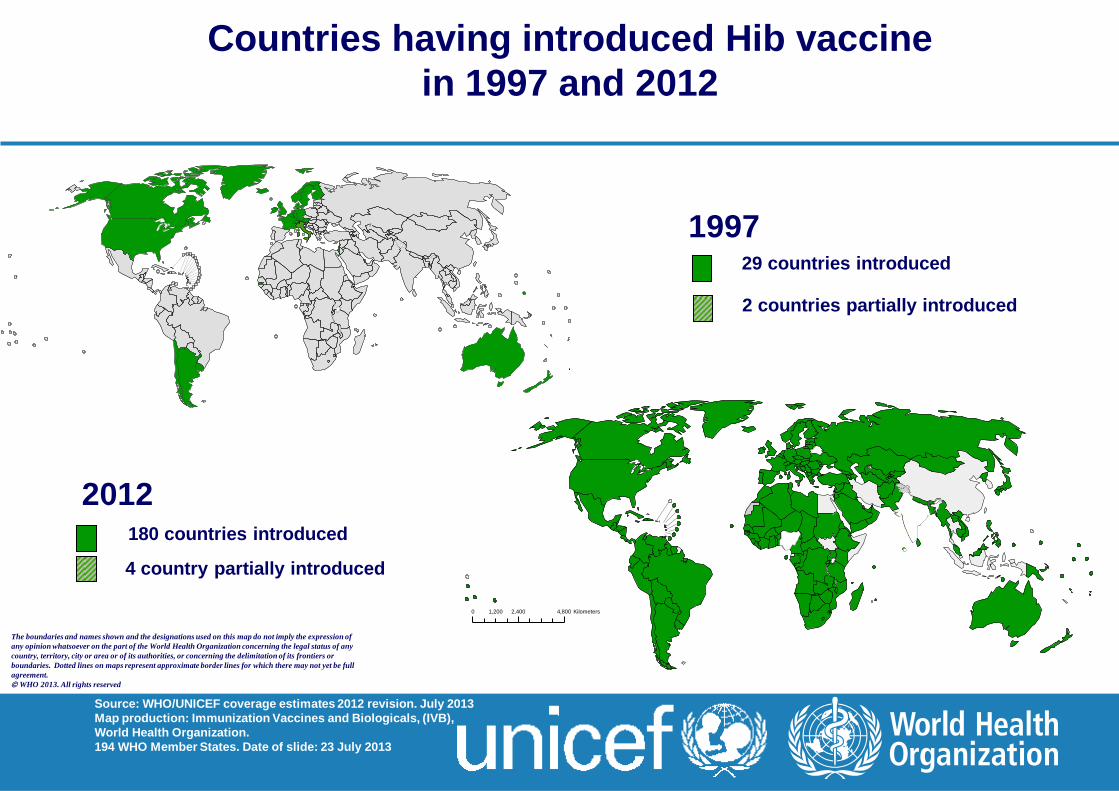
Countries having introduced Hib vaccine
in 1997 and 2012
29 countries introduced
1997
180 countries introduced
2012
4 country partially introduced
The boundaries and names shown and the designations used on this map do not imply the expression of
any opinion whatsoever on the part of the World Health Organization concerning the legal status of any
country, territory, city or area or of its authorities, or concerning the delimitation of its frontiers or
boundaries. Dotted lines on maps represent approximate border lines for which there may not yet be full
agreement.
WHO 2013. All rights reserved
2 countries partially introduced
Source: WHO/UNICEF coverage estimates 2012 revision. July 2013
Map production: Immunization Vaccines and Biologicals, (IVB),
World Health Organization.
194 WHO Member States. Date of slide: 23 July 2013
0 2'400 4'8001'200 Kilometers
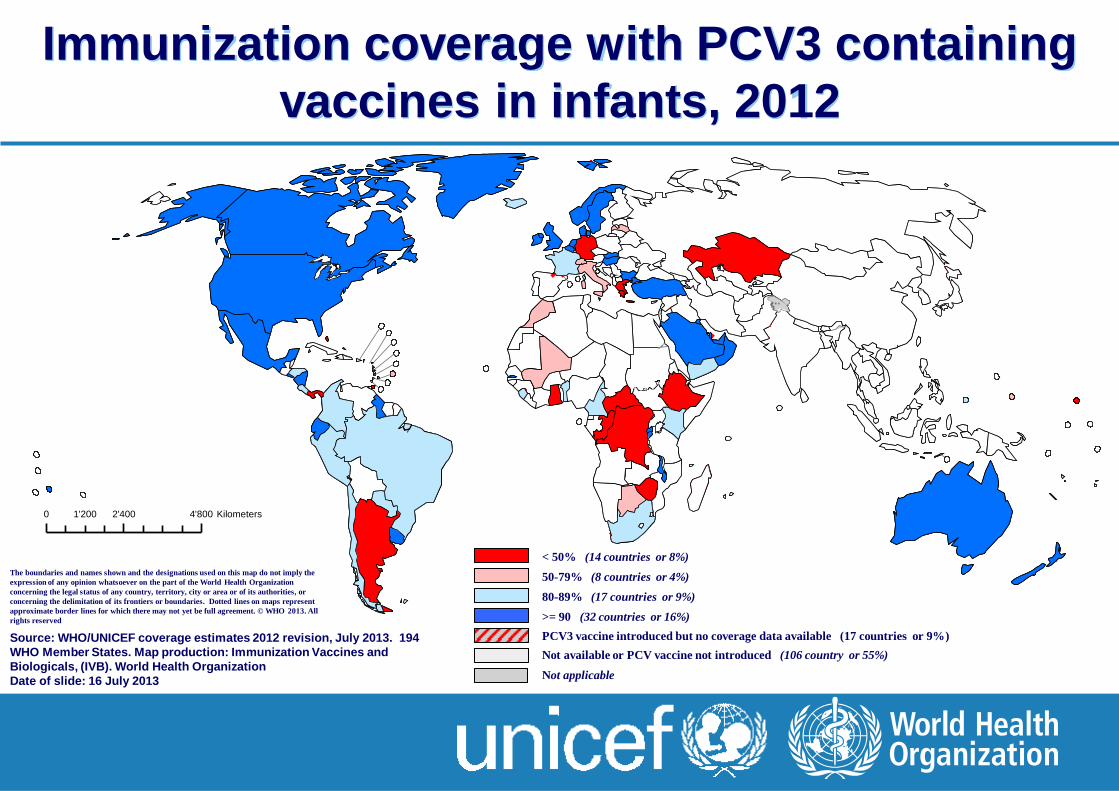
Immunization coverage with PCV3 containing
vaccines in infants, 2012
The boundaries and names shown and the designations used on this map do not imply the
expression of any opinion whatsoever on the part of the World Health Organization
concerning the legal status of any country, territory, city or area or of its authorities, or
concerning the delimitation of its frontiers or boundaries. Dotted lines on maps represent
approximate border lines for which there may not yet be full agreement. © WHO 2013. All
rights reserved
< 50% (14 countries or 8%)
50-79% (8 countries or 4%)
80-89% (17 countries or 9%)
>= 90 (32 countries or 16%)
Not available or PCV vaccine not introduced (106 country or 55%)
Not applicable
PCV3 vaccine introduced but no coverage data available (17 countries or 9%) Source: WHO/UNICEF coverage estimates 2012 revision, July 2013. 194
WHO Member States. Map production: Immunization Vaccines and
Biologicals, (IVB). World Health Organization
Date of slide: 16 July 2013
0 2,400 4,8001,200 Kilometers
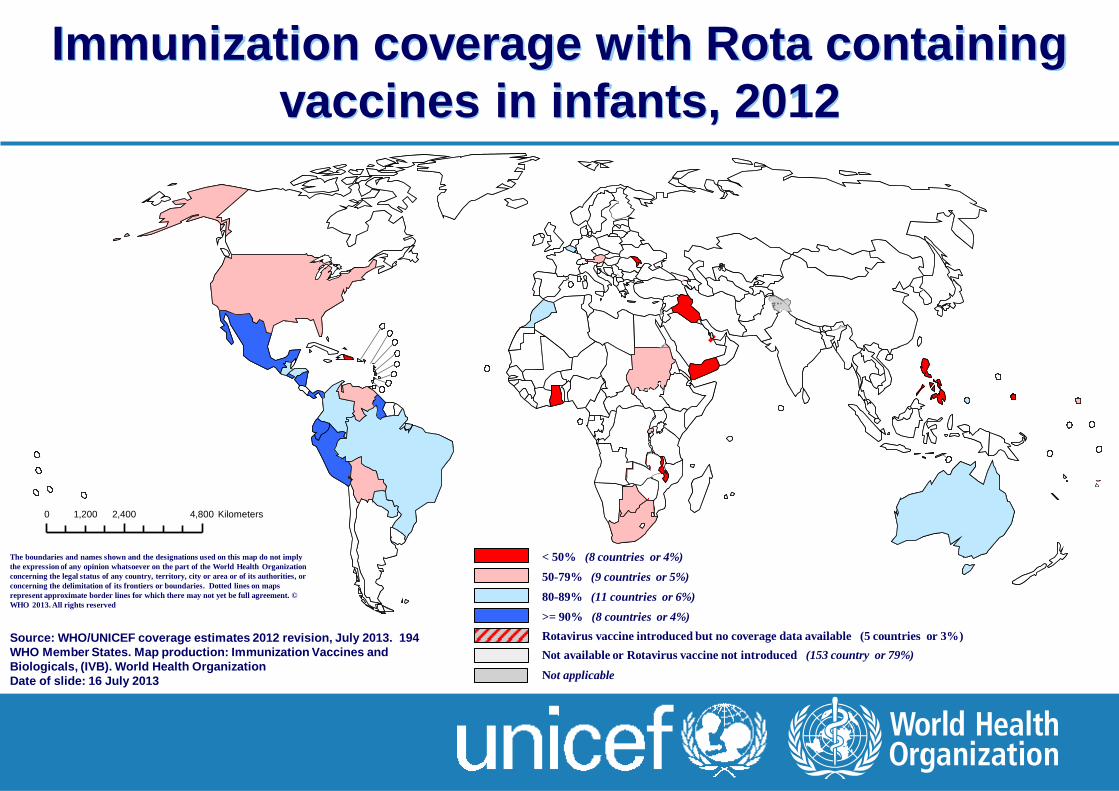
Immunization coverage with Rota containing
vaccines in infants, 2012
The boundaries and names shown and the designations used on this map do not imply
the expression of any opinion whatsoever on the part of the World Health Organization
concerning the legal status of any country, territory, city or area or of its authorities, or
concerning the delimitation of its frontiers or boundaries. Dotted lines on maps
represent approximate border lines for which there may not yet be full agreement. ©
WHO 2013. All rights reserved
< 50% (8 countries or 4%)
50-79% (9 countries or 5%)
80-89% (11 countries or 6%)
>= 90% (8 countries or 4%)
Not available or Rotavirus vaccine not introduced (153 country or 79%)
Not applicable
Rotavirus vaccine introduced but no coverage data available (5 countries or 3%) Source: WHO/UNICEF coverage estimates 2012 revision, July 2013. 194
WHO Member States. Map production: Immunization Vaccines and
Biologicals, (IVB). World Health Organization
Date of slide: 16 July 2013
0 2,400 4,8001,200 Kilometers
17
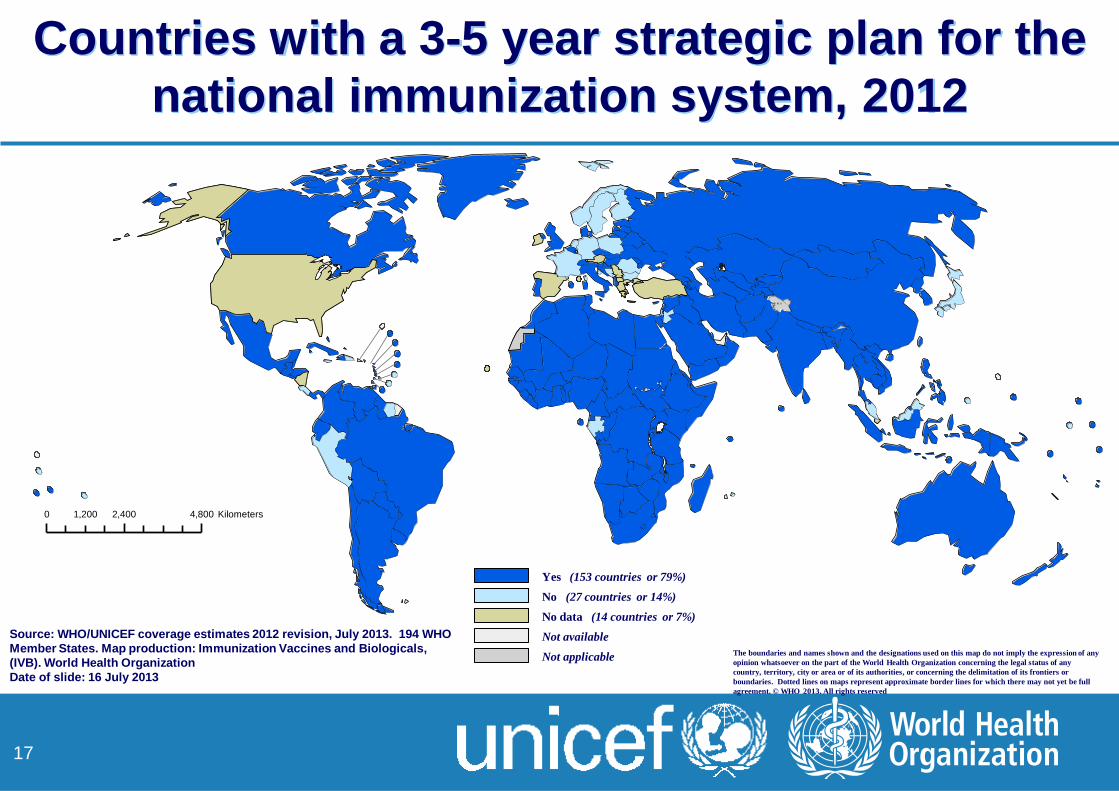
Countries with a 3-5 year strategic plan for the
national immunization system, 2012
The boundaries and names shown and the designations used on this map do not imply the expression of any
opinion whatsoever on the part of the World Health Organization concerning the legal status of any
country, territory, city or area or of its authorities, or concerning the delimitation of its frontiers or
boundaries. Dotted lines on maps represent approximate border lines for which there may not yet be full
agreement. © WHO 2013. All rights reserved
Source: WHO/UNICEF coverage estimates 2012 revision, July 2013. 194 WHO
Member States. Map production: Immunization Vaccines and Biologicals,
(IVB). World Health Organization
Date of slide: 16 July 2013
Yes (153 countries or 79%)
No (27 countries or 14%)
No data (14 countries or 7%)
Not available
Not applicable
0 2,400 4,8001,200 Kilometers
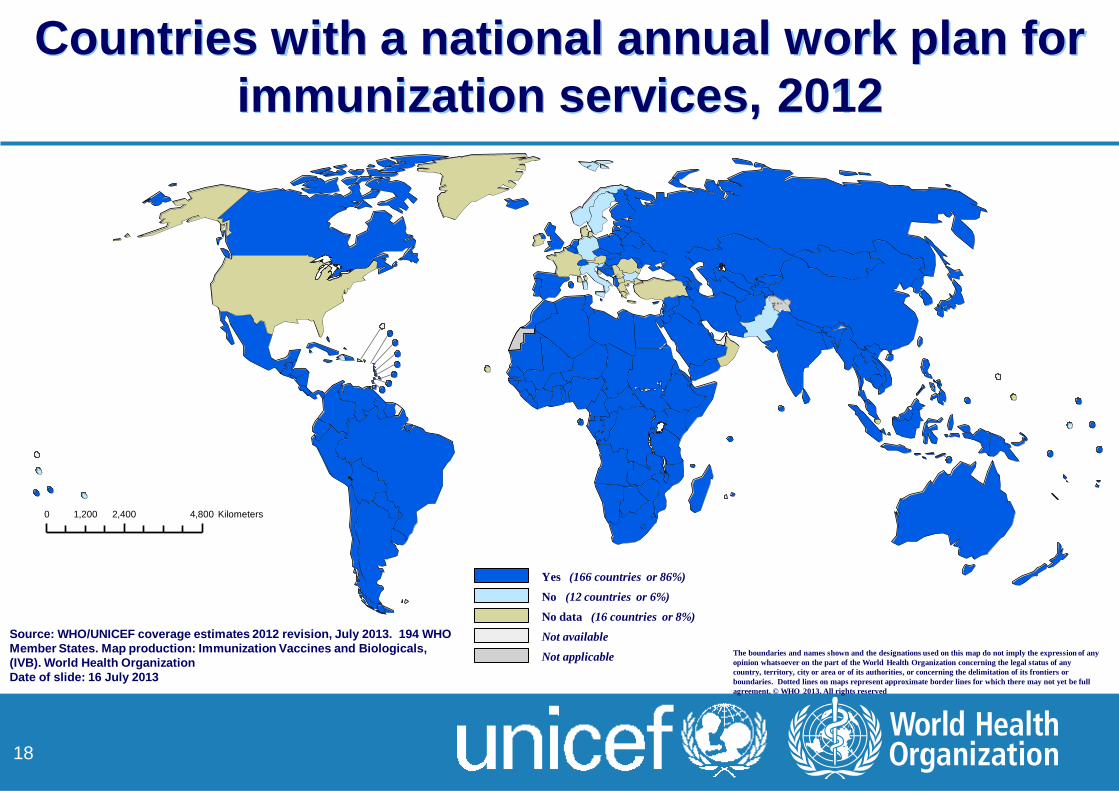
18
Countries with a national annual work plan for
immunization services, 2012
The boundaries and names shown and the designations used on this map do not imply the expression of any
opinion whatsoever on the part of the World Health Organization concerning the legal status of any
country, territory, city or area or of its authorities, or concerning the delimitation of its frontiers or
boundaries. Dotted lines on maps represent approximate border lines for which there may not yet be full
agreement. © WHO 2013. All rights reserved
Source: WHO/UNICEF coverage estimates 2012 revision, July 2013. 194 WHO
Member States. Map production: Immunization Vaccines and Biologicals,
(IVB). World Health Organization
Date of slide: 16 July 2013
Yes (166 countries or 86%)
No (12 countries or 6%)
No data (16 countries or 8%)
Not available
Not applicable
0 2,400 4,8001,200 Kilometers
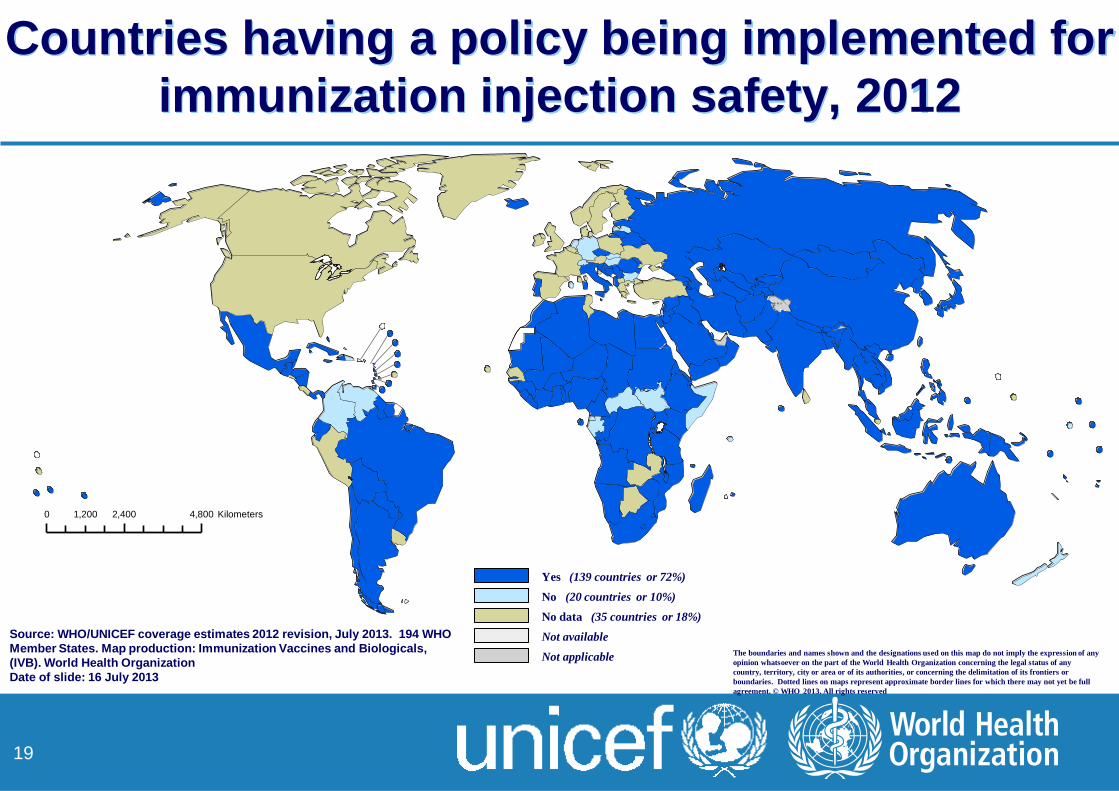
19
Countries having a policy being implemented for
immunization injection safety, 2012
The boundaries and names shown and the designations used on this map do not imply the expression of any
opinion whatsoever on the part of the World Health Organization concerning the legal status of any
country, territory, city or area or of its authorities, or concerning the delimitation of its frontiers or
boundaries. Dotted lines on maps represent approximate border lines for which there may not yet be full
agreement. © WHO 2013. All rights reserved
Source: WHO/UNICEF coverage estimates 2012 revision, July 2013. 194 WHO
Member States. Map production: Immunization Vaccines and Biologicals,
(IVB). World Health Organization
Date of slide: 16 July 2013
Yes (139 countries or 72%)
No (20 countries or 10%)
No data (35 countries or 18%)
Not available
Not applicable