Embed Size (px)
Citation preview
An Application of the City Prosperity Index in the City of Francistown, Botswana
2017 | 20182017 | 2018
ASSESSINGPROGRESS TOWARDS
URBANURBAN PROSPERITY

II ASSESSING PROGRESS TOWARDS URBAN PROSPERITY
ASSESSING PROGRESS TOWARDS URBAN PROSPERITY
III
ASSESSING PROGRESS TOWARDS URBAN PROSPERITY
An Application of the City Prosperity Index in the City of Francistown,
Botswana
II ASSESSING PROGRESS TOWARDS URBAN PROSPERITY
ASSESSING PROGRESS TOWARDS URBAN PROSPERITY
III
Lopang Pule
ForewordI am excited to share with you the “2017/2018 -State of the City Report- for the City of
Francistown” developed using the City Prosperity Initiative/Index. The report elaborates
on the prosperity levels of the City and the outcome of public policies with reference to
the six dimensions of the Wheel of Urban Prosperity which are; Productivity, Quality of
Life, Equity & Social Inclusion, Infrastructure Development, Environmental Sustainability,
and Urban Governance and Legislation.
Each of these dimensions are defined from a collection of about 3 to 5 sub-dimensions
which are also measured by a group of variables or indicators. These six dimensions
encompasses the ten targets of the Sustainable Development Goal (SDG) 11 - Make
cities inclusive, safe, resilient and sustainable, therefore presenting a comprehensive
global monitoring tool for the achievement of this Goal.
In measuring the prosperity level of the City, two types of City Prosperity Index were
used; the Basic City Prosperity index and the Extended City Prosperity index. The Basic
City Prosperity Index focused on the initial diagnosis of the City using indicators that
are commonly found in all cities; the index is used to compare cities internationally,
whereas, the Extended City Prosperity Index is an in-depth diagnosis which focused
on advanced indicators, some of which are spatial in nature (street connectivity, public
spaces, green area per capita) and it showed the comparative advantage of our City
over others in the country.
The report provides baseline information that will be used for future monitoring and
reporting on SDG 11 indicators using the City Prosperity Initiative. It offers the city the
possibility to create indicators, define targets and goals that can support the formulation
of evidence –based policies , including the definition of city- visions and long-term
plans that are both ambitious and measurable. The report not only provides incidences
and measurement of the city prosperity, but it will also enable the city authorities, as
well as local and national stakeholders to identify opportunities and potential areas of
intervention for the city to become more prosperous.
Chabongwa Matseka
Dr Burton Mguni
IV ASSESSING PROGRESS TOWARDS URBAN PROSPERITY
ASSESSING PROGRESS TOWARDS URBAN PROSPERITY
V
It also gives critical insight into which programs and policies work and the possible impacts these programs and policies may have.
It presents a comprehensive picture of the city’s performance in a holistic and clearer way.
The report outlines the progress made in all the dimensions and identifies deficiencies in each of the dimensions. This creates
an opportunity for the city to introspect and ensure it channels its future efforts and finances towards closing the gaps that have
been identified in all dimensions.
The findings and recommendations of this report are critical in supporting local decision making in key priority areas of development,
such as the strengthening of urban legislation and systems of governance, harnessing the urban economy and enhancing urban
planning of our city, and eventually feed into the realization of the goals, objectives and aspirations of the Botswana National Vision
2036 and actualize the implementation of the Botswana SDGs Roadmap.
It is our sincere hope that the report shall help shape the growth and prosperity of our City into a global destination of Interest.
I wish to recognize all efforts made by my esteemed Local team, the Technical working Team, National Steering Committee of
which I was part of, the Ministry of Infrastructure and Housing Development, Ministry of Local Government and Rural Development,
Statistics Botswana and our partners; Ministry of Finance and Economic Development, UN-HABITAT and United Nations Economic
Commission for Africa (UNECA) and all other stakeholders who were involved in the production of this report.
Joyful reading,
Chabongwa MatsekaDistrict Commissioner, City of Francistown
Lopang PuleTown Clerk, City of Francistown
Dr Burton MguniStatistician General
IV ASSESSING PROGRESS TOWARDS URBAN PROSPERITY
ASSESSING PROGRESS TOWARDS URBAN PROSPERITY
V
AcknowledgementsThe City of Francistown would like to express its appreciation to all the Members of the SDG 11 Local Project Team led by
the Principal Physical Planner I, the Technical Working Team chaired by Director of Department of Housing, and co-chaired by
The Manager, Statistics Botswana, Ministry of Infrastructure & Housing Development, Ministry of Local Government and Rural
Development and other stakeholders for their support and cooperation in providing the required data, information and technical
support in production of the Report.Above all, great thanks to UN-HABITAT and ECA who made it possible for this exercise to be
a success by offering both technical and financial support for the implementation of the Project.
We specifically acknowledge the following people for their significant contribution to the report production and related data
generation processes.
Botswana Team
Amutshilani Setoboli (Chief Housing Officer, MIH), Tirafalo Jongi’lizwe (Principal Town Planner I, CoFC), Tshwaragano Mothibi
(Principal Cartographer, DTCP), (Kentse Raphukula, Principal Economist, MFED), Kesaobaka Moreeng (Principal Housing Officer,
GCC), Bonolo Basebi (Senior Housing Officer, MIH), Grace Mphetolang (Statistics Botswana), Boago Mashadi (Statistics Botswana)
and Emmanuel Otukile (Statistics Botswana).
UN-Habitat/ECA
Donatien Beguy (Project leader), Dennis Mwaniki (Spatial Data Expert), Julius Majale (Data Analyst), Daniel Githira (Spatial Data
Analyst), Robert Ndugwa (Chief, Data and Analytics Unit), Pauline Masita (Spatial Data Assistant), Leandre Ngogang Wandji (ECA)
and Thomas Chiramba (Regional Office for Africa).
VI ASSESSING PROGRESS TOWARDS URBAN PROSPERITY
ASSESSING PROGRESS TOWARDS URBAN PROSPERITY
VII
Table of ContentsForeward ---------------------------------------------------------------------------------------------------------------------------------------------------- III
Acknowledgements ------------------------------------------------------------------------------------------------------------------------------------- V
Table of Contents --------------------------------------------------------------------------------------------------------------------------------------- VI
List of Figures, Boxes and Tables ---------------------------------------------------------------------------------------------------------------- VII
List of Abbreviations and Acronyms -----------------------------------------------------------------------------------------------------------VIII
Executive Summary --------------------------------------------------------------------------------- IXBackground ------------------------------------------------------------------------------------------------------------------------------------------------ X
Objectives--------------------------------------------------------------------------------------------------------------------------------------------------- X
Methods ---------------------------------------------------------------------------------------------------------------------------------------------------- XI
Key Findings ---------------------------------------------------------------------------------------------------------------------------------------------- XI
Chapter 1: Introduction ------------------------------------------------------------------------------- 11.1 Overview ------------------------------------------------------------------------------------------------------------------------------------------------ 1
1.2 Urbanization, Development in Botswana --------------------------------------------------------------------------------------------------3
1.3 Overview of the City of Francistown---------------------------------------------------------------------------------------------------------5
Chapter 2: Applying The City Prosperity Index In Francistown -------------------132.1 Overview of the City Prosperity Index (CPI) -------------------------------------------------------------------------------------------- 13
2.2. Linkage between CPI and SDGs ----------------------------------------------------------------------------------------------------------- 14
2.3 Applying CPI in Francistown ----------------------------------------------------------------------------------------------------------------- 15
2.4 Findings and Interpretation of the CPI for Francistown--------------------------------------------------------------------------- 19
Chapter 3: Conclusions And Recommendations --------------------------------------- 333.1 Productivity -------------------------------------------------------------------------------------------------------------------------------------------33
3.2 Infrastructure Dimension ----------------------------------------------------------------------------------------------------------------------34
3.3 Environmental Sustainability -----------------------------------------------------------------------------------------------------------------35
3.4 Quality of Life ---------------------------------------------------------------------------------------------------------------------------------------35
3.5 Equity and Social Inclusion -------------------------------------------------------------------------------------------------------------------36
3.6 Urban Governance and Legislation --------------------------------------------------------------------------------------------------------37
References --------------------------------------------------------------------------------------------- 39Annexes ------------------------------------------------------------------------------------------------- 40
VI ASSESSING PROGRESS TOWARDS URBAN PROSPERITY
ASSESSING PROGRESS TOWARDS URBAN PROSPERITY
VII
List of Figures, Boxes and TablesFigure 1: Urbanization Trends in Botswana ----------------------------------------------------------------------------------------------- 4
Figure 2: Evolution of Francistown Population ------------------------------------------------------------------------------------------- 7
Figure 3: Evolution of Francistown Population ------------------------------------------------------------------------------------------- 8
Figure 4: Scale of prosperity ------------------------------------------------------------------------------------------------------------------ 14
Figure 5: Linkages between CPI and SDG 11 targets ---------------------------------------------------------------------------------- 15
Figure 6: Francistown City Prosperity Index (CPI) --------------------------------------------------------------------------------------- 19
Figure 7: Productivity Indexes for Francistown, 2018 --------------------------------------------------------------------------------- 20
Figure 8: Infrastructure Indexes for Francistown, 2018 ------------------------------------------------------------------------------ 23
Figure 9: Quality of Life Indexes-for Francistown, 2018 ----------------------------------------------------------------------------- 24
Figure 10: Equity and Social Inclusion Indexes for Francistown, 2018 -----------------------------------------------------------27
Figure 11: Environmental Sustainability Indexes, 2018 -------------------------------------------------------------------------------- 28
Figure 12: Governance and legislation Indexes for Francistown, 2018 --------------------------------------------------------- 29
Box 1: Contribution of Open spaces and green areas to the quality of life in Francistown ------------------------------ 26
Box 2: Urban Expansion in Francistown --------------------------------------------------------------------------------------------------- 31
Table 1: Data Sources ---------------------------------------------------------------------------------------------------------------------------- 16
Table 2: A summary of Francistown CPI Indices --------------------------------------------------------------------------------------- 20
Table 3: Productivity Index- Indicator Performance ------------------------------------------------------------------------------------ 21
Table 4: Infrastructure Development Index ---------------------------------------------------------------------------------------------- 24
Table 5: Quality of Life Index ----------------------------------------------------------------------------------------------------------------- 25
Table 6: Equity and Social Inclusion Index ------------------------------------------------------------------------------------------------27
Table 7: Environmental Sustainability ------------------------------------------------------------------------------------------------------ 28
Table 8: Governance and Legislation index--------------------------------------------------------------------------------------------- 30
Table 9: SDG Indicators Update ------------------------------------------------------------------------------------------------------------- 41
Table 10: A summary of Francistown CPI Indices -------------------------------------------------------------------------------------- 42
Table 11: Technical Working Team Members ---------------------------------------------------------------------------------------------43
Map 1: Location of Francistown in Africa ---------------------------------------------------------------------------------------------------- 6
Map 2: Interlinkages between Francistown and other towns and major villages --------------------------------------------- 9
Map 3: Urban Expansion trends for Francistown --------------------------------------------------------------------------------------- 10
Map 4 Contribution of Open spaces and green areas to the quality of life in Francistown ----------------------------- 26
Map 5: Built Up Area Trends in Francistown ------------------------------------------------------------------------------------------- 30
VIII ASSESSING PROGRESS TOWARDS URBAN PROSPERITY
ASSESSING PROGRESS TOWARDS URBAN PROSPERITY
IX
List of Abbreviations and AcronymsBDS Botswana Demographic Survey
BMTHS Botswana Multi-topic Household Survey
COFC City of Francistown City
CPI City Prosperity Index/Initiative
DHMT Department of Health Management Team
DLGDP Department of Local Government & Development Planning
DOH Department of Housing
DTCP Department of Town & Country Planning
DWMPC Department of Waste Management and Pollution Control
GCC Gaborone City Council
GHG Greenhouse Gas
ECA Economic Commission for Africa
ECE Early Childhood Education
EPR Employment to Population Ratio
GDP Gross Domestic Product
ICPD International Conference on Population and Development
ICT Information, Communication Technology
LED Local Economic Development
MFED Ministry of Finance and Economic Development
MYSC Ministry of Youth, Sports and Culture Development
NMES National Monitoring and Evaluation System
NUA New Urban Agenda
QOL Quality of Life
SDG Sustainable Development Goal
UN-DESA United Nations Department of Economic and Social Affairs
UN-HABITAT United Nations Human Settlements Programme
UNODC United Nations Office on Drugs and Crime
VIII ASSESSING PROGRESS TOWARDS URBAN PROSPERITY
ASSESSING PROGRESS TOWARDS URBAN PROSPERITY
IX
Executive Summary
Background
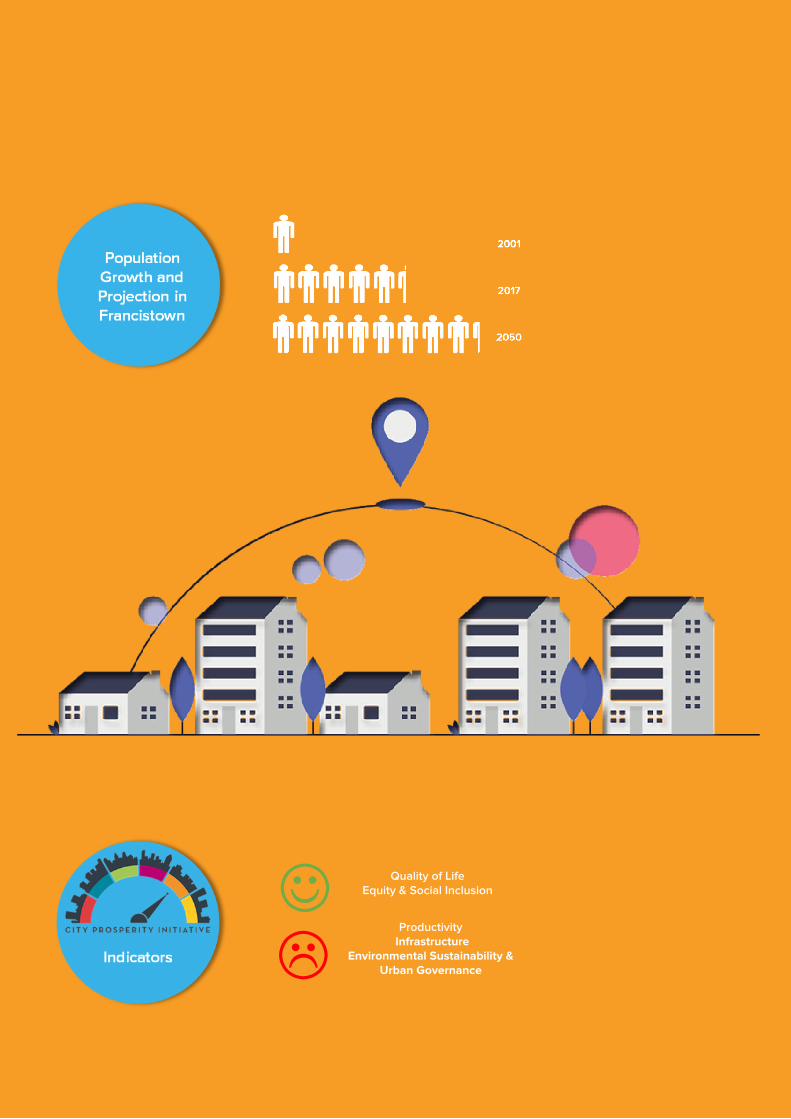
The tremendous economic growth that Botswana experienced
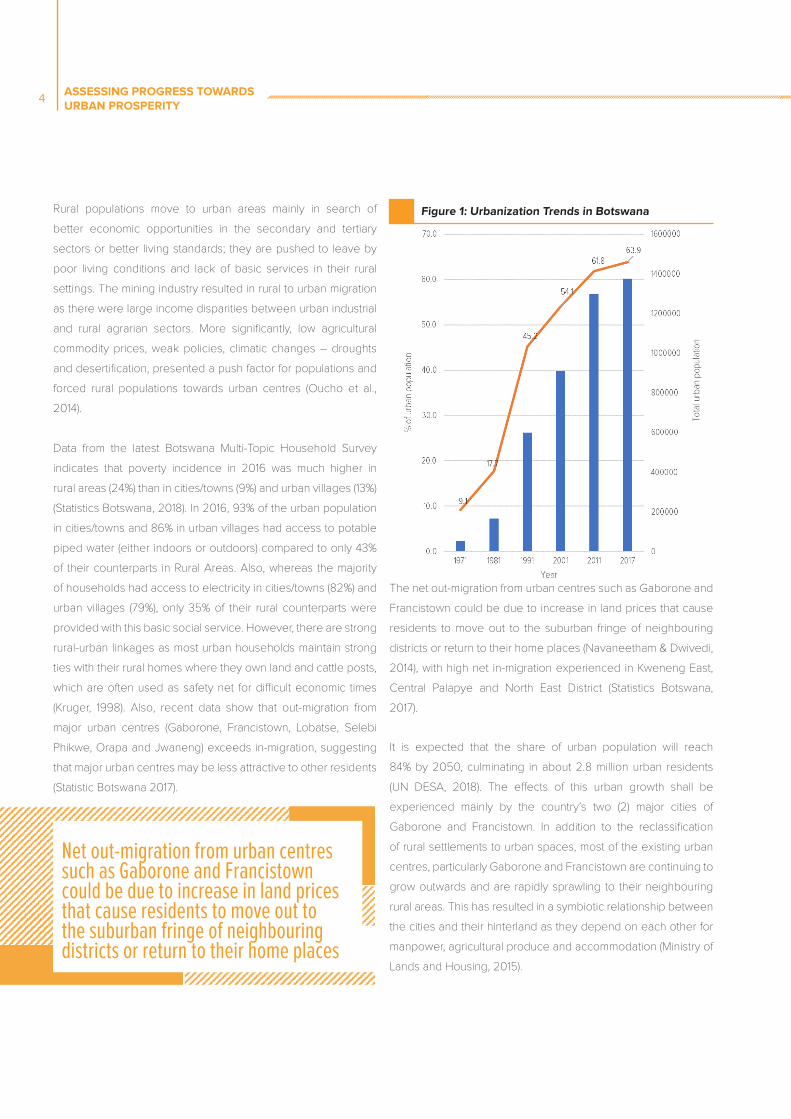
since independence was accompanied by a considerable
increase of its urban population, from only 9% of the total
population in 1971 to 54% in 2001 and 64% in 2017. Based on
UN projections, it is expected that this share of urban population
will increase to 84% by 2050, translating into 2.8 million urban
dwellers in 2050, from a little more than 50,000 urban dwellers
in 1971 and 1.4 million urban residents in 2017. It is evident that the
increasing number of urban dwellers provides a great opportunity
to achieve sustainable economic growth and development, if
authorities at local and national levels have access to relevant,
timely, accurate and disaggregated data to inform the design
and implementation of programmes and policies in order to
maximize the dispersed energies and potential of urban centres
for the common good of all.
Objectives
The main objective of this study is to provide an assessment of
urban development in two main cities in Botswana - Gaborone
and Francistown – through data and evidence generated on
various dimensions of urban prosperity, highlighting prevailing
opportunities for and challenges to sustainable urban
development in the country.
This is part of a project titled “SDG 11: Monitoring and reporting
on human settlement indicators in Africa and Latin America” that
UN-Habitat, the Economic Commission for Africa, the Ministry of
Infrastructure and Housing Development, Statistics Botswana,
and the cities of Gaborone and Francistown have implemented
between 2017 and 2019. The ultimate objective is to strengthen
the capacities of local and national governments to monitor
and report on SDG 11 and improve the availability of and access
to data and statistics at city and urban national level for the
formulation of evidence-based policies.
Low levels of industrialization in Francistown have resulted in low production of goods and services, low economic density and specialization
X ASSESSING PROGRESS TOWARDS URBAN PROSPERITY
ASSESSING PROGRESS TOWARDS URBAN PROSPERITY
XI
On one hand, the city is relatively doing well in terms of Quality of
Life and Equity & Social Inclusion, reflecting a relatively equitable
and inclusive society with a relatively well-educated population
and higher life expectancy. On the other hand, there is need to
rethink policies and investments in infrastructure, environmental
sustainability and urban governance where performance is
relatively poor based on evidence generated.
Productivity:
The productivity dimension has a relatively modest score
mainly due to low levels of industrialization that have resulted
in low production of goods and services, low economic
density and specialization, with high reliance on minerals
extraction, textile and beef industries, which have proven not
to be sustainable in the long run. As such, the Vision 2022,
an investment strategy should be appropriately implemented
to diversify the city’s economy and take advantage of its
strategic location as a gateway to several neighbouring
countries of Botswana to transform it into a Mining, Transport
and Logistical Hub. Moreover, leveraging the presence of
higher learning institutions and specialized health centres can
help harness the potential of its youthful population, turning
them into an educated, healthy and productive workforce
that will enhance its economic prospects in the future.
Infrastructure Development:
Francistown is well endowed with social infrastructure in terms
of basic services such as water, sanitation and electricity but
has low street connectivity and poor internet access, which is
a deterrent to productivity and economic growth.
Methods Data and evidence are generated from an adaption and
application of the City Prosperity Initiative (CPI) and its related
index in Francistown City, Botswana. The CPI is a platform that
addresses in a single framework the environmental, social and
economic components of city prosperity for the formulation,
implementation and monitoring of policies and practices on
sustainable development. The associated index is a composite
measure used to assess the overall performance of cities in
terms of urban prosperity based on six key dimensions:
a) Productivity,
b) Infrastructure development,
c) Quality of life,
d) Equity and social inclusion,
e) Environmental sustainability
f ) Governance and legislation.
Data used for the computation of the index comes from various
sources including administrative data, recent demographic
and socio-economic surveys such as the Botswana Multi Topic
Household Survey of 2017, the Botswana Demographic Survey
of 2017, maps from the Department of Surveys and Mapping and
the Department of Town and Country Planning, as well as spatial
data from satellite imagery and other open source geospatial
data platforms.
Key FindingsFindings suggest that overall, the city of Francistown is doing
relatively poorly in terms of prosperity, with a weak prosperity
(moderately weak under basic CPI) and large discrepancies
among the six dimensions of Urban Prosperity. There is therefore
an unbalanced urban development in Francistown, probably due
to institutional and structural weaknesses.
X ASSESSING PROGRESS TOWARDS URBAN PROSPERITY
ASSESSING PROGRESS TOWARDS URBAN PROSPERITY
XI
Environmental Sustainability:
While Francistown is a green city, it has been observed to
be lagging behind in terms of protection of its environment
with poor air quality, and inexistent or inefficient waste
management systems. It is recommended to upgrade the
existing monitoring stations and create new ones in the
outskirts of the city for better monitoring of air quality.
In terms of waste management, there is a need to develop
the City Waste Collection Management Strategy which will
address both collection and the 3R’s initiative (reduce, re-
use, re-cycle) as well as community incentives and public
education on waste management.Solar should be tapped as
an important source of energy through the implementation
of the objectives of the Renewable Energy Strategy and the
Off-Grid Solar Action Plan.
Equity and Social Inclusion:
Francistown is doing fairly well in terms of equity and
social inclusion as evidenced by low level of slums, youth
unemployment, gender balance in access to secondary
school and relatively high levels of women’s representation
in decision-making processes. It is however paramount
to enhance policies and programmes geared towards
poverty eradication and equal distribution of wealth given
the relatively high levels of inequalities and poverty. Also,
intensifying the implementation of the Plan of Action of the
recently adopted Gender Equality Statement of Commitment
will contribute to achieving gender equality in many spheres
in the city.
It is therefore recommended to fully implement the Francistown
Revitalization Plan to improve street connectivity, permeability
and mobility of residents, as well as the Botswana Integrated
Transport Plan for improved urban mobility through access
and utilisation of convenient and reliable public transports
systems. A digital revolution will also help transform the city
into a smart and tech-savvy city, that is not only efficient in
production and trading (e-commerce), but that can also offer
decent employment opportunities for its youthful population.
Quality of Life:
Francistown city offers a fairly good quality of life to its
residents, with the highest score on this dimension, mainly
driven by high life expectancy at birth, literacy rate, mean
years of schooling, low homicide rate, and high access to
public space. However, there is need to rethink interventions
and strategies to improve maternal and child health including
South-to-South learning.
Access to Early Childhood Education which is mainly offered
by the private sector is low, calling for increased involvement
of the public sector through the implementation of the
early childhood enrolment programme. Safety needs to be
improved by integrating safety considerations from planning
stage through implementation of the Safer Cities Programme.
In addition, economic empowerment and poverty eradication
strategies may provide a conducive environment for urban
safety. Permeability and connectivity can be improved during
the redevelopment and revitalisation of the city’s urban
form. Health personnel shortage can be addressed through
increased investment in competitive remuneration packages
to attract and retain the physicians in the city.
Francistown lags behind in terms of protection of its environment with poor air quality, and inexistent or inefficient waste management systems.
XII ASSESSING PROGRESS TOWARDS URBAN PROSPERITY
ASSESSING PROGRESS TOWARDS URBAN PROSPERITY
XIII
Urban Governance & Legislation:
Engagement and participation of residents in the
management of Francistown is limited due to voter apathy,
limited access to public information and civic participation in
the city’s development including the planning and budgeting
processes. This calls for increased participatory urban
governance, use of non-conventional public participation
channels like social media to improve communication and
feedback with residents. While land use efficiency is relatively
good in the city, effective implementation of the Francistown
Revitalization Plan will contribute to reducing incidences of
urban sprawl, strains on urban services and infrastructure
provision and reduced economies of agglomeration through
compact developments and densification.
Conclusion
In summary, the adaptation of the CPI in Francistown
provides data and evidence that can serve as a baseline
for the monitoring of progress towards sustainable urban
development but also enable the city authorities as well as
local and national stakeholders to gauge their performance
and formulate inter-sectoral policy interventions.Together
with the Ministry of Infrastructure and Housing Development
and other relevant agencies, city authorities will be able
- through a cross-sectoral and integrated approach - to
identify and address the multi-dimensional nature of urban
development, and collectively monitor planning investments
as well as the urban transformations in the country.
However, access to data and information is unsatisfactory
and needs to be greatly improved. In the long run, it is
paramount to put in place the necessary mechanisms to
enable access and use of relevant, timely, accurate and
disaggregated data to inform the design and implementation
of programmes and policies in Francistown.
Recommendations to enable access and use of relevant, timely, accurate and disaggregated data
Streamline data collection tools to CPI
requirements and develop a data sharing
strategy on urban indicators.
Set up a clear institutional and regulatory
framework that will promote data sharing
across sectors.
Set up a research and/or data unit within the
Council that is in-charge of collecting relevant
data and generating evidence to help in
decision-making in Francistown, acting as a
local urban observatory.
Establish a National Urban Observatory
to pursue the monitoring of the urban
transformation and support evidence-
based policies and actions and formulate
transformative actions in cities and urban
centres.
Implement the National Spatial plan in terms
of harmonisation of administrative boundaries.
Reinforce capacitation and skills transfer
through additional capacity building activities
at the local level.

XII ASSESSING PROGRESS TOWARDS URBAN PROSPERITY
ASSESSING PROGRESS TOWARDS URBAN PROSPERITY
XIII
Quality of Life Equity & Social Inclusion
Productivity Infrastructure
Environmental Sustainability & Urban Governance
Chapter 1: Introduction
1
1.1 Overview
Despite their recognized importance in fostering
sustainable development, cities and urban areas in both
developing and developed countries are suffering from
an acute crisis of accurate, timely, and useful information,
hindering their capacity to develop sound and informed
policies and actions to help them provide adequate
services to their residents. Most of city and local authorities
recognize that they do not have appropriate means and
tools to understand urban dynamics and challenges with
accurate data and information. In many parts of the world
especially in least developed countries, lack of good
quality, relevant, accessible and timely data on cities is
a key element impeding progress not only in monitoring
and reporting on global frameworks such as the 2030
Agenda for Sustainable Development and the New
Urban Agenda (NUA), but also in formulating policies and
designing programmes that respond to urban dynamics
and challenges. This suggests that in many cities around
the world, planners and decision-makers are operating
in an environment of uncertainty, allocating resources to
immediate and pressing issues rather than investing in
progressive change over the long term. Yet, as recognized
by the UN Sustainable Development Solutions Network
(SDSN) ‘data and metrics are essential for development
goals to be met either at national or subnational level’
(European Commission, 2019).
Cities require monitoring systems to support their vision
and long-term plan for sustainable development, through
periodic assessments on their state of development and
evaluation of policy outcomes and impact of specific
plans and actions. Through generation of reliable, timely,
disaggregated, and accessible urban data, these systems
can not only help track progress towards achieving
development goals and identify setbacks and impediments
to such progress, but also support the formulation of
evidence-based policies.
To help address the challenges related to access and use
of urban data worldwide, UN-Habitat has, over the past
two decades, developed tools and methodologies for
urban data collection and analysis. This has been achieved
through partnerships with countries, cities around the
world, as well as with other development agencies and
institutions. One of the major tools developed by UN-
Habitat in 2012, and which has been tested and adopted
by various local, national governments and international
organisations is the City Prosperity Initiative and its related
index, the City Prosperity Index (CPI). CPI is a composite
index which not only allows countries and cities to collect
data on their performance against 62 indicators across six
urban dimensions¹, but also acts as a practical framework for
the formulation, implementation and monitoring of policies
and practices on sustainable development and increased
urban prosperity. By 2019, CPI has been applied to evaluate
urban performance in 539 cities in 54 countries spread
across all world regions, with most of these cities using
the information generated for data-driven and informed
decision-making processes.
This report presents results from an application of the CPI in
the City of Francistown, Botswana. In addition to presenting
data and performance across each indicator and dimension,
the report also summarises the prevailing opportunities and
challenges to sustainable development in Francistown and
in Botswana at large, and makes recommendations which, if
implemented would promote prosperous growth of the city.
1The six dimensions of the CPI include productivity, infrastructure development, quality of life, equity and social inclusion, environmental sustainability, and urban governance and legislation. The
most elaborated version of the CPI is based on 72 indicators
2ASSESSING PROGRESS TOWARDS URBAN PROSPERITY
ASSESSING PROGRESS TOWARDS URBAN PROSPERITY
3
The report is part of a project titled “SDG 11: Monitoring and
reporting on human settlement indicators in Africa and
Latin America”, whose implementation in Botswana started
in 2017, through a collaboration between UN-Habitat, the
Ministry of Infrastructure and Housing Development, Statistics
Botswana, and the cities of Gaborone and Francistown. The
main objective of the project is to strengthen the capacities of
national governments and support the design of monitoring
tools to improve the availability of and access to data and
statistics at city and urban national level for the formulation of
evidence-based policies. As such, the project is in line with
Botswana’s efforts to strengthen urban data collection, analysis
and dissemination capacities, effective science-policy links and
relevance to monitoring urban SDGs and the NUA as well as for
tracking the progress made across several urban development
and transformation pathways in Botswana.
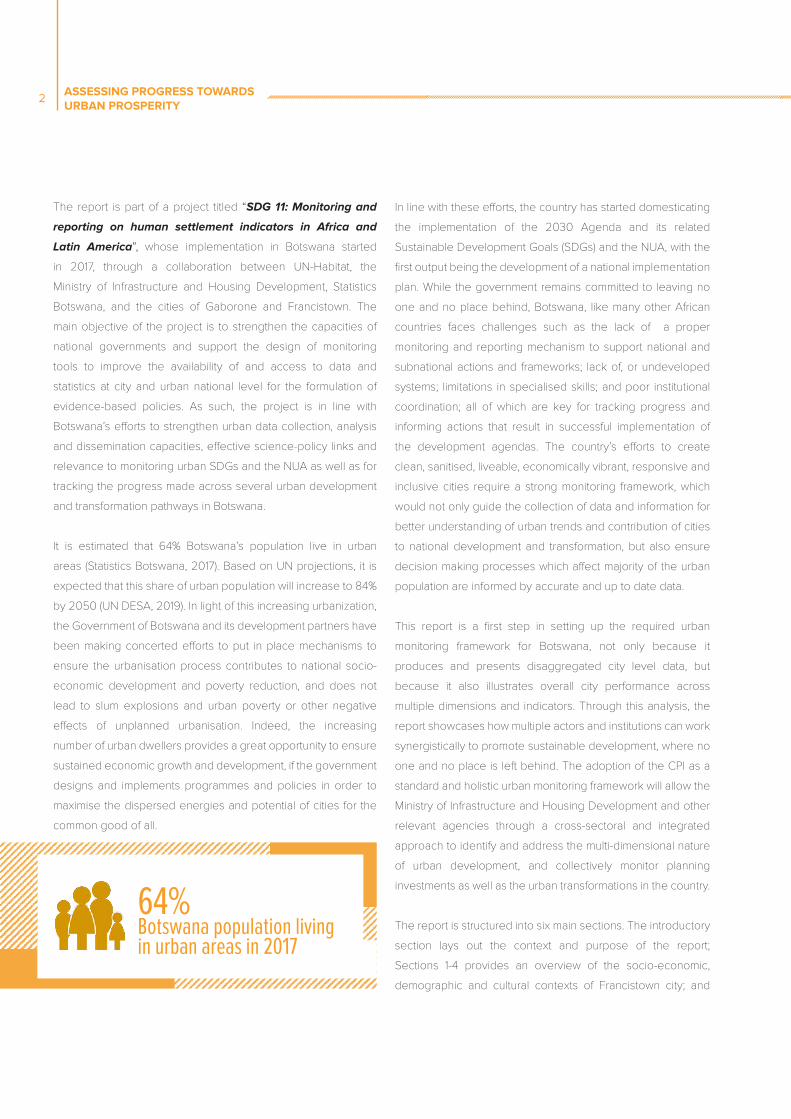
It is estimated that 64% Botswana’s population live in urban
areas (Statistics Botswana, 2017). Based on UN projections, it is
expected that this share of urban population will increase to 84%
by 2050 (UN DESA, 2019). In light of this increasing urbanization,
the Government of Botswana and its development partners have
been making concerted efforts to put in place mechanisms to
ensure the urbanisation process contributes to national socio-
economic development and poverty reduction, and does not
lead to slum explosions and urban poverty or other negative
effects of unplanned urbanisation. Indeed, the increasing
number of urban dwellers provides a great opportunity to ensure
sustained economic growth and development, if the government
designs and implements programmes and policies in order to
maximise the dispersed energies and potential of cities for the
common good of all.
In line with these efforts, the country has started domesticating
the implementation of the 2030 Agenda and its related
Sustainable Development Goals (SDGs) and the NUA, with the
first output being the development of a national implementation
plan. While the government remains committed to leaving no
one and no place behind, Botswana, like many other African
countries faces challenges such as the lack of a proper
monitoring and reporting mechanism to support national and
subnational actions and frameworks; lack of, or undeveloped
systems; limitations in specialised skills; and poor institutional
coordination; all of which are key for tracking progress and
informing actions that result in successful implementation of
the development agendas. The country’s efforts to create
clean, sanitised, liveable, economically vibrant, responsive and
inclusive cities require a strong monitoring framework, which
would not only guide the collection of data and information for
better understanding of urban trends and contribution of cities
to national development and transformation, but also ensure
decision making processes which affect majority of the urban
population are informed by accurate and up to date data.
This report is a first step in setting up the required urban
monitoring framework for Botswana, not only because it
produces and presents disaggregated city level data, but
because it also illustrates overall city performance across
multiple dimensions and indicators. Through this analysis, the
report showcases how multiple actors and institutions can work
synergistically to promote sustainable development, where no
one and no place is left behind. The adoption of the CPI as a
standard and holistic urban monitoring framework will allow the
Ministry of Infrastructure and Housing Development and other
relevant agencies through a cross-sectoral and integrated
approach to identify and address the multi-dimensional nature
of urban development, and collectively monitor planning
investments as well as the urban transformations in the country.
The report is structured into six main sections. The introductory
section lays out the context and purpose of the report;
Sections 1-4 provides an overview of the socio-economic,
demographic and cultural contexts of Francistown city; and
64% Botswana population living in urban areas in 2017
2ASSESSING PROGRESS TOWARDS URBAN PROSPERITY
ASSESSING PROGRESS TOWARDS URBAN PROSPERITY
3
Sections 5-6 focuses on the CPI, the data used and findings
and their interpretation. The conclusion section summarizes the
key findings and recommendations for the production and use
of urban and city-level data for Francistown, which can also be
applied in other urban settings in Botswana.
1.2 Urbanization, Development in Botswana
Botswana is one of the fastest growing and most successful
economies in sub-Saharan Africa, with its economic growth
averaging 5% per annum over the past decade (The World
Bank Group, 2015). Since gaining independence in 1966,
the country has experienced remarkable economic growth
fuelled particularly by considerable mineral wealth (diamonds),
good governance, and careful fiscal and sound economic
management. The discovery and exploitation of these precious
stones resulted in tremendous growth which in conjunction
with a relatively small population of approximately two million,
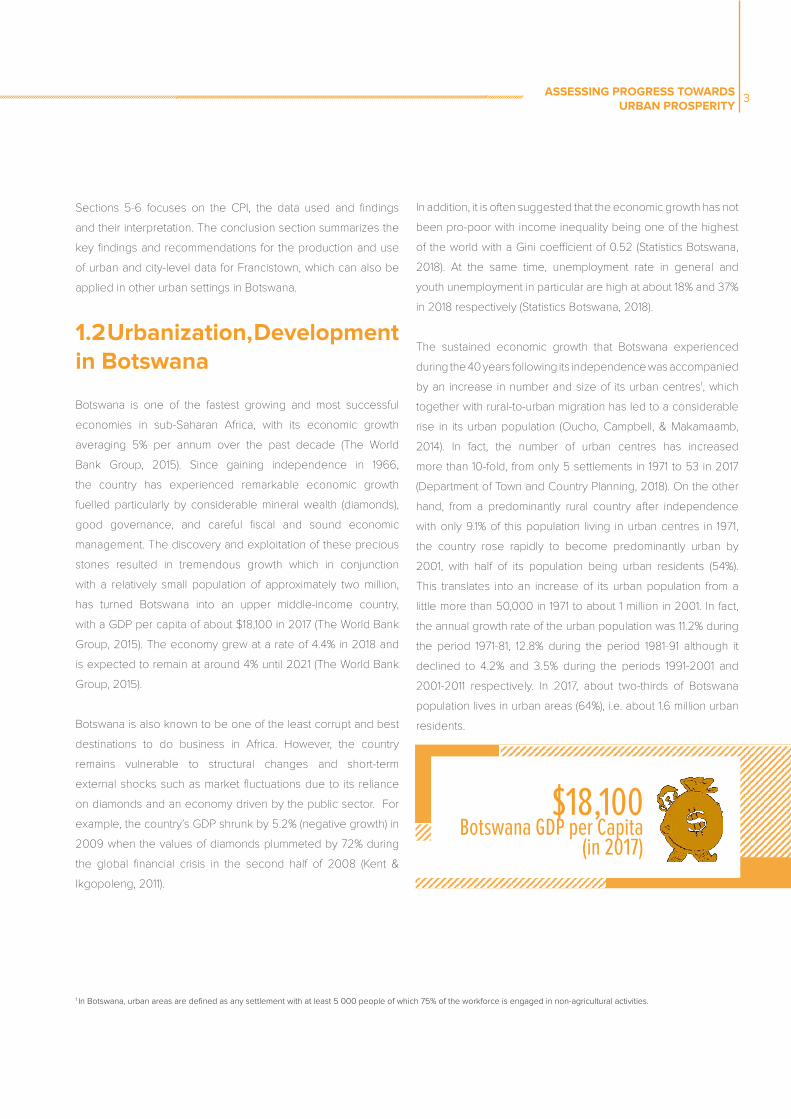
has turned Botswana into an upper middle-income country,
with a GDP per capita of about $18,100 in 2017 (The World Bank
Group, 2015). The economy grew at a rate of 4.4% in 2018 and
is expected to remain at around 4% until 2021 (The World Bank
Group, 2015).
Botswana is also known to be one of the least corrupt and best
destinations to do business in Africa. However, the country
remains vulnerable to structural changes and short-term
external shocks such as market fluctuations due to its reliance
on diamonds and an economy driven by the public sector. For
example, the country’s GDP shrunk by 5.2% (negative growth) in
2009 when the values of diamonds plummeted by 72% during
the global financial crisis in the second half of 2008 (Kent &
Ikgopoleng, 2011).
In addition, it is often suggested that the economic growth has not
been pro-poor with income inequality being one of the highest
of the world with a Gini coefficient of 0.52 (Statistics Botswana,
2018). At the same time, unemployment rate in general and
youth unemployment in particular are high at about 18% and 37%
in 2018 respectively (Statistics Botswana, 2018).
The sustained economic growth that Botswana experienced
during the 40 years following its independence was accompanied
by an increase in number and size of its urban centres1, which
together with rural-to-urban migration has led to a considerable
rise in its urban population (Oucho, Campbell, & Makamaamb,
2014). In fact, the number of urban centres has increased
more than 10-fold, from only 5 settlements in 1971 to 53 in 2017
(Department of Town and Country Planning, 2018). On the other
hand, from a predominantly rural country after independence
with only 9.1% of this population living in urban centres in 1971,
the country rose rapidly to become predominantly urban by
2001, with half of its population being urban residents (54%).
This translates into an increase of its urban population from a
little more than 50,000 in 1971 to about 1 million in 2001. In fact,
the annual growth rate of the urban population was 11.2% during
the period 1971-81, 12.8% during the period 1981-91 although it
declined to 4.2% and 3.5% during the periods 1991-2001 and
2001-2011 respectively. In 2017, about two-thirds of Botswana
population lives in urban areas (64%), i.e. about 1.6 million urban
residents.
1 In Botswana, urban areas are defined as any settlement with at least 5 000 people of which 75% of the workforce is engaged in non-agricultural activities.
$18,100 Botswana GDP per Capita
(in 2017)
4ASSESSING PROGRESS TOWARDS URBAN PROSPERITY
ASSESSING PROGRESS TOWARDS URBAN PROSPERITY
5
Rural populations move to urban areas mainly in search of
better economic opportunities in the secondary and tertiary
sectors or better living standards; they are pushed to leave by
poor living conditions and lack of basic services in their rural
settings. The mining industry resulted in rural to urban migration
as there were large income disparities between urban industrial
and rural agrarian sectors. More significantly, low agricultural
commodity prices, weak policies, climatic changes – droughts
and desertification, presented a push factor for populations and
forced rural populations towards urban centres (Oucho et al.,
2014).
Data from the latest Botswana Multi-Topic Household Survey
indicates that poverty incidence in 2016 was much higher in
rural areas (24%) than in cities/towns (9%) and urban villages (13%)
(Statistics Botswana, 2018). In 2016, 93% of the urban population
in cities/towns and 86% in urban villages had access to potable
piped water (either indoors or outdoors) compared to only 43%
of their counterparts in Rural Areas. Also, whereas the majority
of households had access to electricity in cities/towns (82%) and
urban villages (79%), only 35% of their rural counterparts were
provided with this basic social service. However, there are strong
rural-urban linkages as most urban households maintain strong
ties with their rural homes where they own land and cattle posts,
which are often used as safety net for difficult economic times
(Kruger, 1998). Also, recent data show that out-migration from
major urban centres (Gaborone, Francistown, Lobatse, Selebi
Phikwe, Orapa and Jwaneng) exceeds in-migration, suggesting
that major urban centres may be less attractive to other residents
(Statistic Botswana 2017).
The net out-migration from urban centres such as Gaborone and
Francistown could be due to increase in land prices that cause
residents to move out to the suburban fringe of neighbouring
districts or return to their home places (Navaneetham & Dwivedi,
2014), with high net in-migration experienced in Kweneng East,
Central Palapye and North East District (Statistics Botswana,
2017).
It is expected that the share of urban population will reach
84% by 2050, culminating in about 2.8 million urban residents
(UN DESA, 2018). The effects of this urban growth shall be
experienced mainly by the country’s two (2) major cities of
Gaborone and Francistown. In addition to the reclassification
of rural settlements to urban spaces, most of the existing urban
centres, particularly Gaborone and Francistown are continuing to
grow outwards and are rapidly sprawling to their neighbouring
rural areas. This has resulted in a symbiotic relationship between
the cities and their hinterland as they depend on each other for
manpower, agricultural produce and accommodation (Ministry of
Lands and Housing, 2015).
Figure 1: Urbanization Trends in Botswana
Net out-migration from urban centres such as Gaborone and Francistown could be due to increase in land prices that cause residents to move out to the suburban fringe of neighbouring districts or return to their home places
4ASSESSING PROGRESS TOWARDS URBAN PROSPERITY
ASSESSING PROGRESS TOWARDS URBAN PROSPERITY
5
1.3 Overview of the City of Francistown
This section provides a brief overview of the historical,
geographical, demographic and socio-economic backgrounds
of the City of Francistown.
1.3.1 Historical Background
Francistown is Botswana’s second city and is located in the North
Eastern part of the country. Unlike most of the urban settlements
in Botswana, the history of Francistown is unique. In the late
1867, Southern Africa’s first gold rush was ignited when German
Karl Mauch discovered gold along the Tati River. A group of
Australian miners showed up to the small town in search of their
stake two (2) years later, along with Englishman Daniel Francis.
Although Francis headed for the newly discovered Kimberley
diamond fields in 1870, he returned 10 years later to negotiate
local mining rights with the Ndebele king Lobengula and laid out
the town that now bears his name. However, there is a school of
thought that the city should have been called Nyangabwe, after
the name of the hill that is a unique landmark in the city (Eriksson,
Altermann, & Fortsch, 1995; Morton, Ramsay, & Mgadla, 2008;
Republic of Botswana, 2009).
Prior to independence, Francistown was Botswana’s largest
commercial centre. The city started as a gold mining town, with
gold sustaining its economy from the late 1800s until the 1930s.
The discovery of gold in 1869 sparked the first gold rush in Africa
fifteen years before the gold boom at Witwatersrand in South
Africa. But the industry was hard hit by the global recession of
the 1930s. Between 1936 and 1980, the economy of Francistown
was largely supported or dependent on the Witwatersrand
Native Labour Association, a company that recruited labour force
for South African mines.
The miners were recruited from many African countries and
transported to South Africa through Francistown by air or railway.
Since 1966, the city has grown significantly mainly due to active
cross-border trading with Rhodesia/Zimbabwe, becoming in
1997 Botswana’s second city after Gaborone (Eriksson et al.,
1995; Morton et al., 2008; Republic of Botswana, 2009). At its
creation, the town comprised one street east of, and parallel
to the railway line - the Haskins Street - the first tarred road in
Botswana (named after a prominent family in the town prior to
independence).
The city is governed by Francistown City Council, which is
composed of a political and an administrative wing. The Council
has 24 Councillors representing the different wards of the city, a
Mayor who is head of the political wing, and a Town Clerk who
heads the Administrative wing.
1.3.2 Geography and Location
The City of Francistown is located precisely on latitude 210 11’
South of the equator and longitude 270 32’ East of the Greenwich
Meridian. The City lies within the Eastern Planning Region of
Botswana, which has a concentration of mining activities and is
the largest in the Region in terms of both population and area
(Department of Town and Country Planning, 2018). It is the main
urban centre within North East District and is the hub of Greater
Francistown Planning Area. Its role is recognized by the National
Settlement Policy (1998), which has ranked it as a Primary Centre
in the settlement hierarchy in the country. It occupies a total land
area of 19,657 hectares of which 3,862.3 hectares is made of
undeveloped land.
The City is situated around the confluence of the Tati and Ntshe
rivers and lies about 80 km from the Zimbabwean border on the
main North-South trunk road. The trunk road to Maun meets the
North – South road within the City. The Botswana Railways line,
which runs North-South of the country passes through the centre
of the City while the Sowa rail line runs westwards from the City.

6ASSESSING PROGRESS TOWARDS URBAN PROSPERITY
ASSESSING PROGRESS TOWARDS URBAN PROSPERITY
7
Map 1: Location of Francistown in Africa
The City of Francistown is strategically positioned to be a gateway
to countries in Botswana’s northern border (e.g. Zimbabwe,
Zambia, etc.), and to many unearthed economic possibilities in
the northern part of the country, all the way to the Chobe area,
Okavango, Makgadikgadi and the eastern part of the country,
which boast the biggest dams with tourism potential and beyond.
Over 70 percent of Botswana’s mining activity takes place
in northern Botswana, with Francistown being a dominant
administrative and commercial hub in the North.
The city maintains strong links with the entire northern part of the
country and beyond; and serves as a major hub of transportation
communication for northern Botswana and indeed for the whole
country (City of Francistown Council & Francistown Urban Devel-
opment Commitee, 2017).
The City has excellent road links to southern part of Botswana as
well as Zimbabwe and Zambia to the north via North-South road.
From Francistown, there are also road connections to Orapa/
Letlhakane (and the Boteti area), Maun (and the Okavango),
Kasane (and Chobe) Zambia and the Caprivi Strip of Namibia.
The mining towns of Sowa and Selebi-Phikwe and hence to
South Africa are well connected by road and rail to Francistown.
In addition, there are regular connecting flights to Johannesburg,
Maun and to other parts of the world via Gaborone from Phillip
Gaonwe Matante International Airport (formerly Francistown
International Airport).
These linkages have also presented a suitable platform for
twinning arrangements with other cities such as the City
of Genk in Belgium, Livingstone in Zambia, and Buffalos in
South Africa.These arrangements aim at benchmarking good
practices that could assist the city in improving strategies for
implementing successful development projects and programs
(City of Francistown Council & Francistown Urban Development
Commitee, 2017).
1.3.3 Demographic BackgroundCompared to most countries in sub-Saharan Africa, Botswana
is at an advanced stage of the demographic transition, with
significant decline of its fertility and mortality rates. In 2018,
Botswana’s population was estimated at just over 2.2 million
people (Statistics Botswana, 2017) and is projected to reach 3.4
million by 2050. Its total fertility has gone down from about 6
children on average per woman in the 1960s to about 3 children
in 2017 (Statistics Botswana, 2017), which is also much lower than
the average of about 5 children for sub-Saharan Africa.
Location of Francistown
6ASSESSING PROGRESS TOWARDS URBAN PROSPERITY
ASSESSING PROGRESS TOWARDS URBAN PROSPERITY
7
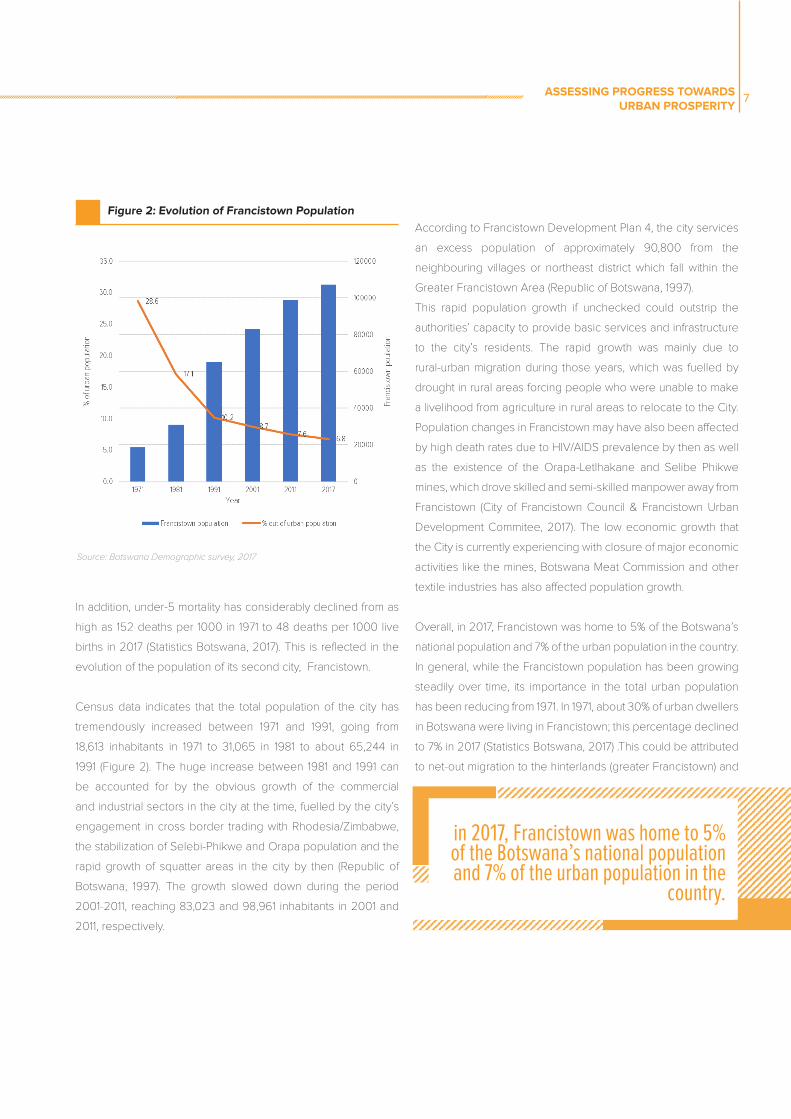
In addition, under-5 mortality has considerably declined from as
high as 152 deaths per 1000 in 1971 to 48 deaths per 1000 live
births in 2017 (Statistics Botswana, 2017). This is reflected in the
evolution of the population of its second city, Francistown.
Census data indicates that the total population of the city has
tremendously increased between 1971 and 1991, going from
18,613 inhabitants in 1971 to 31,065 in 1981 to about 65,244 in
1991 (Figure 2). The huge increase between 1981 and 1991 can
be accounted for by the obvious growth of the commercial
and industrial sectors in the city at the time, fuelled by the city’s
engagement in cross border trading with Rhodesia/Zimbabwe,
the stabilization of Selebi-Phikwe and Orapa population and the
rapid growth of squatter areas in the city by then (Republic of
Botswana, 1997). The growth slowed down during the period
2001-2011, reaching 83,023 and 98,961 inhabitants in 2001 and
2011, respectively.
in 2017, Francistown was home to 5% of the Botswana’s national population and 7% of the urban population in the
country.
According to Francistown Development Plan 4, the city services
an excess population of approximately 90,800 from the
neighbouring villages or northeast district which fall within the
Greater Francistown Area (Republic of Botswana, 1997).
This rapid population growth if unchecked could outstrip the
authorities’ capacity to provide basic services and infrastructure
to the city’s residents. The rapid growth was mainly due to
rural-urban migration during those years, which was fuelled by
drought in rural areas forcing people who were unable to make
a livelihood from agriculture in rural areas to relocate to the City.
Population changes in Francistown may have also been affected
by high death rates due to HIV/AIDS prevalence by then as well
as the existence of the Orapa-Letlhakane and Selibe Phikwe
mines, which drove skilled and semi-skilled manpower away from
Francistown (City of Francistown Council & Francistown Urban
Development Commitee, 2017). The low economic growth that
the City is currently experiencing with closure of major economic
activities like the mines, Botswana Meat Commission and other
textile industries has also affected population growth.
Overall, in 2017, Francistown was home to 5% of the Botswana’s
national population and 7% of the urban population in the country.
In general, while the Francistown population has been growing
steadily over time, its importance in the total urban population
has been reducing from 1971. In 1971, about 30% of urban dwellers
in Botswana were living in Francistown; this percentage declined
to 7% in 2017 (Statistics Botswana, 2017) .This could be attributed
to net-out migration to the hinterlands (greater Francistown) and
Figure 2: Evolution of Francistown Population
Source: Botswana Demographic survey, 2017
8ASSESSING PROGRESS TOWARDS URBAN PROSPERITY
ASSESSING PROGRESS TOWARDS URBAN PROSPERITY
9
1.3.4 Socio-Economic BackgroundMining, commerce and agriculture have been essential parts
of Francistown mainly due to its location along Botswana’s
main road and rail transport routes, mining. Tourism related
accommodation; Textile, the Dumela Industrial Complex and
Botswana Meat Commission are the main economic drivers in
the city.
The advantages enjoyed by the City of Francistown due to
its well-developed transportation and communication links
have encouraged the growth of a large wholesale sector
serving a large part of northern Botswana, plus parts of Caprivi
Strip (Namibia), Zambia and Zimbabwe. This has made the
phenomenon of urbanization, mostly due to rural-urban migration
in search of greener pastures, an everyday experience for the
City. Shopping tours operate from Bulawayo as far as Lusaka to
the city of Francistown several times a week, thus boosting the
economic base of the city. In the process, some traders end up
choosing to settle in the city for better opportunities.
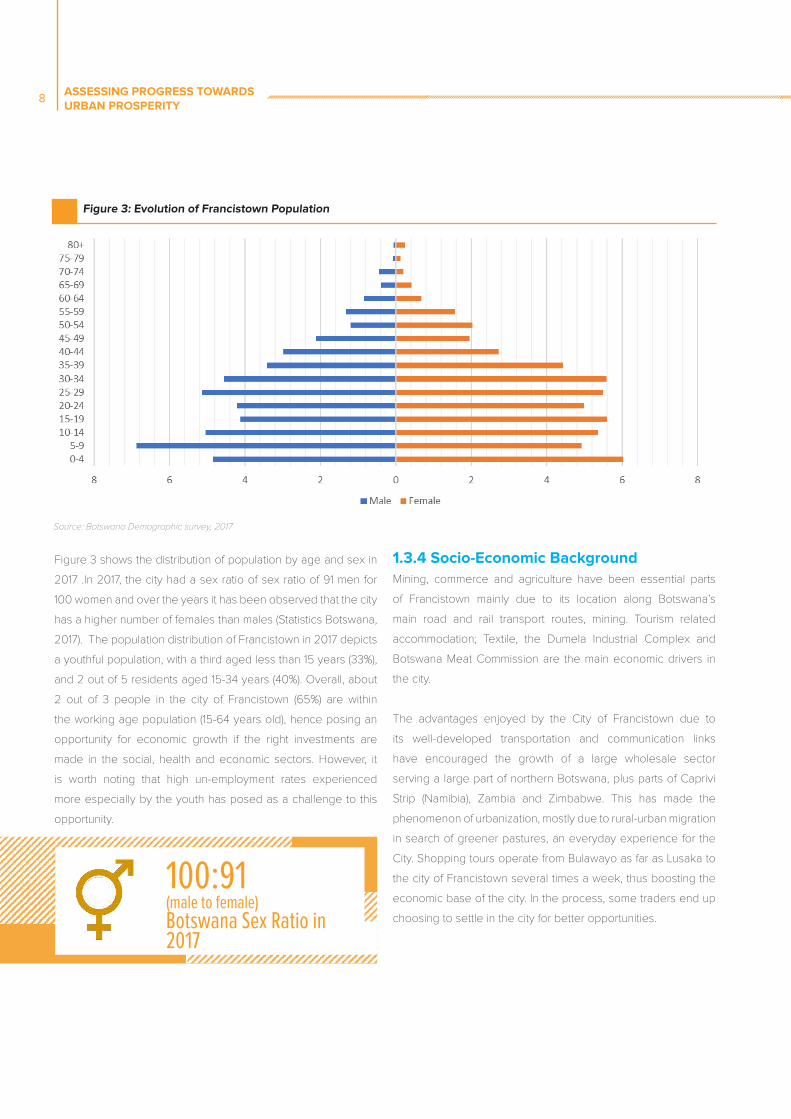
Figure 3: Evolution of Francistown Population
Source: Botswana Demographic survey, 2017
100:91(male to female)Botswana Sex Ratio in 2017
Figure 3 shows the distribution of population by age and sex in
2017 .In 2017, the city had a sex ratio of sex ratio of 91 men for
100 women and over the years it has been observed that the city
has a higher number of females than males (Statistics Botswana,
2017). The population distribution of Francistown in 2017 depicts
a youthful population, with a third aged less than 15 years (33%),
and 2 out of 5 residents aged 15-34 years (40%). Overall, about
2 out of 3 people in the city of Francistown (65%) are within
the working age population (15-64 years old), hence posing an
opportunity for economic growth if the right investments are
made in the social, health and economic sectors. However, it
is worth noting that high un-employment rates experienced
more especially by the youth has posed as a challenge to this
opportunity.
8ASSESSING PROGRESS TOWARDS URBAN PROSPERITY
ASSESSING PROGRESS TOWARDS URBAN PROSPERITY
9
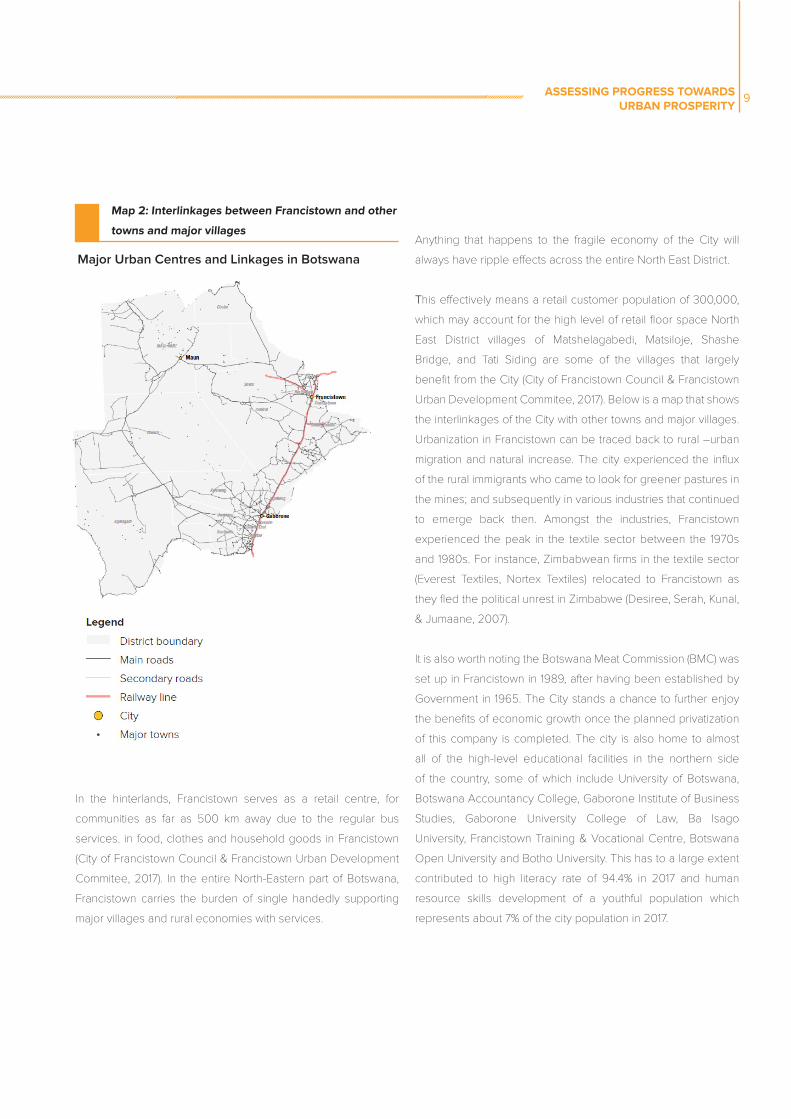
Map 2: Interlinkages between Francistown and other
towns and major villages
In the hinterlands, Francistown serves as a retail centre, for
communities as far as 500 km away due to the regular bus
services. in food, clothes and household goods in Francistown
(City of Francistown Council & Francistown Urban Development
Commitee, 2017). In the entire North-Eastern part of Botswana,
Francistown carries the burden of single handedly supporting
major villages and rural economies with services.
Major Urban Centres and Linkages in Botswana
Anything that happens to the fragile economy of the City will
always have ripple effects across the entire North East District.
This effectively means a retail customer population of 300,000,
which may account for the high level of retail floor space North
East District villages of Matshelagabedi, Matsiloje, Shashe
Bridge, and Tati Siding are some of the villages that largely
benefit from the City (City of Francistown Council & Francistown
Urban Development Commitee, 2017). Below is a map that shows
the interlinkages of the City with other towns and major villages.
Urbanization in Francistown can be traced back to rural –urban
migration and natural increase. The city experienced the influx
of the rural immigrants who came to look for greener pastures in
the mines; and subsequently in various industries that continued
to emerge back then. Amongst the industries, Francistown
experienced the peak in the textile sector between the 1970s
and 1980s. For instance, Zimbabwean firms in the textile sector
(Everest Textiles, Nortex Textiles) relocated to Francistown as
they fled the political unrest in Zimbabwe (Desiree, Serah, Kunal,
& Jumaane, 2007).
It is also worth noting the Botswana Meat Commission (BMC) was
set up in Francistown in 1989, after having been established by
Government in 1965. The City stands a chance to further enjoy
the benefits of economic growth once the planned privatization
of this company is completed. The city is also home to almost
all of the high-level educational facilities in the northern side
of the country, some of which include University of Botswana,
Botswana Accountancy College, Gaborone Institute of Business
Studies, Gaborone University College of Law, Ba Isago
University, Francistown Training & Vocational Centre, Botswana
Open University and Botho University. This has to a large extent
contributed to high literacy rate of 94.4% in 2017 and human
resource skills development of a youthful population which
represents about 7% of the city population in 2017.
10ASSESSING PROGRESS TOWARDS URBAN PROSPERITY
ASSESSING PROGRESS TOWARDS URBAN PROSPERITY
11
The presence of these institutions contributes to the influx of
young population to the city. This therefore means increased
demand for provision of accommodation, creation of employment,
recreation and sports facilities.
1.3.5 The trend of Urban Growth and Existing Spatial PlansThe City of Francistown is the oldest town in Botswana, having
been initially developed as a small mining settlement in 1866
following the discovery of gold deposits. In 1911, the first major
subdivision of land was carried out for the establishment of a
township in what is today the City of Francistown, and this still
comprises the city’s central residential and business area.The
residential and business area is about 60 hectares in extent
and is laid out on a grid street pattern immediately to the east of
the rail line. The subsequent growth of the City in the period up
to the time of independence in 1966 was characterized by the
establishment of the Government Camp between the rail lines
and the Ntshe River.
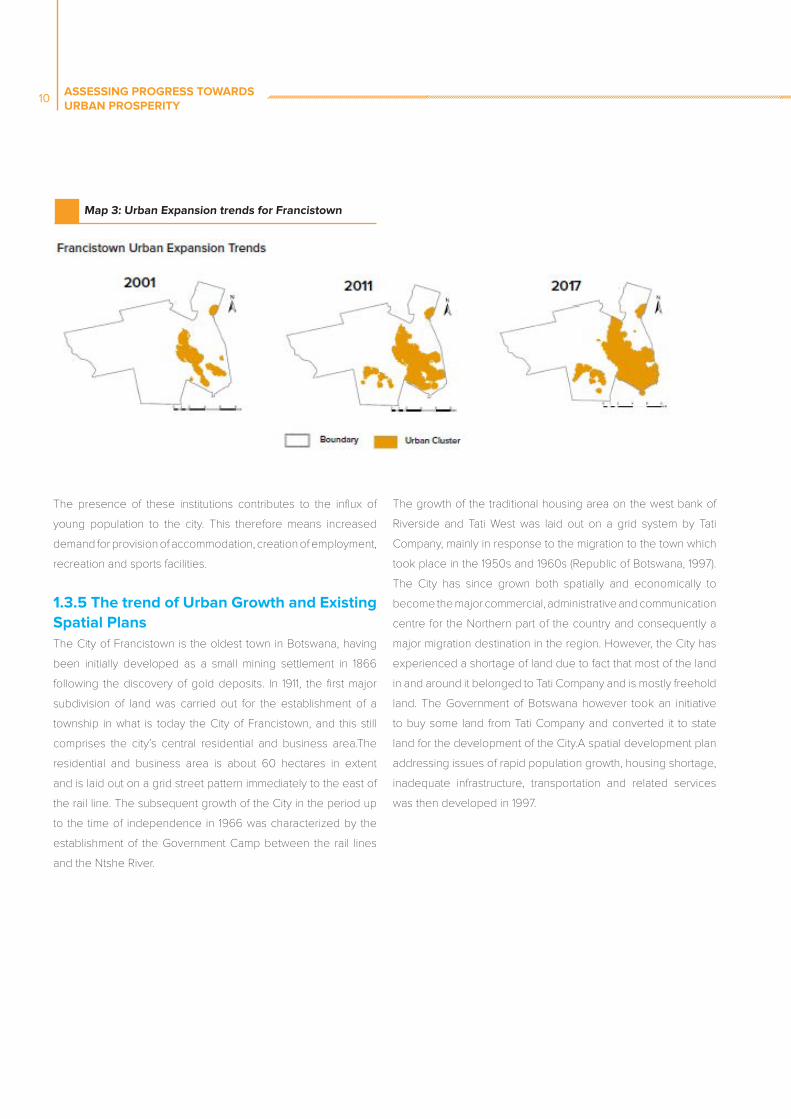
Map 3: Urban Expansion trends for Francistown
The growth of the traditional housing area on the west bank of
Riverside and Tati West was laid out on a grid system by Tati
Company, mainly in response to the migration to the town which
took place in the 1950s and 1960s (Republic of Botswana, 1997).
The City has since grown both spatially and economically to
become the major commercial, administrative and communication
centre for the Northern part of the country and consequently a
major migration destination in the region. However, the City has
experienced a shortage of land due to fact that most of the land
in and around it belonged to Tati Company and is mostly freehold
land. The Government of Botswana however took an initiative
to buy some land from Tati Company and converted it to state
land for the development of the City.A spatial development plan
addressing issues of rapid population growth, housing shortage,
inadequate infrastructure, transportation and related services
was then developed in 1997.
10ASSESSING PROGRESS TOWARDS URBAN PROSPERITY
ASSESSING PROGRESS TOWARDS URBAN PROSPERITY
11
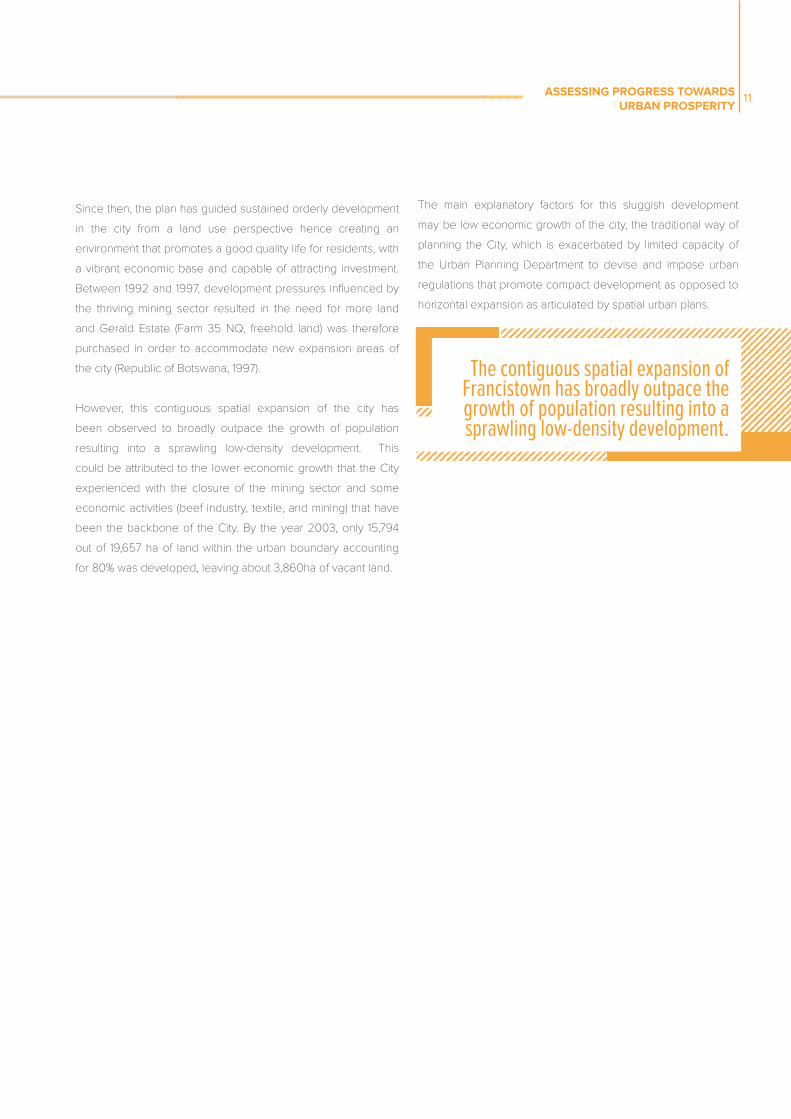
The contiguous spatial expansion of Francistown has broadly outpace the growth of population resulting into a sprawling low-density development.
Since then, the plan has guided sustained orderly development
in the city from a land use perspective hence creating an
environment that promotes a good quality life for residents, with
a vibrant economic base and capable of attracting investment.
Between 1992 and 1997, development pressures influenced by
the thriving mining sector resulted in the need for more land
and Gerald Estate (Farm 35 NQ, freehold land) was therefore
purchased in order to accommodate new expansion areas of
the city (Republic of Botswana, 1997).
However, this contiguous spatial expansion of the city has
been observed to broadly outpace the growth of population
resulting into a sprawling low-density development. This
could be attributed to the lower economic growth that the City
experienced with the closure of the mining sector and some
economic activities (beef industry, textile, and mining) that have
been the backbone of the City. By the year 2003, only 15,794
out of 19,657 ha of land within the urban boundary accounting
for 80% was developed, leaving about 3,860ha of vacant land.
The main explanatory factors for this sluggish development
may be low economic growth of the city, the traditional way of
planning the City, which is exacerbated by limited capacity of
the Urban Planning Department to devise and impose urban
regulations that promote compact development as opposed to
horizontal expansion as articulated by spatial urban plans.
CHAPTER 2 ASSESSING PROGRESS TOWARDS URBAN PROSPERITY
12 13
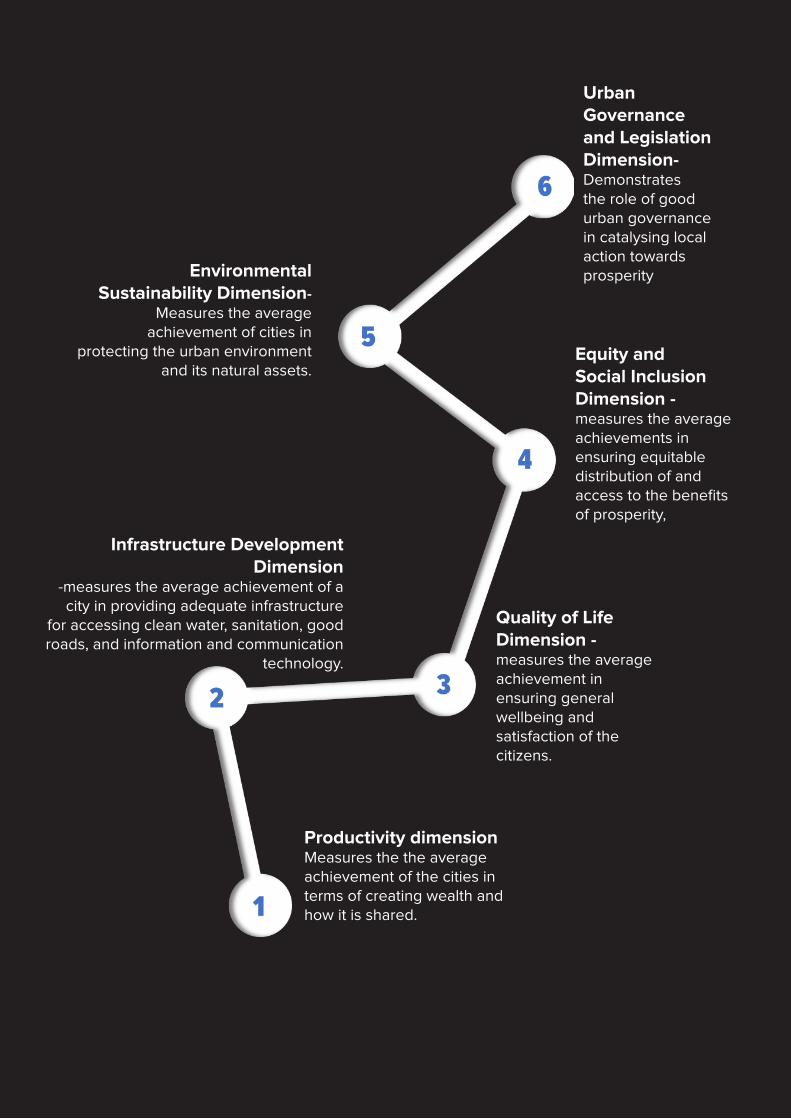
Productivity dimension Measures the the average achievement of the cities in terms of creating wealth and how it is shared.
Infrastructure Development Dimension
-measures the average achievement of a city in providing adequate infrastructure
for accessing clean water, sanitation, good roads, and information and communication
technology.
Quality of Life Dimension -measures the average achievement in ensuring general wellbeing and satisfaction of the citizens.
Equity and Social Inclusion Dimension - measures the average achievements in ensuring equitable distribution of and access to the benefits of prosperity,
Environmental Sustainability Dimension-
Measures the average achievement of cities in
protecting the urban environment and its natural assets.
Urban Governance and Legislation Dimension-Demonstrates the role of good urban governance in catalysing local action towards prosperity
CHAPTER 2 ASSESSING PROGRESS TOWARDS URBAN PROSPERITY
12 13
Chapter 2: Applying The City Prosperity Index In Francistown2.1 Overview of the City Prosperity Index (CPI)
The City Prosperity Index (CPI) is a composite index used to
measure the overall performance of cities based on six key
dimensions: a) productivity, b) infrastructure development, c)
quality of life, d) equity and social inclusion, e) environmental
sustainability and f ) governance and legislation. The index, which
is computed using city level data measures how cities create
and distribute socio-economic benefits and prosperity. The level
of prosperity of a city is measured through the extent to which
the city has achieved all these six dimensions of prosperity.
CPI offers a platform for urban data collection and evidence-
based decision making. As a data platform, CPI has 72 indicators
which helps in identifying dimensions that are performing well
or poorly so that appropriate corrective measures can be put in
place. The Index not only builds on the use of existing data and
information from various sources such as household surveys,
censuses, policy documents, and other databases, but also
contributes to the development of local and national databases
with new sets of information from sources such as geospatial
analysis and community generated data (UN-HABITAT, 2012).
Given that the indicators have different measurement units and
scales, they must be standardized using various approaches
in order to enable the computation of the composite index.
This standardisation transforms a variable from its original
measurement unit into a dimensionless measure that ranges
between 0 and 100, but also considers the fact that there is a
direct relationship between each indicator and the CPI (UN-
HABITAT, 2012).
Below is a summary of what is measured in each dimension.
Productivity dimension measures the average achievements
of the cities in terms of creating wealth and how it is shared.
It also measures cities’ contribution to economic growth and
development, generation of income, provision of decent
jobs and equal opportunities for all.
Infrastructure Development Dimension measures the
average achievement of a city in providing adequate
infrastructure for accessing clean water, sanitation, good
roads, and information and communication technology.
These are essential in improving living standards and
enhancing productivity, mobility and connectivity.
Quality of Life Dimension measures the cities’ average
achievement in ensuring general wellbeing and satisfaction
of the citizens.
Equity and Social Inclusion Dimension measures the cities’
average achievements in ensuring equitable distribution
of the benefits of prosperity, reduction of poverty and the
incidence of slums, protection of rights of minority and
vulnerable groups, gender equality, and equal participation
in the social, economic, political and cultural spheres.
Environmental Sustainability Dimension measures the
average achievement of cities in protecting the urban
environment and its natural assets. This should be done
simultaneously while ensuring growth, pursuing energy
efficiency, reducing pressure on natural resources and
reducing environmental losses through creative and
environment-enhancing solutions.
Urban Governance and Legislation Dimension has
the purpose of demonstrating the role of good urban
governance in catalysing local action towards prosperity,
including the capacity to regulate the urbanisation process.
CHAPTER 2 ASSESSING PROGRESS TOWARDS URBAN PROSPERITY
14 15
The CPI is constructed incrementally as follows:
The Basic City Prosperity Index which is useful for cities that
want to compare their level of development and overall
performance with other cities in the regional and global
arena. The Basic City Prosperity Index uses a set
of commonly available indicators that exist amongst all
cities, acting as a platform for regional/global benchmarking
and for comparison purposes.
The Extended City Prosperity Index: This index is a more
advanced version of the basic model. Its main function is
the integration of more indicators that are not commonly
available in all cities, but which are of specific contextual
relevance to them. Cross-city comparability is thus not the
primary objective of the extended CPI. This Index allows for
a detailed political and technical dialogue that is essential
for the development of evidence-informed public policies
(UN-HABITAT, 2019).
The Contextual City Prosperity Index: This index represents
the most advanced and complete stage of the process.
In addition to the basic and extended indicators, a certain
number of indicators capturing the policies and actions
implemented in the city are measured. As such, the
contextual index contributes to assessing the performance
of the city, through monitoring the impact of local initiatives
and projects that are needed to implement the city’s vision
in order to achieve shared prosperity and sustainable
development.
In practical terms, for the calculation of the CPI, each dimension
is made up of a series of sub-dimensions, which in turn include
many variables/indicators that contribute to the calculation of the
specific index.
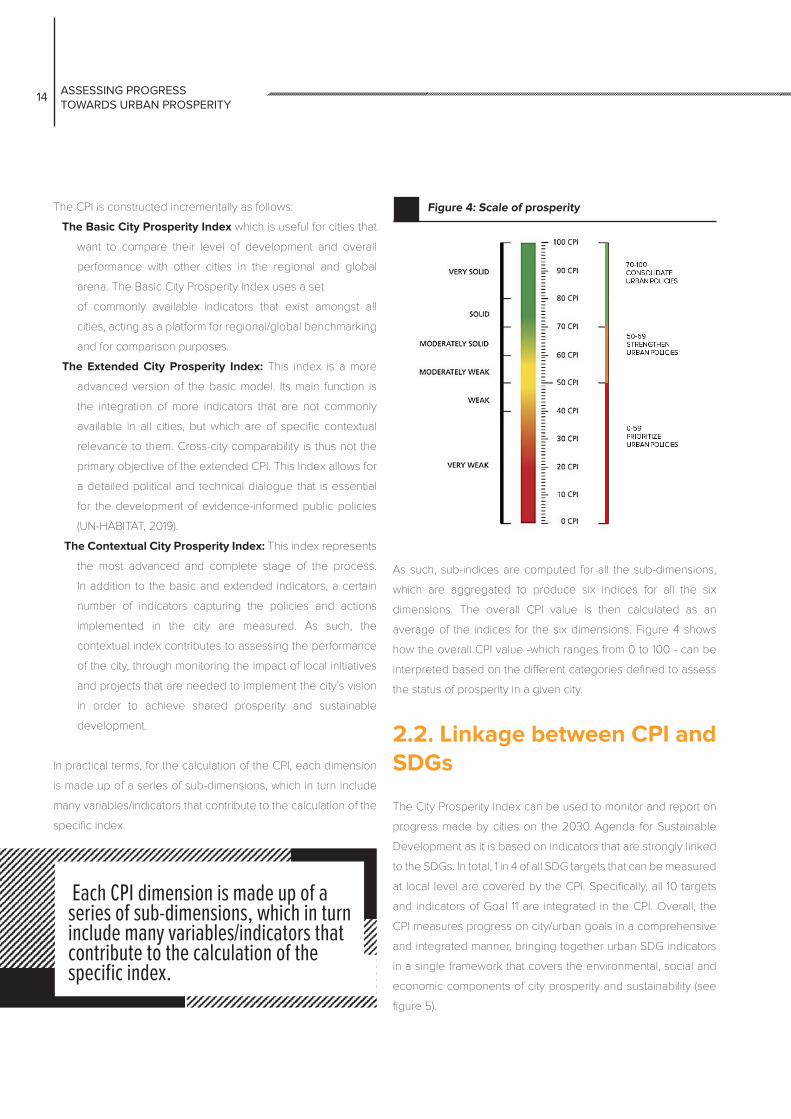
As such, sub-indices are computed for all the sub-dimensions,
which are aggregated to produce six indices for all the six
dimensions. The overall CPI value is then calculated as an
average of the indices for the six dimensions. Figure 4 shows
how the overall CPI value -which ranges from 0 to 100 - can be
interpreted based on the different categories defined to assess
the status of prosperity in a given city.
2.2. Linkage between CPI and SDGs
The City Prosperity Index can be used to monitor and report on
progress made by cities on the 2030 Agenda for Sustainable
Development as it is based on indicators that are strongly linked
to the SDGs. In total, 1 in 4 of all SDG targets that can be measured
at local level are covered by the CPI. Specifically, all 10 targets
and indicators of Goal 11 are integrated in the CPI. Overall, the
CPI measures progress on city/urban goals in a comprehensive
and integrated manner, bringing together urban SDG indicators
in a single framework that covers the environmental, social and
economic components of city prosperity and sustainability (see
figure 5).
Figure 4: Scale of prosperity
Each CPI dimension is made up of a series of sub-dimensions, which in turn include many variables/indicators that contribute to the calculation of the specific index.
CHAPTER 2 ASSESSING PROGRESS TOWARDS URBAN PROSPERITY
14 15
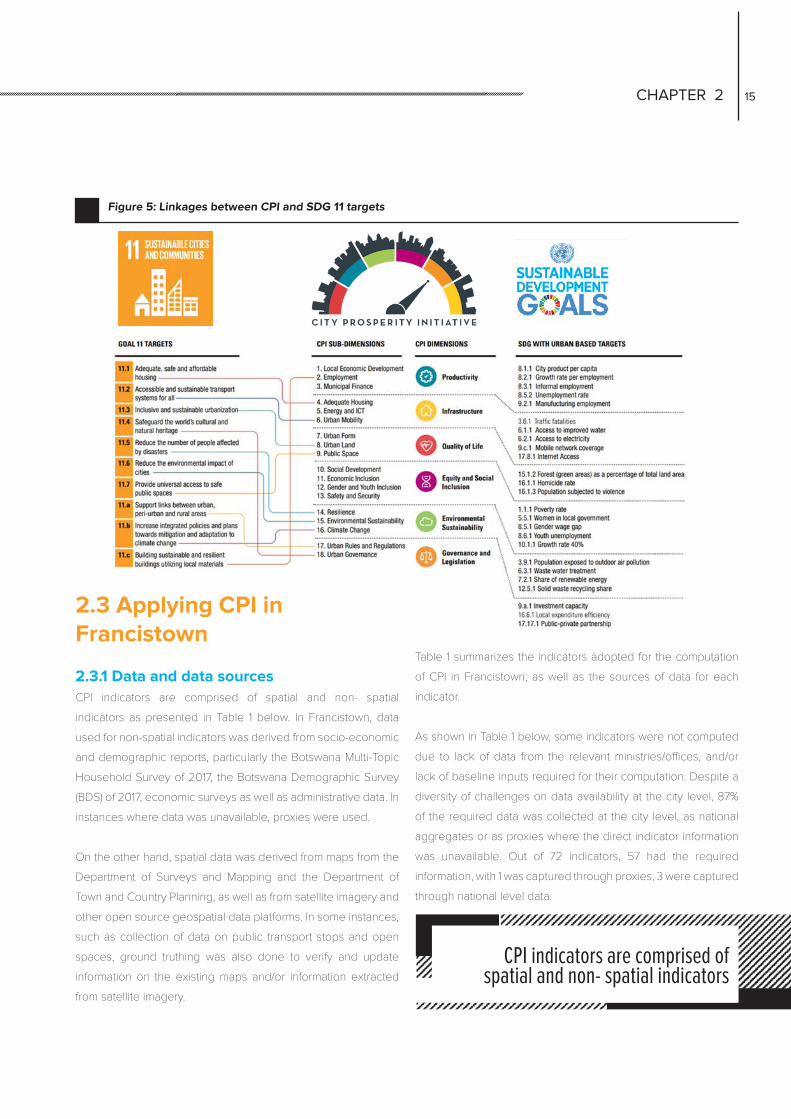
Figure 5: Linkages between CPI and SDG 11 targets
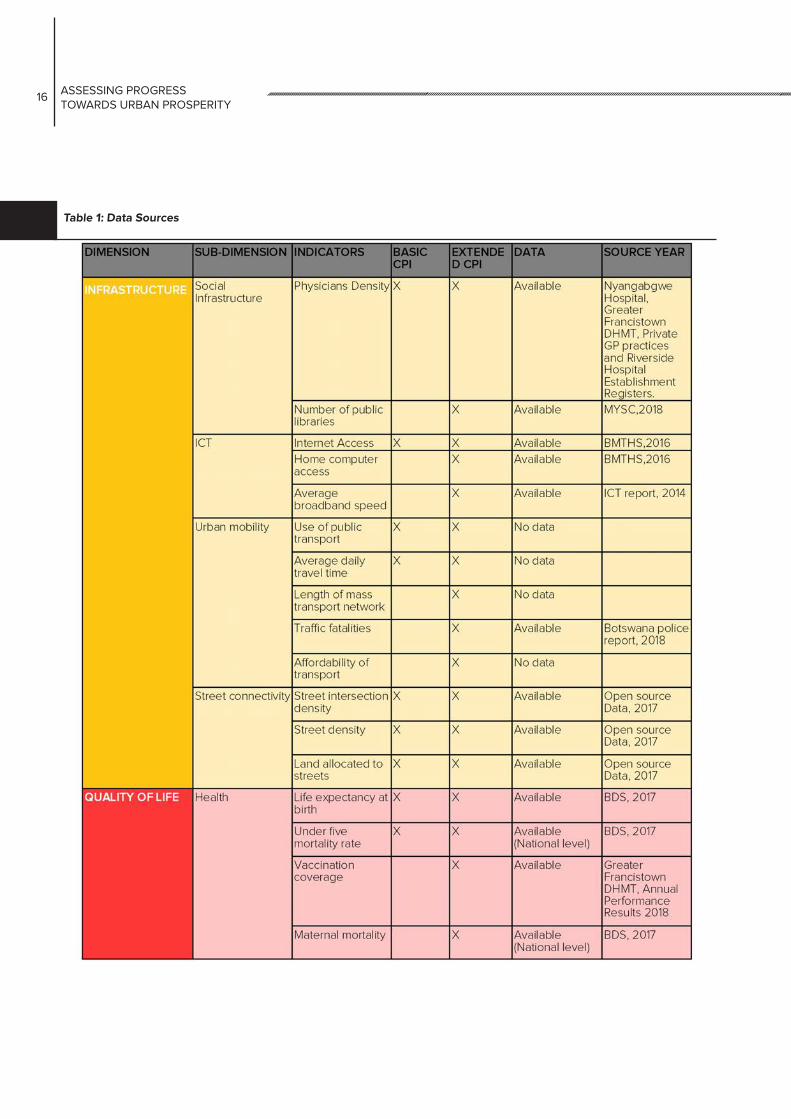
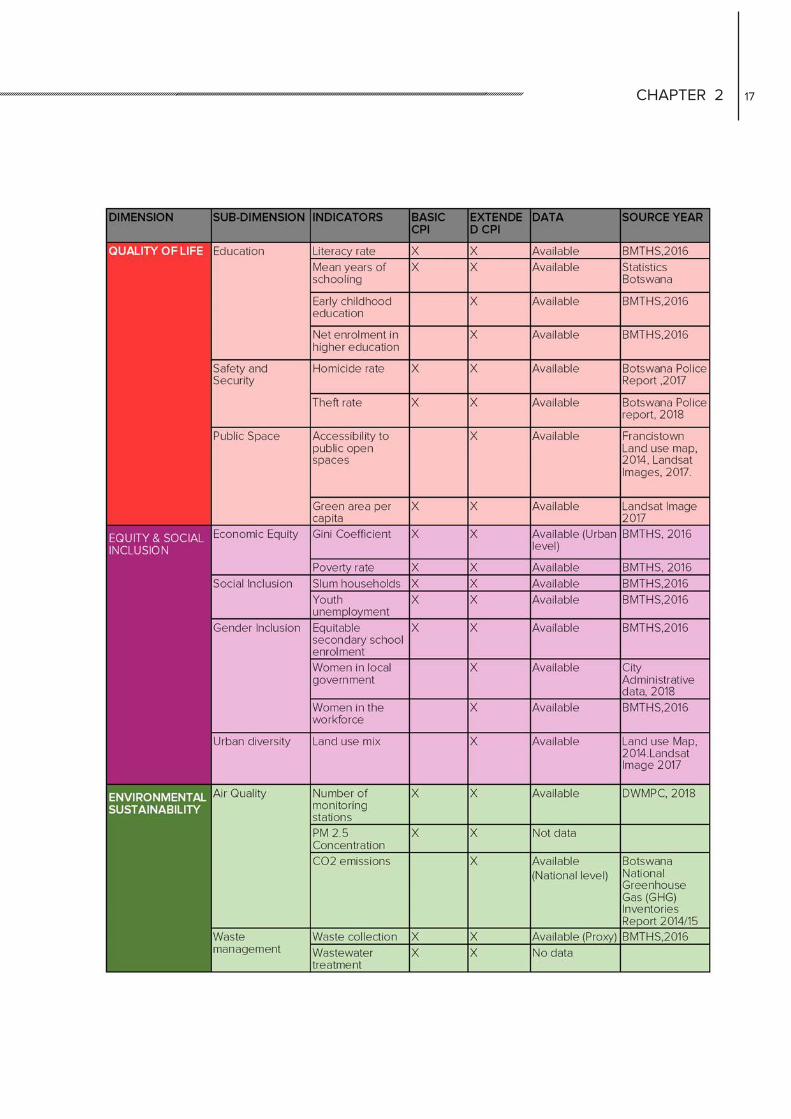
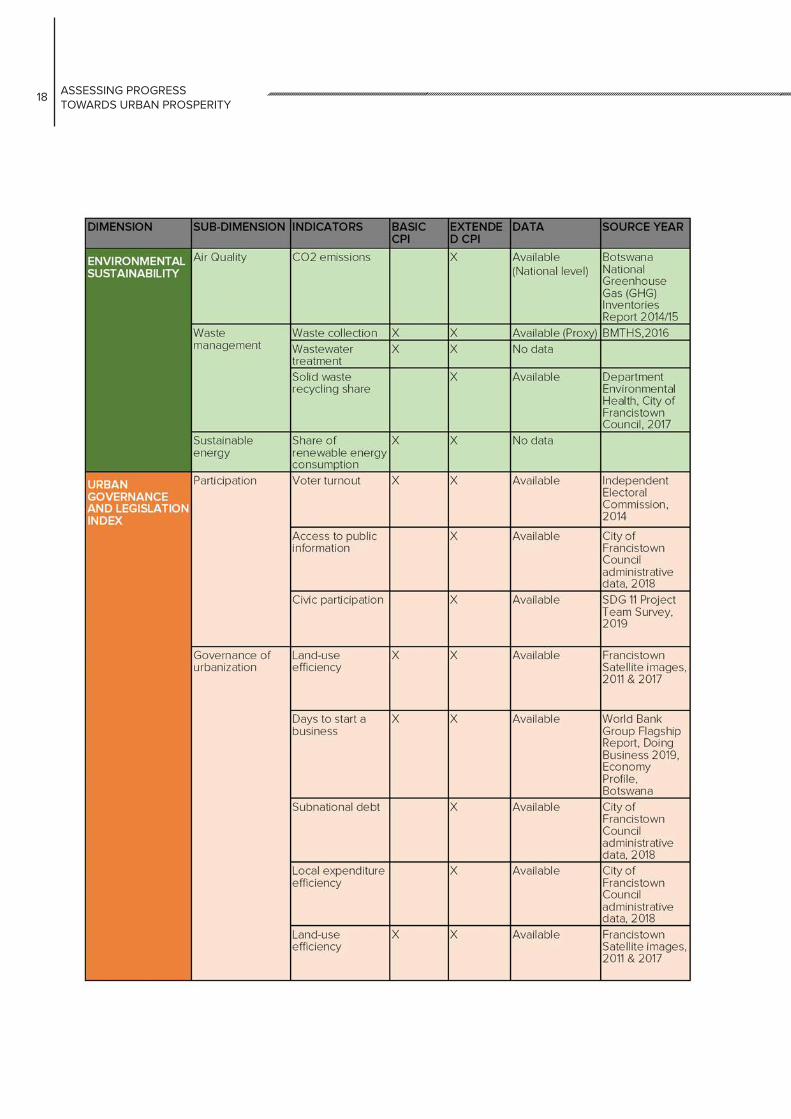
Table 1 summarizes the indicators adopted for the computation
of CPI in Francistown, as well as the sources of data for each
indicator.
As shown in Table 1 below, some indicators were not computed
due to lack of data from the relevant ministries/offices, and/or
lack of baseline inputs required for their computation. Despite a
diversity of challenges on data availability at the city level, 87%
of the required data was collected at the city level, as national
aggregates or as proxies where the direct indicator information
was unavailable. Out of 72 indicators, 57 had the required
information, with 1 was captured through proxies, 3 were captured
through national level data.
2.3 Applying CPI in Francistown
2.3.1 Data and data sourcesCPI indicators are comprised of spatial and non- spatial
indicators as presented in Table 1 below. In Francistown, data
used for non-spatial indicators was derived from socio-economic
and demographic reports, particularly the Botswana Multi-Topic
Household Survey of 2017, the Botswana Demographic Survey
(BDS) of 2017, economic surveys as well as administrative data. In
instances where data was unavailable, proxies were used.
On the other hand, spatial data was derived from maps from the
Department of Surveys and Mapping and the Department of
Town and Country Planning, as well as from satellite imagery and
other open source geospatial data platforms. In some instances,
such as collection of data on public transport stops and open
spaces, ground truthing was also done to verify and update
information on the existing maps and/or information extracted
from satellite imagery.
CPI indicators are comprised of spatial and non- spatial indicators
CHAPTER 2 ASSESSING PROGRESS TOWARDS URBAN PROSPERITY
16 17
Table 1: Data Sources
CHAPTER 2 ASSESSING PROGRESS TOWARDS URBAN PROSPERITY
16 17
CHAPTER 2 ASSESSING PROGRESS TOWARDS URBAN PROSPERITY
18 19
CHAPTER 2 ASSESSING PROGRESS TOWARDS URBAN PROSPERITY
18 19
2.3.2 Data challengesThe following challenges were encountered during data
collection:
a) Unavailability of data on some indicators which include
use of public transport, average daily travel time, and
affordability of transport.
b) Some indicators have partial or no data at all and proxies
had to be used in their computation. These include solid
waste collection where data on households with regular
access to solid waste collection was used and wastewater
treatment where an assumption that the total water
distributed equals the total water discharged as waste. In
some instances, there was no data at the city level hence
national or data or for urban areas was used, e.g. Gini
coefficient and carbon dioxide emissions.
e) Lack of Spatial Analyst and Network Analyst licenses
which are integral to the computation hence part of the
analyses was conducted with the assistance of spatial data
team at UN-Habitat, Nairobi.
f) Difficulties in accessing public data from various
stakeholders.
2.4 Findings and Interpretation of the CPI for Francistown
This section assesses the prosperity of Francistown using and
interpreting the CPI results.
Data Challenges: - Unavailability of Data at city level- Inaccessibility of Data - Inappropriate data storage methods
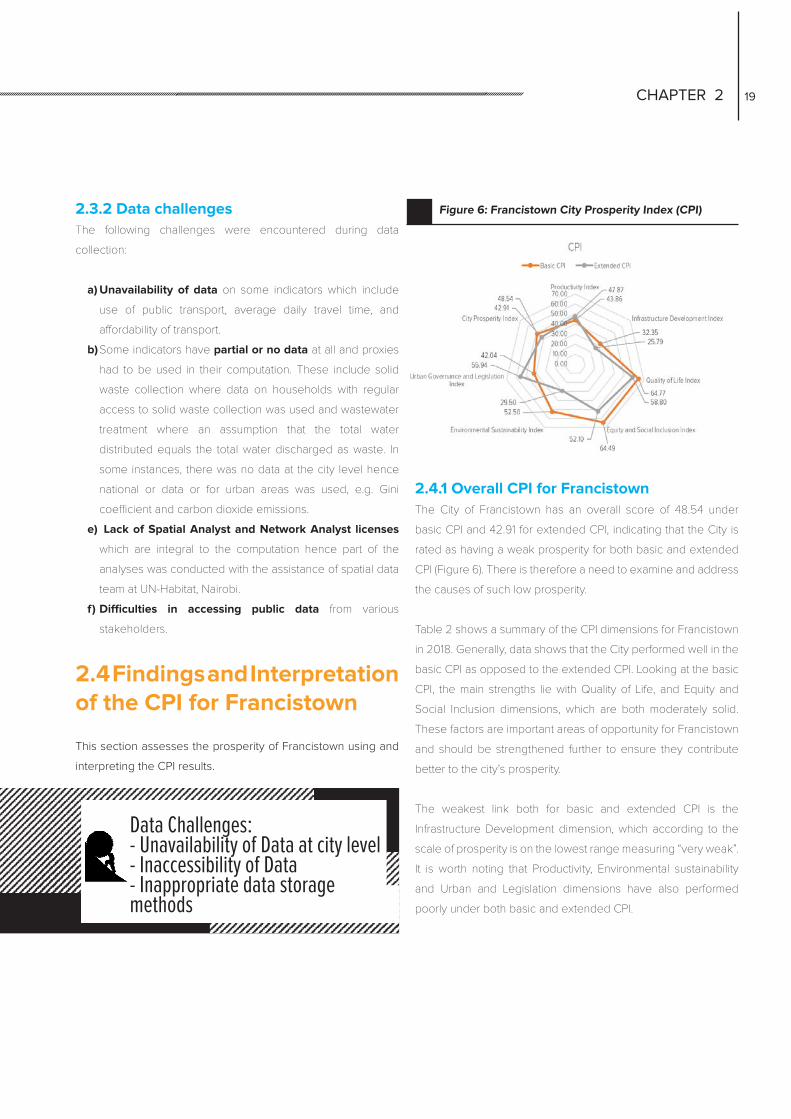
2.4.1 Overall CPI for FrancistownThe City of Francistown has an overall score of 48.54 under
basic CPI and 42.91 for extended CPI, indicating that the City is
rated as having a weak prosperity for both basic and extended
CPI (Figure 6). There is therefore a need to examine and address
the causes of such low prosperity.
Table 2 shows a summary of the CPI dimensions for Francistown
in 2018. Generally, data shows that the City performed well in the
basic CPI as opposed to the extended CPI. Looking at the basic
CPI, the main strengths lie with Quality of Life, and Equity and
Social Inclusion dimensions, which are both moderately solid.
These factors are important areas of opportunity for Francistown
and should be strengthened further to ensure they contribute
better to the city’s prosperity.
The weakest link both for basic and extended CPI is the
Infrastructure Development dimension, which according to the
scale of prosperity is on the lowest range measuring “very weak”.
It is worth noting that Productivity, Environmental sustainability
and Urban and Legislation dimensions have also performed
poorly under both basic and extended CPI.
Figure 6: Francistown City Prosperity Index (CPI)
CHAPTER 2 ASSESSING PROGRESS TOWARDS URBAN PROSPERITY
20 21
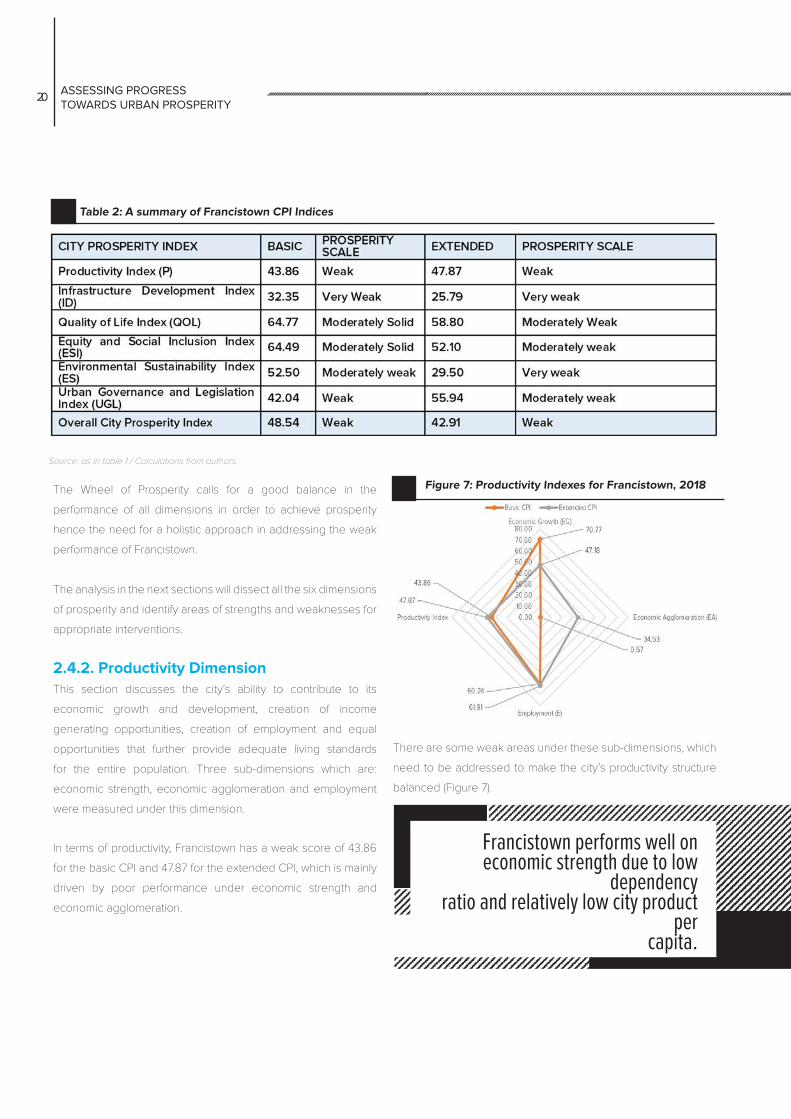
Table 2: A summary of Francistown CPI Indices
Source: as in table 1 / Calculations from authors.
The Wheel of Prosperity calls for a good balance in the
performance of all dimensions in order to achieve prosperity
hence the need for a holistic approach in addressing the weak
performance of Francistown.
The analysis in the next sections will dissect all the six dimensions
of prosperity and identify areas of strengths and weaknesses for
appropriate interventions.
2.4.2. Productivity DimensionThis section discusses the city’s ability to contribute to its
economic growth and development, creation of income
generating opportunities, creation of employment and equal
opportunities that further provide adequate living standards
for the entire population. Three sub-dimensions which are:
economic strength, economic agglomeration and employment
were measured under this dimension.
In terms of productivity, Francistown has a weak score of 43.86
for the basic CPI and 47.87 for the extended CPI, which is mainly
driven by poor performance under economic strength and
economic agglomeration.
Francistown performs well on economic strength due to low
dependencyratio and relatively low city product
percapita.
Figure 7: Productivity Indexes for Francistown, 2018
There are some weak areas under these sub-dimensions, which
need to be addressed to make the city’s productivity structure
balanced (Figure 7).
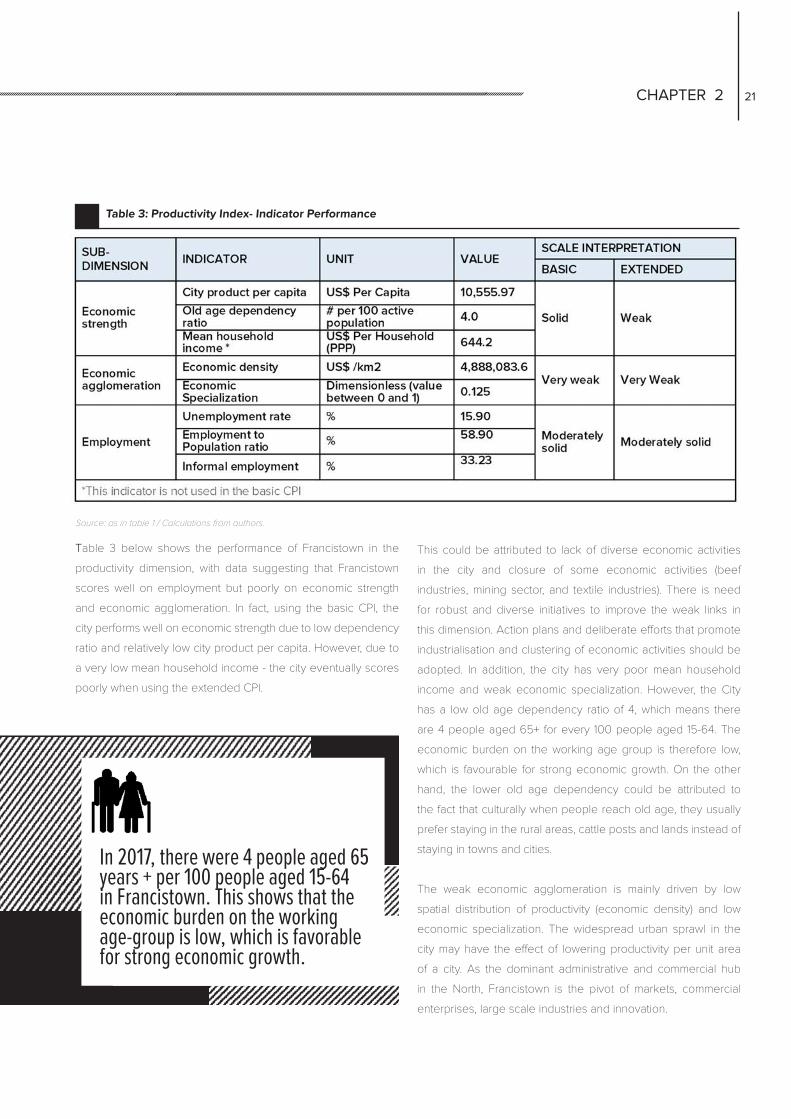
CHAPTER 2 ASSESSING PROGRESS TOWARDS URBAN PROSPERITY
20 21
This could be attributed to lack of diverse economic activities
in the city and closure of some economic activities (beef
industries, mining sector, and textile industries). There is need
for robust and diverse initiatives to improve the weak links in
this dimension. Action plans and deliberate efforts that promote
industrialisation and clustering of economic activities should be
adopted. In addition, the city has very poor mean household
income and weak economic specialization. However, the City
has a low old age dependency ratio of 4, which means there
are 4 people aged 65+ for every 100 people aged 15-64. The
economic burden on the working age group is therefore low,
which is favourable for strong economic growth. On the other
hand, the lower old age dependency could be attributed to
the fact that culturally when people reach old age, they usually
prefer staying in the rural areas, cattle posts and lands instead of
staying in towns and cities.
The weak economic agglomeration is mainly driven by low
spatial distribution of productivity (economic density) and low
economic specialization. The widespread urban sprawl in the
city may have the effect of lowering productivity per unit area
of a city. As the dominant administrative and commercial hub
in the North, Francistown is the pivot of markets, commercial
enterprises, large scale industries and innovation.
In 2017, there were 4 people aged 65 years + per 100 people aged 15-64 in Francistown. This shows that the economic burden on the working age-group is low, which is favorable for strong economic growth.
Table 3: Productivity Index- Indicator Performance
Source: as in table 1 / Calculations from authors.
Table 3 below shows the performance of Francistown in the
productivity dimension, with data suggesting that Francistown
scores well on employment but poorly on economic strength
and economic agglomeration. In fact, using the basic CPI, the
city performs well on economic strength due to low dependency
ratio and relatively low city product per capita. However, due to
a very low mean household income - the city eventually scores
poorly when using the extended CPI.
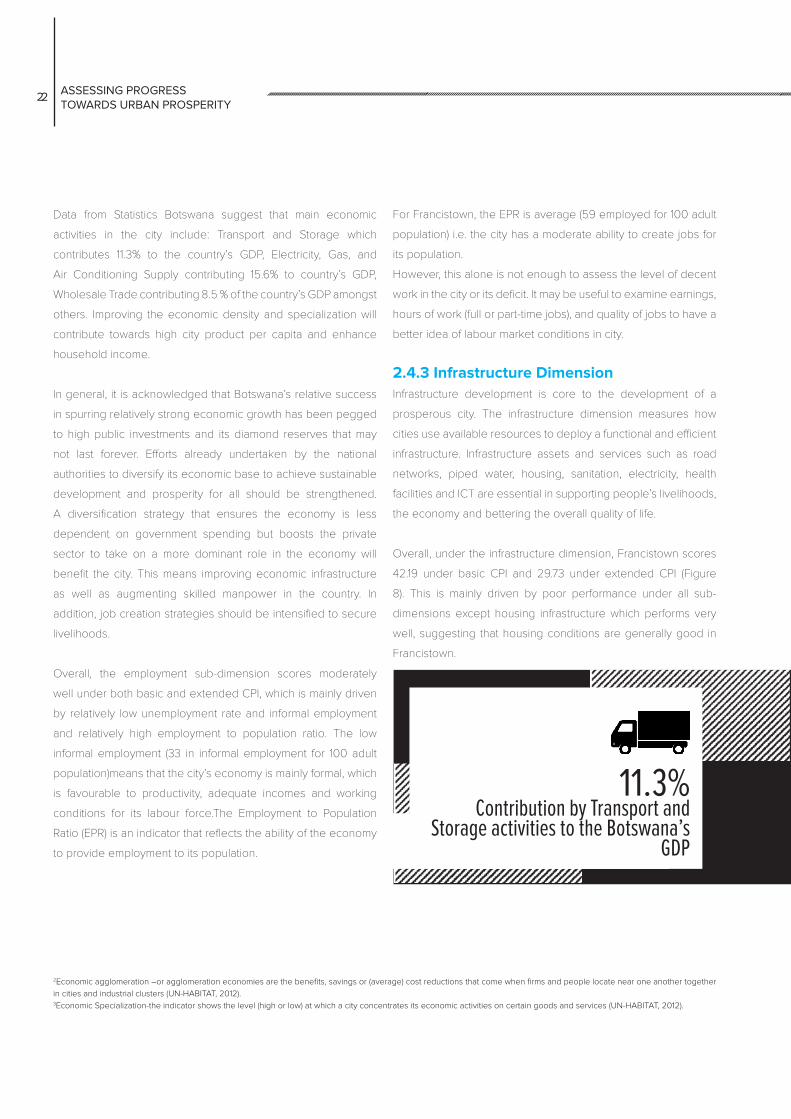
CHAPTER 2 ASSESSING PROGRESS TOWARDS URBAN PROSPERITY
22 23
Data from Statistics Botswana suggest that main economic
activities in the city include: Transport and Storage which
contributes 11.3% to the country’s GDP, Electricity, Gas, and
Air Conditioning Supply contributing 15.6% to country’s GDP,
Wholesale Trade contributing 8.5 % of the country’s GDP amongst
others. Improving the economic density and specialization will
contribute towards high city product per capita and enhance
household income.
In general, it is acknowledged that Botswana’s relative success
in spurring relatively strong economic growth has been pegged
to high public investments and its diamond reserves that may
not last forever. Efforts already undertaken by the national
authorities to diversify its economic base to achieve sustainable
development and prosperity for all should be strengthened.
A diversification strategy that ensures the economy is less
dependent on government spending but boosts the private
sector to take on a more dominant role in the economy will
benefit the city. This means improving economic infrastructure
as well as augmenting skilled manpower in the country. In
addition, job creation strategies should be intensified to secure
livelihoods.
Overall, the employment sub-dimension scores moderately
well under both basic and extended CPI, which is mainly driven
by relatively low unemployment rate and informal employment
and relatively high employment to population ratio. The low
informal employment (33 in informal employment for 100 adult
population)means that the city’s economy is mainly formal, which
is favourable to productivity, adequate incomes and working
conditions for its labour force.The Employment to Population
Ratio (EPR) is an indicator that reflects the ability of the economy
to provide employment to its population.
2Economic agglomeration –or agglomeration economies are the benefits, savings or (average) cost reductions that come when firms and people locate near one another together
in cities and industrial clusters (UN-HABITAT, 2012).3Economic Specialization-the indicator shows the level (high or low) at which a city concentrates its economic activities on certain goods and services (UN-HABITAT, 2012).
11.3% Contribution by Transport and
Storage activities to the Botswana’s GDP
For Francistown, the EPR is average (59 employed for 100 adult
population) i.e. the city has a moderate ability to create jobs for
its population.
However, this alone is not enough to assess the level of decent
work in the city or its deficit. It may be useful to examine earnings,
hours of work (full or part-time jobs), and quality of jobs to have a
better idea of labour market conditions in city.
2.4.3 Infrastructure DimensionInfrastructure development is core to the development of a
prosperous city. The infrastructure dimension measures how
cities use available resources to deploy a functional and efficient
infrastructure. Infrastructure assets and services such as road
networks, piped water, housing, sanitation, electricity, health
facilities and ICT are essential in supporting people’s livelihoods,
the economy and bettering the overall quality of life.
Overall, under the infrastructure dimension, Francistown scores
42.19 under basic CPI and 29.73 under extended CPI (Figure
8). This is mainly driven by poor performance under all sub-
dimensions except housing infrastructure which performs very
well, suggesting that housing conditions are generally good in
Francistown.
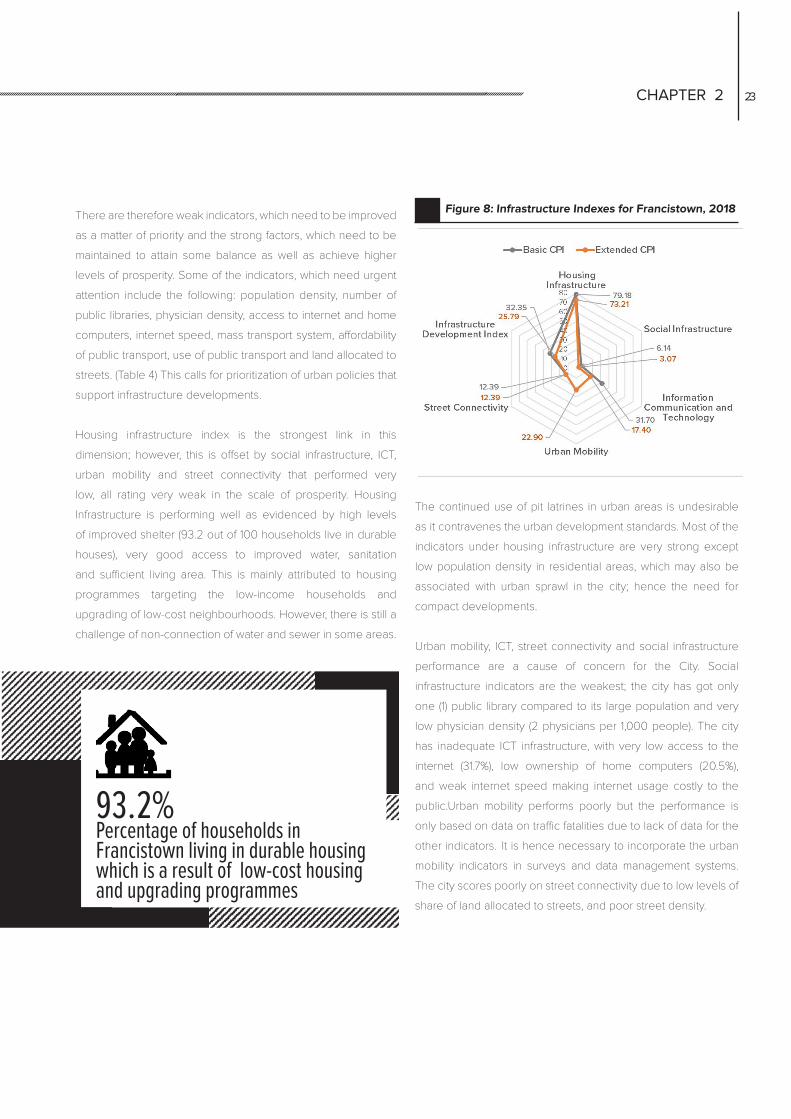
CHAPTER 2 ASSESSING PROGRESS TOWARDS URBAN PROSPERITY
22 23
Figure 8: Infrastructure Indexes for Francistown, 2018
The continued use of pit latrines in urban areas is undesirable
as it contravenes the urban development standards. Most of the
indicators under housing infrastructure are very strong except
low population density in residential areas, which may also be
associated with urban sprawl in the city; hence the need for
compact developments.
Urban mobility, ICT, street connectivity and social infrastructure
performance are a cause of concern for the City. Social
infrastructure indicators are the weakest; the city has got only
one (1) public library compared to its large population and very
low physician density (2 physicians per 1,000 people). The city
has inadequate ICT infrastructure, with very low access to the
internet (31.7%), low ownership of home computers (20.5%),
and weak internet speed making internet usage costly to the
public.Urban mobility performs poorly but the performance is
only based on data on traffic fatalities due to lack of data for the
other indicators. It is hence necessary to incorporate the urban
mobility indicators in surveys and data management systems.
The city scores poorly on street connectivity due to low levels of
share of land allocated to streets, and poor street density.
There are therefore weak indicators, which need to be improved
as a matter of priority and the strong factors, which need to be
maintained to attain some balance as well as achieve higher
levels of prosperity. Some of the indicators, which need urgent
attention include the following: population density, number of
public libraries, physician density, access to internet and home
computers, internet speed, mass transport system, affordability
of public transport, use of public transport and land allocated to
streets. (Table 4) This calls for prioritization of urban policies that
support infrastructure developments.
Housing infrastructure index is the strongest link in this
dimension; however, this is offset by social infrastructure, ICT,
urban mobility and street connectivity that performed very
low, all rating very weak in the scale of prosperity. Housing
Infrastructure is performing well as evidenced by high levels
of improved shelter (93.2 out of 100 households live in durable
houses), very good access to improved water, sanitation
and sufficient living area. This is mainly attributed to housing
programmes targeting the low-income households and
upgrading of low-cost neighbourhoods. However, there is still a
challenge of non-connection of water and sewer in some areas.
93.2%Percentage of households in Francistown living in durable housing which is a result of low-cost housing and upgrading programmes
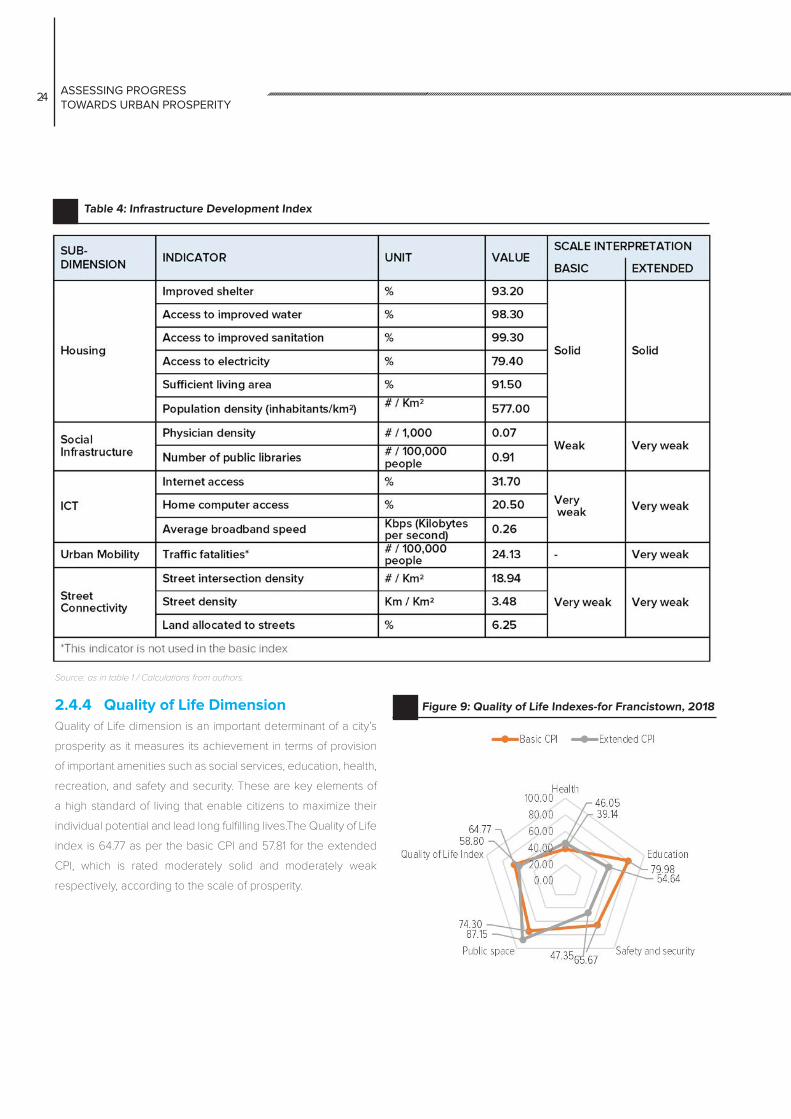
CHAPTER 2 ASSESSING PROGRESS TOWARDS URBAN PROSPERITY
24 25
Table 4: Infrastructure Development Index
Source: as in table 1 / Calculations from authors.
2.4.4 Quality of Life DimensionQuality of Life dimension is an important determinant of a city’s
prosperity as it measures its achievement in terms of provision
of important amenities such as social services, education, health,
recreation, and safety and security. These are key elements of
a high standard of living that enable citizens to maximize their
individual potential and lead long fulfilling lives.The Quality of Life
index is 64.77 as per the basic CPI and 57.81 for the extended
CPI, which is rated moderately solid and moderately weak
respectively, according to the scale of prosperity.
Figure 9: Quality of Life Indexes-for Francistown, 2018
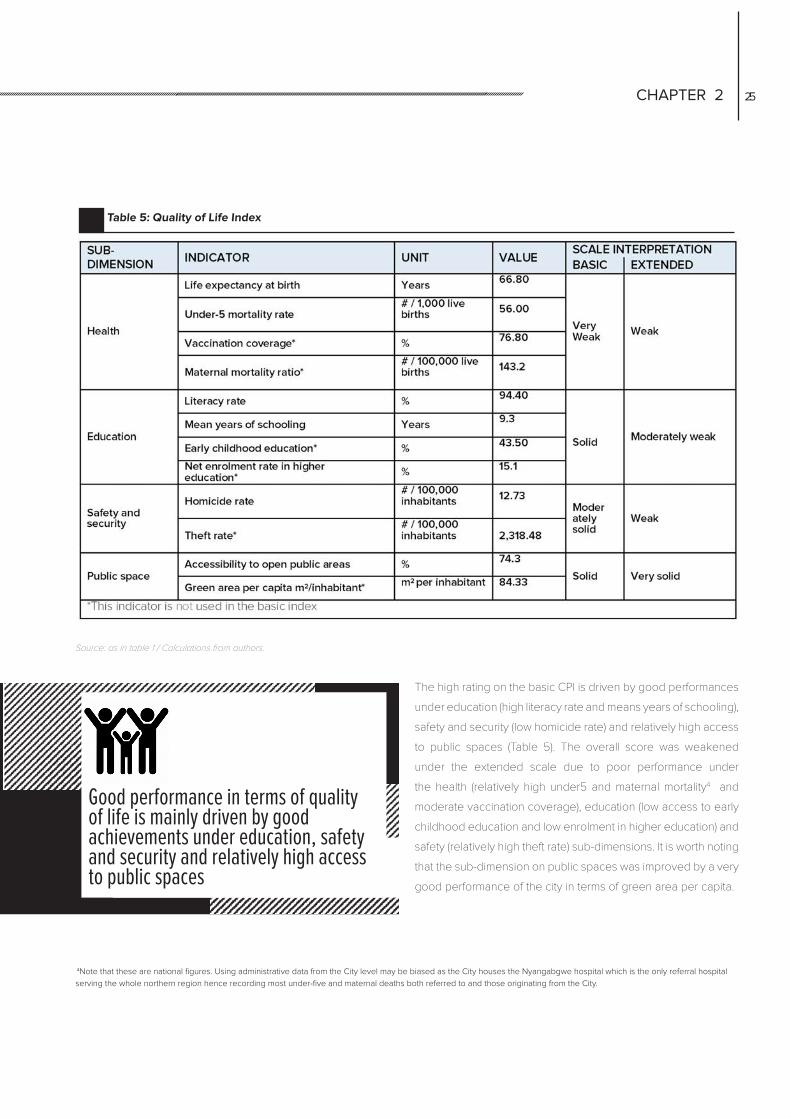
CHAPTER 2 ASSESSING PROGRESS TOWARDS URBAN PROSPERITY
24 25
Table 5: Quality of Life Index
Source: as in table 1 / Calculations from authors.
4Note that these are national figures. Using administrative data from the City level may be biased as the City houses the Nyangabgwe hospital which is the only referral hospital
serving the whole northern region hence recording most under-five and maternal deaths both referred to and those originating from the City.
The high rating on the basic CPI is driven by good performances
under education (high literacy rate and means years of schooling),
safety and security (low homicide rate) and relatively high access
to public spaces (Table 5). The overall score was weakened
under the extended scale due to poor performance under
the health (relatively high under5 and maternal mortality4 and
moderate vaccination coverage), education (low access to early
childhood education and low enrolment in higher education) and
safety (relatively high theft rate) sub-dimensions. It is worth noting
that the sub-dimension on public spaces was improved by a very
good performance of the city in terms of green area per capita.
Good performance in terms of quality of life is mainly driven by good achievements under education, safety and security and relatively high access to public spaces
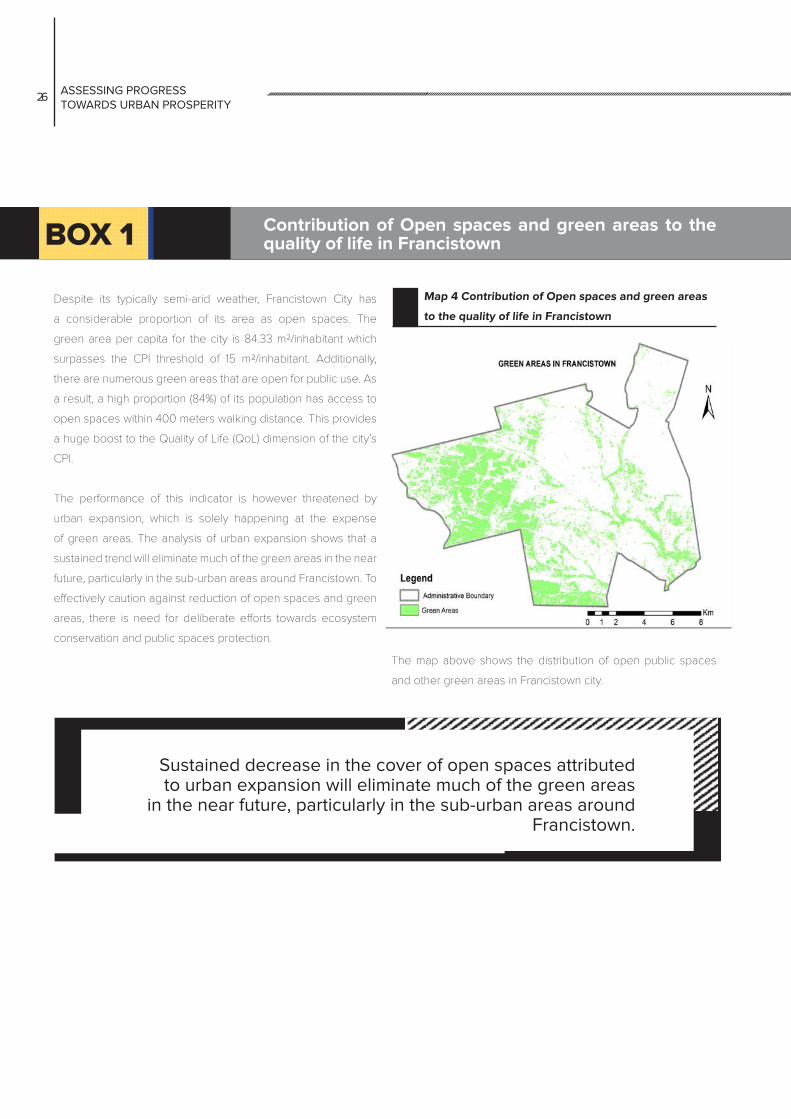
CHAPTER 2 ASSESSING PROGRESS TOWARDS URBAN PROSPERITY
26 27
BOX 1 Contribution of Open spaces and green areas to the quality of life in Francistown
Despite its typically semi-arid weather, Francistown City has
a considerable proportion of its area as open spaces. The
green area per capita for the city is 84.33 m2/inhabitant which
surpasses the CPI threshold of 15 m2/inhabitant. Additionally,
there are numerous green areas that are open for public use. As
a result, a high proportion (84%) of its population has access to
open spaces within 400 meters walking distance. This provides
a huge boost to the Quality of Life (QoL) dimension of the city’s
CPI.
The performance of this indicator is however threatened by
urban expansion, which is solely happening at the expense
of green areas. The analysis of urban expansion shows that a
sustained trend will eliminate much of the green areas in the near
future, particularly in the sub-urban areas around Francistown. To
effectively caution against reduction of open spaces and green
areas, there is need for deliberate efforts towards ecosystem
conservation and public spaces protection.
Map 4 Contribution of Open spaces and green areas
to the quality of life in Francistown
The map above shows the distribution of open public spaces
and other green areas in Francistown city.
Sustained decrease in the cover of open spaces attributed to urban expansion will eliminate much of the green areas
in the near future, particularly in the sub-urban areas around Francistown.
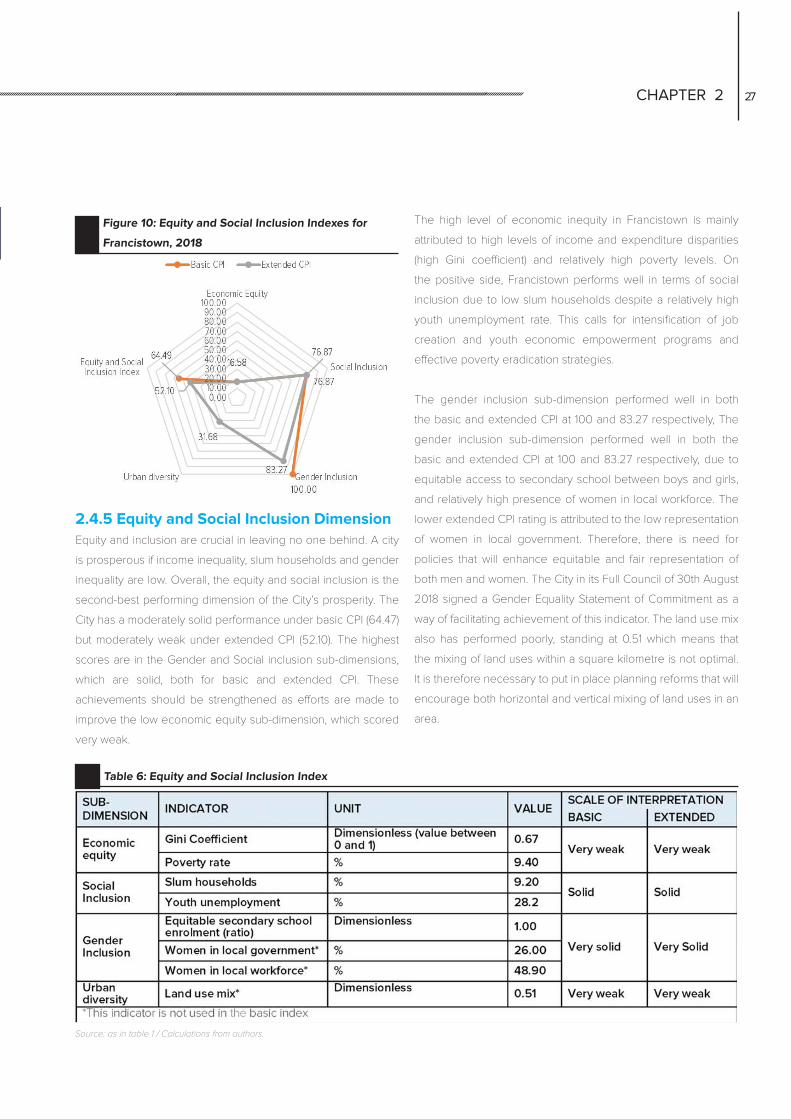
CHAPTER 2 ASSESSING PROGRESS TOWARDS URBAN PROSPERITY
26 27
The high level of economic inequity in Francistown is mainly
attributed to high levels of income and expenditure disparities
(high Gini coefficient) and relatively high poverty levels. On
the positive side, Francistown performs well in terms of social
inclusion due to low slum households despite a relatively high
youth unemployment rate. This calls for intensification of job
creation and youth economic empowerment programs and
effective poverty eradication strategies.
The gender inclusion sub-dimension performed well in both
the basic and extended CPI at 100 and 83.27 respectively, The
gender inclusion sub-dimension performed well in both the
basic and extended CPI at 100 and 83.27 respectively, due to
equitable access to secondary school between boys and girls,
and relatively high presence of women in local workforce. The
lower extended CPI rating is attributed to the low representation
of women in local government. Therefore, there is need for
policies that will enhance equitable and fair representation of
both men and women. The City in its Full Council of 30th August
2018 signed a Gender Equality Statement of Commitment as a
way of facilitating achievement of this indicator. The land use mix
also has performed poorly, standing at 0.51 which means that
the mixing of land uses within a square kilometre is not optimal.
It is therefore necessary to put in place planning reforms that will
encourage both horizontal and vertical mixing of land uses in an
area.
Figure 10: Equity and Social Inclusion Indexes for
Francistown, 2018
Table 6: Equity and Social Inclusion Index
Source: as in table 1 / Calculations from authors.
2.4.5 Equity and Social Inclusion Dimension Equity and inclusion are crucial in leaving no one behind. A city
is prosperous if income inequality, slum households and gender
inequality are low. Overall, the equity and social inclusion is the
second-best performing dimension of the City’s prosperity. The
City has a moderately solid performance under basic CPI (64.47)
but moderately weak under extended CPI (52.10). The highest
scores are in the Gender and Social inclusion sub-dimensions,
which are solid, both for basic and extended CPI. These
achievements should be strengthened as efforts are made to
improve the low economic equity sub-dimension, which scored
very weak.
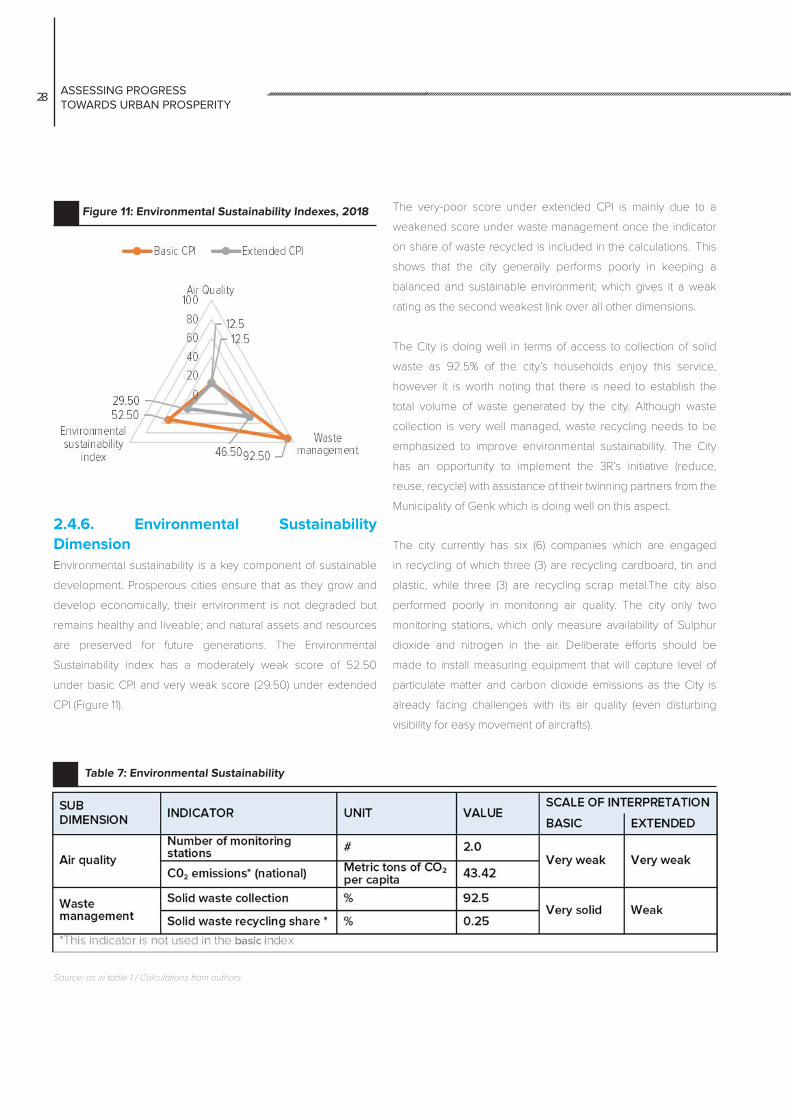
CHAPTER 2 ASSESSING PROGRESS TOWARDS URBAN PROSPERITY
28 29
2.4.6. Environmental Sustainability DimensionEnvironmental sustainability is a key component of sustainable
development. Prosperous cities ensure that as they grow and
develop economically, their environment is not degraded but
remains healthy and liveable; and natural assets and resources
are preserved for future generations. The Environmental
Sustainability index has a moderately weak score of 52.50
under basic CPI and very weak score (29.50) under extended
CPI (Figure 11).
The very-poor score under extended CPI is mainly due to a
weakened score under waste management once the indicator
on share of waste recycled is included in the calculations. This
shows that the city generally performs poorly in keeping a
balanced and sustainable environment; which gives it a weak
rating as the second weakest link over all other dimensions.
The City is doing well in terms of access to collection of solid
waste as 92.5% of the city’s households enjoy this service,
however it is worth noting that there is need to establish the
total volume of waste generated by the city. Although waste
collection is very well managed, waste recycling needs to be
emphasized to improve environmental sustainability. The City
has an opportunity to implement the 3R’s initiative (reduce,
reuse, recycle) with assistance of their twinning partners from the
Municipality of Genk which is doing well on this aspect.
The city currently has six (6) companies which are engaged
in recycling of which three (3) are recycling cardboard, tin and
plastic, while three (3) are recycling scrap metal.The city also
performed poorly in monitoring air quality. The city only two
monitoring stations, which only measure availability of Sulphur
dioxide and nitrogen in the air. Deliberate efforts should be
made to install measuring equipment that will capture level of
particulate matter and carbon dioxide emissions as the City is
already facing challenges with its air quality (even disturbing
visibility for easy movement of aircrafts).
Figure 11: Environmental Sustainability Indexes, 2018
Table 7: Environmental Sustainability
Source: as in table 1 / Calculations from authors.
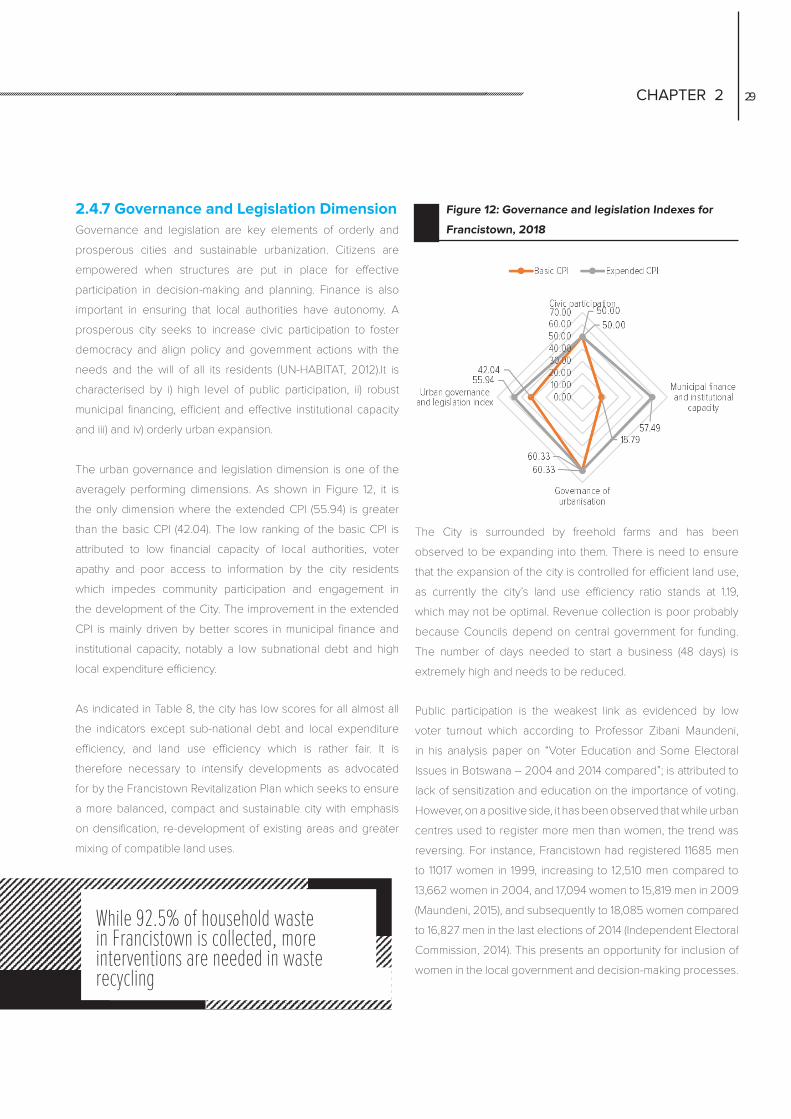
CHAPTER 2 ASSESSING PROGRESS TOWARDS URBAN PROSPERITY
28 29
2.4.7 Governance and Legislation DimensionGovernance and legislation are key elements of orderly and
prosperous cities and sustainable urbanization. Citizens are
empowered when structures are put in place for effective
participation in decision-making and planning. Finance is also
important in ensuring that local authorities have autonomy. A
prosperous city seeks to increase civic participation to foster
democracy and align policy and government actions with the
needs and the will of all its residents (UN-HABITAT, 2012).It is
characterised by i) high level of public participation, ii) robust
municipal financing, efficient and effective institutional capacity
and iii) and iv) orderly urban expansion.
The urban governance and legislation dimension is one of the
averagely performing dimensions. As shown in Figure 12, it is
the only dimension where the extended CPI (55.94) is greater
than the basic CPI (42.04). The low ranking of the basic CPI is
attributed to low financial capacity of local authorities, voter
apathy and poor access to information by the city residents
which impedes community participation and engagement in
the development of the City. The improvement in the extended
CPI is mainly driven by better scores in municipal finance and
institutional capacity, notably a low subnational debt and high
local expenditure efficiency.
As indicated in Table 8, the city has low scores for all almost all
the indicators except sub-national debt and local expenditure
efficiency, and land use efficiency which is rather fair. It is
therefore necessary to intensify developments as advocated
for by the Francistown Revitalization Plan which seeks to ensure
a more balanced, compact and sustainable city with emphasis
on densification, re-development of existing areas and greater
mixing of compatible land uses.
Figure 12: Governance and legislation Indexes for
Francistown, 2018
The City is surrounded by freehold farms and has been
observed to be expanding into them. There is need to ensure
that the expansion of the city is controlled for efficient land use,
as currently the city’s land use efficiency ratio stands at 1.19,
which may not be optimal. Revenue collection is poor probably
because Councils depend on central government for funding.
The number of days needed to start a business (48 days) is
extremely high and needs to be reduced.
Public participation is the weakest link as evidenced by low
voter turnout which according to Professor Zibani Maundeni,
in his analysis paper on “Voter Education and Some Electoral
Issues in Botswana – 2004 and 2014 compared”; is attributed to
lack of sensitization and education on the importance of voting.
However, on a positive side, it has been observed that while urban
centres used to register more men than women, the trend was
reversing. For instance, Francistown had registered 11685 men
to 11017 women in 1999, increasing to 12,510 men compared to
13,662 women in 2004, and 17,094 women to 15,819 men in 2009
(Maundeni, 2015), and subsequently to 18,085 women compared
to 16,827 men in the last elections of 2014 (Independent Electoral
Commission, 2014). This presents an opportunity for inclusion of
women in the local government and decision-making processes.
While 92.5% of household waste in Francistown is collected, more interventions are needed in waste recycling
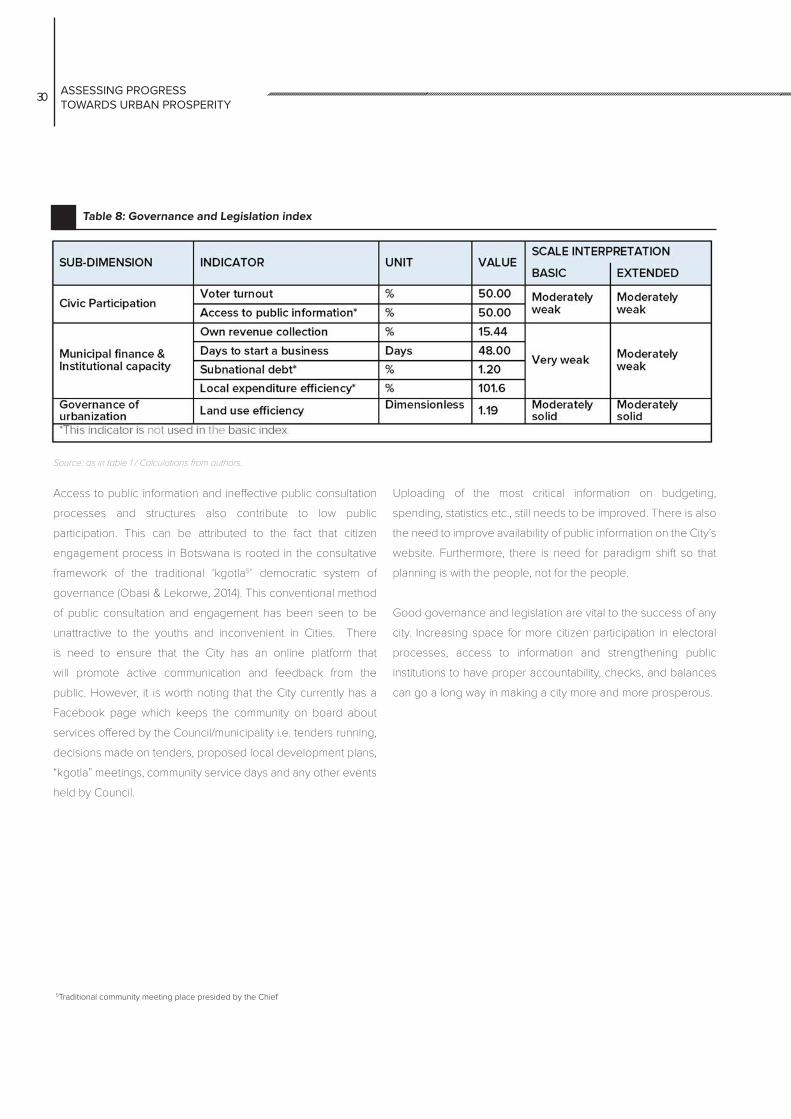
CHAPTER 2 ASSESSING PROGRESS TOWARDS URBAN PROSPERITY
30 31
Table 8: Governance and Legislation index
Source: as in table 1 / Calculations from authors.
Access to public information and ineffective public consultation
processes and structures also contribute to low public
participation. This can be attributed to the fact that citizen
engagement process in Botswana is rooted in the consultative
framework of the traditional ‘kgotla5’ democratic system of
governance (Obasi & Lekorwe, 2014). This conventional method
of public consultation and engagement has been seen to be
unattractive to the youths and inconvenient in Cities. There
is need to ensure that the City has an online platform that
will promote active communication and feedback from the
public. However, it is worth noting that the City currently has a
Facebook page which keeps the community on board about
services offered by the Council/municipality i.e. tenders running,
decisions made on tenders, proposed local development plans,
“kgotla” meetings, community service days and any other events
held by Council.
5Traditional community meeting place presided by the Chief
Uploading of the most critical information on budgeting,
spending, statistics etc., still needs to be improved. There is also
the need to improve availability of public information on the City’s
website. Furthermore, there is need for paradigm shift so that
planning is with the people, not for the people.
Good governance and legislation are vital to the success of any
city. Increasing space for more citizen participation in electoral
processes, access to information and strengthening public
institutions to have proper accountability, checks, and balances
can go a long way in making a city more and more prosperous.
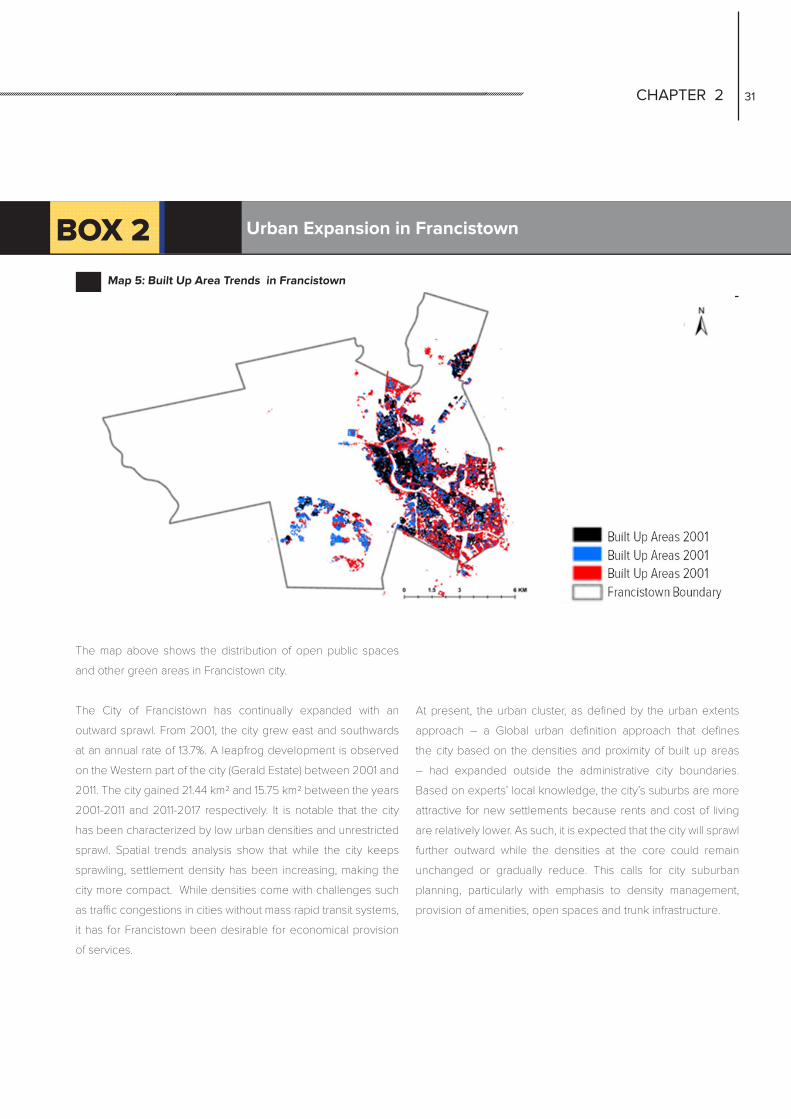
CHAPTER 2 ASSESSING PROGRESS TOWARDS URBAN PROSPERITY
30 31
At present, the urban cluster, as defined by the urban extents
approach – a Global urban definition approach that defines
the city based on the densities and proximity of built up areas
– had expanded outside the administrative city boundaries.
Based on experts’ local knowledge, the city’s suburbs are more
attractive for new settlements because rents and cost of living
are relatively lower. As such, it is expected that the city will sprawl
further outward while the densities at the core could remain
unchanged or gradually reduce. This calls for city suburban
planning, particularly with emphasis to density management,
provision of amenities, open spaces and trunk infrastructure.
Map 5: Built Up Area Trends in Francistown
The map above shows the distribution of open public spaces
and other green areas in Francistown city.
The City of Francistown has continually expanded with an
outward sprawl. From 2001, the city grew east and southwards
at an annual rate of 13.7%. A leapfrog development is observed
on the Western part of the city (Gerald Estate) between 2001 and
2011. The city gained 21.44 km2 and 15.75 km2 between the years
2001-2011 and 2011-2017 respectively. It is notable that the city
has been characterized by low urban densities and unrestricted
sprawl. Spatial trends analysis show that while the city keeps
sprawling, settlement density has been increasing, making the
city more compact. While densities come with challenges such
as traffic congestions in cities without mass rapid transit systems,
it has for Francistown been desirable for economical provision
of services.
BOX 2 Urban Expansion in Francistown

CHAPTER 3 ASSESSING PROGRESS TOWARDS URBAN PROSPERITY
32 33ASSESSING PROGRESS TOWARDS URBAN PROSPERITY32
CHAPTER 3 ASSESSING PROGRESS TOWARDS URBAN PROSPERITY
32 33
Chapter 3: Conclusions And RecommendationsThe application of the CPI in Francistown reveals prevailing
conditions using about 57 indicators, which constitute invaluable
data to planners, policy makers and any stakeholders involved
in decision-making, both for Francistown local authority and the
national government. In general, different trends were observed
with the city performing well in some dimensions and poorly in
others.
Overall, the city of Francistown has moderately weak prosperity
that needs to be strengthened, with large discrepancies
among the six dimensions of Urban Prosperity and therefore
an unbalanced urban development process, probably due to
institutional and structural weaknesses. Quality of Life and Equity
& Social Inclusion are moderately solid for basic CPI; however, it is
important to strengthen these dimensions as they are moderately
weak for extended CPI. On the other hand, there is need to
rethink policies on infrastructure, environmental sustainability
and urban governance. To effectively manage the urbanization
process and bring change in all sectors, there is need to develop
a National Urban Policy to harness opportunities created by
cities. In addition, there is need to develop local monitoring with
national reporting systems, including governance mechanisms
of data production, use, and dissemination. There is an urgent
need to establish the national urban observatory.
The key findings and recommendations under each dimension
are as follows:
3.1 ProductivityThe productivity dimension has low average value due to
weak economic agglomeration as evidenced by low economic
density and specialization. This can be attributed to low
industrialization and low production of goods and services. There
is need to strengthen implementation of the available economic
diversification strategies. Improving productivity is a critical
starting point to provide residents with decent income for their
basic needs and adequate living standards. The implementation
of the Francistown investment strategy called Vision 2022: An
Investment Centre of Vibrancy, which is aimed at diversifying
economic activities in the city should be strengthened. The
Strategy recognizes the value proposition for Francistown to be
transformed into a Mining,
Transport and Logistical Hub and it took into consideration the
strategic location of Francistown as a gateway to other African
Countries (Zimbabwe, Zambia, Angola, Namibia, Democratic
Republic of Congo, etc.) in its northern border and the northern
side of the country. The Strategy further took into consideration
the existing and planned infrastructure which includes the
airport, the road linking to the Kazungula Bridge and the railway
connecting to Mosestse-Kazungula rail project.This will open
opportunities to other economic activities hence reduce reliance
on minerals extraction, textile and beef industries, which have
proven not to be sustainable in the long run as some ended
closing up due to insufficient market and economic instability.
The city of Francistown has moderately weak prosperity that needs to be strengthened, with large discrepancies among the six dimensions of Urban Prosperity
CHAPTER 3 ASSESSING PROGRESS TOWARDS URBAN PROSPERITY
34 35
Over and above that, the City has been a pilot for the Local
Economic Development (LED) project, harnessing the
opportunities for implementation of this model will contribute to
economic diversification.
Francistown, being a dominant administrative and commercial
hub in the northern region, is a base for most of higher institutions
of learning and specialized health facilities in the northern side
of the country. This presents an opportunity for higher levels of
education and lower incidences of chronic illness which in turn
would contribute to higher labour productivity. The City also has
a youthful population which can be leveraged for development
of innovation centres.
3.2 Infrastructure DevelopmentInfrastructure is crucial for the development, functioning and
prosperity of cities. It provides the underlying foundation for
cities to thrive. Physical infrastructure such as road network,
power and communication facilities all enhance urban mobility,
which is essential for economic growth and poverty reduction.
Good infrastructure is vital in making firms more productive and
competitive internationally, and critical to the ability of countries
and cities to reap the benefits of globalization as it is central
to the behind the border agenda, enhances the investment
climate in the city, improves the productivity of workers, and
contributes to the overall attractiveness of the city. Conversely,
poor infrastructure is a major impediment to growth, poverty
reduction and improved standards of living. Inadequate water
and sanitation facilities will lead to deterioration of the urban
environment (Arimah, 2007). As such, the fact that Francistown
performs poorly on this dimension is a major impediment to
prosperity for the city and the country at large.
Francistown has both low street connectivity and poor internet
access, which is a deterrent to increased productivity and
economic growth Given that Francistown is relatively a small city,
improving internet access can open the city to wide opportunities
for investment both locally and internationally. This will hugely
contribute to making Francistown a smart city, with associated
benefits such as high employment opportunities for the youthful
population, improvement of efficiency in production and trading
(e-commerce), and increased connectivity. Francistown should
fully implement the objectives of the Francistown Revitalization
Plan which advocates for improved street connectivity,
permeability and pedestrian movement through interlinked open
spaces. The plan presents a great opportunity for densification
through compact developments.
Although the dimension has performed poorly, it has one of
the strongest factors of prosperity in terms of the Housing
infrastructure which needs to be strengthened and maintained.
There is need to strengthen implementation of housing policies
particularly in low-income areas to achieve durable housing units
with access to clean water and improved sanitation.
There is an urgent need to formulate and implement policies that
promote urban mobility. The implementation of the Botswana
Integrated Transport Plan which seeks to promote access
and utilization of convenient and reliable public should be fast
tracked.
Francistown performs poorly in terms of the infrastructure
dimension which is a major impediment to prosperity for the city
and the country at large.

CHAPTER 3 ASSESSING PROGRESS TOWARDS URBAN PROSPERITY
34 35
3.3 Environmental SustainabilityA prosperous city is one that demonstrates the ability of its
biosphere and human civilization to coexist; engaging in
economic activities and city growth without degrading the
environment. . While Francistown is a green city, it has been
observed to be lacking in terms of its reactiveness in preserving
its environmental quality. The city has inadequate air quality
monitoring station; the City should therefore provide monitoring
stations for PM 2.5 concentration and carbon dioxide emissions.
The city is known to have poor air quality; according to the
Department of Waste Management & Pollution Control in its
May 2019 report; the air is observed to be smoky and cloudy
even disturbing air transportation movement in the City. It is
recommended to upgrade the existing monitoring stations to
measure all criteria pollutants and establish new stations in the
city’s outskirts.
The city is also performing poorly in solid waste recycling
share and there is a need to develop the City Waste Collection
Management Strategy which will address both collection and the
3R’s initiative (reduce, re-use, re-cycle). The City of Francistown
could leverage on its twinning opportunities with the City of
Genk in Belgium which is well ahead in terms of solid waste
management and recycling initiatives. It is recommended that
the City introduces reclaiming of some waste but also community
incentives for recycling of waste, and public education on waste
management. Despite the City experiencing sunny weather
almost throughout the year, it has not adequately exploited the
opportunity of using solar as a source of energy.
It is therefore of paramount importance to implement the
objectives of the Renewable Energy Strategy and the Off-Grid
Solar Action Plan to ensure uptake of the renewable to the
energy mix meets the targeted 15% country target by 2030.
3.4 Quality of LifeA prosperous city provides social services for enhanced
living standards and provides the things that are needed for a
good quality of life like safety and security, education, health,
and recreation, enabling the population to live healthier,
productive and fulfilling lives. The quality of life dimension
is the best performing dimension in the city compared to the
other dimensions. However, it has potential health care and
educational issues since the Under-Five Mortality Rate and
Maternal Mortality Ratio are relatively high. In general, compared
to countries with similar level of development such as Mauritius
and Thailand, Botswana is not doing well in terms of survival of
children and their mothers.
However, there is hope in addressing maternal health as
Botswana at the ICPD256 Summit in Nairobi, made a commitment
to reduce preventable maternal deaths to less than 70/100
000 by 2030. Another commitment made was with regards
to strengthening access to family planning information and
services, quality, affordable and safe modern contraceptives at
all service delivery points through capacity building for health
care workers on integration of family planning services from
350 to 1000 by 2030. To achieve this, there is need to rethink
interventions and strategies to improve maternal and child
health including South-to-South learning.
Although literacy rate is high, access to Early Childhood
Education and net enrolment in higher education is very low.
6 2019 marked the 25th anniversary of the International Conference on Population and Development where UN member states made commitments to addressing various
population and development challenges at the Nairobi Summit in Kenya,
CHAPTER 3 ASSESSING PROGRESS TOWARDS URBAN PROSPERITY
36 37
The low ECE rate is mainly attributed to unaffordability of the
programme as it is mainly offered by private institutions. To
increase access to early childhood education, there is need to
intensify the implementation of the early childhood enrolment
programme which was introduced in public schools in 2017.
In addition, net enrolment in higher education needs to be
improved.
Safety and security significantly contribute to a city’s economy
including promotion of a 24-hour economy. The city is still
experiencing high rates of theft (2318 thefts per 100,000
inhabitants in the year 2017/18), which is a concern both for
investors and the city’s inhabitants. Data from UNODC show that
in 2014, the rate of thefts for the whole country was 1336 per
100,000 population which is much lower that what is observed
in Francistown in 2017 (UNODC, 2019). The introduction of
the safer city concept whereby the city is under 24-hour
surveillance through cameras could assist in containing theft
incidences. There is need to ensure that safety considerations
are integrated from planning stage through implementation of
the UN-Habitat Safer Cities Programme. Furthermore, the review
and implementation of the economic empowerment and poverty
eradication strategies are important prerequisites of improved
urban safety.
There is also need to improve health systems so as to
improve physician density, which is undermined by relocation
of physicians to other areas, especially outside the country
in pursuit of better opportunities. This could be done through
introduction of competitive remuneration packages to attract
and retain the physicians in the city. It is also recommended that
public libraries be increased to promote the culture of reading
and hence contribute to the vision of a knowledge-based
society. In addition, there is need to improve connectivity and
permeability of the city’s urban space to promote safe pedestrian
movement and reduce traffic congestion. In addition, there is
need to improve connectivity and permeability of the city’s urban
space to promote safe pedestrian movement and reduce traffic
congestion.
The quality of life dimension is the best performing dimension
in the city compared to the other dimensions despite the challenges
of under-five and maternal mortality, low higher education net enrollment
and high rates of theft.
This can be done as part of the ongoing process of redevelopment
and revitalization of the city’s urban form.
3.5 Equity and Social InclusionA prosperous city is one that ensures equitable (re)distribution
of the benefits of prosperity, reduces poverty and the incidence
of slums, protects the rights of minority and vulnerable groups,
enhances gender equality, and ensures equal participation in
the social, economic, political and cultural spheres. Although
this is one of the dimensions where the City of Francistown is
performing well, there are still inequalities in the distribution of
income as evidenced by high Gini-coefficient (0.67) as well as
high poverty rates. This calls for robust implementation of policies
and programs geared towards poverty eradication and equal
distribution of wealth for the benefit of all inhabitants. It is also
necessary to achieve gender equality in the local government.
The Gender Equality Statement of Commitment Plan of Action
signed in August 2018 should be aggressively implemented.
CHAPTER 3 ASSESSING PROGRESS TOWARDS URBAN PROSPERITY
36 37
participation, therefore fostering alignment of policy and
government actions with the needs and the will of all residents.
Strengthening of local authorities to be autonomous through
the adoption of the Decentralization Policy will also improve
the ability of cities in terms of municipal finance and institutional
capacity. The City is doing fairly well when it comes to land use
efficiency, however there is need to promote the objectives
of the Francistown Revitalization Plan which calls for compact
developments and densification to reduce incidences of urban
sprawl, unnecessary strains on urban service and infrastructure
provision and reduced economies of agglomeration. There is
also a need to intensify implementation of the newly adopted
interventions for reducing time taken for doing business like
the introduction of the online registration by Companies and
Intellectual Property Authority (CIPA).
In summary, the increasing number of urban dwellers in
Botswana provides a great opportunity to achieve sustainable
economic growth and development, if authorities at local and
national levels have access to relevant, timely, accurate and
disaggregated data to inform the design and implementation
of programmes and policies in order to maximize the dispersed
energies and potential of urban centres for the common good
of all. As such, data generated through the application of the CPI
for the city of Francistown is useful to planners, policy makers
and everyone involved in decision-making, both at national and
local Governments. It will enable the city authorities as well as
local and national stakeholders to gauge their performance and
formulate inter-sectoral policy interventions.
However, the availability of data that is aligned to CPI indicators
is a huge challenge. It may be necessary to include all CPI
indicators in the National Monitoring and Evaluation System
(NMES) for continuous monitoring.In addition, there is need to
streamline data collection tools to CPI requirements and develop
a data sharing strategy on urban indicators. In the interim, the CPI
reports will need to be regularly updated, while modalities on
the establishment of the National Urban Observatory are being
finalized.
3.6 Urban Governance and LegislationA city that is characterized by effective urban governance,
transformational leadership, effective policies, laws and
regulation, adequate institutional frameworks which drive own
revenue generation and actively engages its citizens and
private sector in all decision making and city development is
said to be sustainable and prosperous. Despite Botswana being
recognized as a leading democracy in Africa; voter apathy,
limited access to public information and civic participation in
the city’s development including in the planning and budgeting
processes constrains effective engagement and participation.
City managers need to be more responsive to the voices of their
communities and civil society groups. They need to engage in
more participatory urban governance by involving those likely to
be affected by changes in policy or planning.
There is need to improve communication and feedback channels
to adopt non-conventional public participation channels like social
media which have been seen to be the “in thing” in improving
public participation, particularly by the youth, as compared to the
conventional public participation channels like the kgotla.
This calls for investment in efficient and effective internet
connectivity which will always support unlimited public
There are still inequalities in the distribution of income in Francistown as evidenced by high Gini-coefficient (0.67) as well as high poverty rates. This calls for robust implementation of policies and programs geared towards poverty eradication and equal distribution of wealth for the benefit of all inhabitants.
CHAPTER 3 ASSESSING PROGRESS TOWARDS URBAN PROSPERITY
38 39
These developments require a clear institutional and
regulatory framework that will promote data sharing across
sectors. Implementation of the National Spatial plan in terms
of harmonization of administrative boundaries will contribute
tremendously to collection of data on uniform areas of jurisdiction.
Furthermore, although the pilot project has helped improve the
capacity in terms of generating city-level data in the two cities,
there is need to reinforce capacitation and skills transfer through
additional capacity building activities. It is also paramount to set
up a research and/or data unit within the Council that is in-charge
of collecting relevant data and generating evidence to help in
decision-making in Francistown. Finally, the implementation of
these recommendations requires dedicated budget that needs
to be provided for by the relevant authorities.
Francistown is doing fairly well when it comes to land use efficiency,
however there is need to promote the objectives of the Francistown
Revitalization Plan which calls for compact developments and
densification to reduce incidences of urban sprawl, unnecessary strains
on urban service and infrastructure provision and reduced economies of
agglomeration.
CHAPTER 3 ASSESSING PROGRESS TOWARDS URBAN PROSPERITY
38 39
References1. Arimah, B. (2007). Infrastructure as a Catalyst for the Prosperity of African Cities. In Urban Transitions Conference. Shangai:
Elsevier Ltd.
2. City of Francistown Council, & Francistown Urban Development Commitee. (2017). Francistown Urban Development Plan IV
(2017-2023). Francistown.
3. Department of Energy. (2019). Report on the use of Renewable Energy in Botswana. Gaborone: Ministry of Mineral Resources,
Green Technology and Energy Security.
4. Department of Housing. (2014). Habitat III Country Report. Gaborone: Government of Botswana.
5. Department of Town and Country Planning. (2018). Botswana National Spatial Plan, 2036. Gaborone: Ministry of Land Management,
Water and Sanitation Services.
6. Desiree, A., Serah, M., Kunal, M., & Jumaane, T. (2007). Microeconomics of Competitiveness- The Botswana Textile Cluster.
Francistown.
7. Eriksson, P. G., Altermann, W., & Fortsch, E. B. (1995). Transvaal Sequence and Bushveld Complex. Mineralium Deposita, 30(2).
https://doi.org/10.1007/BF00189337
8. European Commission. (2019). Indicators and a Monitoring Framework for the Sustainable Development Goals - Launching a
data revolution for the SDGs. Brussels: Knowledge for Policy.
9. Fay, M., & Morrison, M. (2006). Infrastructure in Latin America and the Caribbean. The World Bank. https://doi.org/10.1596/978-0-
8213-6676-9
10. Independent Electoral Commission. (2014). Report on the 2014 National Elections Statistics. In IEC (Ed.). Francistown.
11. Kent, A., & Ikgopoleng, H. (2011). City profile: Gaborone. Cities, 28(5), 478–494.
12. Morton, F., Ramsay, J., & Mgadla, P. (2008). Historical Dictionary of Botswana. Lanham: Scarecrow Press.
13. Maundeni. (2015). Voter education and some electoral issues in Botswana, 2004. Retrieved June 1, 2019, from http://www.
electionsbotswana.org/articles. Accessed 29/08/2019
14. Navaneetham, K., & Dwivedi, V. (2014). Patterns and Differentials of Migration in Botswana. Botswana Notes and Records, 46,
72–83.
15. Obasi, I. N., & Lekorwe, M. H. (2014). Citizen engagement in public policy making process in Africa: The case of Botswana.
leadership, 3(4).
16. Oucho, J., Campbell, E., & Makamaamb, E. (2014). BOTSWANA: MIGRATION PERSPECTIVES AND PROSPECTS. In Migration
Policy Series No 19 (pp. 1–75). Waterloo: Idasa.
17. Republic of Botswana. (1997). City of Francistown Development Plan (1997-2021). Francistown: Ministry of Land Management,
Water and Sanitation Services.
18. Republic of Botswana. (2009). Laws of Botswana. Gaborone: Ministry of Local Government.
19. Statistics Botswana. (2017). Botswana Demographic Survey. Gaborone: Ministry of Finance and Economic Development.
20. Statistics Botswana. (2018). Annual Report 2017/18. Gaborone: Ministry of Finance and Economic Development.
21. The World Bank Group. (2015). Botswana Systematic Country Diagnostic. Gaborone: The World Bank.
22. UN-HABITAT. (2012). Measurement of City Prosperity Methodology and Metadata. Nairobi.
23. UN-HABITAT. (2019). City Prosperity Innitiative. Retrieved June 1, 2019, from http://cpi.unhabitat.org/tools-city-prosperity-initiative
24. UN DESA. (2019). World Population Prospects 2019. New York: The United Nations Department of Economic and Social Affairs.
25. UNODC. (2019). Statistics and Data. Retrieved June 1, 2019, from https://dataunodc.un.org/crime/theft

40ASSESSING PROGRESS TOWARDS URBAN PROSPERITY
ASSESSING PROGRESS TOWARDS URBAN PROSPERITY
41
Annexes
40
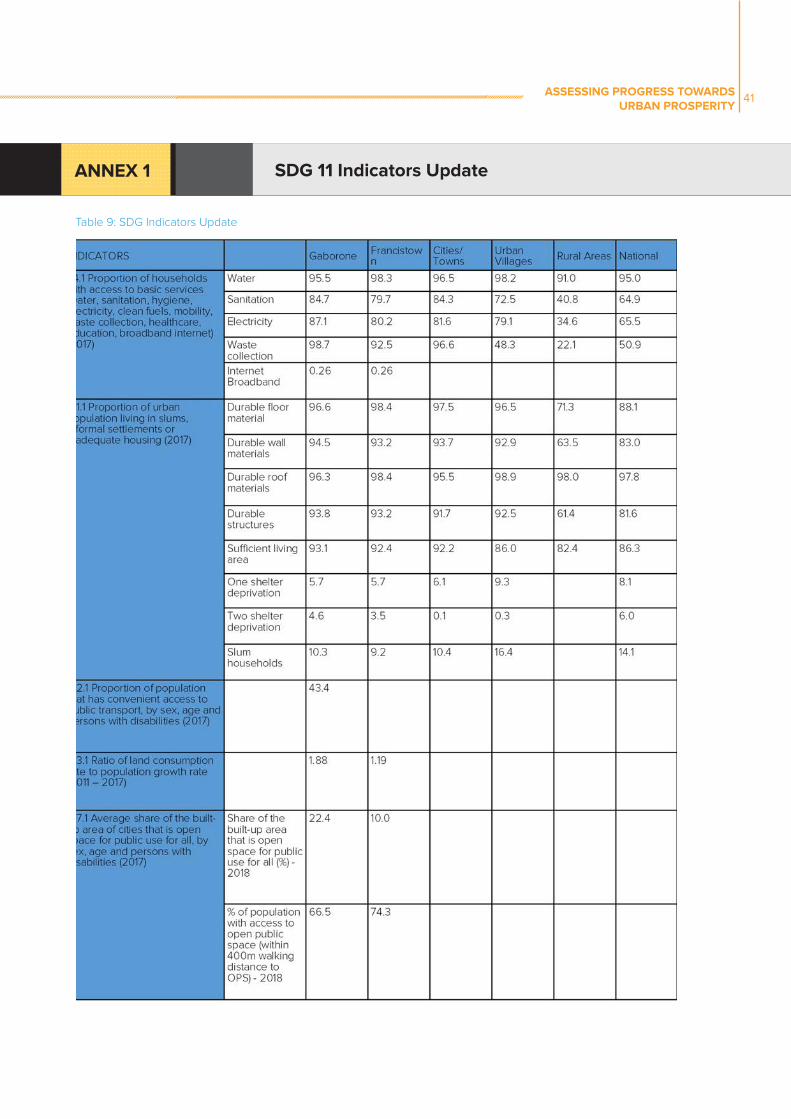
40ASSESSING PROGRESS TOWARDS URBAN PROSPERITY
ASSESSING PROGRESS TOWARDS URBAN PROSPERITY
41
ANNEX 1 SDG 11 Indicators Update
Table 9: SDG Indicators Update
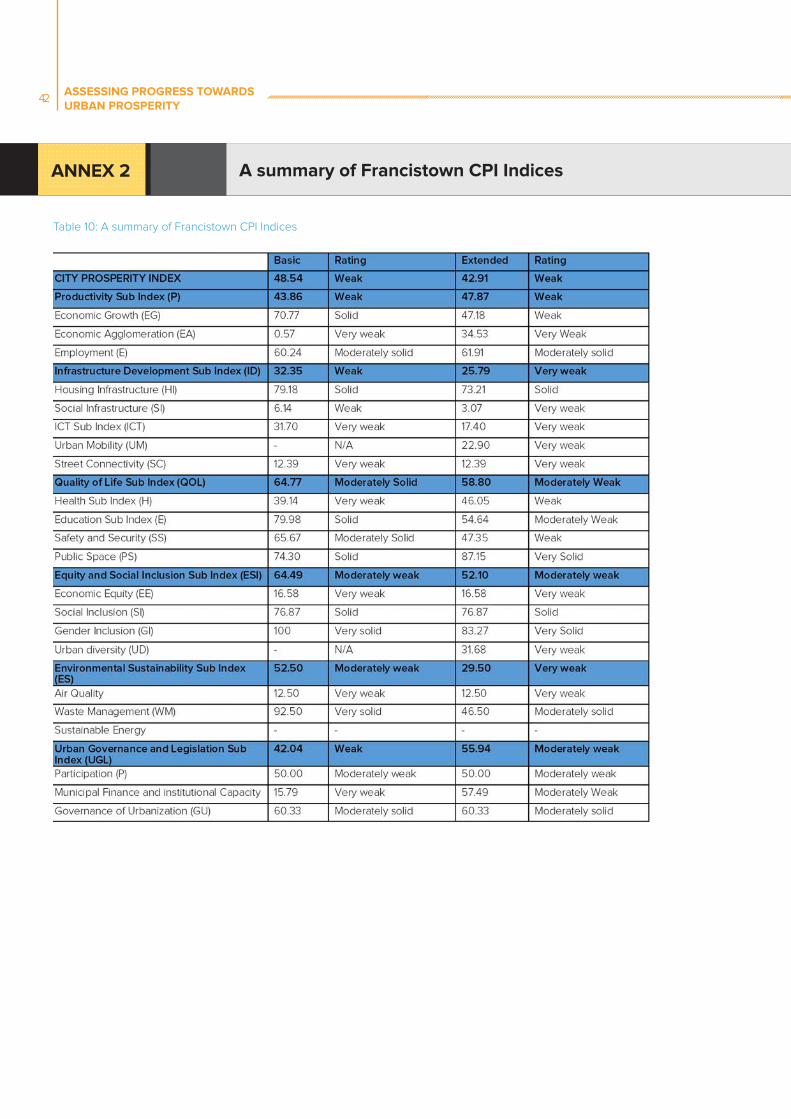
42ASSESSING PROGRESS TOWARDS URBAN PROSPERITY
ASSESSING PROGRESS TOWARDS URBAN PROSPERITY
43
ANNEX 2 A summary of Francistown CPI Indices
Table 10: A summary of Francistown CPI Indices
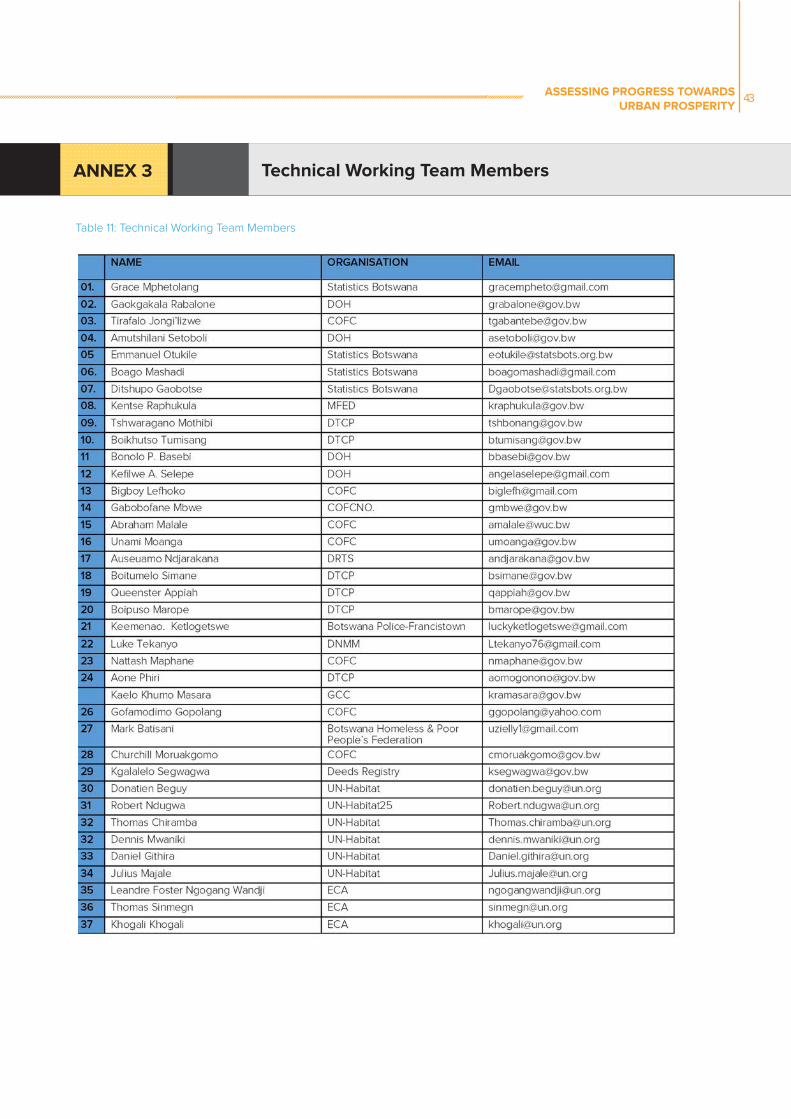
42ASSESSING PROGRESS TOWARDS URBAN PROSPERITY
ASSESSING PROGRESS TOWARDS URBAN PROSPERITY
43
ANNEX 3 Technical Working Team Members
Table 11: Technical Working Team Members
44ASSESSING PROGRESS TOWARDS URBAN PROSPERITY
ASSESSING PROGRESS TOWARDS URBAN PROSPERITY
45
ANNEX 4Definition of terms
City product per capita The City Product Per Capita is the sum of the gross value added (wages plus business plus
taxes less imports), or the total final demand (consumption plus investment plus exports),
relative to the city’s total population. The City Product Per Capita is calculated as the sum
of the products of the national Gross Domestic Product (GDP) of each economic sector
(primary, industrial and service) and the city’s share of that sector’s total employment,
divided by total city population
Economic specialization Refers to the agglomeration effects resulting from the clustering of industrial activities
giving rise to an “industrial climate”. It is usually as a way to gain greater degrees of
productivity efficiency and take advantage of increasing returns of scale.
Improved housing Proportion of households living in a durable housing unit, i.e. built on a non-hazardous
location, and has a permanent structure adequate enough to protect its inhabitants from
extreme climatic conditions such as rain, heat, cold, humidity.
Economic Agglomeration This is the clustering of industries which results in efficiency due to reduction of costs of
production and economies of scale.
Sufficient living area Proportion of households with three or fewer people sharing a room. A room is defined
as a space in a housing unit or other living quarters enclosed by walls reaching the floor
to the ceiling or roof covering, or to a height of at least two meters, of an area large
enough to hold a bed for an adult, that is at least four square meters.
Physicians Density Number of physicians per 1,000 people, relative to the total city population.
Street Intersection Density Number of street intersections per one square kilometer of urban area.
Women in local workforce The share of women in the labor force is the share of female workers in the non-
agricultural sector expressed as a percentage of total employment of the city (African
Health Observatory, 2008).
Land use mix Diversity of land use per square kilometer, within a city or urban area.
PM2.5 Annual mean concentration of particulate matter of less than 2.5 microns (PM2.5) in cities.
PM 2.5 is used because of its greater health impacts. The estimates represent the average
annual exposure level of the average urban resident to outdoor particulate matter.

44ASSESSING PROGRESS TOWARDS URBAN PROSPERITY
ASSESSING PROGRESS TOWARDS URBAN PROSPERITY
45