Embed Size (px)
Citation preview
Page 1 of 5
Project Management Scheduling through Integrated
PERT and Gantt Chart
Siti Hasziani Ahmad1, Abdul Talib Bon
2, Raja Zuraidah Raja Mohd Rasi
3, Sie Long Kek
4
Department of Operation Management1
Universiti Tun Hussein Onn Malaysia
Parit Raja, Batu Pahat, Johor, Malaysia
Department of Operation Management3
Universiti Tun Hussein Onn Malaysia
Parit Raja, Batu Pahat, Johor, Malaysia
Department of Operation Management2
Universiti Tun Hussein Onn Malaysia
Parit Raja, Batu Pahat, Johor, Malaysia
Center for Research of Computational Mathematics4
Universiti Tun Hussein Onn Malaysia
Parit Raja, Batu Pahat, Johor, Malaysia
Abstract— In project management, scheduling is one of the
important activities, where the project can be successfully
finished within a desired time period. This study reviews the
existing techniques in solving the scheduling problems. An
integration technique between Program Evaluation and
Review Technique (PERT), and Gantt chart is proposed for a
better scheduling such that the efficiency of the proposed
approach and the existing techniques can be compared. Data
collection was carried out and the previous monthly data of the
production was taken. After collecting data, the data will be
transformed into PERT diagram and then the duration time
and cost of the production were calculated. Consequently, the
Gantt chart of the production was developed. As a result, an
optimal scheduling can be suggested in future.
Keywords— PERT, Gantt chart, Integration, project
management, scheduling.
I. Introduction Project management involves scheduling, planning,
monitoring and controlling of limited resources to satisfy a
variety of constraints so as a specific objective is achieved.
A proper scheduling is important in the completion of a
project. This is because the project can be completed as
desired by determining the earliest start and finish times of
each activity, and the likelihood of a project is completed
within a certain time period.
From the scheduling table, the production notifies the
period when each activity should be done, what has already
completed, and the sequence in which tasks needed to be
finished according to the priority. Furthermore, the critical
path of a project is determined such that the project will not
be delayed.
Although there are many project management
techniques, but it is less investigation in studying the
integration techniques. In this paper, the aim of this study is
to focus on an integrated technique, which combines
Program Evaluation and Review Technique (PERT) and
Gantt Chart (GC), for solving the scheduling problems.
Consequently, the completion time of a project is on
track without having any delay.
II. Literature Review To overcome the problems arise in scheduling, such as
time overrunning, wasting of raw materials and over
budgeting, many techniques have been well developed to
produce an optimal scheduling. Here, two common
techniques, which are PERT and GC, are briefly reviewed.
A. Project Management Technique
In general, a list of activities with the proposed start and
finish dates are mentioned in a project. These activities are
also stated in the development of a work breakdown
structure (WBS), where the project is divided into a set of
atomic activities. In this case, all of these activities are
extracted, defined, elaborated and agreed upon using some
consensus driven mechanism such as wideband Delphi [1].
Managers prefer to application of PERT rather than
Activity on Node (AoN) in scheduling. From [2], PERT is
embodied in time for various activities of projects.
For certain analytical techniques, the network structure
of PERT is properly used in a project management [3].
According to [4], PERT was used to deal with problems that
the logic relationships of activities were convinced but their
durations were indeterminate.
Page 2 of 5
Gantt chart is the fourth most used tools out of 70 tools
and techniques that are related to project management
conferring survey from 750 project managers [5]. Gantt
chart is actually used universally which consists of many
contexts and across the spectrum from continuous
production (low variety, high volume) to projects (high
variety, low volume) [6].
B. Integration Technique
Since the work breakdown structure cannot be used in a
large-scale project, the integrated technique, which
combines process model and Gantt chart, is then studied [7].
At the beginning, the integration framework of a process
is done. In the process, activities are arranged to operate one
task.
The sequence of activities is the key in the process such
that the manufacturing system can be run. Here,
organizations, resources and information represent a
dynamic system in order to produce products and profits.
Based on the mapping technique, some analyses are made:
(a) Describing the relationship between two activities that
have logical sequence and overlap in time axis cannot
be done directly from process modeling method.
However, it is easy for Gantt chart to present the
overlapped relationship. The reasonable schedule can
be developed with the recorded time, cost and resource
when transferring the process model into Gantt chart.
(b) Knowing how resource is being distributed in the time
axis make easy, if there is any existence logic or time
antinomy among activities by using project
management.
(c) Analyzing the relationship of activities based on Gantt
chart can be done using the critical path method (CPM),
where the critical path of activities is found in the
reasonable process.
From [8], Data Flow Diagram (DFD) is integrated with
Gantt chart and PERT. These techniques are integrated to
automatically map system analysis object into project
management objects that are more desired and feasible. In
integrating the techniques, two techniques are considered,
which are mapping model and mapping prototype.
In mapping model, a model of DFD object is considered
into Gantt objects, while in mapping prototype, the mapping
approach is prototyped and it only shows the result from the
mapping DFD that has been transferred into Gantt diagrams
by Microsoft’s MS Project [8].
III. Methodology A. Program Evaluation and Review Technique (PERT)
PERT technique is being used to change the data from
production into Activity on Node (AoN). This is to ensure
the transformation from AoN into Gantt chart is easy.
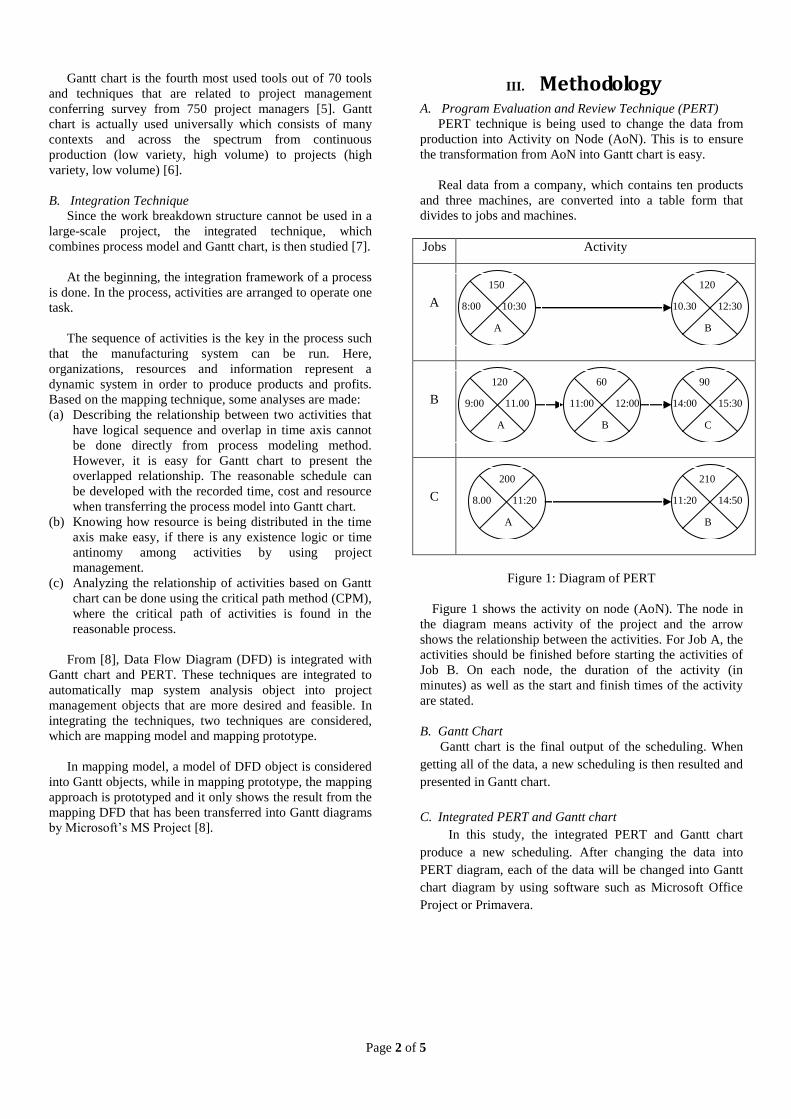
Real data from a company, which contains ten products
and three machines, are converted into a table form that
divides to jobs and machines.
Jobs Activity
A
B
C
Figure 1: Diagram of PERT
Figure 1 shows the activity on node (AoN). The node in
the diagram means activity of the project and the arrow
shows the relationship between the activities. For Job A, the
activities should be finished before starting the activities of
Job B. On each node, the duration of the activity (in
minutes) as well as the start and finish times of the activity
are stated.
B. Gantt Chart
Gantt chart is the final output of the scheduling. When
getting all of the data, a new scheduling is then resulted and
presented in Gantt chart.
C. Integrated PERT and Gantt chart
In this study, the integrated PERT and Gantt chart
produce a new scheduling. After changing the data into
PERT diagram, each of the data will be changed into Gantt
chart diagram by using software such as Microsoft Office
Project or Primavera.
150
8:00 10:30
A
120
10.30 12:30
B
120
9:00 11.00
A
60
11:00 12:00
B
90
14:00 15:30
C
200
8.00 11:20
A
210
11:20 14:50
B
Page 3 of 5
The output of the integration technique is significantly
displayed when the company applies PERT as well as uses
Gantt chart.
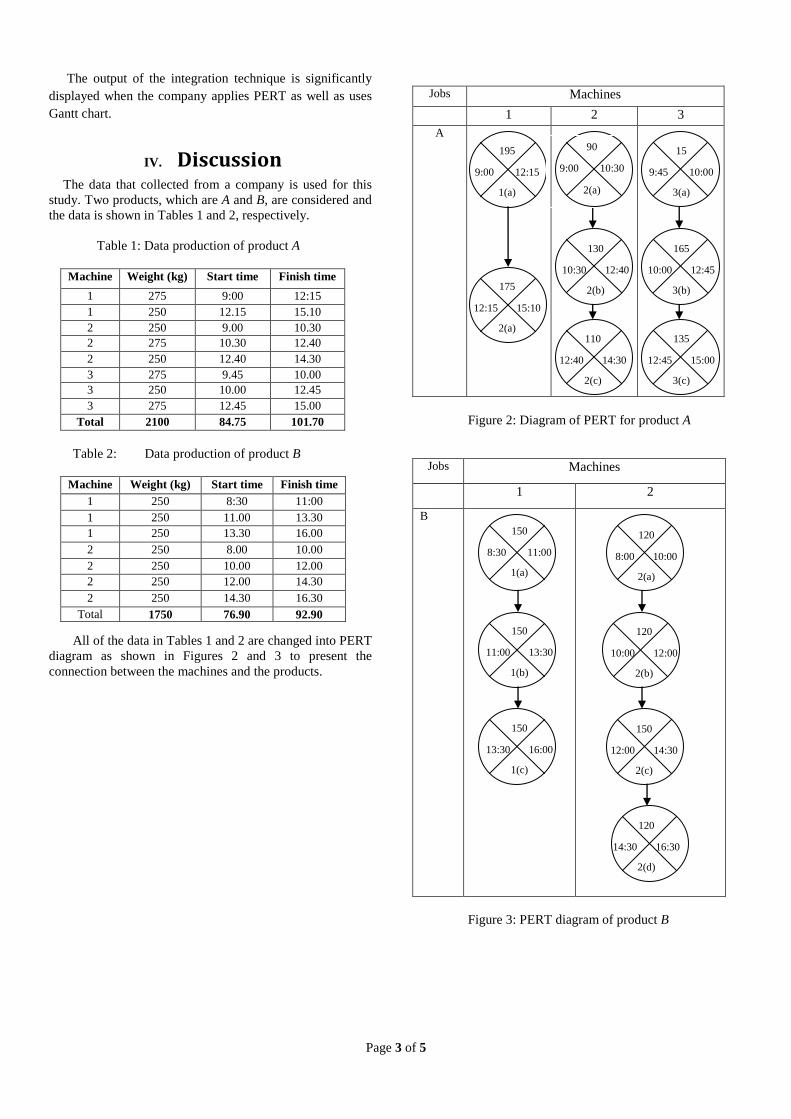
IV. Discussion The data that collected from a company is used for this
study. Two products, which are A and B, are considered and
the data is shown in Tables 1 and 2, respectively.
Table 1: Data production of product A
Machine Weight (kg) Start time Finish time
1 275 9:00 12:15
1 250 12.15 15.10
2 250 9.00 10.30
2 275 10.30 12.40
2 250 12.40 14.30
3 275 9.45 10.00
3 250 10.00 12.45
3 275 12.45 15.00
Total 2100 84.75 101.70
Table 2: Data production of product B
Machine Weight (kg) Start time Finish time
1 250 8:30 11:00
1 250 11.00 13.30
1 250 13.30 16.00
2 250 8.00 10.00
2 250 10.00 12.00
2 250 12.00 14.30
2 250 14.30 16.30
Total 1750 76.90 92.90
All of the data in Tables 1 and 2 are changed into PERT
diagram as shown in Figures 2 and 3 to present the
connection between the machines and the products.
Jobs Machines
1 2 3
A
Figure 2: Diagram of PERT for product A
Jobs Machines
1 2
B
Figure 3: PERT diagram of product B
195
9:00 12:15
1(a)
150
8:30 11:00
1(a)
90
9:00 10:30
2(a)
15
9:45 10:00
3(a)
175
12:15 15:10
2(a)
130
10:30 12:40
2(b)
110
12:40 14:30
2(c)
165
10:00 12:45
3(b)
135
12:45 15:00
3(c)
120
8:00 10:00
2(a)
150
11:00 13:30
1(b)
150
13:30 16:00
1(c)
120
10:00 12:00
2(b)
150
12:00 14:30
2(c)
120
14:30 16:30
2(d)
Page 4 of 5
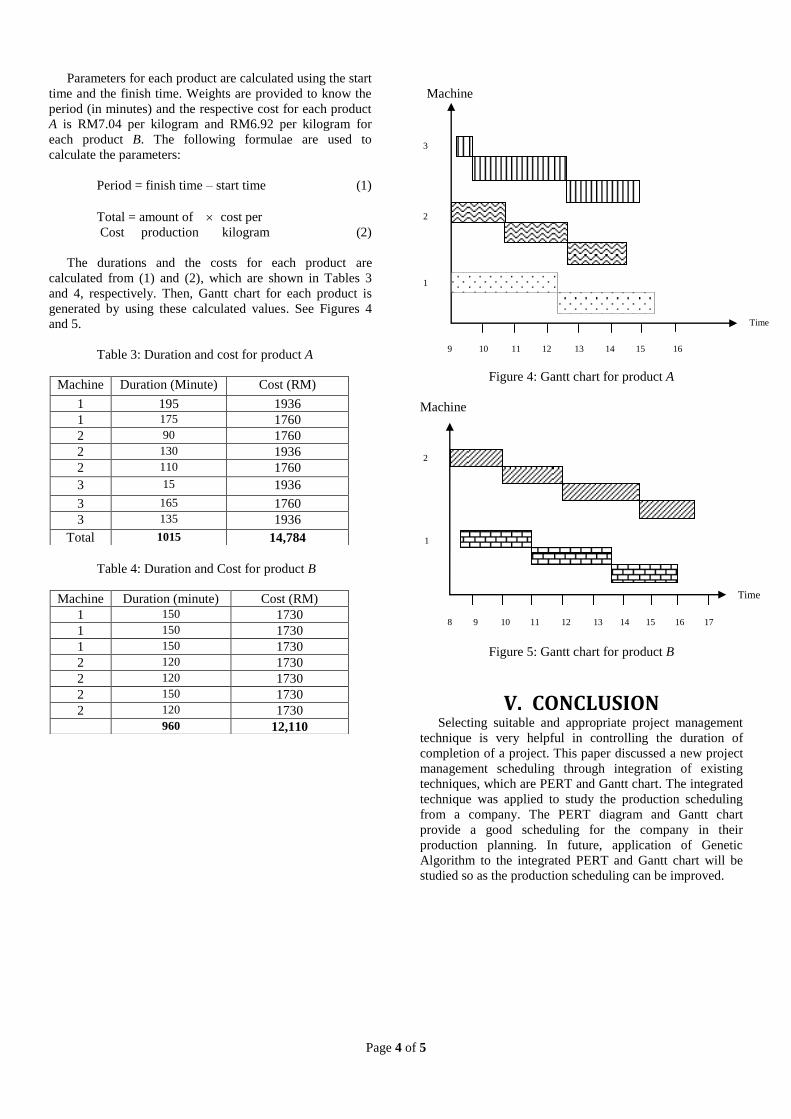
Parameters for each product are calculated using the start
time and the finish time. Weights are provided to know the
period (in minutes) and the respective cost for each product
A is RM7.04 per kilogram and RM6.92 per kilogram for
each product B. The following formulae are used to
calculate the parameters:
Period = finish time – start time (1)
Total = amount of cost per
Cost production kilogram (2)
The durations and the costs for each product are
calculated from (1) and (2), which are shown in Tables 3
and 4, respectively. Then, Gantt chart for each product is
generated by using these calculated values. See Figures 4
and 5.
Table 3: Duration and cost for product A
Table 4: Duration and Cost for product B
Machine
Figure 4: Gantt chart for product A
Machine
Figure 5: Gantt chart for product B
V. CONCLUSION Selecting suitable and appropriate project management
technique is very helpful in controlling the duration of
completion of a project. This paper discussed a new project
management scheduling through integration of existing
techniques, which are PERT and Gantt chart. The integrated
technique was applied to study the production scheduling
from a company. The PERT diagram and Gantt chart
provide a good scheduling for the company in their
production planning. In future, application of Genetic
Algorithm to the integrated PERT and Gantt chart will be
studied so as the production scheduling can be improved.
Machine Duration (Minute) Cost (RM)
1 195 1936
1 175 1760
2 90 1760
2 130 1936
2 110 1760
3 15 1936
3 165 1760
3 135 1936
Total 1015 14,784
Machine Duration (minute) Cost (RM)
1 150 1730
1 150 1730
1 150 1730
2 120 1730
2 120 1730
2 150 1730
2 120 1730
960 12,110
9 14 15 16 13 12 10 11
Time
2
1
1
2
3
Time
8 9 10 11 12 13 14 15 16 17
Page 5 of 5
References
[1] Ramzan, M., Iqbal M. A., Jaffar M. A., Rauf, A.,
Anwar, S. & Shahid, A. A. (2010). ―Project
Scheduling Conflict Identification and Resolution
Using Genetic Algorithms,‖ 2010 International
Conference on Information Science and Applications,
1–6.
[2] Henderckson, C., Au, T. (2008). Project management
for construction, department of civil and
environmental engineering, Carnegie Mellon
University, Pittsburgh, PA l52l3, Version 2.2,
[3] Cohen, Y., Sadeh, A. (2007). A new approach for
constructing and generating AOA networks, J.
Computer Science 1 (1).
[4] Shaojun, W., Gang, W., Min, L., & Guoan, G.
(2008). Enterprise resource planning implementation
decision & optimization models. Journal of Systems
Engineering and Electronics, 19(3), 513-521.
[5] Besner, C. & Hobbs, B. (2008), ―Project management
praction, generic or contextual: a reality check‖,
Project Management Journal, Vol. 39 No. 1, pp. 16-
33.
[6] Slack, N., Chambers, S. & Johnston, R. (2010),
Operations Management, Prentice-Hall, New York,
NY.
[7] Qing, L., Ytrliu, C., & Qing, W. (2002). Integration
of Process and Project Management System’2
Integrating framework of process and project
management, 1582–1586.
[8] Gelbard, R., Pliskin, N., & Spiegler, I. (2002).
Integrating system analysis and project management
tools. International Journal of Project Management,
20(6), 461–468.
8 9 10 11 12 13 14 15 16 17