Embed Size (px)
Citation preview

108 178 0
231 110 21
0 121 194
229 25 55
0 172 169
128 128 128
216 255 159
246 197 160
(Highlight)
143 212 255
244 154 167
189 255 253
197 197 197
Primary Secondary PHOENIX2013\05 Presentations\2015.09 Management Presentation\Project Phoenix_IDP Management
Presentation_MASTER.pptx
Click to edit Master text styles
SECOND LEVEL
Third level
• Fourth level
- Fifth level
IDP Education Half Year Results Presentation
Six months to 31 December 2015 11 February 2016
For
per
sona
l use
onl
y
108 178 0
231 110 21
0 121 194
229 25 55
0 172 169
128 128 128
216 255 159
246 197 160
(Highlight)
143 212 255
244 154 167
189 255 253
197 197 197
Primary Secondary PHOENIX2013\05 Presentations\2015.09 Management Presentation\Project Phoenix_IDP Management
Presentation_MASTER.pptx
Click to edit Master text styles
SECOND LEVEL
Third level
• Fourth level
- Fifth level
Disclaimer
The material in this presentation has been prepared by IDP Education Limited (ASX: IEL) ABN 59 117 676 463 (“IDP Education") and is general
background information about IDP Education’s activities current as at the date of this presentation. The information is given in summary form
and does not purport to be complete. In particular you are cautioned not to place undue reliance on any forward looking statements regarding
our belief, intent or expectations with respect to IDP Education’s businesses, market conditions and/or results of operations, as although due
care has been used in the preparation of such statements, actual results may vary in a material manner. Information in this presentation,
including forecast financial information, should not be considered as advice or a recommendation to investors or potential investors in relation to
holding, purchasing or selling securities. Before acting on any information you should consider the appropriateness of the information having
regard to these matters, any relevant offer document and in particular, you should seek independent financial advice.
Non-IFRS Financial Information
IDP Education uses certain measures to manage and report on its business that are not recognised under Australian Accounting Standards.
These measures are collectively referred to as non-IFRS financial measures. Although IDP Education believes that these measures provide
useful information about the financial performance of IDP Education, they should be considered as supplemental to the measures calculated in
accordance with Australian Accounting Standards and not as a replacement for them. Because these non-IFRS financial measures are not
based on Australian Accounting Standards, they do not have standard definitions, and the way IDP Education calculates these measures may
differ from similarly titled measures used by other companies. Readers should therefore not place undue reliance on these non-IFRS financial
measures.
Note All financial amounts contained in this presentation are expressed in Australian dollars unless otherwise stated. Any discrepancies
between totals and the sum of components in tables contained in this Presentation are due to rounding.
Important notice and disclaimer
IDP EDUCATION | FY16 Half Year Results Presentation 2
For
per
sona
l use
onl
y
108 178 0
231 110 21
0 121 194
229 25 55
0 172 169
128 128 128
216 255 159
246 197 160
(Highlight)
143 212 255
244 154 167
189 255 253
197 197 197
Primary Secondary PHOENIX2013\05 Presentations\2015.09 Management Presentation\Project Phoenix_IDP Management
Presentation_MASTER.pptx
Click to edit Master text styles
SECOND LEVEL
Third level
• Fourth level
- Fifth level
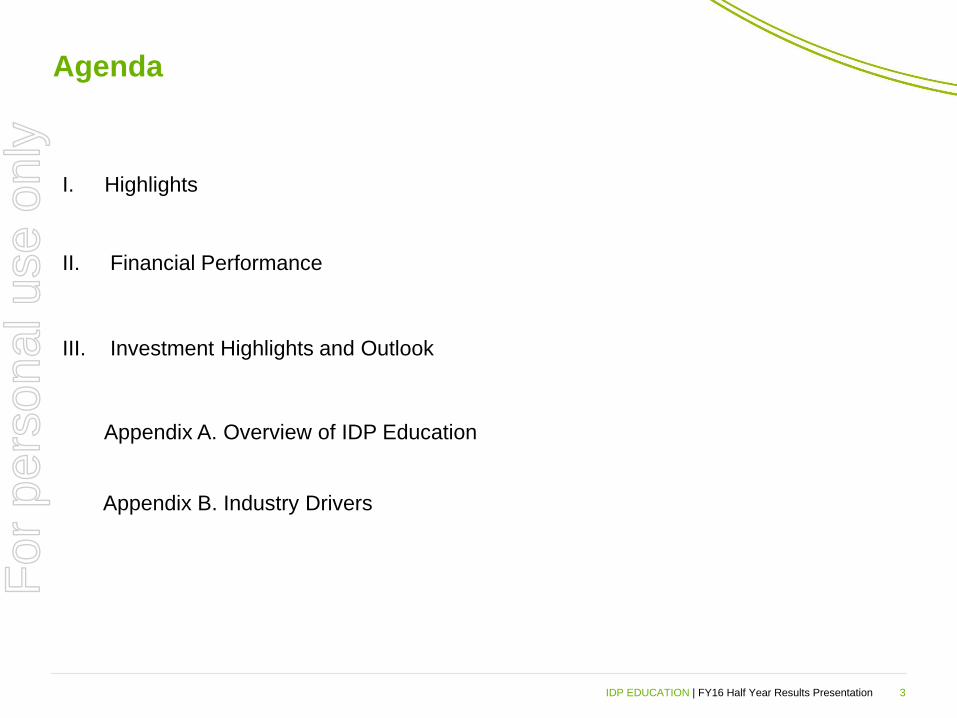
Agenda
3
I. Highlights
II. Financial Performance
III. Investment Highlights and Outlook
Appendix A. Overview of IDP Education
Appendix B. Industry Drivers
IDP EDUCATION | FY16 Half Year Results Presentation
For
per
sona
l use
onl
y

108 178 0
231 110 21
0 121 194
229 25 55
0 172 169
128 128 128
216 255 159
246 197 160
(Highlight)
143 212 255
244 154 167
189 255 253
197 197 197
Primary Secondary PHOENIX2013\05 Presentations\2015.09 Management Presentation\Project Phoenix_IDP Management
Presentation_MASTER.pptx
Click to edit Master text styles
SECOND LEVEL
Third level
• Fourth level
- Fifth level
Highlights
01 For
per
sona
l use
onl
y
108 178 0
231 110 21
0 121 194
229 25 55
0 172 169
128 128 128
216 255 159
246 197 160
(Highlight)
143 212 255
244 154 167
189 255 253
197 197 197
Primary Secondary PHOENIX2013\05 Presentations\2015.09 Management Presentation\Project Phoenix_IDP Management
Presentation_MASTER.pptx
Click to edit Master text styles
SECOND LEVEL
Third level
• Fourth level
- Fifth level
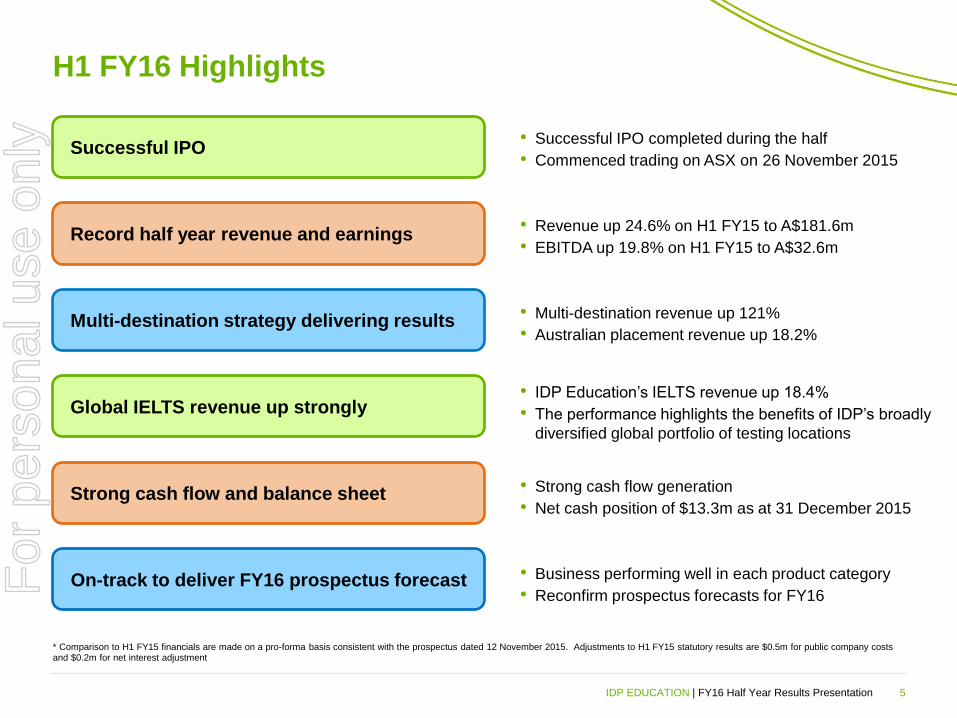
H1 FY16 Highlights
5
Successful IPO
Record half year revenue and earnings
Multi-destination strategy delivering results
Global IELTS revenue up strongly
Strong cash flow and balance sheet
On-track to deliver FY16 prospectus forecast
IDP EDUCATION | FY16 Half Year Results Presentation
• Successful IPO completed during the half
• Commenced trading on ASX on 26 November 2015
• Revenue up 24.6% on H1 FY15 to A$181.6m
• EBITDA up 19.8% on H1 FY15 to A$32.6m
• Multi-destination revenue up 121%
• Australian placement revenue up 18.2%
• IDP Education’s IELTS revenue up 18.4%
• The performance highlights the benefits of IDP’s broadly
diversified global portfolio of testing locations
• Strong cash flow generation
• Net cash position of $13.3m as at 31 December 2015
• Business performing well in each product category
• Reconfirm prospectus forecasts for FY16
* Comparison to H1 FY15 financials are made on a pro-forma basis consistent with the prospectus dated 12 November 2015. Adjustments to H1 FY15 statutory results are $0.5m for public company costs and $0.2m for net interest adjustment
For
per
sona
l use
onl
y
108 178 0
231 110 21
0 121 194
229 25 55
0 172 169
128 128 128
216 255 159
246 197 160
(Highlight)
143 212 255
244 154 167
189 255 253
197 197 197
Primary Secondary PHOENIX2013\05 Presentations\2015.09 Management Presentation\Project Phoenix_IDP Management
Presentation_MASTER.pptx
Click to edit Master text styles
SECOND LEVEL
Third level
• Fourth level
- Fifth level
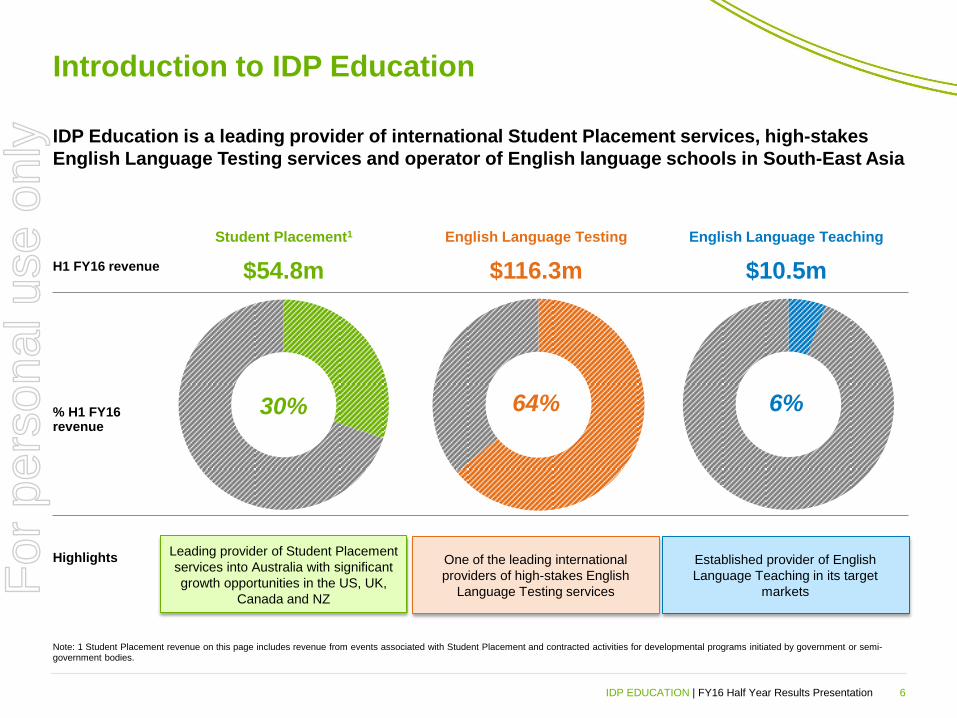
Introduction to IDP Education
IDP Education is a leading provider of international Student Placement services, high-stakes
English Language Testing services and operator of English language schools in South-East Asia
6
H1 FY16 revenue
% H1 FY16 revenue
Highlights
Student Placement1 English Language Testing English Language Teaching
$54.8m $116.3m $10.5m
Leading provider of Student Placement
services into Australia with significant
growth opportunities in the US, UK,
Canada and NZ
One of the leading international
providers of high-stakes English
Language Testing services
Established provider of English
Language Teaching in its target
markets
Note: 1 Student Placement revenue on this page includes revenue from events associated with Student Placement and contracted activities for developmental programs initiated by government or semi-government bodies.
30% 64% 6%
IDP EDUCATION | FY16 Half Year Results Presentation
For
per
sona
l use
onl
y
108 178 0
231 110 21
0 121 194
229 25 55
0 172 169
128 128 128
216 255 159
246 197 160
(Highlight)
143 212 255
244 154 167
189 255 253
197 197 197
Primary Secondary PHOENIX2013\05 Presentations\2015.09 Management Presentation\Project Phoenix_IDP Management
Presentation_MASTER.pptx
Click to edit Master text styles
SECOND LEVEL
Third level
• Fourth level
- Fifth level
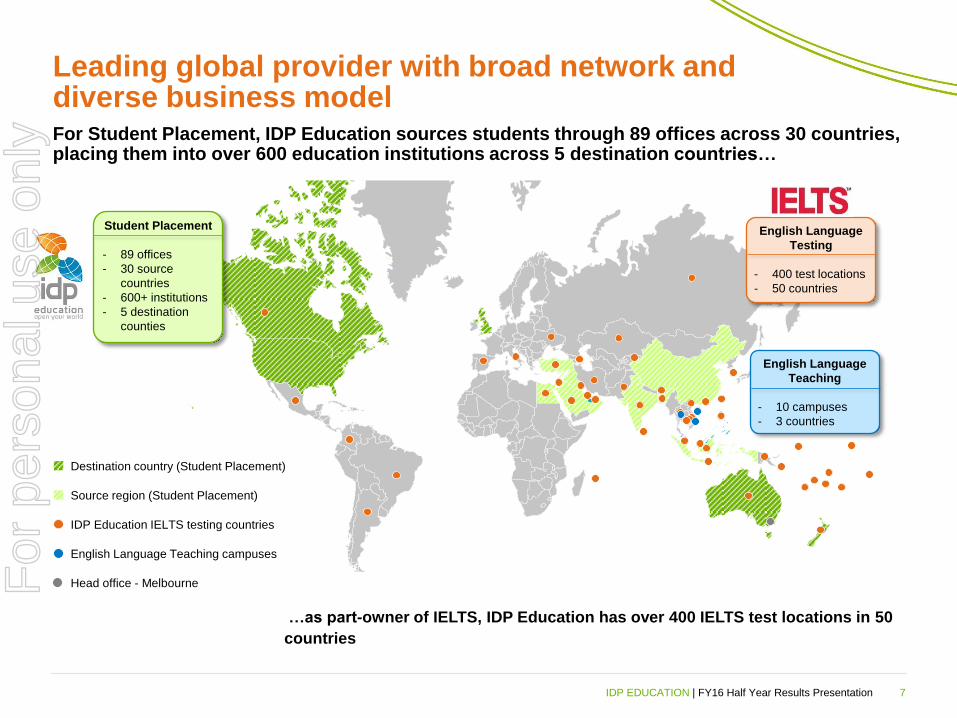
Leading global provider with broad network and diverse business model For Student Placement, IDP Education sources students through 89 offices across 30 countries, placing them into over 600 education institutions across 5 destination countries…
…as part-owner of IELTS, IDP Education has over 400 IELTS test locations in 50
countries
7
Destination country (Student Placement)
Source region (Student Placement)
IDP Education IELTS testing countries
English Language Teaching campuses
Head office - Melbourne
Student Placement
- 89 offices
- 30 source
countries
- 600+ institutions
- 5 destination
counties
English Language
Testing
- 400 test locations
- 50 countries
English Language
Teaching
- 10 campuses
- 3 countries
IDP EDUCATION | FY16 Half Year Results Presentation
For
per
sona
l use
onl
y

108 178 0
231 110 21
0 121 194
229 25 55
0 172 169
128 128 128
216 255 159
246 197 160
(Highlight)
143 212 255
244 154 167
189 255 253
197 197 197
Primary Secondary PHOENIX2013\05 Presentations\2015.09 Management Presentation\Project Phoenix_IDP Management
Presentation_MASTER.pptx
Click to edit Master text styles
SECOND LEVEL
Third level
• Fourth level
- Fifth level
Financial Highlights
02 For
per
sona
l use
onl
y
108 178 0
231 110 21
0 121 194
229 25 55
0 172 169
128 128 128
216 255 159
246 197 160
(Highlight)
143 212 255
244 154 167
189 255 253
197 197 197
Primary Secondary PHOENIX2013\05 Presentations\2015.09 Management Presentation\Project Phoenix_IDP Management
Presentation_MASTER.pptx
Click to edit Master text styles
SECOND LEVEL
Third level
• Fourth level
- Fifth level
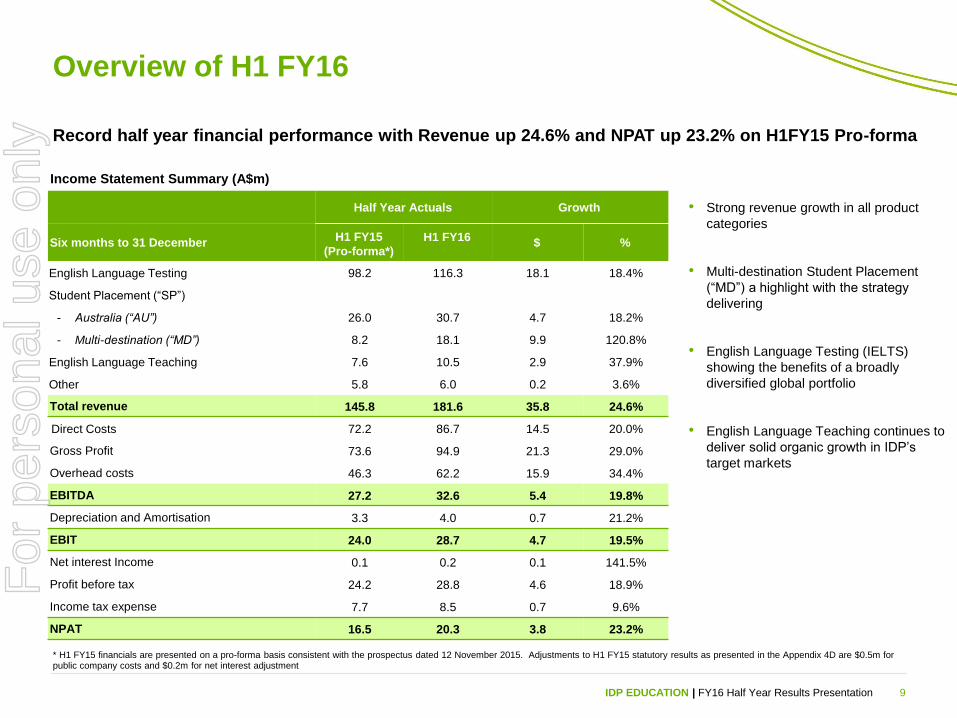
Overview of H1 FY16
Record half year financial performance with Revenue up 24.6% and NPAT up 23.2% on H1FY15 Pro-forma
* H1 FY15 financials are presented on a pro-forma basis consistent with the prospectus dated 12 November 2015. Adjustments to H1 FY15 statutory results as presented in the Appendix 4D are $0.5m for public company costs and $0.2m for net interest adjustment
Income Statement Summary (A$m)
Half Year Actuals Growth
Six months to 31 December
H1 FY15
(Pro-forma*)
H1 FY16
$ %
English Language Testing 98.2 116.3 18.1 18.4%
Student Placement (“SP”)
- Australia (“AU”) 26.0 30.7 4.7 18.2%
- Multi-destination (“MD”) 8.2 18.1 9.9 120.8%
English Language Teaching 7.6 10.5 2.9 37.9%
Other 5.8 6.0 0.2 3.6%
Total revenue 145.8 181.6 35.8 24.6%
Direct Costs 72.2 86.7 14.5 20.0%
Gross Profit 73.6 94.9 21.3 29.0%
Overhead costs 46.3 62.2 15.9 34.4%
EBITDA 27.2 32.6 5.4 19.8%
Depreciation and Amortisation 3.3 4.0 0.7 21.2%
EBIT 24.0 28.7 4.7 19.5%
Net interest Income 0.1 0.2 0.1 141.5%
Profit before tax 24.2 28.8 4.6 18.9%
Income tax expense 7.7 8.5 0.7 9.6%
NPAT 16.5 20.3 3.8 23.2%
9 IDP EDUCATION | FY16 Half Year Results Presentation
• Strong revenue growth in all product
categories
• Multi-destination Student Placement
(“MD”) a highlight with the strategy
delivering
• English Language Testing (IELTS)
showing the benefits of a broadly
diversified global portfolio
• English Language Teaching continues to
deliver solid organic growth in IDP’s
target markets
For
per
sona
l use
onl
y
108 178 0
231 110 21
0 121 194
229 25 55
0 172 169
128 128 128
216 255 159
246 197 160
(Highlight)
143 212 255
244 154 167
189 255 253
197 197 197
Primary Secondary PHOENIX2013\05 Presentations\2015.09 Management Presentation\Project Phoenix_IDP Management
Presentation_MASTER.pptx
Click to edit Master text styles
SECOND LEVEL
Third level
• Fourth level
- Fifth level
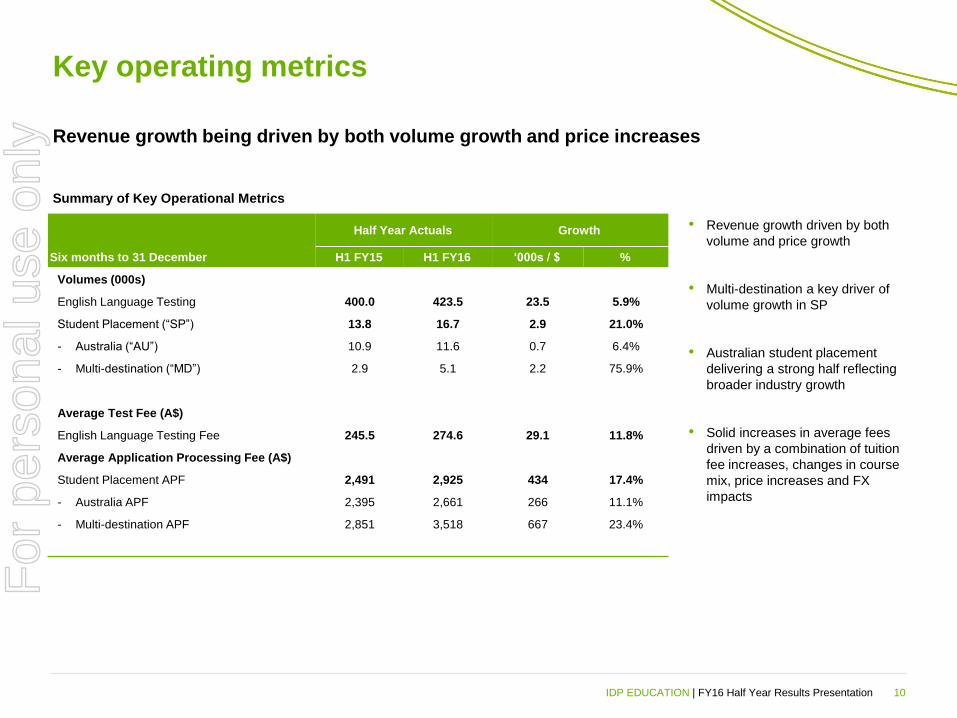
Key operating metrics
10
Revenue growth being driven by both volume growth and price increases
IDP EDUCATION | FY16 Half Year Results Presentation
Half Year Actuals Growth
Six months to 31 December H1 FY15 H1 FY16 ‘000s / $ %
Volumes (000s)
English Language Testing 400.0 423.5 23.5 5.9%
Student Placement (“SP”) 13.8 16.7 2.9 21.0%
- Australia (“AU”) 10.9 11.6 0.7 6.4%
- Multi-destination (“MD”) 2.9 5.1 2.2 75.9%
Average Test Fee (A$)
English Language Testing Fee 245.5 274.6 29.1 11.8%
Average Application Processing Fee (A$)
Student Placement APF 2,491 2,925 434 17.4%
- Australia APF 2,395 2,661 266 11.1%
- Multi-destination APF 2,851 3,518 667 23.4%
Summary of Key Operational Metrics
• Revenue growth driven by both
volume and price growth
• Multi-destination a key driver of
volume growth in SP
• Australian student placement
delivering a strong half reflecting
broader industry growth
• Solid increases in average fees
driven by a combination of tuition
fee increases, changes in course
mix, price increases and FX
impacts
For
per
sona
l use
onl
y
108 178 0
231 110 21
0 121 194
229 25 55
0 172 169
128 128 128
216 255 159
246 197 160
(Highlight)
143 212 255
244 154 167
189 255 253
197 197 197
Primary Secondary PHOENIX2013\05 Presentations\2015.09 Management Presentation\Project Phoenix_IDP Management
Presentation_MASTER.pptx
Click to edit Master text styles
SECOND LEVEL
Third level
• Fourth level
- Fifth level
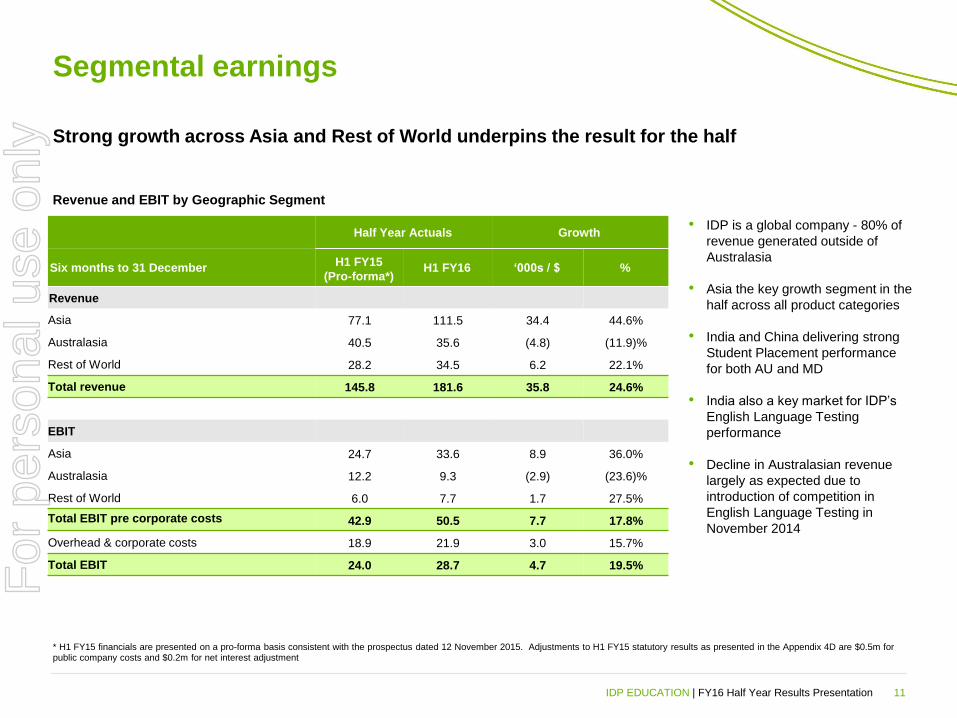
Segmental earnings
11
Strong growth across Asia and Rest of World underpins the result for the half
Revenue and EBIT by Geographic Segment
IDP EDUCATION | FY16 Half Year Results Presentation
Half Year Actuals Growth
Six months to 31 December
H1 FY15
(Pro-forma*)
H1 FY16 ‘000s / $ %
Revenue
Asia 77.1 111.5 34.4 44.6%
Australasia 40.5 35.6 (4.8) (11.9)%
Rest of World 28.2 34.5 6.2 22.1%
Total revenue 145.8 181.6 35.8 24.6%
EBIT
Asia 24.7 33.6 8.9 36.0%
Australasia 12.2 9.3 (2.9) (23.6)%
Rest of World 6.0 7.7 1.7 27.5%
Total EBIT pre corporate costs 42.9 50.5 7.7 17.8%
Overhead & corporate costs 18.9 21.9 3.0 15.7%
Total EBIT 24.0 28.7 4.7 19.5%
* H1 FY15 financials are presented on a pro-forma basis consistent with the prospectus dated 12 November 2015. Adjustments to H1 FY15 statutory results as presented in the Appendix 4D are $0.5m for public company costs and $0.2m for net interest adjustment
• IDP is a global company - 80% of
revenue generated outside of
Australasia
• Asia the key growth segment in the
half across all product categories
• India and China delivering strong
Student Placement performance
for both AU and MD
• India also a key market for IDP’s
English Language Testing
performance
• Decline in Australasian revenue
largely as expected due to
introduction of competition in
English Language Testing in
November 2014
For
per
sona
l use
onl
y
108 178 0
231 110 21
0 121 194
229 25 55
0 172 169
128 128 128
216 255 159
246 197 160
(Highlight)
143 212 255
244 154 167
189 255 253
197 197 197
Primary Secondary PHOENIX2013\05 Presentations\2015.09 Management Presentation\Project Phoenix_IDP Management
Presentation_MASTER.pptx
Click to edit Master text styles
SECOND LEVEL
Third level
• Fourth level
- Fifth level
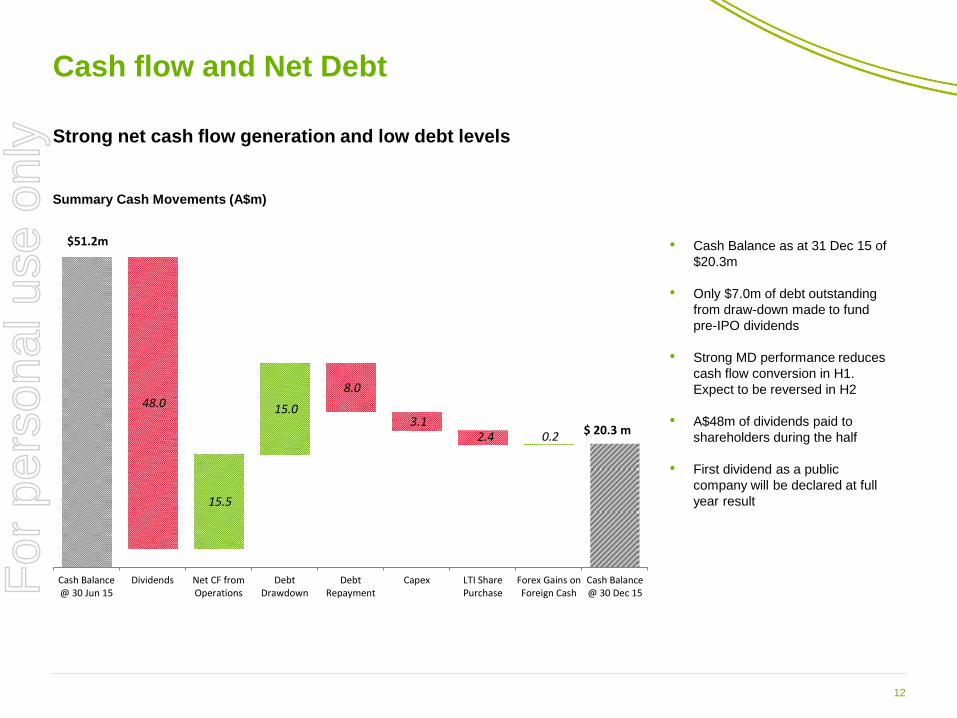
Cash flow and Net Debt
Strong net cash flow generation and low debt levels
12
Summary Cash Movements (A$m)
• Cash Balance as at 31 Dec 15 of
$20.3m
• Only $7.0m of debt outstanding
from draw-down made to fund
pre-IPO dividends
• Strong MD performance reduces
cash flow conversion in H1.
Expect to be reversed in H2
• A$48m of dividends paid to
shareholders during the half
• First dividend as a public
company will be declared at full
year result
$51.2m
$ 20.3 m
48.0
15.5
15.0
8.0
3.1 2.4 0.2
Cash Balance@ 30 Jun 15
Dividends Net CF fromOperations
DebtDrawdown
DebtRepayment
Capex LTI SharePurchase
Forex Gains onForeign Cash
Cash Balance@ 30 Dec 15F
or p
erso
nal u
se o
nly
108 178 0
231 110 21
0 121 194
229 25 55
0 172 169
128 128 128
216 255 159
246 197 160
(Highlight)
143 212 255
244 154 167
189 255 253
197 197 197
Primary Secondary PHOENIX2013\05 Presentations\2015.09 Management Presentation\Project Phoenix_IDP Management
Presentation_MASTER.pptx
Click to edit Master text styles
SECOND LEVEL
Third level
• Fourth level
- Fifth level
Foreign exchange
Strong underlying operational performance with foreign exchange movements providing some
benefit in H1 FY16
13
Revenue (A$m)
NPAT (A$m)
• IDP Education earns revenues and incurs expenses in
approximately 45 currencies and as a result is exposed to
movements in foreign currency exchange rates
• IDP Education’s most significant individual foreign currency
exposure is to GBP, mainly due to the quarterly fee paid to
Cambridge Assessment for its role in IELTS, denominated in GBP
• H1 FY16 reflected a weaker AUD relative to H1 FY15
- The weaker AUD increases AUD revenue, but the GBP hedge
reduces the foreign currency exchange rate impact on AUD
costs of the English Language Testing business, which is IDP
Education’s largest foreign currency cost
• Even after excluding the benefit of foreign currency movements
from H1FY15 the “underlying” growth of the business was strong:
- 15.7% underlying growth in revenue
- 15.3% underlying growth in NPAT
IDP EDUCATION | FY16 Half Year Results Presentation
* H1 FY15 financials are presented on a pro-forma basis consistent with the prospectus dated 12 November 2015. Adjustments to H1 FY15 statutory results as presented in the Appendix 4D are $0.5m for public company costs and $0.2m for net interest adjustment
145.8 156.9 181.6
11.1 24.7
H1 FY15 * Foreigncurrencyimpact
H1 FY15restated at
FY16 FX
Underlyingoperating
growth
H1 FY16
16.5 17.6
20.3
1.1 2.8
H1 FY15 * Foreigncurrencyimpact
H1 FY15restated at
FY16 FX
Underlyingoperating
growth
H1 FY16For
per
sona
l use
onl
y

108 178 0
231 110 21
0 121 194
229 25 55
0 172 169
128 128 128
216 255 159
246 197 160
(Highlight)
143 212 255
244 154 167
189 255 253
197 197 197
Primary Secondary PHOENIX2013\05 Presentations\2015.09 Management Presentation\Project Phoenix_IDP Management
Presentation_MASTER.pptx
Click to edit Master text styles
SECOND LEVEL
Third level
• Fourth level
- Fifth level
Outlook and
Investment Highlights
03 For
per
sona
l use
onl
y
108 178 0
231 110 21
0 121 194
229 25 55
0 172 169
128 128 128
216 255 159
246 197 160
(Highlight)
143 212 255
244 154 167
189 255 253
197 197 197
Primary Secondary PHOENIX2013\05 Presentations\2015.09 Management Presentation\Project Phoenix_IDP Management
Presentation_MASTER.pptx
Click to edit Master text styles
SECOND LEVEL
Third level
• Fourth level
- Fifth level
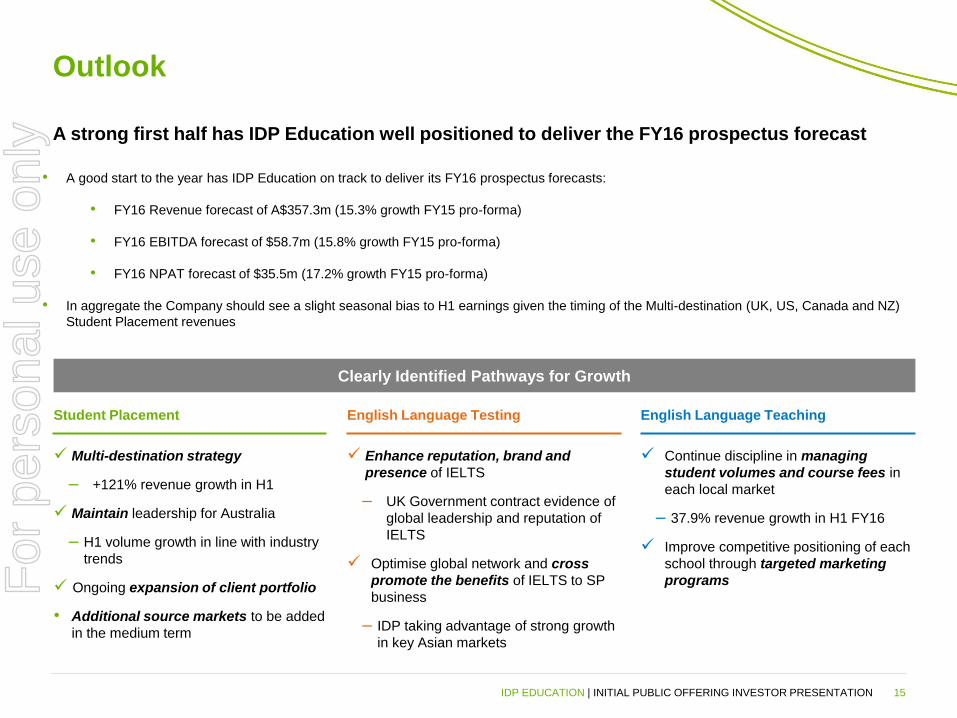
Outlook
Student Placement
Multi-destination strategy
‒ +121% revenue growth in H1
Maintain leadership for Australia
‒ H1 volume growth in line with industry
trends
Ongoing expansion of client portfolio
• Additional source markets to be added
in the medium term
English Language Testing
Enhance reputation, brand and
presence of IELTS
‒ UK Government contract evidence of
global leadership and reputation of
IELTS
Optimise global network and cross
promote the benefits of IELTS to SP
business
‒ IDP taking advantage of strong growth
in key Asian markets
English Language Teaching
Continue discipline in managing
student volumes and course fees in
each local market
‒ 37.9% revenue growth in H1 FY16
Improve competitive positioning of each
school through targeted marketing
programs
A strong first half has IDP Education well positioned to deliver the FY16 prospectus forecast
IDP EDUCATION | INITIAL PUBLIC OFFERING INVESTOR PRESENTATION 15
Clearly Identified Pathways for Growth
• A good start to the year has IDP Education on track to deliver its FY16 prospectus forecasts:
• FY16 Revenue forecast of A$357.3m (15.3% growth FY15 pro-forma)
• FY16 EBITDA forecast of $58.7m (15.8% growth FY15 pro-forma)
• FY16 NPAT forecast of $35.5m (17.2% growth FY15 pro-forma)
• In aggregate the Company should see a slight seasonal bias to H1 earnings given the timing of the Multi-destination (UK, US, Canada and NZ)
Student Placement revenues
For
per
sona
l use
onl
y
108 178 0
231 110 21
0 121 194
229 25 55
0 172 169
128 128 128
216 255 159
246 197 160
(Highlight)
143 212 255
244 154 167
189 255 253
197 197 197
Primary Secondary PHOENIX2013\05 Presentations\2015.09 Management Presentation\Project Phoenix_IDP Management
Presentation_MASTER.pptx
Click to edit Master text styles
SECOND LEVEL
Third level
• Fourth level
- Fifth level
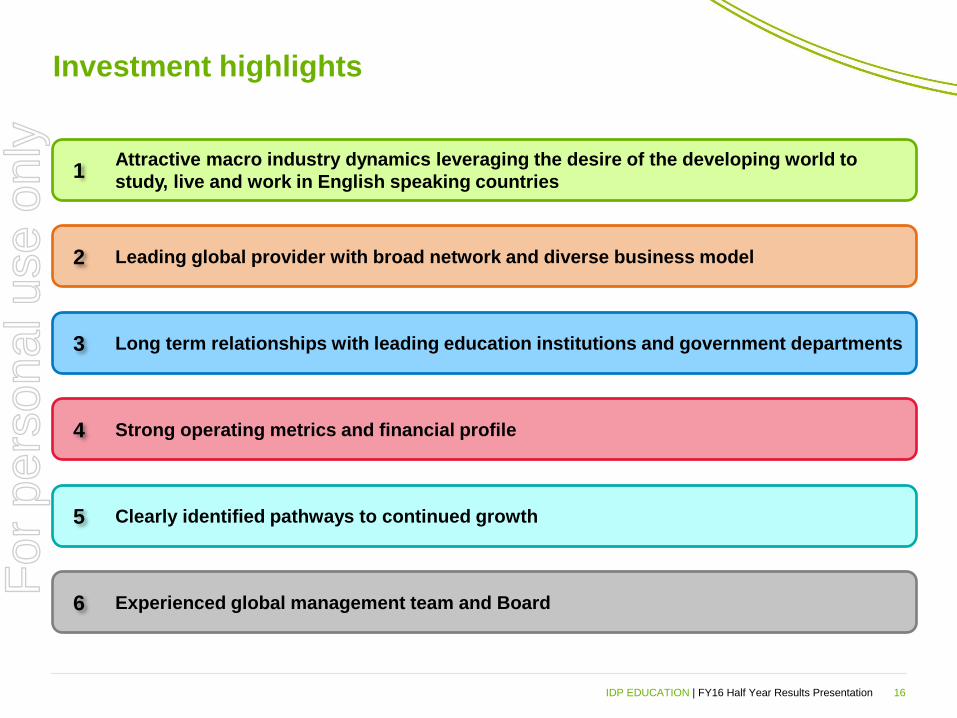
Investment highlights
16
Attractive macro industry dynamics leveraging the desire of the developing world to
study, live and work in English speaking countries
Leading global provider with broad network and diverse business model
Long term relationships with leading education institutions and government departments
Strong operating metrics and financial profile
Clearly identified pathways to continued growth
Experienced global management team and Board
1
2
3
4
5
6
IDP EDUCATION | FY16 Half Year Results Presentation
For
per
sona
l use
onl
y

108 178 0
231 110 21
0 121 194
229 25 55
0 172 169
128 128 128
216 255 159
246 197 160
(Highlight)
143 212 255
244 154 167
189 255 253
197 197 197
Primary Secondary PHOENIX2013\05 Presentations\2015.09 Management Presentation\Project Phoenix_IDP Management
Presentation_MASTER.pptx
Click to edit Master text styles
SECOND LEVEL
Third level
• Fourth level
- Fifth level
Overview of IDP Education
Appendix A For
per
sona
l use
onl
y
108 178 0
231 110 21
0 121 194
229 25 55
0 172 169
128 128 128
216 255 159
246 197 160
(Highlight)
143 212 255
244 154 167
189 255 253
197 197 197
Primary Secondary PHOENIX2013\05 Presentations\2015.09 Management Presentation\Project Phoenix_IDP Management
Presentation_MASTER.pptx
Click to edit Master text styles
SECOND LEVEL
Third level
• Fourth level
- Fifth level
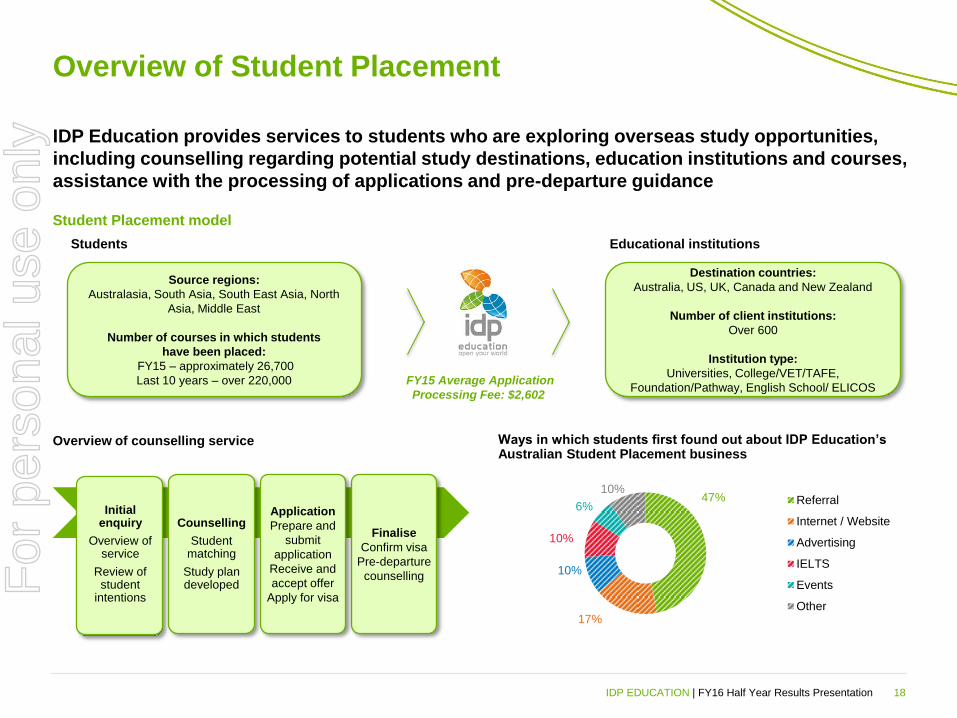
Overview of Student Placement
18
IDP Education provides services to students who are exploring overseas study opportunities,
including counselling regarding potential study destinations, education institutions and courses,
assistance with the processing of applications and pre-departure guidance
Student Placement model
Overview of counselling service
Source regions:
Australasia, South Asia, South East Asia, North
Asia, Middle East
Number of courses in which students
have been placed:
FY15 – approximately 26,700
Last 10 years – over 220,000
Destination countries:
Australia, US, UK, Canada and New Zealand
Number of client institutions:
Over 600
Institution type:
Universities, College/VET/TAFE,
Foundation/Pathway, English School/ ELICOS
Students Educational institutions
FY15 Average Application
Processing Fee: $2,602
Ways in which students first found out about IDP Education’s Australian Student Placement business
Initial enquiry
Overview of service
Review of student
intentions
Counselling
Student matching
Study plan developed
Finalise
Confirm visa
Pre-departure
counselling
Application
Prepare and
submit
application
Receive and
accept offer
Apply for visa
47%
17%
10%
10%
6%
10% Referral
Internet / Website
Advertising
IELTS
Events
Other
IDP EDUCATION | FY16 Half Year Results Presentation
For
per
sona
l use
onl
y
108 178 0
231 110 21
0 121 194
229 25 55
0 172 169
128 128 128
216 255 159
246 197 160
(Highlight)
143 212 255
244 154 167
189 255 253
197 197 197
Primary Secondary PHOENIX2013\05 Presentations\2015.09 Management Presentation\Project Phoenix_IDP Management
Presentation_MASTER.pptx
Click to edit Master text styles
SECOND LEVEL
Third level
• Fourth level
- Fifth level
0
1
2
3
199
5
199
6
199
7
199
8
199
9
200
0
200
1
200
2
200
3
200
4
200
5
200
6
200
7
200
8
200
9
201
0
201
1
201
2
201
3
201
4
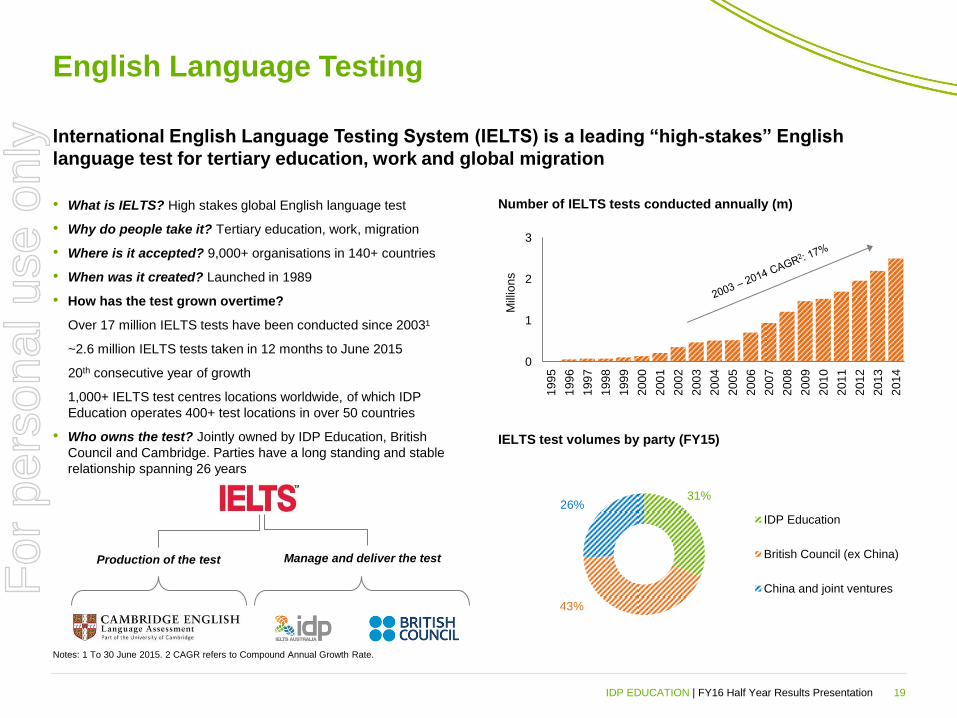
English Language Testing
• What is IELTS? High stakes global English language test
• Why do people take it? Tertiary education, work, migration
• Where is it accepted? 9,000+ organisations in 140+ countries
• When was it created? Launched in 1989
• How has the test grown overtime?
Over 17 million IELTS tests have been conducted since 2003¹
~2.6 million IELTS tests taken in 12 months to June 2015
20th consecutive year of growth
1,000+ IELTS test centres locations worldwide, of which IDP
Education operates 400+ test locations in over 50 countries
• Who owns the test? Jointly owned by IDP Education, British
Council and Cambridge. Parties have a long standing and stable
relationship spanning 26 years
International English Language Testing System (IELTS) is a leading “high-stakes” English
language test for tertiary education, work and global migration
Number of IELTS tests conducted annually (m)
IELTS test volumes by party (FY15)
Mill
ion
s
19
Manage and deliver the test Production of the test
Notes: 1 To 30 June 2015. 2 CAGR refers to Compound Annual Growth Rate.
31%
43%
26%
IDP Education
British Council (ex China)
China and joint ventures
IDP EDUCATION | FY16 Half Year Results Presentation
For
per
sona
l use
onl
y
108 178 0
231 110 21
0 121 194
229 25 55
0 172 169
128 128 128
216 255 159
246 197 160
(Highlight)
143 212 255
244 154 167
189 255 253
197 197 197
Primary Secondary PHOENIX2013\05 Presentations\2015.09 Management Presentation\Project Phoenix_IDP Management
Presentation_MASTER.pptx
Click to edit Master text styles
SECOND LEVEL
Third level
• Fourth level
- Fifth level
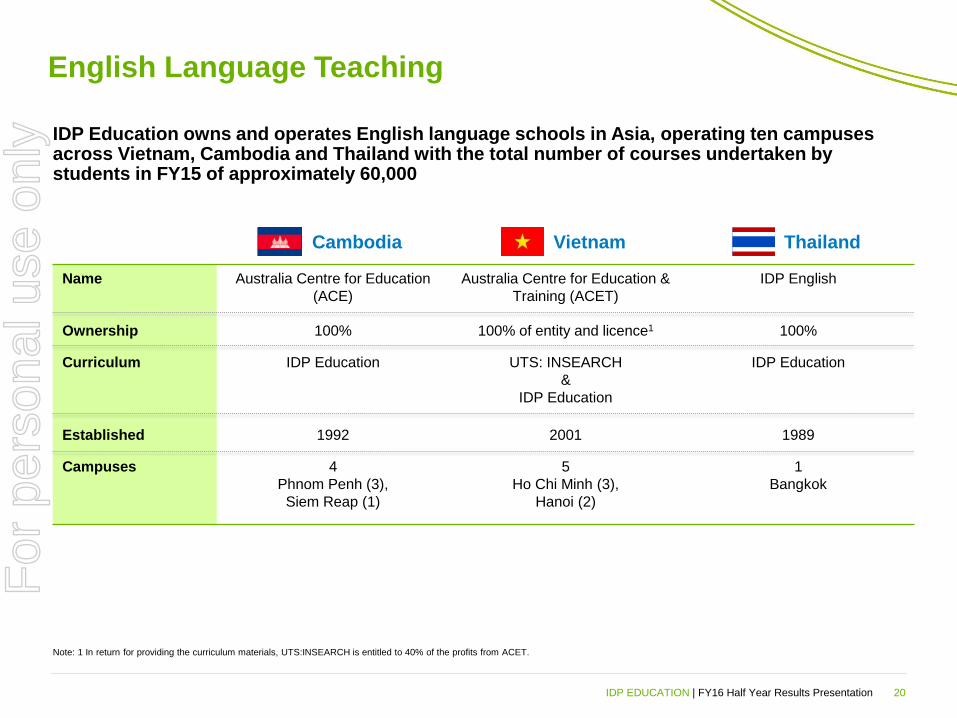
English Language Teaching
20
IDP Education owns and operates English language schools in Asia, operating ten campuses across Vietnam, Cambodia and Thailand with the total number of courses undertaken by students in FY15 of approximately 60,000
Note: 1 In return for providing the curriculum materials, UTS:INSEARCH is entitled to 40% of the profits from ACET.
Cambodia Vietnam Thailand
Name Australia Centre for Education
(ACE)
Australia Centre for Education &
Training (ACET)
IDP English
Ownership 100% 100% of entity and licence1 100%
Curriculum IDP Education UTS: INSEARCH
&
IDP Education
IDP Education
Established 1992 2001 1989
Campuses 4
Phnom Penh (3),
Siem Reap (1)
5
Ho Chi Minh (3),
Hanoi (2)
1
Bangkok
IDP EDUCATION | FY16 Half Year Results Presentation
For
per
sona
l use
onl
y
108 178 0
231 110 21
0 121 194
229 25 55
0 172 169
128 128 128
216 255 159
246 197 160
(Highlight)
143 212 255
244 154 167
189 255 253
197 197 197
Primary Secondary PHOENIX2013\05 Presentations\2015.09 Management Presentation\Project Phoenix_IDP Management
Presentation_MASTER.pptx
Click to edit Master text styles
SECOND LEVEL
Third level
• Fourth level
- Fifth level
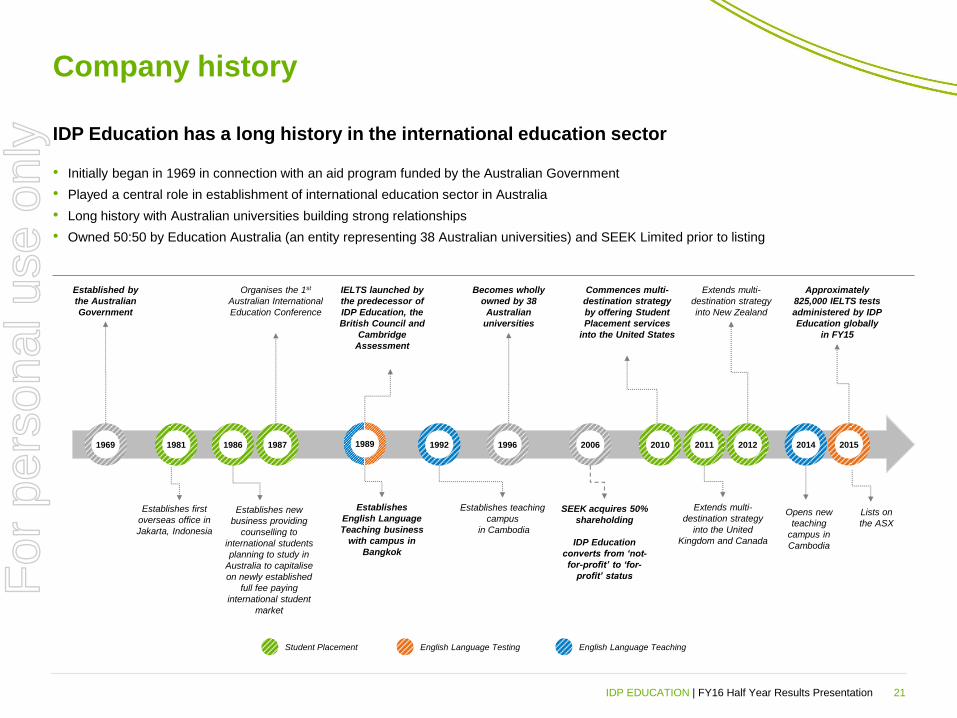
Company history
21
• Initially began in 1969 in connection with an aid program funded by the Australian Government
• Played a central role in establishment of international education sector in Australia
• Long history with Australian universities building strong relationships
• Owned 50:50 by Education Australia (an entity representing 38 Australian universities) and SEEK Limited prior to listing
IDP Education has a long history in the international education sector
1986 1969 1987 1992 1996 2006 2010 2012 2011 1981
Extends multi-
destination strategy
into New Zealand
Commences multi-
destination strategy
by offering Student
Placement services
into the United States
Extends multi-
destination strategy
into the United
Kingdom and Canada
SEEK acquires 50%
shareholding
IDP Education
converts from ‘not-
for-profit’ to ‘for-
profit’ status
Becomes wholly
owned by 38
Australian
universities
Establishes teaching
campus
in Cambodia
IELTS launched by
the predecessor of
IDP Education, the
British Council and
Cambridge
Assessment
Establishes
English Language
Teaching business
with campus in
Bangkok
Organises the 1st
Australian International
Education Conference
Establishes new
business providing
counselling to
international students
planning to study in
Australia to capitalise
on newly established
full fee paying
international student
market
Establishes first
overseas office in
Jakarta, Indonesia
Established by
the Australian
Government
Student Placement English Language Testing English Language Teaching
Opens new
teaching
campus in
Cambodia
Approximately
825,000 IELTS tests
administered by IDP
Education globally
in FY15
2014 2015 1989
IDP EDUCATION | FY16 Half Year Results Presentation
Lists on
the ASX
For
per
sona
l use
onl
y

108 178 0
231 110 21
0 121 194
229 25 55
0 172 169
128 128 128
216 255 159
246 197 160
(Highlight)
143 212 255
244 154 167
189 255 253
197 197 197
Primary Secondary PHOENIX2013\05 Presentations\2015.09 Management Presentation\Project Phoenix_IDP Management
Presentation_MASTER.pptx
Click to edit Master text styles
SECOND LEVEL
Third level
• Fourth level
- Fifth level
Additional information
Appendix B For
per
sona
l use
onl
y
108 178 0
231 110 21
0 121 194
229 25 55
0 172 169
128 128 128
216 255 159
246 197 160
(Highlight)
143 212 255
244 154 167
189 255 253
197 197 197
Primary Secondary PHOENIX2013\05 Presentations\2015.09 Management Presentation\Project Phoenix_IDP Management
Presentation_MASTER.pptx
Click to edit Master text styles
SECOND LEVEL
Third level
• Fourth level
- Fifth level
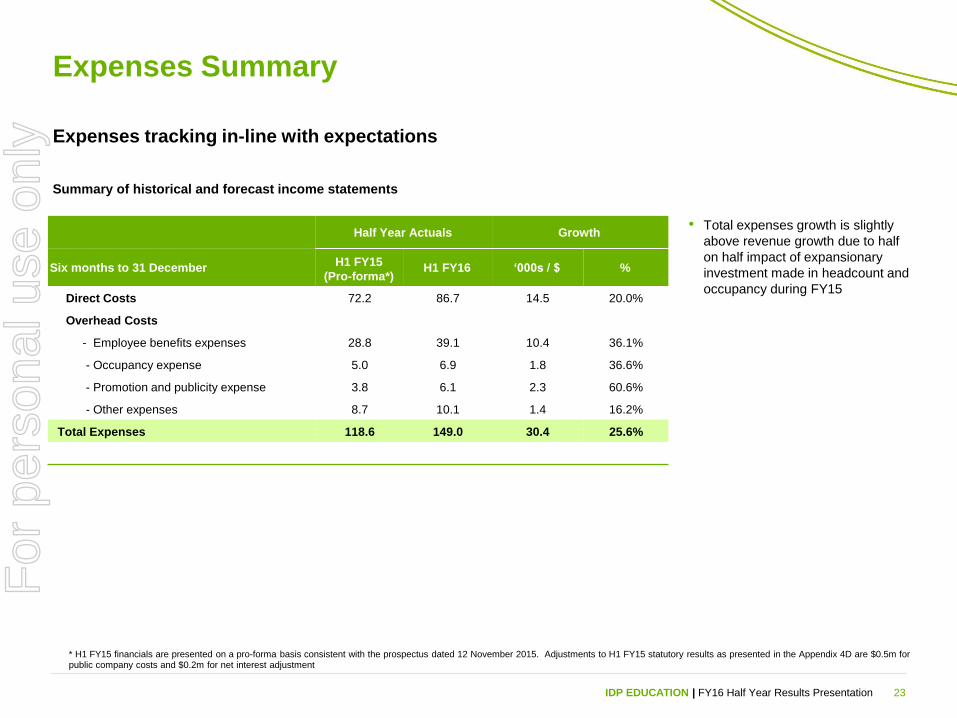
Expenses Summary
Expenses tracking in-line with expectations
Summary of historical and forecast income statements
23 IDP EDUCATION | FY16 Half Year Results Presentation
Half Year Actuals Growth
Six months to 31 December
H1 FY15
(Pro-forma*)
H1 FY16 ‘000s / $ %
Direct Costs 72.2 86.7 14.5 20.0%
Overhead Costs
- Employee benefits expenses 28.8 39.1 10.4 36.1%
- Occupancy expense 5.0 6.9 1.8 36.6%
- Promotion and publicity expense 3.8 6.1 2.3 60.6%
- Other expenses 8.7 10.1 1.4 16.2%
Total Expenses 118.6 149.0 30.4 25.6%
* H1 FY15 financials are presented on a pro-forma basis consistent with the prospectus dated 12 November 2015. Adjustments to H1 FY15 statutory results as presented in the Appendix 4D are $0.5m for public company costs and $0.2m for net interest adjustment
• Total expenses growth is slightly
above revenue growth due to half
on half impact of expansionary
investment made in headcount and
occupancy during FY15
For
per
sona
l use
onl
y
108 178 0
231 110 21
0 121 194
229 25 55
0 172 169
128 128 128
216 255 159
246 197 160
(Highlight)
143 212 255
244 154 167
189 255 253
197 197 197
Primary Secondary PHOENIX2013\05 Presentations\2015.09 Management Presentation\Project Phoenix_IDP Management
Presentation_MASTER.pptx
Click to edit Master text styles
SECOND LEVEL
Third level
• Fourth level
- Fifth level
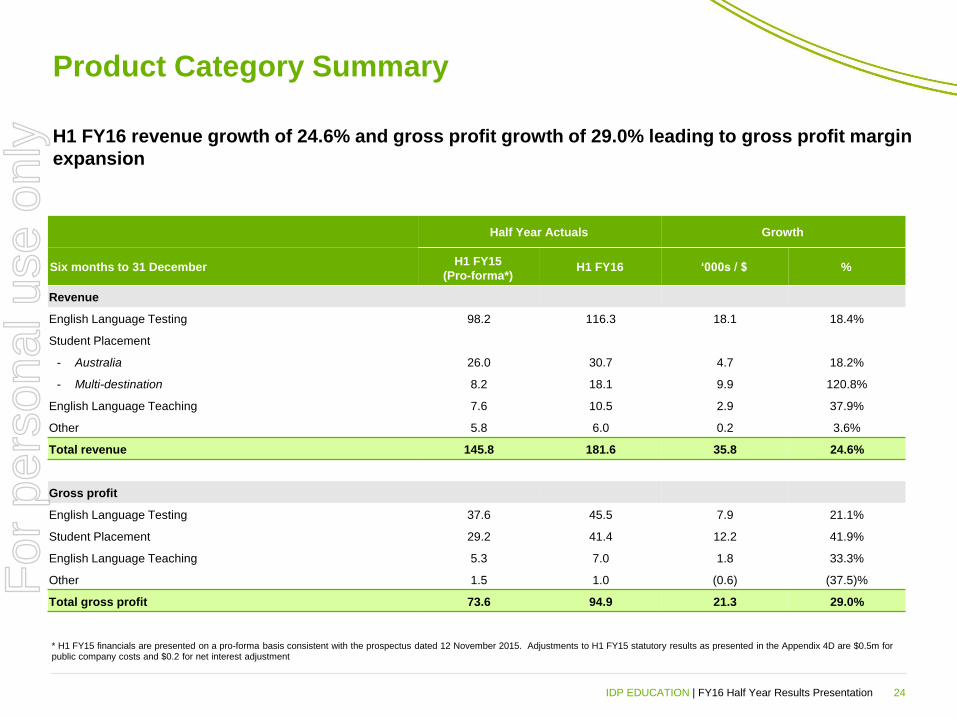
Product Category Summary
24
H1 FY16 revenue growth of 24.6% and gross profit growth of 29.0% leading to gross profit margin
expansion
IDP EDUCATION | FY16 Half Year Results Presentation
Half Year Actuals Growth
Six months to 31 December
H1 FY15
(Pro-forma*)
H1 FY16 ‘000s / $ %
Revenue
English Language Testing 98.2 116.3 18.1 18.4%
Student Placement
- Australia 26.0 30.7 4.7 18.2%
- Multi-destination 8.2 18.1 9.9 120.8%
English Language Teaching 7.6 10.5 2.9 37.9%
Other 5.8 6.0 0.2 3.6%
Total revenue 145.8 181.6 35.8 24.6%
Gross profit
English Language Testing 37.6 45.5 7.9 21.1%
Student Placement 29.2 41.4 12.2 41.9%
English Language Teaching 5.3 7.0 1.8 33.3%
Other 1.5 1.0 (0.6) (37.5)%
Total gross profit 73.6 94.9 21.3 29.0%
* H1 FY15 financials are presented on a pro-forma basis consistent with the prospectus dated 12 November 2015. Adjustments to H1 FY15 statutory results as presented in the Appendix 4D are $0.5m for public company costs and $0.2 for net interest adjustment
For
per
sona
l use
onl
y
108 178 0
231 110 21
0 121 194
229 25 55
0 172 169
128 128 128
216 255 159
246 197 160
(Highlight)
143 212 255
244 154 167
189 255 253
197 197 197
Primary Secondary PHOENIX2013\05 Presentations\2015.09 Management Presentation\Project Phoenix_IDP Management
Presentation_MASTER.pptx
Click to edit Master text styles
SECOND LEVEL
Third level
• Fourth level
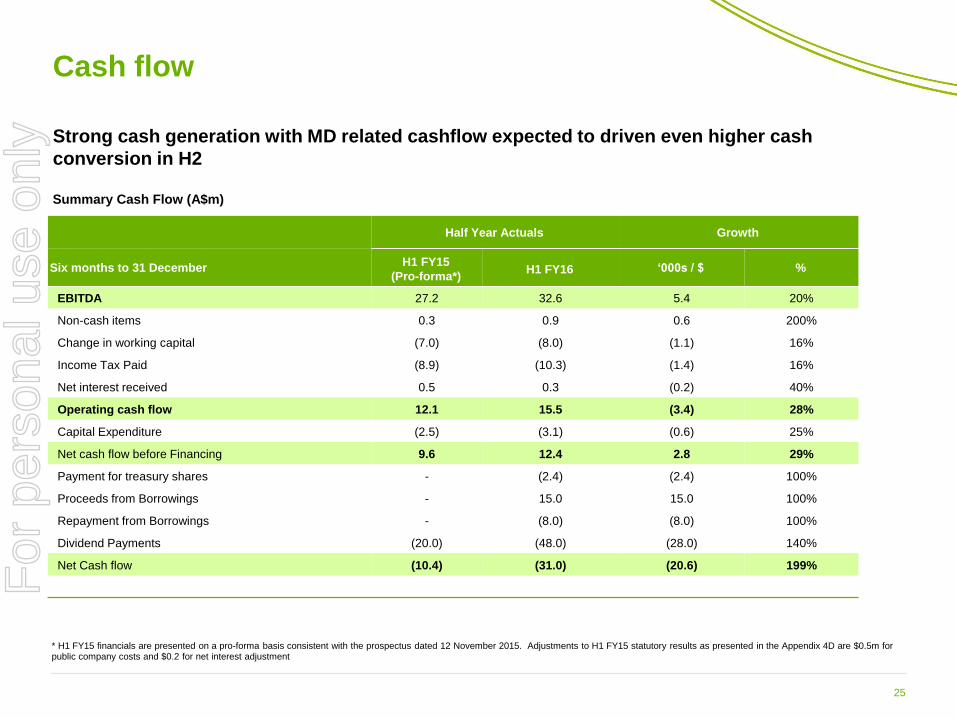
- Fifth level Half Year Actuals Growth
Six months to 31 December
H1 FY15
(Pro-forma*)
H1 FY16 ‘000s / $ %
EBITDA 27.2 32.6 5.4 20%
Non-cash items 0.3 0.9 0.6 200%
Change in working capital (7.0) (8.0) (1.1) 16%
Income Tax Paid (8.9) (10.3) (1.4) 16%
Net interest received 0.5 0.3 (0.2) 40%
Operating cash flow 12.1 15.5 (3.4) 28%
Capital Expenditure (2.5) (3.1) (0.6) 25%
Net cash flow before Financing 9.6 12.4 2.8 29%
Payment for treasury shares - (2.4) (2.4) 100%
Proceeds from Borrowings - 15.0 15.0 100%
Repayment from Borrowings - (8.0) (8.0) 100%
Dividend Payments (20.0) (48.0) (28.0) 140%
Net Cash flow (10.4) (31.0) (20.6) 199%
Cash flow
Strong cash generation with MD related cashflow expected to driven even higher cash
conversion in H2
25
Summary Cash Flow (A$m)
* H1 FY15 financials are presented on a pro-forma basis consistent with the prospectus dated 12 November 2015. Adjustments to H1 FY15 statutory results as presented in the Appendix 4D are $0.5m for public company costs and $0.2 for net interest adjustment
For
per
sona
l use
onl
y
108 178 0
231 110 21
0 121 194
229 25 55
0 172 169
128 128 128
216 255 159
246 197 160
(Highlight)
143 212 255
244 154 167
189 255 253
197 197 197
Primary Secondary PHOENIX2013\05 Presentations\2015.09 Management Presentation\Project Phoenix_IDP Management
Presentation_MASTER.pptx
Click to edit Master text styles
SECOND LEVEL
Third level
• Fourth level
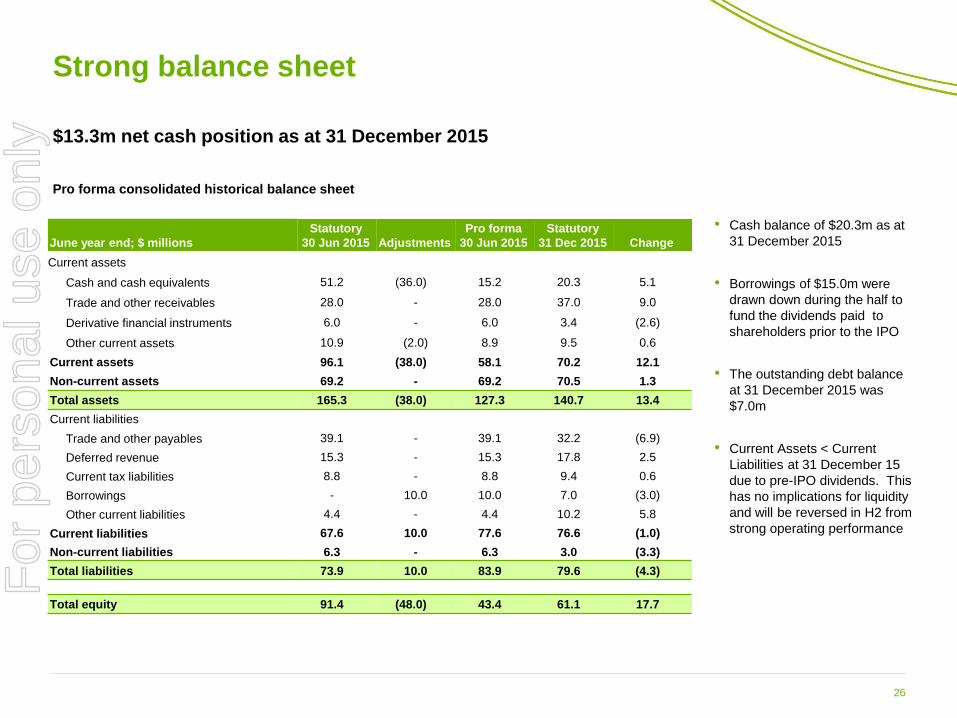
- Fifth level June year end; $ millions
Statutory
30 Jun 2015 Adjustments
Pro forma
30 Jun 2015
Statutory
31 Dec 2015 Change
Current assets
Cash and cash equivalents 51.2 (36.0) 15.2 20.3 5.1
Trade and other receivables 28.0 - 28.0 37.0 9.0
Derivative financial instruments 6.0 - 6.0 3.4 (2.6)
Other current assets 10.9 (2.0) 8.9 9.5 0.6
Current assets 96.1 (38.0) 58.1 70.2 12.1
Non-current assets 69.2 - 69.2 70.5 1.3
Total assets 165.3 (38.0) 127.3 140.7 13.4
Current liabilities
Trade and other payables 39.1 - 39.1 32.2 (6.9)
Deferred revenue 15.3 - 15.3 17.8 2.5
Current tax liabilities 8.8 - 8.8 9.4 0.6
Borrowings - 10.0 10.0 7.0 (3.0)
Other current liabilities 4.4 - 4.4 10.2 5.8
Current liabilities 67.6 10.0 77.6 76.6 (1.0)
Non-current liabilities 6.3 - 6.3 3.0 (3.3)
Total liabilities 73.9 10.0 83.9 79.6 (4.3)
Total equity 91.4 (48.0) 43.4 61.1 17.7
Strong balance sheet
$13.3m net cash position as at 31 December 2015
26
Pro forma consolidated historical balance sheet
• Cash balance of $20.3m as at
31 December 2015
• Borrowings of $15.0m were
drawn down during the half to
fund the dividends paid to
shareholders prior to the IPO
• The outstanding debt balance
at 31 December 2015 was
$7.0m
• Current Assets < Current
Liabilities at 31 December 15
due to pre-IPO dividends. This
has no implications for liquidity
and will be reversed in H2 from
strong operating performance
For
per
sona
l use
onl
y