Embed Size (px)
Citation preview

Project SchedulingProject Scheduling
Probabilistic PERT
PERT Probability Approach to PERT Probability Approach to Project SchedulingProject Scheduling
• Activity completion times are seldom known with cetainty.
• PERTPERT is a technique that treats activity completion times as random variables.
• Completion time estimates can be estimated using the Three Time Three Time Estimate approachEstimate approach. In this approach, three time estimates are required for each activity:
– Results from statistical studies– Subjective best estimates
a = an optimistic time to perform the activity P(Finish < a) < .01
m = the most likely time to perform the activity (mode)
b = a pessimistic time to perform the activity P(Finish > b) < .01
3-Time Estimate Approach3-Time Estimate ApproachProbability DistributionProbability Distribution
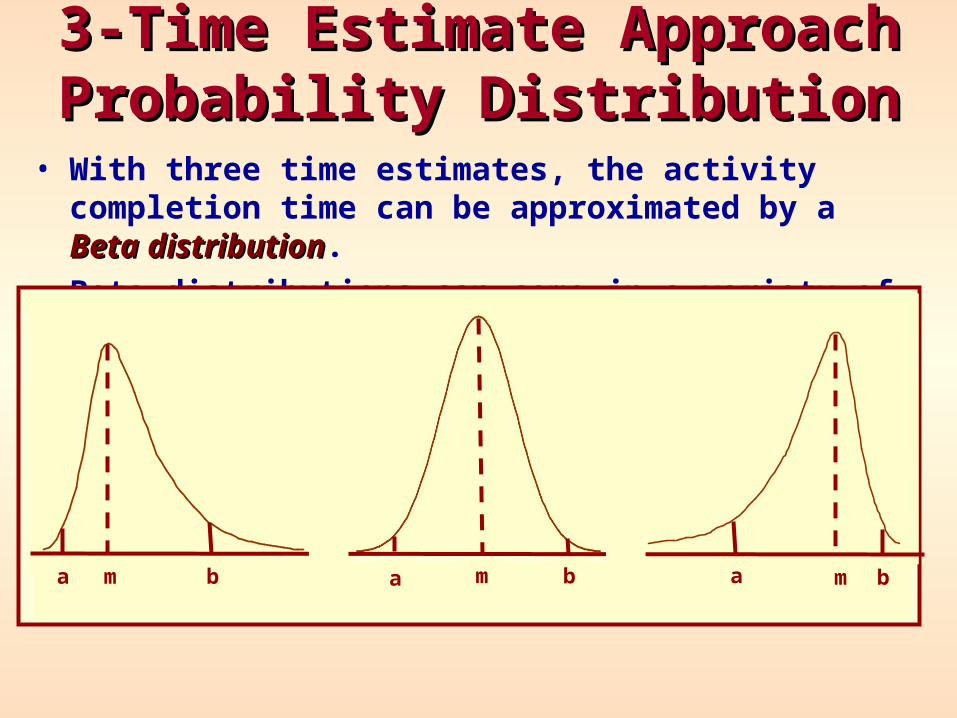
• With three time estimates, the activity completion time can be approximated by a Beta distributionBeta distribution.
• Beta distributions can come in a variety of shapes:
a m b ba mm a b
Mean and Standard Deviation forMean and Standard Deviation forActivity Completion TimesActivity Completion Times
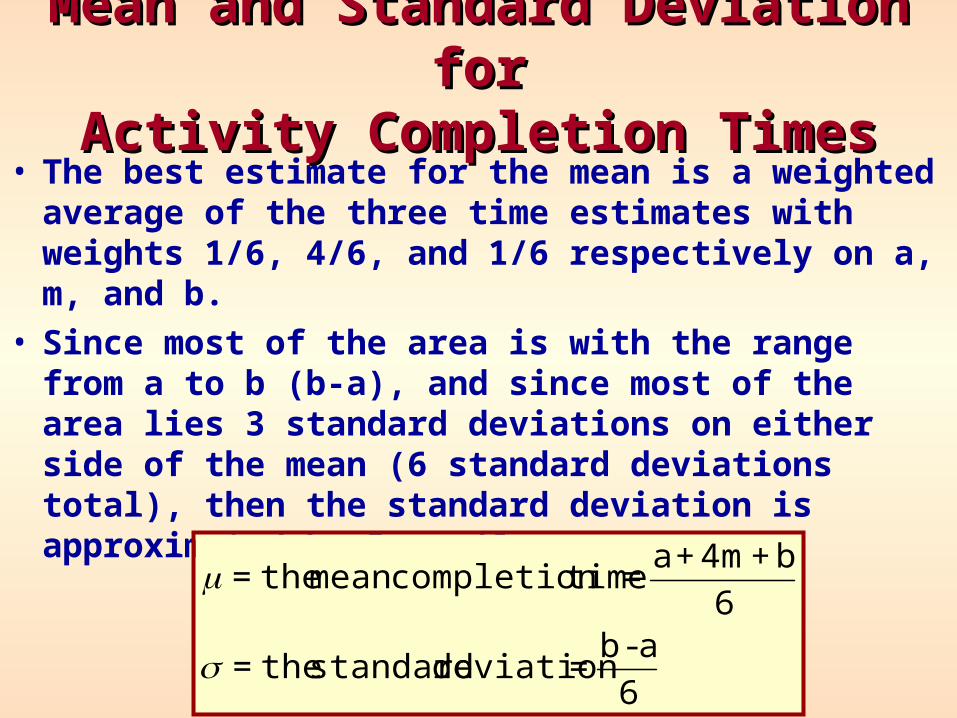
• The best estimate for the mean is a weighted average of the three time estimates with weights 1/6, 4/6, and 1/6 respectively on a, m, and b.
• Since most of the area is with the range from a to b (b-a), and since most of the area lies 3 standard deviations on either side of the mean (6 standard deviations total), then the standard deviation is approximated by Range/6.
6
a-b=deviation standard the=
6
b+4m+a= timecompletionmean the=
• Assumption 2– There are enough activities on the critical path so that
the distribution of the overall project completion time can be approximated by the normal distribution.
PERT AssumptionsPERT Assumptions
• Assumption 1– A critical path can be determined by using the mean
completion times for the activities. – The project mean completion time is determined solely
by the completion time of the activities on the critical path.
• Assumption 3– The time to complete one activity is independent of the
completion time of any other activity.

The three assumptions imply that the
overall project completion time is normally
distributed, with:
The Project Completion Time The Project Completion Time DistributionDistribution
= Sum of the = Sum of the ’s ’s on the critical pathon the critical path
22 = Sum of the = Sum of the 2 2 ’s ’s on the critical pathon the critical path
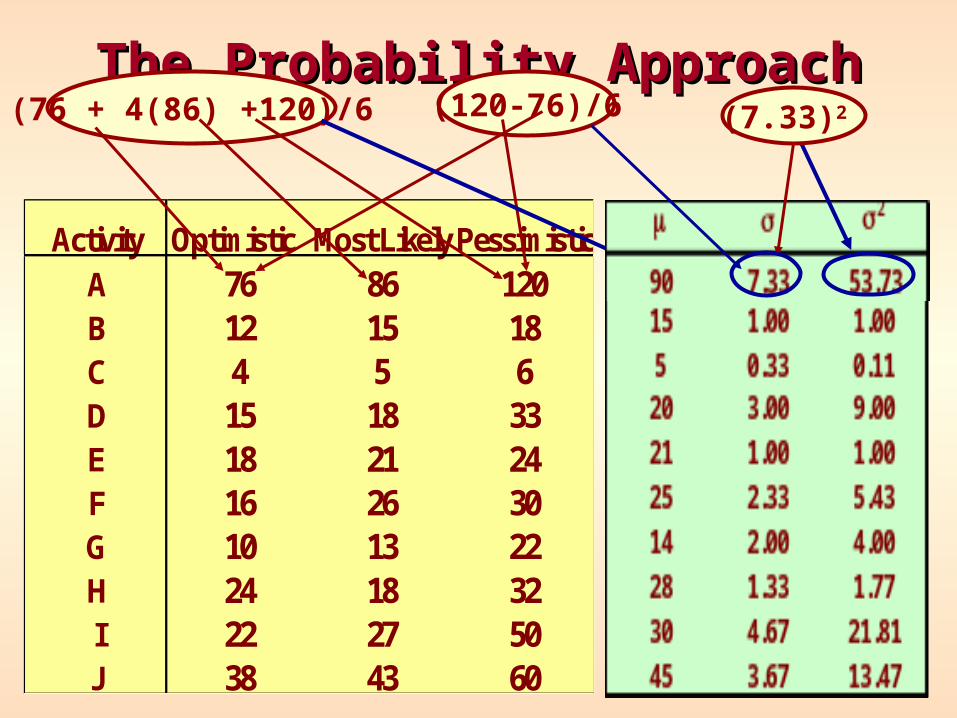
Activity Optimistic Most Likely PessimisticA 76 86 120B 12 15 18C 4 5 6D 15 18 33E 18 21 24F 16 26 30G 10 13 22H 24 18 32I 22 27 50J 38 43 60
The Probability ApproachThe Probability Approach(76 + 4(86) +120)/6 (120-76)/6
90 7.33 53.7315 1.00 1.005 0.33 0.1120 3.00 9.0021 1.00 1.0025 2.33 5.4314 2.00 4.0028 1.33 1.7730 4.67 21.8145 3.67 13.47
(7.33)2

Distribution For Klone ComputersDistribution For Klone Computers
• The project has a normal distribution.• The critical path is A-F-G-D-J.
45 20 14 25 90
μμμμμμ JDGFA
194194
13.44 9 4 5.44 53.78
σσσσσσ 2J
2D
2G
2F
2A
2
85.6685.66
85.66σσ 2 9.2559.255
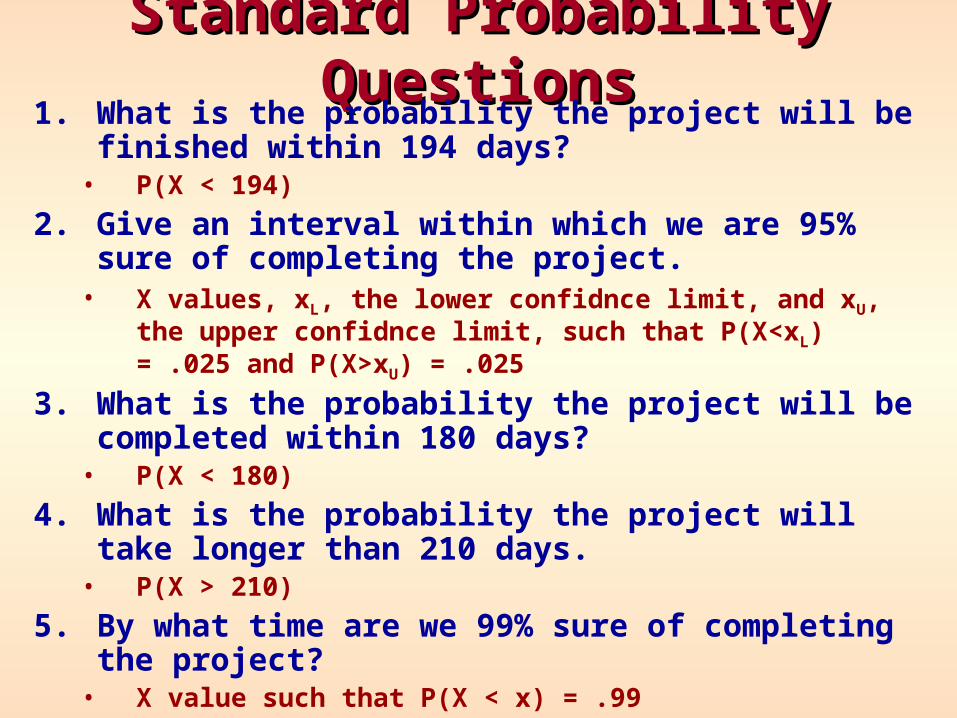
Standard Probability QuestionsStandard Probability Questions1. What is the probability the project will be finished
within 194 days? • P(X < 194)
2. Give an interval within which we are 95% sure of completing the project.
• X values, xL, the lower confidnce limit, and xU, the upper confidnce limit, such that P(X<xL) = .025 and P(X>xU) = .025
3. What is the probability the project will be completed within 180 days?
• P(X < 180)
4. What is the probability the project will take longer than 210 days.
• P(X > 210)
5. By what time are we 99% sure of completing the project?
• X value such that P(X < x) = .99
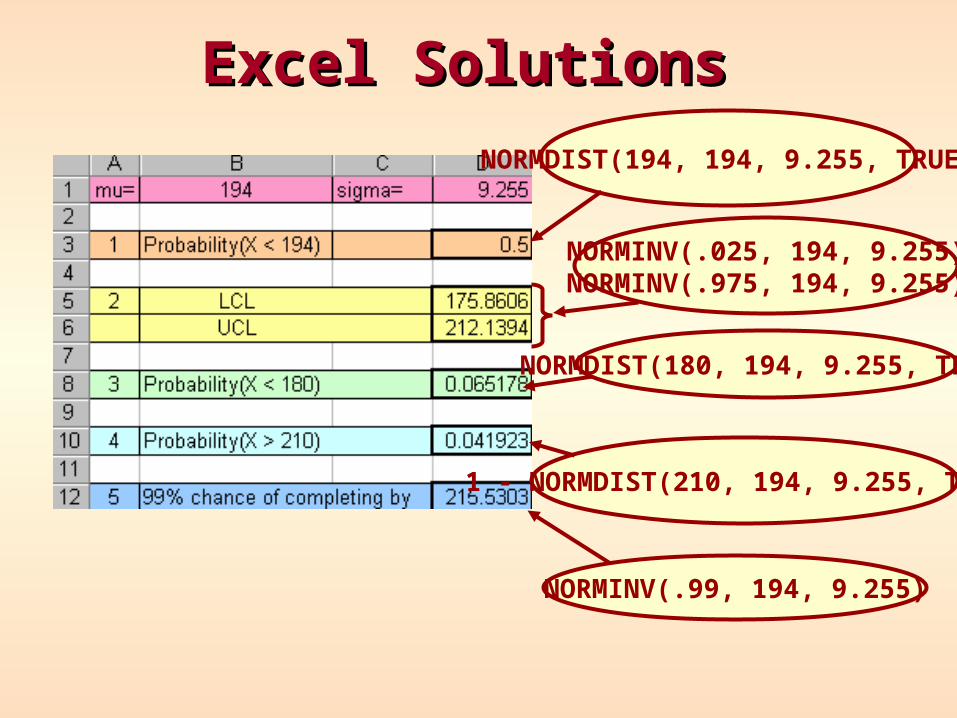
Excel SolutionsExcel Solutions
NORMDIST(194, 194, 9.255, TRUE)
NORMINV(.025, 194, 9.255)NORMINV(.975, 194, 9.255)
NORMDIST(180, 194, 9.255, TRUE)
1 - NORMDIST(210, 194, 9.255, TRUE)
NORMINV(.99, 194, 9.255)

Using the PERT-CPM Template for Using the PERT-CPM Template for Probabilistic ModelsProbabilistic Models
• Instead of calculating µ and by hand, the Excel template may be used.
• Instead of entering data in the µ and columns, input the estimates for a, m , and b into columns C, D, and E.– The template does all the required
calculations– After the problem has been solved,
probability analyses may be performed.
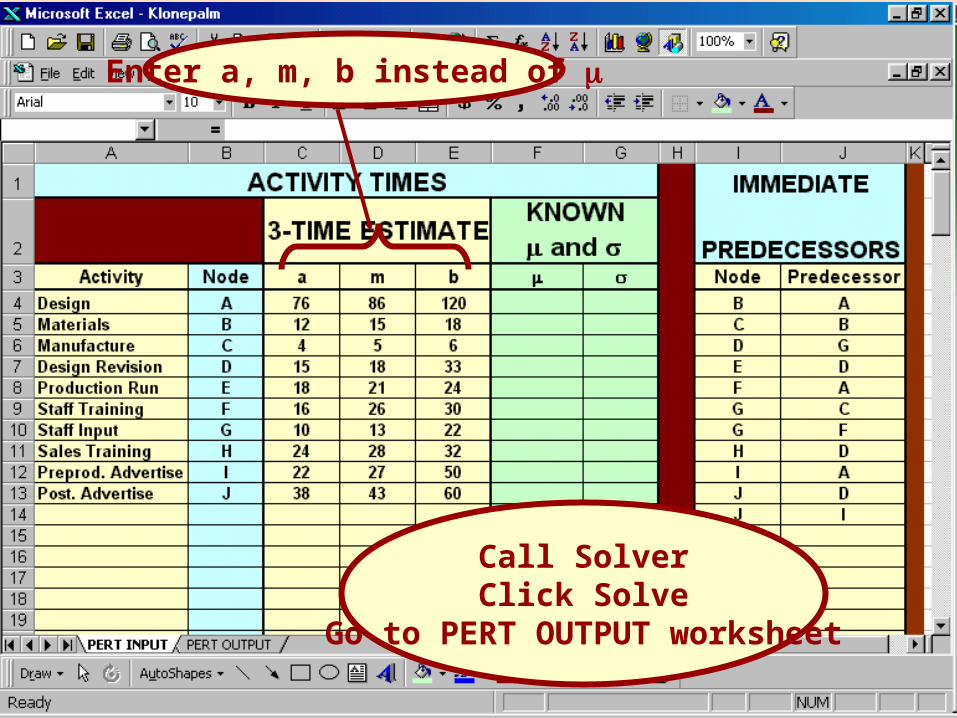
Enter a, m, b instead of
Call SolverClick Solve
Go to PERT OUTPUT worksheet
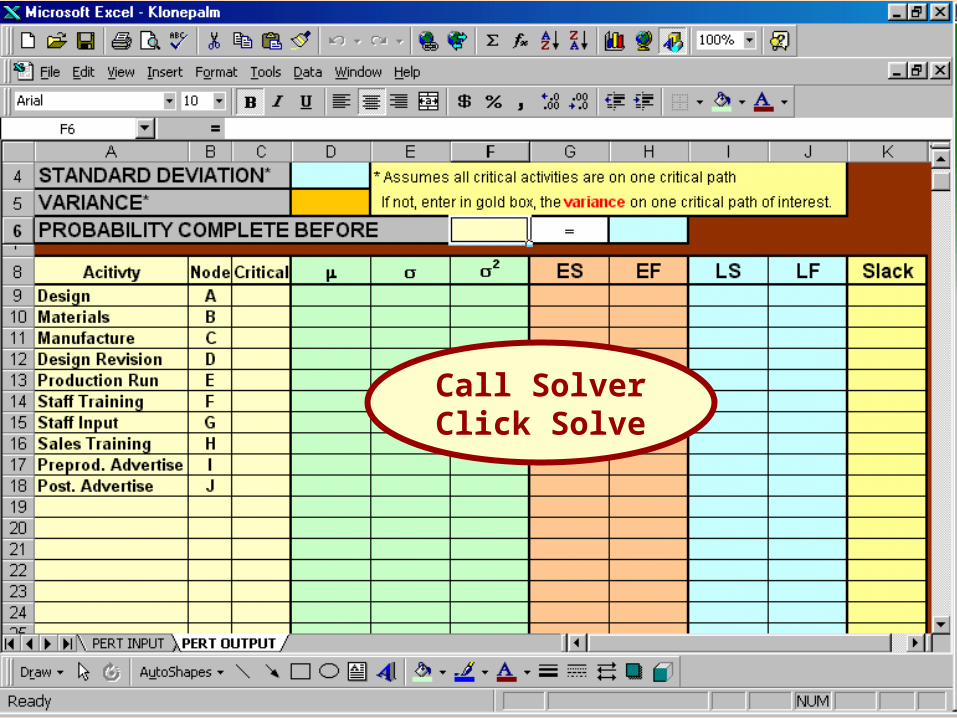
Call SolverClick Solve
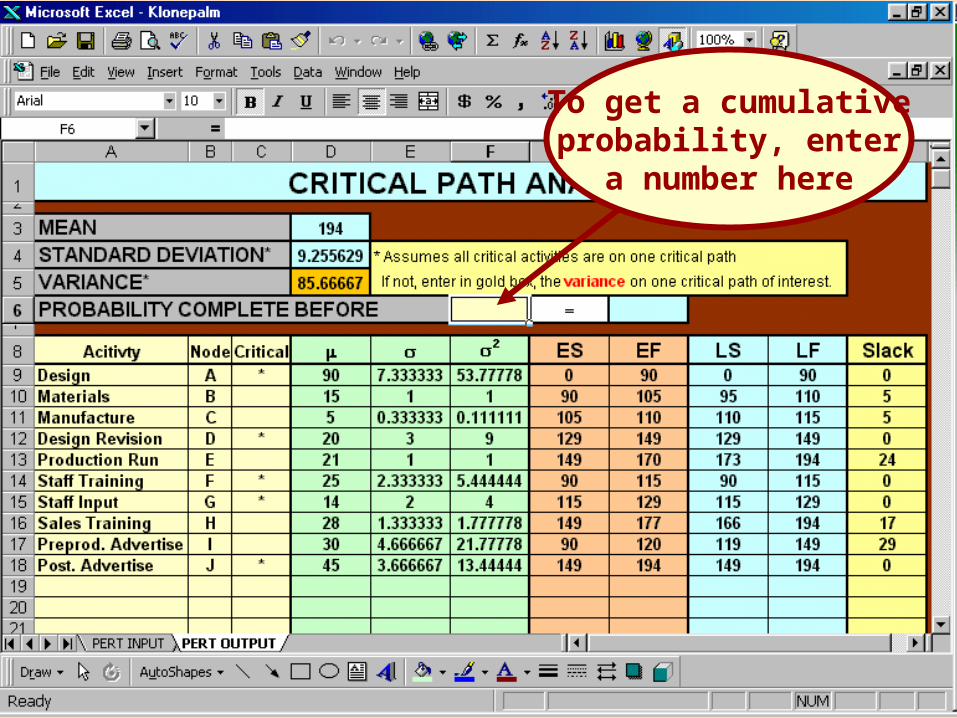
To get a cumulativeprobability, enter
a number here
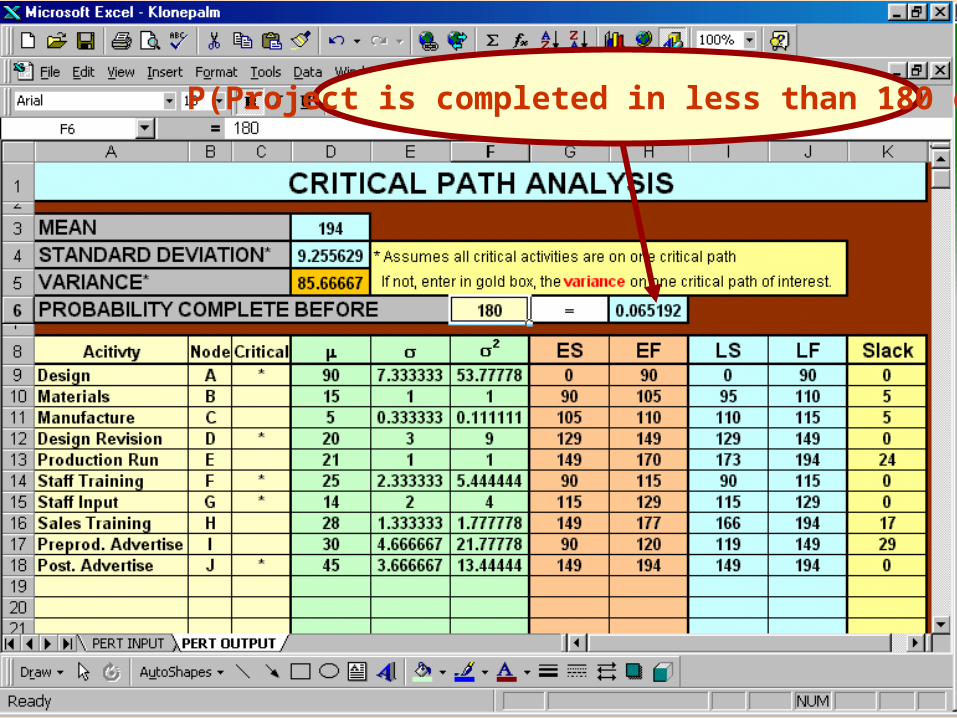
P(Project is completed in less than 180 days)

Cost Analysis Using theCost Analysis Using theExpected Value ApproachExpected Value Approach
• Spending extra money, in general should decrease project duration.
• But is this operation cost effective?
• The expected value criterion can be used as a guide for answering this question.
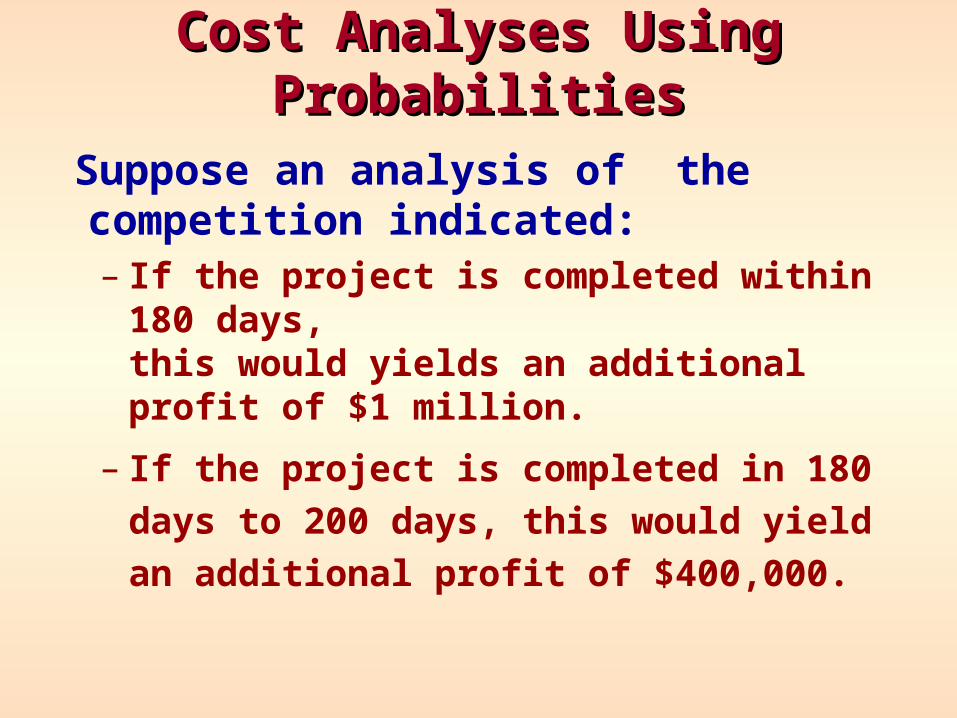
Suppose an analysis of the competition indicated:– If the project is completed within 180 days,
this would yields an additional profit of $1 million.
– If the project is completed in 180 days to
200 days, this would yield an additional
profit of $400,000.
Cost Analyses Using ProbabilitiesCost Analyses Using Probabilities
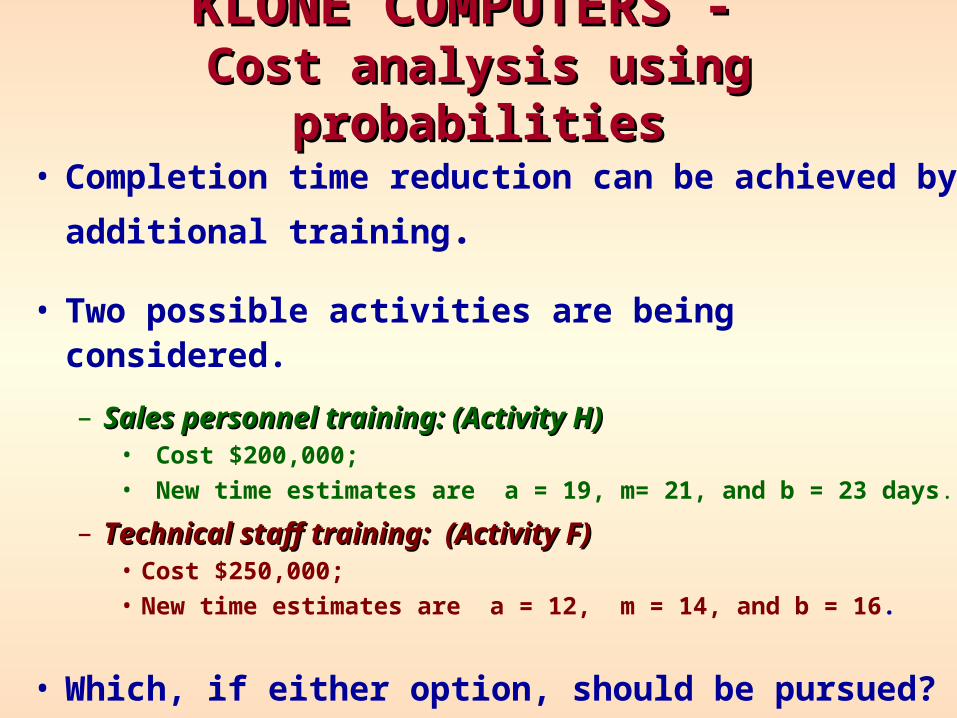
• Completion time reduction can be achieved by
additional training.
• Two possible activities are being considered.
– Sales personnel training: (Activity H)Sales personnel training: (Activity H)• Cost $200,000; • New time estimates are a = 19, m= 21, and b = 23 days.
– Technical staff training: (Activity F)Technical staff training: (Activity F)• Cost $250,000; • New time estimates are a = 12, m = 14, and b = 16.
• Which, if either option, should be pursued?
KLONE COMPUTERS - KLONE COMPUTERS - Cost analysis using probabilitiesCost analysis using probabilities
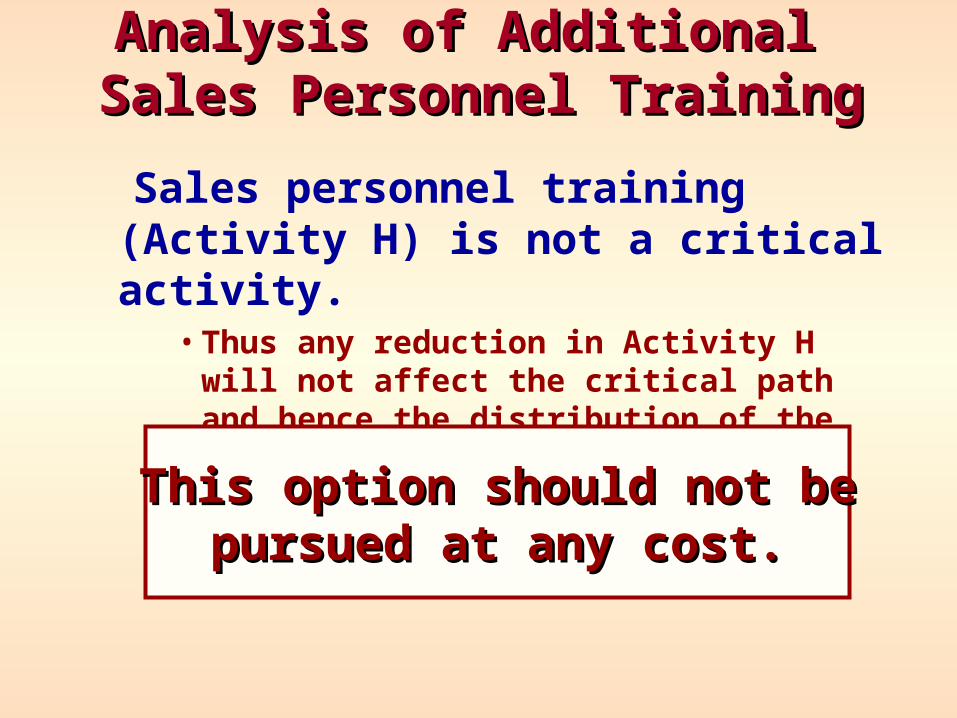
Sales personnel training (Activity H) is not a critical activity.
• Thus any reduction in Activity H will not affect the critical path and hence the distribution of the project completion time.
Analysis of Additional Analysis of Additional Sales Personnel TrainingSales Personnel Training
This option should not beThis option should not bepursued at any cost.pursued at any cost.
Analysis of Additional Analysis of Additional Technical Staff TrainingTechnical Staff Training
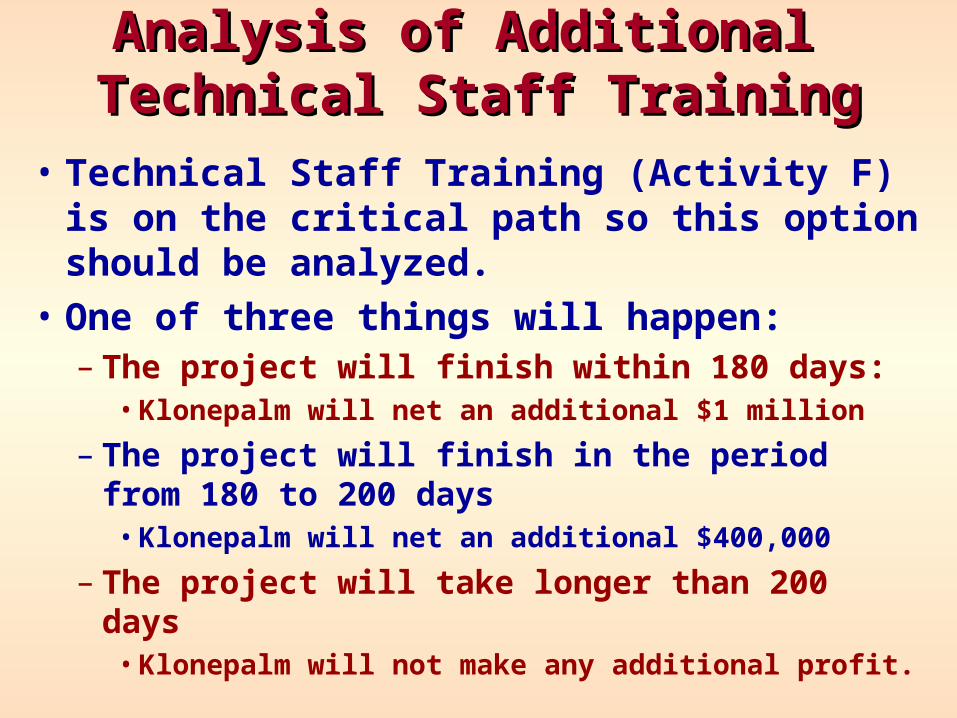
• Technical Staff Training (Activity F) is on the critical path so this option should be analyzed.
• One of three things will happen:– The project will finish within 180 days:
• Klonepalm will net an additional $1 million
– The project will finish in the period from 180 to 200 days
• Klonepalm will net an additional $400,000
– The project will take longer than 200 days• Klonepalm will not make any additional profit.
The Expected Value ApproachThe Expected Value Approach
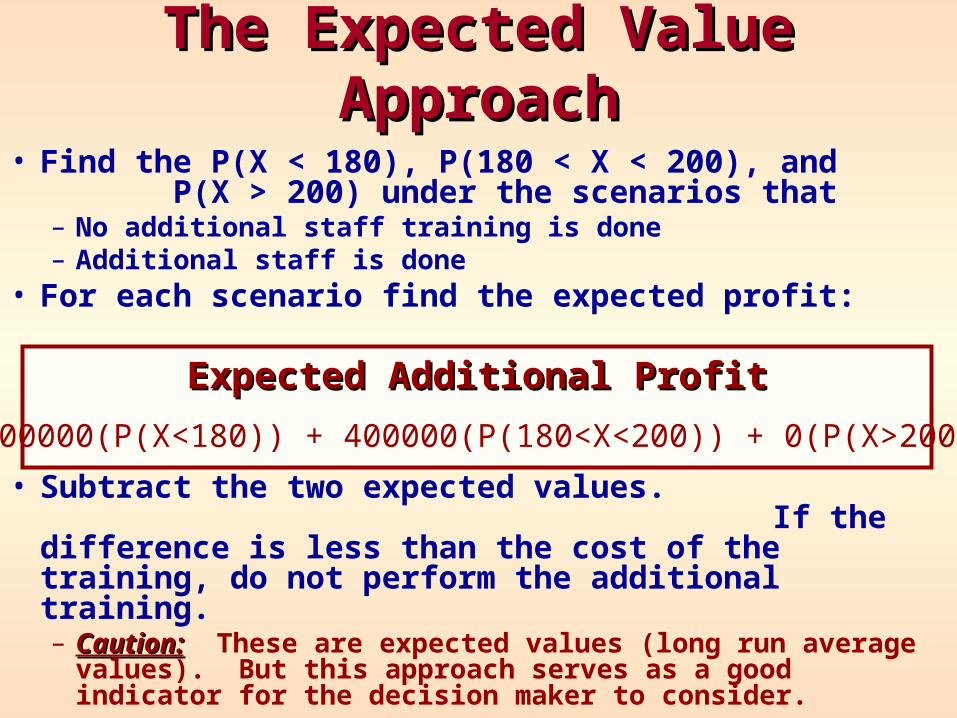
• Find the P(X < 180), P(180 < X < 200), and P(X > 200) under the scenarios that– No additional staff training is done– Additional staff is done
• For each scenario find the expected profit:
• Subtract the two expected values. If the difference is less than the cost of the training, do not perform the additional training.– Caution:Caution: These are expected values (long run average
values). But this approach serves as a good indicator for the decision maker to consider.
Expected Additional ProfitExpected Additional Profit
1000000(P(X<180)) + 400000(P(180<X<200)) + 0(P(X>200))
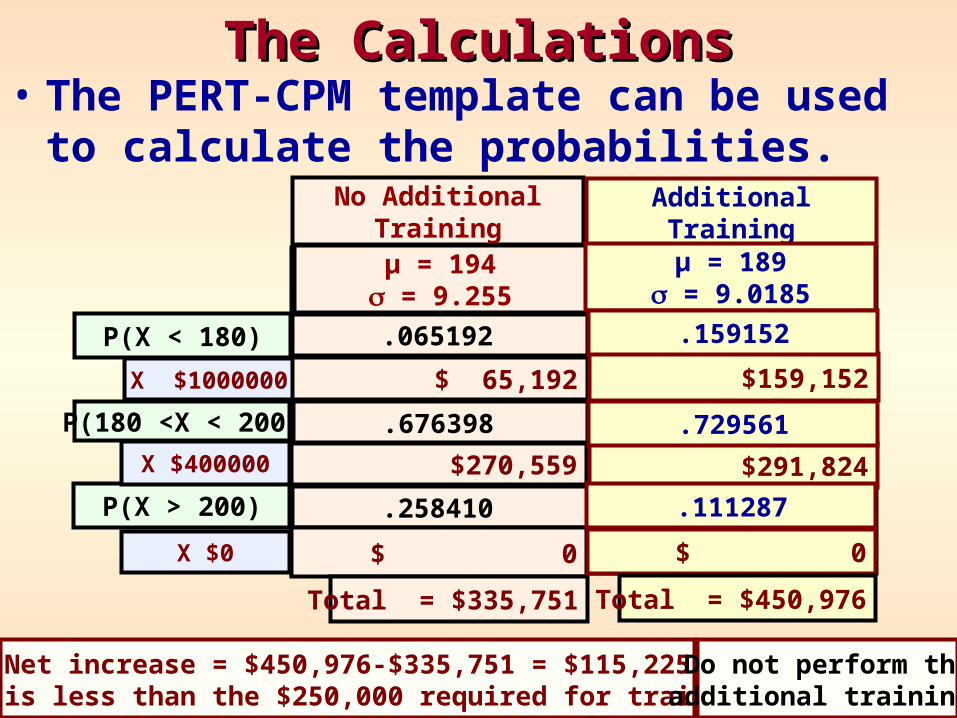
The CalculationsThe Calculations• The PERT-CPM template can be used to
calculate the probabilities.No Additional
TrainingAdditionalTraining
µ = 194 = 9.255
µ = 189 = 9.0185
.065192P(X < 180)
P(180 <X < 200) .676398
P(X > 200) .258410
X $1000000
$ 0
$ 65,192
$270,559X $400000
X $0
Total = $335,751
$159,152
$ 0
$291,824
.159152
.729561
.111287
Total = $450,976
Net increase = $450,976-$335,751 = $115,225This is less than the $250,000 required for training.
Do not perform theadditional training!
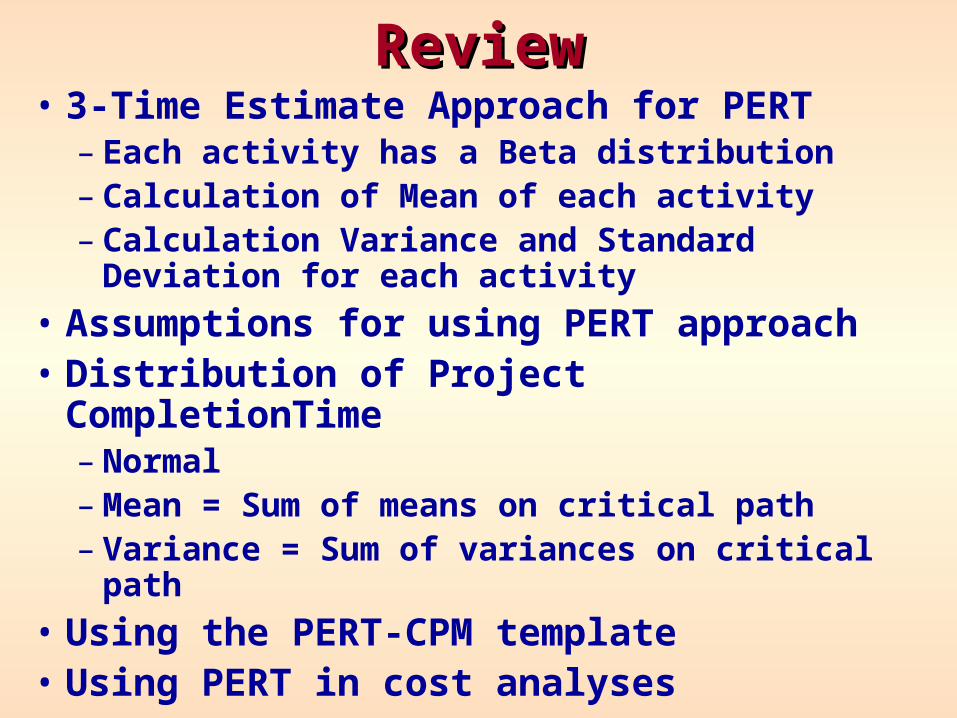
ReviewReview• 3-Time Estimate Approach for PERT
– Each activity has a Beta distribution– Calculation of Mean of each activity– Calculation Variance and Standard Deviation
for each activity
• Assumptions for using PERT approach• Distribution of Project CompletionTime
– Normal– Mean = Sum of means on critical path– Variance = Sum of variances on critical path
• Using the PERT-CPM template• Using PERT in cost analyses