Embed Size (px)
Citation preview
ARTICLE IN PRESS
www.elsevier.com/locate/susc
Surface Science xxx (2006) xxx–xxx
Profile imaging of reconstructed polar and non-polar surfaces of ZnO
Yong Ding, Zhong Lin Wang *
School of Materials Science and Engineering, Georgia Institute of Technology, Atlanta, GA 30332-0245, United States
Received 5 May 2006; accepted for publication 26 July 2006
Abstract
The atomic scale surface structures of ZnO ð01�10Þ non-polar as well as ð0�111Þ and ±(0001) polar surfaces have been directly imagedby high-resolution transmission electron microscopy (HRTEM). The observations were made on clean surfaces created by irradiating asingle ZnO nanobelt using 400 keV electron beam in TEM, under which ZnO dots were grown epitaxially and in situ on the surface of thenanobelt. A technique is demonstrated for directly distinguishing the surface polarity of the ±(0001) polar surfaces. For the ð01�10Þ non-polar surface, HRTEM images and simulation results indicate that the Zn ions in the first and second layer suffer from inward andoutward relaxation, respectively; the oxygen ions in the first and second layer prefer shifting to vicinal Zn ions to shorten the bondingdistance. For the oxygen-terminated ð0�111Þ polar surface, the oxygen ions at the outmost top layer were directly imaged. a · 2 recon-struction has also been observed at the ð0�111Þ surface, and its atomic structure has been proposed based on image simulation. Oxygen-terminated ð000�1Þ polar surface is flat and shows no detectable reconstruction. For the Zn-terminated (0001) polar surface, HRTEMmay indicate the existence of Zn vacancies and a possibly c-axis, random outward displacement of the top Zn ions. Our data tend tosupport the mechanism of removal of surface atoms for maintaining the stability of (0001) polar surfaces.� 2006 Elsevier B.V. All rights reserved.
Keywords: Surface structure; High-resolution transmission electron microscopy; Profile image; Zinc oxide; Polar surface
1. Introduction
ZnO is an interesting and important II–VI semiconduc-tor for both applications and basic researches owing to itsunique physical and chemical properties [1]. The electronicproperties of the ZnO surfaces are particularly importantfor its application as chemical and gas sensor as well as cat-alyst for hydrogenation and dehydrogenation [2,3]. Moreimportantly, ZnO has attracted considerable attention innanotechnology for the unique structures and devices thatit has offered [4–8]. For the ZnO nanostructures, with theincreased surface-to-bulk ratio, the effect played by the sur-faces, especially the polar surfaces, is critically important.As a result, various polar surface dominated nanostructure
0039-6028/$ - see front matter � 2006 Elsevier B.V. All rights reserved.
doi:10.1016/j.susc.2006.07.063
* Corresponding author. Tel.: +1 404 894 8008; fax: +1 404 894 9145.E-mail addresses: [email protected] (Y. Ding), zhong.
[email protected] (Z.L. Wang).
Please cite this article in press as: Y. Ding, Z.L. Wang, Surf. Sci. (2
[9] such as nanobelts [10], nanorings [11], nanosprings[12,13], and nanohelices [14], have been found for wurtziteZnO. The formation mechanism was attributed to the min-imization of electrostatic interaction energy contributed bythe ionic charges on the polar surfaces.
From the crystal structural point of view, ZnO takesthe hexagonal wurtzite structure with space group asP63mc [15]. Close-packed oxygen and zinc layers stackalong the c-axis with alternating distances 0.69 A and1.99 A, respectively [16]. The exposed (0001) and ð000�1Þsurfaces are composed uniquely by Zn2+ and O2� ions,respectively, to form polar surfaces, while f01�10g sur-faces perpendicular to the c-axis are composed by Zn–Odimers with neutral charge, forming the non-polar sur-faces. The dangling bonds on such surfaces make the sys-tem unstable [17]. It was considered that the Zn–O surfacedimers on non-polar ð01�10Þ surface are energeticallyfavorable after a slight tilting and an inward displacementinto the volume [18]. However, the detailed configuration
006), doi:10.1016/j.susc.2006.07.063
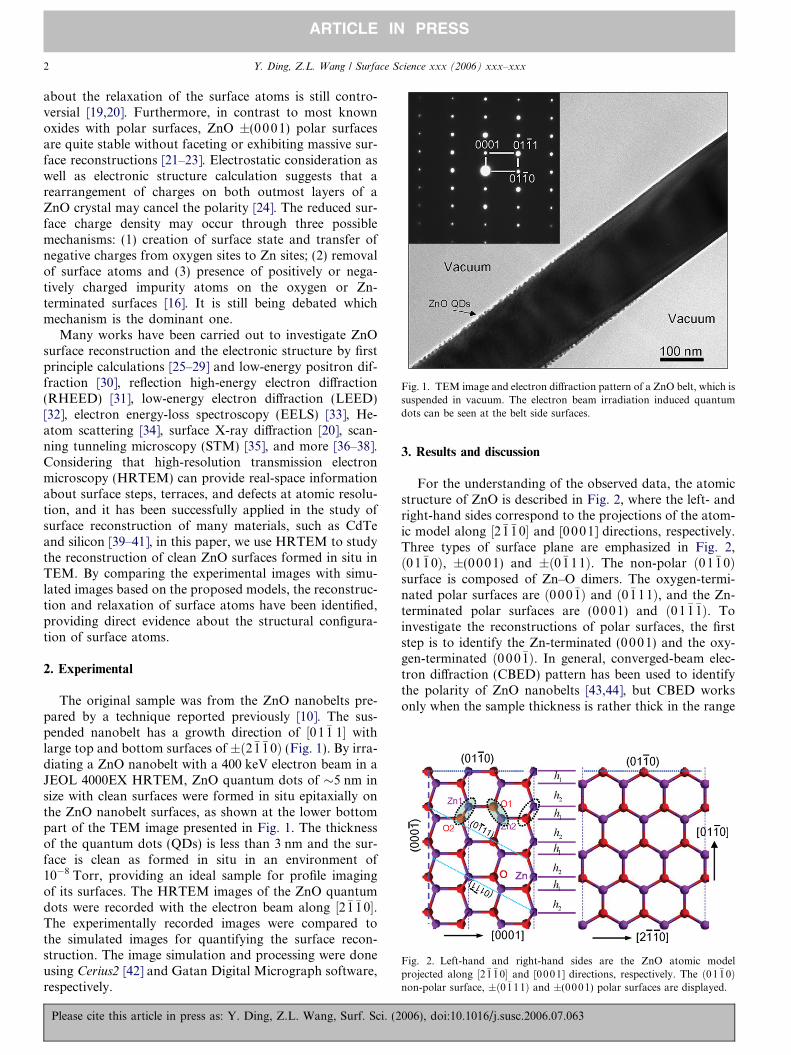
Fig. 1. TEM image and electron diffraction pattern of a ZnO belt, which issuspended in vacuum. The electron beam irradiation induced quantumdots can be seen at the belt side surfaces.
Fig. 2. Left-hand and right-hand sides are the ZnO atomic modelprojected along ½2�1�10� and [0001] directions, respectively. The ð01�10Þnon-polar surface, �ð0�111Þ and ±(0001) polar surfaces are displayed.
2 Y. Ding, Z.L. Wang / Surface Science xxx (2006) xxx–xxx
ARTICLE IN PRESS
about the relaxation of the surface atoms is still contro-versial [19,20]. Furthermore, in contrast to most knownoxides with polar surfaces, ZnO ±(00 01) polar surfacesare quite stable without faceting or exhibiting massive sur-face reconstructions [21–23]. Electrostatic consideration aswell as electronic structure calculation suggests that arearrangement of charges on both outmost layers of aZnO crystal may cancel the polarity [24]. The reduced sur-face charge density may occur through three possiblemechanisms: (1) creation of surface state and transfer ofnegative charges from oxygen sites to Zn sites; (2) removalof surface atoms and (3) presence of positively or nega-tively charged impurity atoms on the oxygen or Zn-terminated surfaces [16]. It is still being debated whichmechanism is the dominant one.
Many works have been carried out to investigate ZnOsurface reconstruction and the electronic structure by firstprinciple calculations [25–29] and low-energy positron dif-fraction [30], reflection high-energy electron diffraction(RHEED) [31], low-energy electron diffraction (LEED)[32], electron energy-loss spectroscopy (EELS) [33], He-atom scattering [34], surface X-ray diffraction [20], scan-ning tunneling microscopy (STM) [35], and more [36–38].Considering that high-resolution transmission electronmicroscopy (HRTEM) can provide real-space informationabout surface steps, terraces, and defects at atomic resolu-tion, and it has been successfully applied in the study ofsurface reconstruction of many materials, such as CdTeand silicon [39–41], in this paper, we use HRTEM to studythe reconstruction of clean ZnO surfaces formed in situ inTEM. By comparing the experimental images with simu-lated images based on the proposed models, the reconstruc-tion and relaxation of surface atoms have been identified,providing direct evidence about the structural configura-tion of surface atoms.
2. Experimental
The original sample was from the ZnO nanobelts pre-pared by a technique reported previously [10]. The sus-pended nanobelt has a growth direction of ½01�1 1� withlarge top and bottom surfaces of �ð2�1�10Þ (Fig. 1). By irra-diating a ZnO nanobelt with a 400 keV electron beam in aJEOL 4000EX HRTEM, ZnO quantum dots of �5 nm insize with clean surfaces were formed in situ epitaxially onthe ZnO nanobelt surfaces, as shown at the lower bottompart of the TEM image presented in Fig. 1. The thicknessof the quantum dots (QDs) is less than 3 nm and the sur-face is clean as formed in situ in an environment of10�8 Torr, providing an ideal sample for profile imagingof its surfaces. The HRTEM images of the ZnO quantumdots were recorded with the electron beam along ½2�1�10�.The experimentally recorded images were compared tothe simulated images for quantifying the surface recon-struction. The image simulation and processing were doneusing Cerius2 [42] and Gatan Digital Micrograph software,respectively.
Please cite this article in press as: Y. Ding, Z.L. Wang, Surf. Sci. (2
3. Results and discussion
For the understanding of the observed data, the atomicstructure of ZnO is described in Fig. 2, where the left- andright-hand sides correspond to the projections of the atom-ic model along ½2�1�1 0� and [0001] directions, respectively.Three types of surface plane are emphasized in Fig. 2,ð0 1�10Þ, ±(0001) and ±ð0�111Þ. The non-polar ð01�10Þsurface is composed of Zn–O dimers. The oxygen-termi-nated polar surfaces are ð0 00�1Þ and ð0�111Þ, and the Zn-terminated polar surfaces are (00 01) and ð01�1�1Þ. Toinvestigate the reconstructions of polar surfaces, the firststep is to identify the Zn-terminated (0001) and the oxy-gen-terminated ð0 00�1Þ. In general, converged-beam elec-tron diffraction (CBED) pattern has been used to identifythe polarity of ZnO nanobelts [43,44], but CBED worksonly when the sample thickness is rather thick in the range
006), doi:10.1016/j.susc.2006.07.063
Y. Ding, Z.L. Wang / Surface Science xxx (2006) xxx–xxx 3
ARTICLE IN PRESS
of >100 nm, which is too thick for HRTEM imaging. Forthe purpose of this study, we must find a way of identifyingthe polarity for samples of thinner than 5 nm.
3.1. Identification of the polar direction [000 1]
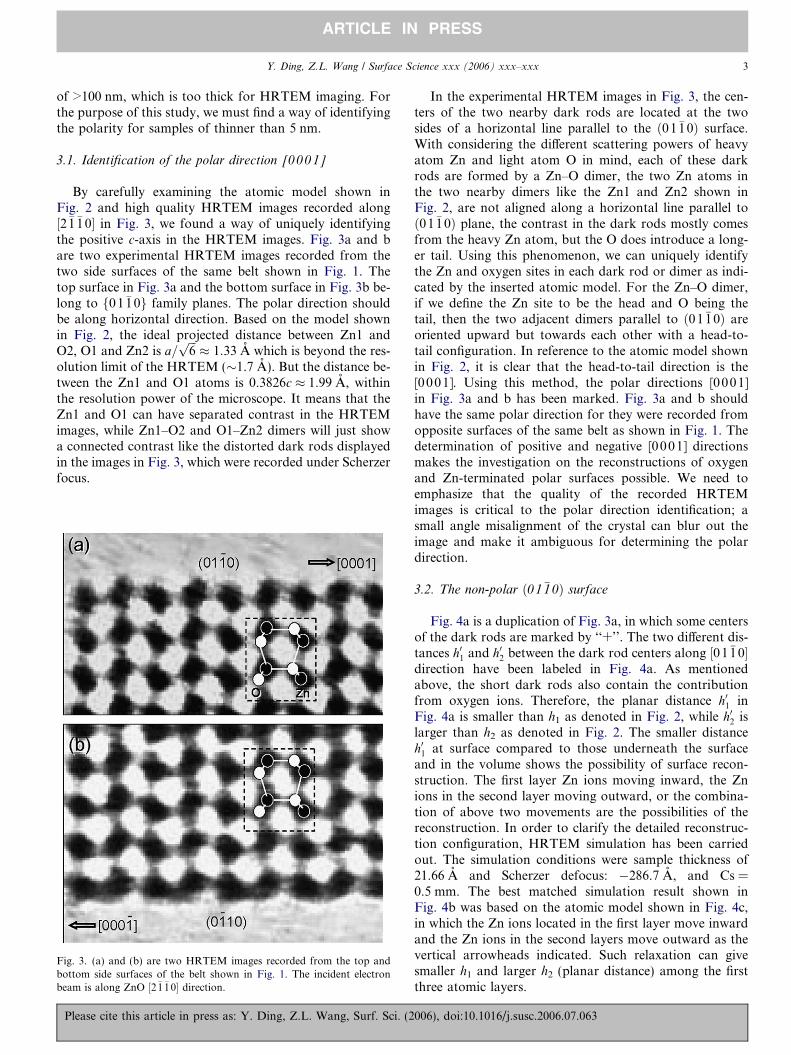
By carefully examining the atomic model shown inFig. 2 and high quality HRTEM images recorded along½2�1�10� in Fig. 3, we found a way of uniquely identifyingthe positive c-axis in the HRTEM images. Fig. 3a and bare two experimental HRTEM images recorded from thetwo side surfaces of the same belt shown in Fig. 1. Thetop surface in Fig. 3a and the bottom surface in Fig. 3b be-long to f01�10g family planes. The polar direction shouldbe along horizontal direction. Based on the model shownin Fig. 2, the ideal projected distance between Zn1 andO2, O1 and Zn2 is a=
ffiffiffi
6p� 1:33 A which is beyond the res-
olution limit of the HRTEM (�1.7 A). But the distance be-tween the Zn1 and O1 atoms is 0.3826c � 1.99 A, withinthe resolution power of the microscope. It means that theZn1 and O1 can have separated contrast in the HRTEMimages, while Zn1–O2 and O1–Zn2 dimers will just showa connected contrast like the distorted dark rods displayedin the images in Fig. 3, which were recorded under Scherzerfocus.
Fig. 3. (a) and (b) are two HRTEM images recorded from the top andbottom side surfaces of the belt shown in Fig. 1. The incident electronbeam is along ZnO ½2�1�10� direction.
Please cite this article in press as: Y. Ding, Z.L. Wang, Surf. Sci. (2
In the experimental HRTEM images in Fig. 3, the cen-ters of the two nearby dark rods are located at the twosides of a horizontal line parallel to the ð01�10Þ surface.With considering the different scattering powers of heavyatom Zn and light atom O in mind, each of these darkrods are formed by a Zn–O dimer, the two Zn atoms inthe two nearby dimers like the Zn1 and Zn2 shown inFig. 2, are not aligned along a horizontal line parallel toð01�10Þ plane, the contrast in the dark rods mostly comesfrom the heavy Zn atom, but the O does introduce a long-er tail. Using this phenomenon, we can uniquely identifythe Zn and oxygen sites in each dark rod or dimer as indi-cated by the inserted atomic model. For the Zn–O dimer,if we define the Zn site to be the head and O being thetail, then the two adjacent dimers parallel to ð01�10Þ areoriented upward but towards each other with a head-to-tail configuration. In reference to the atomic model shownin Fig. 2, it is clear that the head-to-tail direction is the[0001]. Using this method, the polar directions [0001]in Fig. 3a and b has been marked. Fig. 3a and b shouldhave the same polar direction for they were recorded fromopposite surfaces of the same belt as shown in Fig. 1. Thedetermination of positive and negative [0001] directionsmakes the investigation on the reconstructions of oxygenand Zn-terminated polar surfaces possible. We need toemphasize that the quality of the recorded HRTEMimages is critical to the polar direction identification; asmall angle misalignment of the crystal can blur out theimage and make it ambiguous for determining the polardirection.
3.2. The non-polar ð01�10Þ surface
Fig. 4a is a duplication of Fig. 3a, in which some centersof the dark rods are marked by ‘‘+’’. The two different dis-tances h01 and h02 between the dark rod centers along ½01�10�direction have been labeled in Fig. 4a. As mentionedabove, the short dark rods also contain the contributionfrom oxygen ions. Therefore, the planar distance h01 inFig. 4a is smaller than h1 as denoted in Fig. 2, while h02 islarger than h2 as denoted in Fig. 2. The smaller distanceh01 at surface compared to those underneath the surfaceand in the volume shows the possibility of surface recon-struction. The first layer Zn ions moving inward, the Znions in the second layer moving outward, or the combina-tion of above two movements are the possibilities of thereconstruction. In order to clarify the detailed reconstruc-tion configuration, HRTEM simulation has been carriedout. The simulation conditions were sample thickness of21.66 A and Scherzer defocus: �286.7 A, and Cs =0.5 mm. The best matched simulation result shown inFig. 4b was based on the atomic model shown in Fig. 4c,in which the Zn ions located in the first layer move inwardand the Zn ions in the second layers move outward as thevertical arrowheads indicated. Such relaxation can givesmaller h1 and larger h2 (planar distance) among the firstthree atomic layers.
006), doi:10.1016/j.susc.2006.07.063
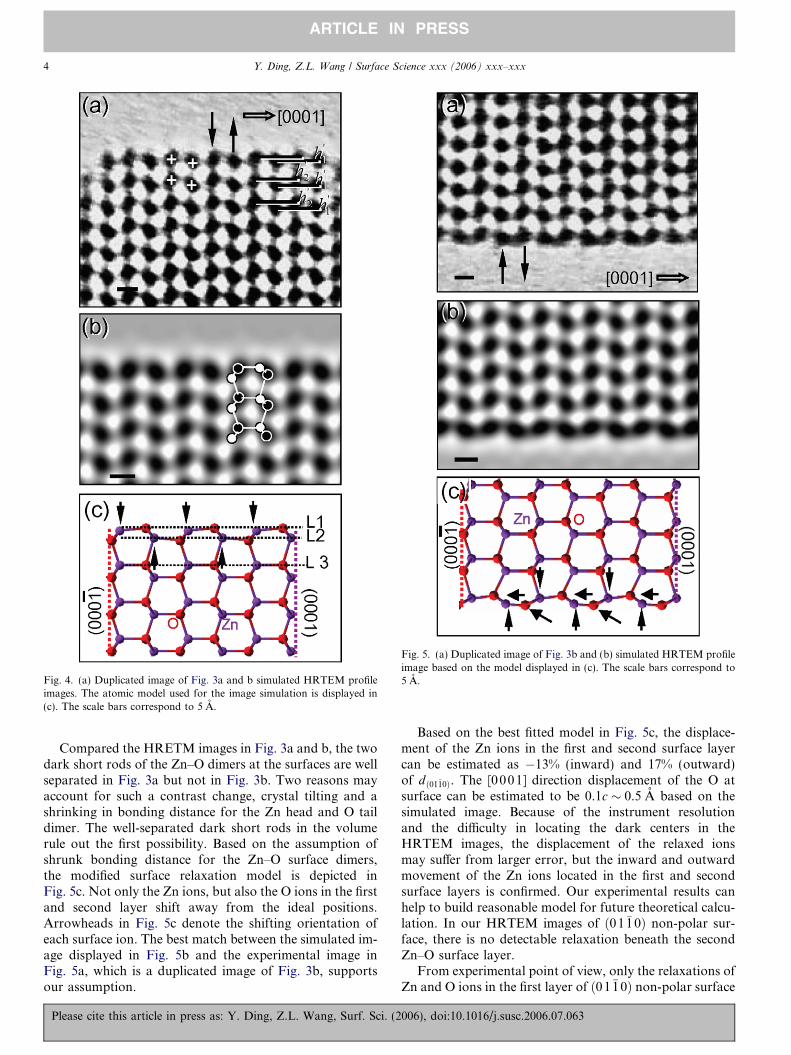
Fig. 4. (a) Duplicated image of Fig. 3a and b simulated HRTEM profileimages. The atomic model used for the image simulation is displayed in(c). The scale bars correspond to 5 A.
Fig. 5. (a) Duplicated image of Fig. 3b and (b) simulated HRTEM profileimage based on the model displayed in (c). The scale bars correspond to5 A.
4 Y. Ding, Z.L. Wang / Surface Science xxx (2006) xxx–xxx
ARTICLE IN PRESS
Compared the HRETM images in Fig. 3a and b, the twodark short rods of the Zn–O dimers at the surfaces are wellseparated in Fig. 3a but not in Fig. 3b. Two reasons mayaccount for such a contrast change, crystal tilting and ashrinking in bonding distance for the Zn head and O taildimer. The well-separated dark short rods in the volumerule out the first possibility. Based on the assumption ofshrunk bonding distance for the Zn–O surface dimers,the modified surface relaxation model is depicted inFig. 5c. Not only the Zn ions, but also the O ions in the firstand second layer shift away from the ideal positions.Arrowheads in Fig. 5c denote the shifting orientation ofeach surface ion. The best match between the simulated im-age displayed in Fig. 5b and the experimental image inFig. 5a, which is a duplicated image of Fig. 3b, supportsour assumption.
Please cite this article in press as: Y. Ding, Z.L. Wang, Surf. Sci. (2
Based on the best fitted model in Fig. 5c, the displace-ment of the Zn ions in the first and second surface layercan be estimated as �13% (inward) and 17% (outward)of dð01�10Þ. The [0001] direction displacement of the O atsurface can be estimated to be 0.1c � 0.5 A based on thesimulated image. Because of the instrument resolutionand the difficulty in locating the dark centers in theHRTEM images, the displacement of the relaxed ionsmay suffer from larger error, but the inward and outwardmovement of the Zn ions located in the first and secondsurface layers is confirmed. Our experimental results canhelp to build reasonable model for future theoretical calcu-lation. In our HRTEM images of ð01�10Þ non-polar sur-face, there is no detectable relaxation beneath the secondZn–O surface layer.
From experimental point of view, only the relaxations ofZn and O ions in the first layer of ð0 1�10Þ non-polar surface
006), doi:10.1016/j.susc.2006.07.063
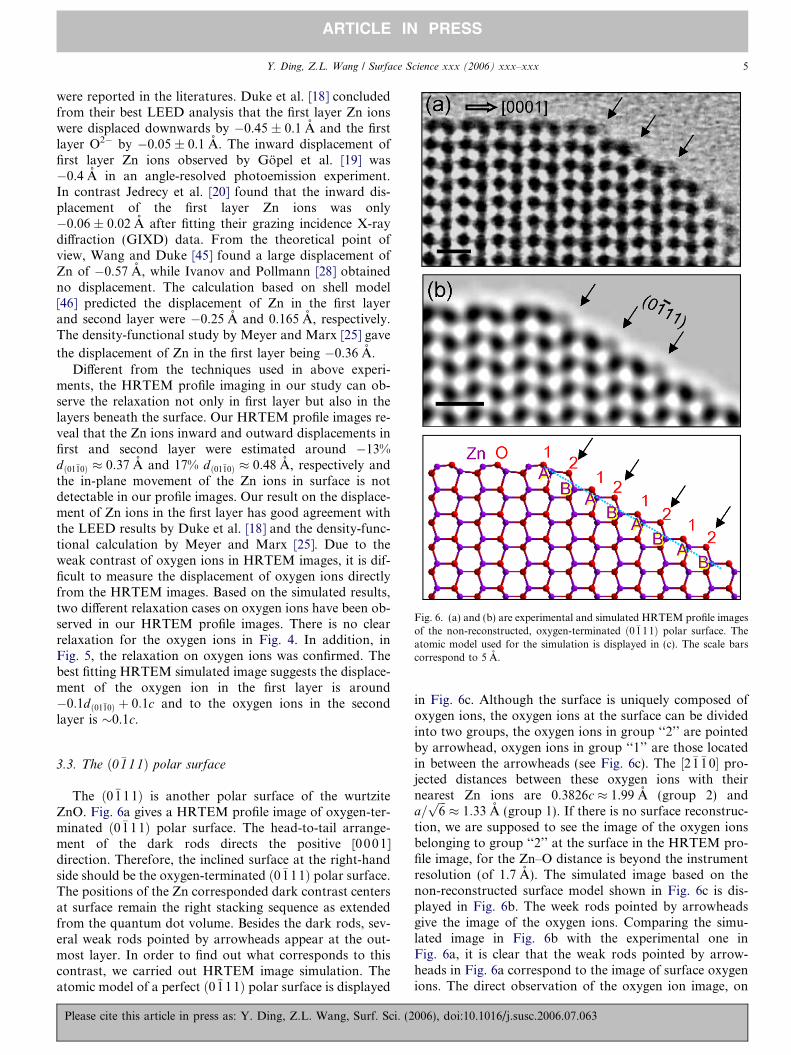
Fig. 6. (a) and (b) are experimental and simulated HRTEM profile imagesof the non-reconstructed, oxygen-terminated ð0�111Þ polar surface. Theatomic model used for the simulation is displayed in (c). The scale barscorrespond to 5 A.
Y. Ding, Z.L. Wang / Surface Science xxx (2006) xxx–xxx 5
ARTICLE IN PRESS
were reported in the literatures. Duke et al. [18] concludedfrom their best LEED analysis that the first layer Zn ionswere displaced downwards by �0.45 ± 0.1 A and the firstlayer O2� by �0.05 ± 0.1 A. The inward displacement offirst layer Zn ions observed by Gopel et al. [19] was�0.4 A in an angle-resolved photoemission experiment.In contrast Jedrecy et al. [20] found that the inward dis-placement of the first layer Zn ions was only�0.06 ± 0.02 A after fitting their grazing incidence X-raydiffraction (GIXD) data. From the theoretical point ofview, Wang and Duke [45] found a large displacement ofZn of �0.57 A, while Ivanov and Pollmann [28] obtainedno displacement. The calculation based on shell model[46] predicted the displacement of Zn in the first layerand second layer were �0.25 A and 0.165 A, respectively.The density-functional study by Meyer and Marx [25] gave
the displacement of Zn in the first layer being �0.36 A.Different from the techniques used in above experi-
ments, the HRTEM profile imaging in our study can ob-serve the relaxation not only in first layer but also in thelayers beneath the surface. Our HRTEM profile images re-veal that the Zn ions inward and outward displacements infirst and second layer were estimated around �13%dð01�10Þ � 0:37 A and 17% dð01�10Þ � 0:48 A, respectively andthe in-plane movement of the Zn ions in surface is notdetectable in our profile images. Our result on the displace-ment of Zn ions in the first layer has good agreement withthe LEED results by Duke et al. [18] and the density-func-tional calculation by Meyer and Marx [25]. Due to theweak contrast of oxygen ions in HRTEM images, it is dif-ficult to measure the displacement of oxygen ions directlyfrom the HRTEM images. Based on the simulated results,two different relaxation cases on oxygen ions have been ob-served in our HRTEM profile images. There is no clearrelaxation for the oxygen ions in Fig. 4. In addition, inFig. 5, the relaxation on oxygen ions was confirmed. Thebest fitting HRTEM simulated image suggests the displace-ment of the oxygen ion in the first layer is around�0:1dð01�10Þ þ 0:1c and to the oxygen ions in the secondlayer is �0.1c.
3.3. The ð0�111Þ polar surface
The ð0�111Þ is another polar surface of the wurtziteZnO. Fig. 6a gives a HRTEM profile image of oxygen-ter-minated ð0�111Þ polar surface. The head-to-tail arrange-ment of the dark rods directs the positive [0001]direction. Therefore, the inclined surface at the right-handside should be the oxygen-terminated ð0�111Þ polar surface.The positions of the Zn corresponded dark contrast centersat surface remain the right stacking sequence as extendedfrom the quantum dot volume. Besides the dark rods, sev-eral weak rods pointed by arrowheads appear at the out-most layer. In order to find out what corresponds to thiscontrast, we carried out HRTEM image simulation. Theatomic model of a perfect ð0�111Þ polar surface is displayed
Please cite this article in press as: Y. Ding, Z.L. Wang, Surf. Sci. (2
in Fig. 6c. Although the surface is uniquely composed ofoxygen ions, the oxygen ions at the surface can be dividedinto two groups, the oxygen ions in group ‘‘2’’ are pointedby arrowhead, oxygen ions in group ‘‘1’’ are those locatedin between the arrowheads (see Fig. 6c). The ½2�1�10� pro-jected distances between these oxygen ions with theirnearest Zn ions are 0.3826c � 1.99 A (group 2) anda=
ffiffiffi
6p� 1:33 A (group 1). If there is no surface reconstruc-
tion, we are supposed to see the image of the oxygen ionsbelonging to group ‘‘2’’ at the surface in the HRTEM pro-file image, for the Zn–O distance is beyond the instrumentresolution (of 1.7 A). The simulated image based on thenon-reconstructed surface model shown in Fig. 6c is dis-played in Fig. 6b. The week rods pointed by arrowheadsgive the image of the oxygen ions. Comparing the simu-lated image in Fig. 6b with the experimental one inFig. 6a, it is clear that the weak rods pointed by arrow-heads in Fig. 6a correspond to the image of surface oxygenions. The direct observation of the oxygen ion image, on
006), doi:10.1016/j.susc.2006.07.063
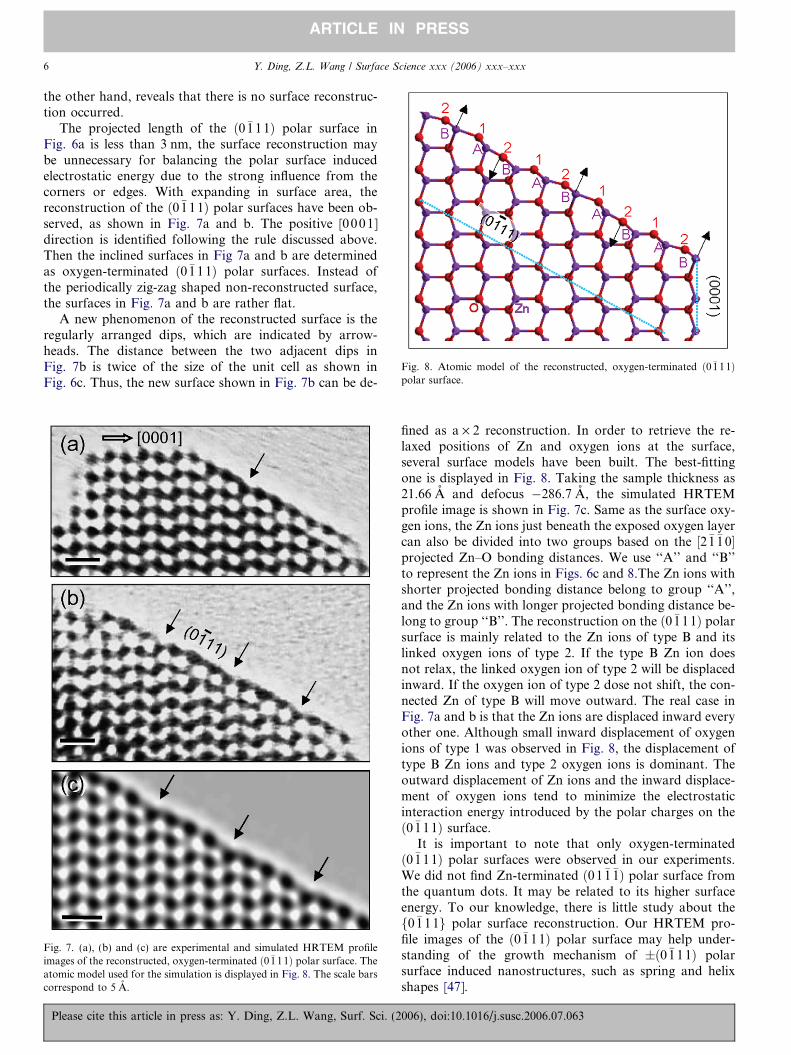
Fig. 8. Atomic model of the reconstructed, oxygen-terminated ð0�111Þpolar surface.
6 Y. Ding, Z.L. Wang / Surface Science xxx (2006) xxx–xxx
ARTICLE IN PRESS
the other hand, reveals that there is no surface reconstruc-tion occurred.
The projected length of the ð0�1 11Þ polar surface inFig. 6a is less than 3 nm, the surface reconstruction maybe unnecessary for balancing the polar surface inducedelectrostatic energy due to the strong influence from thecorners or edges. With expanding in surface area, thereconstruction of the ð0�111Þ polar surfaces have been ob-served, as shown in Fig. 7a and b. The positive [0001]direction is identified following the rule discussed above.Then the inclined surfaces in Fig 7a and b are determinedas oxygen-terminated ð0�111Þ polar surfaces. Instead ofthe periodically zig-zag shaped non-reconstructed surface,the surfaces in Fig. 7a and b are rather flat.
A new phenomenon of the reconstructed surface is theregularly arranged dips, which are indicated by arrow-heads. The distance between the two adjacent dips inFig. 7b is twice of the size of the unit cell as shown inFig. 6c. Thus, the new surface shown in Fig. 7b can be de-
Fig. 7. (a), (b) and (c) are experimental and simulated HRTEM profileimages of the reconstructed, oxygen-terminated ð0�111Þ polar surface. Theatomic model used for the simulation is displayed in Fig. 8. The scale barscorrespond to 5 A.
Please cite this article in press as: Y. Ding, Z.L. Wang, Surf. Sci. (2
fined as a · 2 reconstruction. In order to retrieve the re-laxed positions of Zn and oxygen ions at the surface,several surface models have been built. The best-fittingone is displayed in Fig. 8. Taking the sample thickness as21.66 A and defocus �286.7 A, the simulated HRTEMprofile image is shown in Fig. 7c. Same as the surface oxy-gen ions, the Zn ions just beneath the exposed oxygen layercan also be divided into two groups based on the ½2�1�10�projected Zn–O bonding distances. We use ‘‘A’’ and ‘‘B’’to represent the Zn ions in Figs. 6c and 8.The Zn ions withshorter projected bonding distance belong to group ‘‘A’’,and the Zn ions with longer projected bonding distance be-long to group ‘‘B’’. The reconstruction on the ð0�111Þ polarsurface is mainly related to the Zn ions of type B and itslinked oxygen ions of type 2. If the type B Zn ion doesnot relax, the linked oxygen ion of type 2 will be displacedinward. If the oxygen ion of type 2 dose not shift, the con-nected Zn of type B will move outward. The real case inFig. 7a and b is that the Zn ions are displaced inward everyother one. Although small inward displacement of oxygenions of type 1 was observed in Fig. 8, the displacement oftype B Zn ions and type 2 oxygen ions is dominant. Theoutward displacement of Zn ions and the inward displace-ment of oxygen ions tend to minimize the electrostaticinteraction energy introduced by the polar charges on theð0�111Þ surface.
It is important to note that only oxygen-terminatedð0�111Þ polar surfaces were observed in our experiments.We did not find Zn-terminated ð01�1�1Þ polar surface fromthe quantum dots. It may be related to its higher surfaceenergy. To our knowledge, there is little study about thef0�111g polar surface reconstruction. Our HRTEM pro-file images of the ð0�111Þ polar surface may help under-standing of the growth mechanism of ±ð0�11 1Þ polarsurface induced nanostructures, such as spring and helixshapes [47].
006), doi:10.1016/j.susc.2006.07.063
Y. Ding, Z.L. Wang / Surface Science xxx (2006) xxx–xxx 7
ARTICLE IN PRESS
3.4. The ±(0 001) polar surfaces
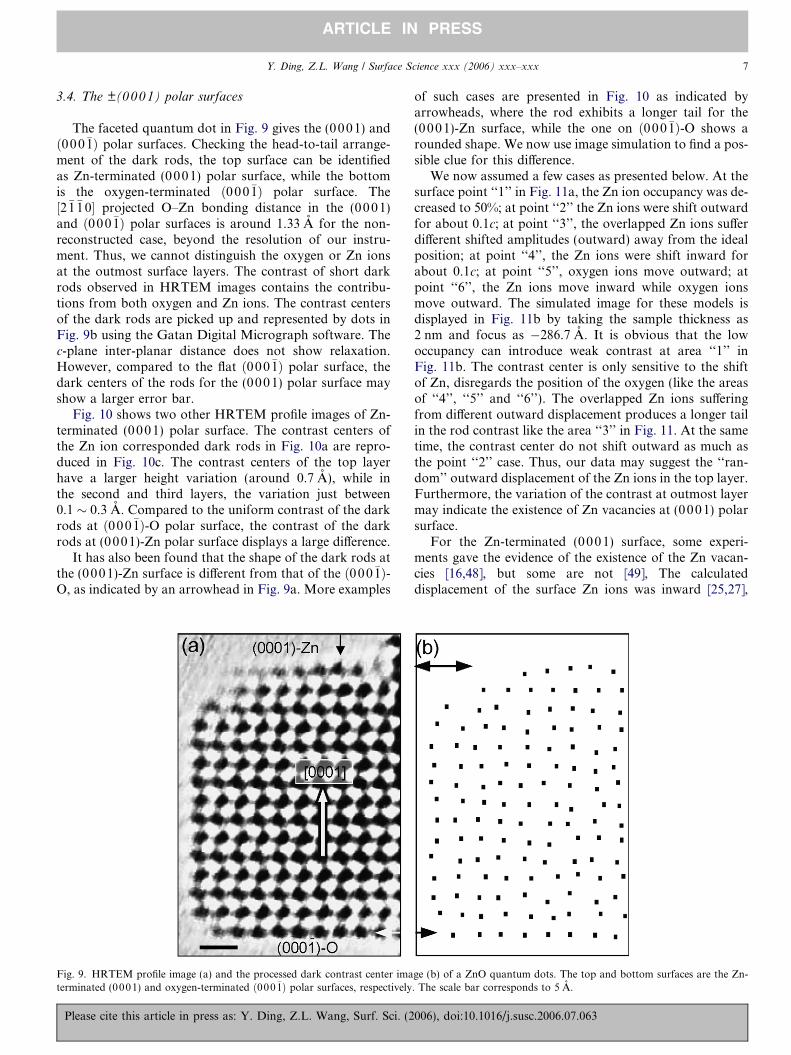
The faceted quantum dot in Fig. 9 gives the (0001) andð000�1Þ polar surfaces. Checking the head-to-tail arrange-ment of the dark rods, the top surface can be identifiedas Zn-terminated (0001) polar surface, while the bottomis the oxygen-terminated ð0 00�1Þ polar surface. The½2�1�10� projected O–Zn bonding distance in the (00 01)and ð000�1Þ polar surfaces is around 1.33 A for the non-reconstructed case, beyond the resolution of our instru-ment. Thus, we cannot distinguish the oxygen or Zn ionsat the outmost surface layers. The contrast of short darkrods observed in HRTEM images contains the contribu-tions from both oxygen and Zn ions. The contrast centersof the dark rods are picked up and represented by dots inFig. 9b using the Gatan Digital Micrograph software. Thec-plane inter-planar distance does not show relaxation.However, compared to the flat ð000�1Þ polar surface, thedark centers of the rods for the (000 1) polar surface mayshow a larger error bar.
Fig. 10 shows two other HRTEM profile images of Zn-terminated (0001) polar surface. The contrast centers ofthe Zn ion corresponded dark rods in Fig. 10a are repro-duced in Fig. 10c. The contrast centers of the top layerhave a larger height variation (around 0.7 A), while inthe second and third layers, the variation just between0.1 � 0.3 A. Compared to the uniform contrast of the darkrods at ð00 0�1Þ-O polar surface, the contrast of the darkrods at (0001)-Zn polar surface displays a large difference.
It has also been found that the shape of the dark rods atthe (0001)-Zn surface is different from that of the ð0 00�1Þ-O, as indicated by an arrowhead in Fig. 9a. More examples
Fig. 9. HRTEM profile image (a) and the processed dark contrast center imaterminated (0001) and oxygen-terminated ð000�1Þ polar surfaces, respectively
Please cite this article in press as: Y. Ding, Z.L. Wang, Surf. Sci. (2
of such cases are presented in Fig. 10 as indicated byarrowheads, where the rod exhibits a longer tail for the(0001)-Zn surface, while the one on ð000�1Þ-O shows arounded shape. We now use image simulation to find a pos-sible clue for this difference.
We now assumed a few cases as presented below. At thesurface point ‘‘1’’ in Fig. 11a, the Zn ion occupancy was de-creased to 50%; at point ‘‘2’’ the Zn ions were shift outwardfor about 0.1c; at point ‘‘3’’, the overlapped Zn ions sufferdifferent shifted amplitudes (outward) away from the idealposition; at point ‘‘4’’, the Zn ions were shift inward forabout 0.1c; at point ‘‘5’’, oxygen ions move outward; atpoint ‘‘6’’, the Zn ions move inward while oxygen ionsmove outward. The simulated image for these models isdisplayed in Fig. 11b by taking the sample thickness as2 nm and focus as �286.7 A. It is obvious that the lowoccupancy can introduce weak contrast at area ‘‘1’’ inFig. 11b. The contrast center is only sensitive to the shiftof Zn, disregards the position of the oxygen (like the areasof ‘‘4’’, ‘‘5’’ and ‘‘6’’). The overlapped Zn ions sufferingfrom different outward displacement produces a longer tailin the rod contrast like the area ‘‘3’’ in Fig. 11. At the sametime, the contrast center do not shift outward as much asthe point ‘‘2’’ case. Thus, our data may suggest the ‘‘ran-dom’’ outward displacement of the Zn ions in the top layer.Furthermore, the variation of the contrast at outmost layermay indicate the existence of Zn vacancies at (0001) polarsurface.
For the Zn-terminated (000 1) surface, some experi-ments gave the evidence of the existence of the Zn vacan-cies [16,48], but some are not [49], The calculateddisplacement of the surface Zn ions was inward [25,27],
ge (b) of a ZnO quantum dots. The top and bottom surfaces are the Zn-. The scale bar corresponds to 5 A.
006), doi:10.1016/j.susc.2006.07.063
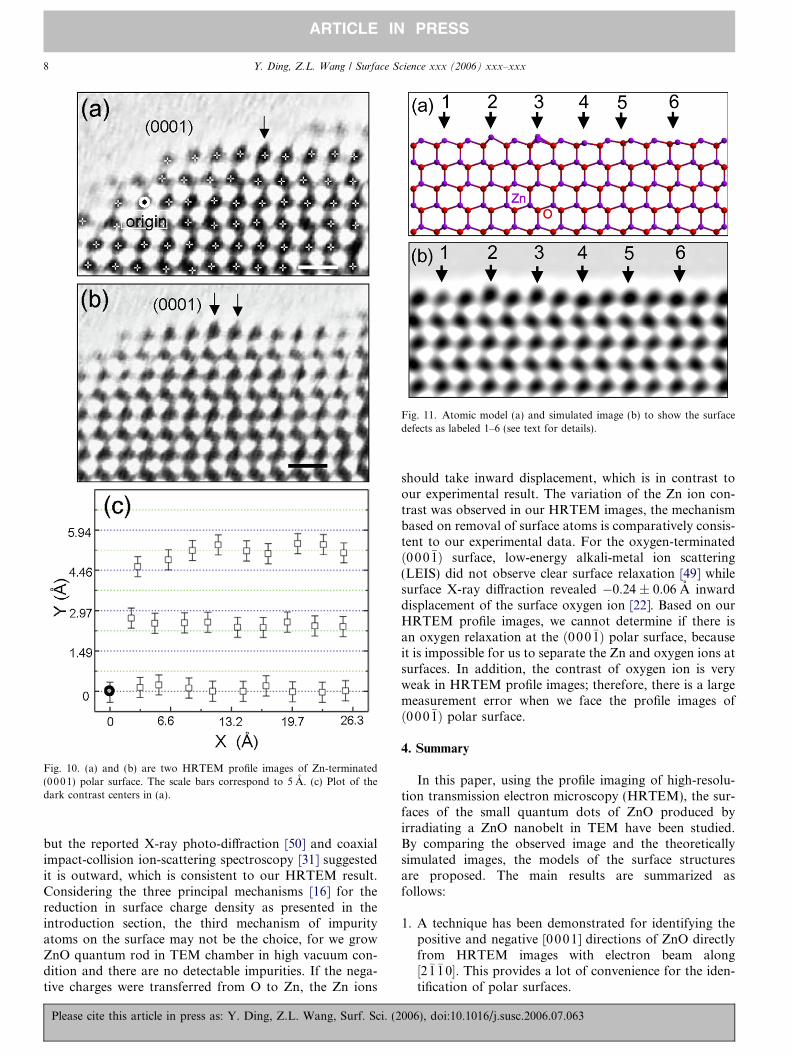
Fig. 10. (a) and (b) are two HRTEM profile images of Zn-terminated(0001) polar surface. The scale bars correspond to 5 A. (c) Plot of thedark contrast centers in (a).
Fig. 11. Atomic model (a) and simulated image (b) to show the surfacedefects as labeled 1–6 (see text for details).
8 Y. Ding, Z.L. Wang / Surface Science xxx (2006) xxx–xxx
ARTICLE IN PRESS
but the reported X-ray photo-diffraction [50] and coaxialimpact-collision ion-scattering spectroscopy [31] suggestedit is outward, which is consistent to our HRTEM result.Considering the three principal mechanisms [16] for thereduction in surface charge density as presented in theintroduction section, the third mechanism of impurityatoms on the surface may not be the choice, for we growZnO quantum rod in TEM chamber in high vacuum con-dition and there are no detectable impurities. If the nega-tive charges were transferred from O to Zn, the Zn ions
Please cite this article in press as: Y. Ding, Z.L. Wang, Surf. Sci. (2
should take inward displacement, which is in contrast toour experimental result. The variation of the Zn ion con-trast was observed in our HRTEM images, the mechanismbased on removal of surface atoms is comparatively consis-tent to our experimental data. For the oxygen-terminatedð0 00�1Þ surface, low-energy alkali-metal ion scattering(LEIS) did not observe clear surface relaxation [49] whilesurface X-ray diffraction revealed �0.24 ± 0.06 A inwarddisplacement of the surface oxygen ion [22]. Based on ourHRTEM profile images, we cannot determine if there isan oxygen relaxation at the ð000�1Þ polar surface, becauseit is impossible for us to separate the Zn and oxygen ions atsurfaces. In addition, the contrast of oxygen ion is veryweak in HRTEM profile images; therefore, there is a largemeasurement error when we face the profile images ofð0 00�1Þ polar surface.
4. Summary
In this paper, using the profile imaging of high-resolu-tion transmission electron microscopy (HRTEM), the sur-faces of the small quantum dots of ZnO produced byirradiating a ZnO nanobelt in TEM have been studied.By comparing the observed image and the theoreticallysimulated images, the models of the surface structuresare proposed. The main results are summarized asfollows:
1. A technique has been demonstrated for identifying thepositive and negative [0001] directions of ZnO directlyfrom HRTEM images with electron beam along½2�1�10�. This provides a lot of convenience for the iden-tification of polar surfaces.
006), doi:10.1016/j.susc.2006.07.063

Y. Ding, Z.L. Wang / Surface Science xxx (2006) xxx–xxx 9
ARTICLE IN PRESS
2. For the ð0 1�10Þ non-polar surface, surface reconstruc-tion has been observed. The Zn ions in the first and sec-ond layers have an inward (��13% of dð01�10Þ) andoutward (�17% of dð01�10Þ) relaxation, respectively. Theoxygen ions in the first and second surface layer preferto shift towards vicinal Zn ions to shorten the bondingdistance.
3. For the unreconstructed, oxygen-terminated ð0�111Þpolar surface, the oxygen ions at the top layer have beendirectly imaged. In the reconstructed ð0�111Þ surfaces,a · 2 reconstruction has been identified and its structuremodel has been proposed.
4. The oxygen-terminated ð000�1Þ polar surface shows nodetectable reconstruction. For the Zn-terminated(0001) polar surface, our data may possibly indicatethe existence of Zn vacancies in the surface and a ran-dom outward shift of the Zn ions.
5. Our data tend to support the mechanism of removal ofsurface atoms for maintaining the stability of (0001)polar surfaces.
Acknowledgements
The authors wish to thank Dr. C.L. Jia at Juelich re-search center, Germany for advice in image manipulation.
References
[1] U. Ozgur, Ya.I. Alivov, C. Liu, A. Teke, M.A. Reshchikov, S.Dogan, V. Avrutin, S.-J. Cho, H. Morkoc, J. Appl. Phys. 98 (2005)041301.
[2] J.B. Hansen, in: G. Ertl, H. Knotzinger, J. Weitkamp (Eds.),Handbook of Heterogeneous Catalysis, Wiley-VCH, Weinheim, 1997.
[3] F.-C. Lin, Y. Takao, Y. Shimizu, M. Egashira, J. Am. Ceram. Soc. 78(1995) 2301.
[4] Z.L. Wang (Ed.), Nanowires and Nanobelts, Kluwer AcademicPublisher, New York, 2003.
[5] J. Grabowska, A. Meaney, K.K. Nanda, J.-P. Mosnier, M.O. Henry,J.-R. Duclere, E. McGlynn, Phys. Rev. B 71 (2005) 115439.
[6] M. Law, L.E. Greene, J.C. Johnson, R. Saykally, P.D. Yang, NatureMater. 4 (2005) 455.
[7] C. Yu, Q. Hao, S. Saha, L. Shi, X.Y. Kong, Z.L. Wang, Appl. Phys.Lett. 86 (2005) 063101.
[8] Z.L. Wang, J. Song, Science 312 (2006) 242.[9] Z.L. Wang, X.Y. Kong, Y. Ding, P.X. Gao, W.L. Hughes, R. Yang,
Y. Zhang, Adv. Funct. Mater. 14 (2004) 943.[10] Z.W. Pan, Z.R. Dai, Z.L. Wang, Science 291 (2001) 1947.[11] X.Y. Kong, Y. Ding, R. Yang, Z.L. Wang, Science 303 (2004) 1348.[12] X.Y. Kong, Z.L. Wang, Nano Lett. 3 (2003) 1625.
Please cite this article in press as: Y. Ding, Z.L. Wang, Surf. Sci. (2
[13] P.X. Gao, Z.L. Wang, Small 1 (2005) 945.[14] P.X. Gao, Y. Ding, W.J. Mai, W.L. Hughes, C.S. Lao, Z.L. Wang,
Science 309 (2005) 1700.[15] JCPDS-80-0075, International centre for diffraction data (1999).[16] O. Dulub, U. Diebold, G. Kresses, Phys. Rev. Lett. 90 (2003) 016102.[17] R. Hoffmann, Rev. Mod. Phys. 60 (1988) 601.[18] C.B. Duke, R.J. Meyer, A. Paton, P. Mark, Phys. Rev. B 18 (1978)
4225.[19] W. Gopel, J. Pollmann, I. Ivanov, B. Reihl, Phys. Rev. B 26 (1982)
3144.[20] N. Jedrecy, S. Gallini, M. Sauvage-Simkin, R. Pinchaux, Surf. Sci.
460 (2000) 136.[21] C. Noguera, J. Phys.: Condens. Matter 12 (2000) R367.[22] A. Wander, N.M. Harrison, J. Chem. Phys. 115 (2001) 2312.[23] P.W. Tasker, J. Phys. C 12 (1979) 4977.[24] R.W. Nosker, P. Mark, J.D. Levine, Surf. Sci. 19 (1970) 291.[25] B. Meyer, D. Marx, Phys. Rev. B 67 (2003) 035403.[26] A. Wander, F. Schedin, P. Steadman, A. Norris, R. McGrath,
T.S. Turner, G. Thornton, N.M. Harrison, Phys. Rev. Lett. 86 (2001)3811.
[27] J.M. Carlsson, Comput. Mater. Sci. 22 (2001) 24.[28] I. Ivanov, J. Pollmann, Phys. Rev. B 24 (1981) 7275.[29] J.E. Jaffe, N.M. Harrison, A.C. Hess, Phys. Rev. B 49 (1994) 11153.[30] C.B. Duke, D.E. Lessor, T.N. Horsky, G. Brandes, K.F. Canter, P.H.
Lippel, A.P. Mills Jr., A. Paton, Y.R. Wang, J. Vac. Sci. Technol. A 7(1989) 2030.
[31] H. Maki, N. Ichinose, N. Ohashi, H. Haneda, J. Tanaka, Surf. Sci.457 (2000) 377.
[32] C.B. Duke, A.R. Lubinsky, S.C. Chang, B.W. Lee, P. Mark, Phys.Rev. B 15 (1977) 4865.
[33] R. Dorn, H. Luth, M. Buchel, Phys. Rev. B 16 (1977) 4675.[34] M. Kunat, St. Gil Girol, Th. Becker, U. Burghaus, Ch. Woll, Phys.
Rev. B 66 (2002) 081402.[35] O. Dulub, L.A. Boatner, U. Diebold, Surf. Sci. 519 (2002) 201.[36] V. Staemmler, K. Fink, B. Meyer, D. Marx, M. Kunat, S. Gil Girol,
U. Burghaus, Ch. Woll, Phys. Rev. Lett. 90 (2003) 106102.[37] B. Mayer, D. Marx, Phys. Rev. B 69 (2004) 235429.[38] P.J. Moller, S.K. Komolov, E.F. Lazneva, J. Phys.: Condens. Matter
11 (1999) 9581.[39] J.M. Gibson, M.L. McDonald, F.C. Unterwald, Phys. Rev. Lett. 55
(1985) 1765.[40] Ping Lu, David J. Smith, Phys. Rev. Lett. 59 (1987) 2177.[41] Ping Lu, David J. Smith, Surf. Sci. 254 (1991) 119.[42] J.M. Cowley, A. Moodie, Acta Cryst. 10 (1957) 609.[43] Z.L. Wang, X.Y. Kong, J.M. Zuo, Phys. Rev. Lett. 91 (2003) 185502.[44] Y. Ding, C. Ma, Z.L. Wang, Adv. Mater. 16 (2004) 1740.[45] Y.R. Wang, C.B. Duke, Surf. Sci. 192 (1987) 309.[46] L. Whitmore, A.A. Sokol, C.R.A. Catlow, Surf. Sci. 498 (2002) 135.[47] R. Yang, Y. Ding, Z.L. Wang, Nano Lett. 4 (2004) 1309.[48] N. Jedrecy, M. Sauvage-Simkin, R. Pinchaux, Appl. Surf. Sci. 162–
163 (2000) 69.[49] S.H. Overbury, P.V. Radulovic, S. Thevuthasan, G.S. Herman,
M.A. Henderson, C.H.F. Peden, Surf. Sci. 410 (1998) 106.[50] M. Sambi, G. Granozzi, G.A. Rizzi, M. Casari, E. Tondello, Surf.
Sci. 319 (1994) 149.
006), doi:10.1016/j.susc.2006.07.063