Embed Size (px)
Citation preview
Promoting Physical Activity Among Aboriginal Australians
Rona Macniven, PhD Candidate, School of Public Health
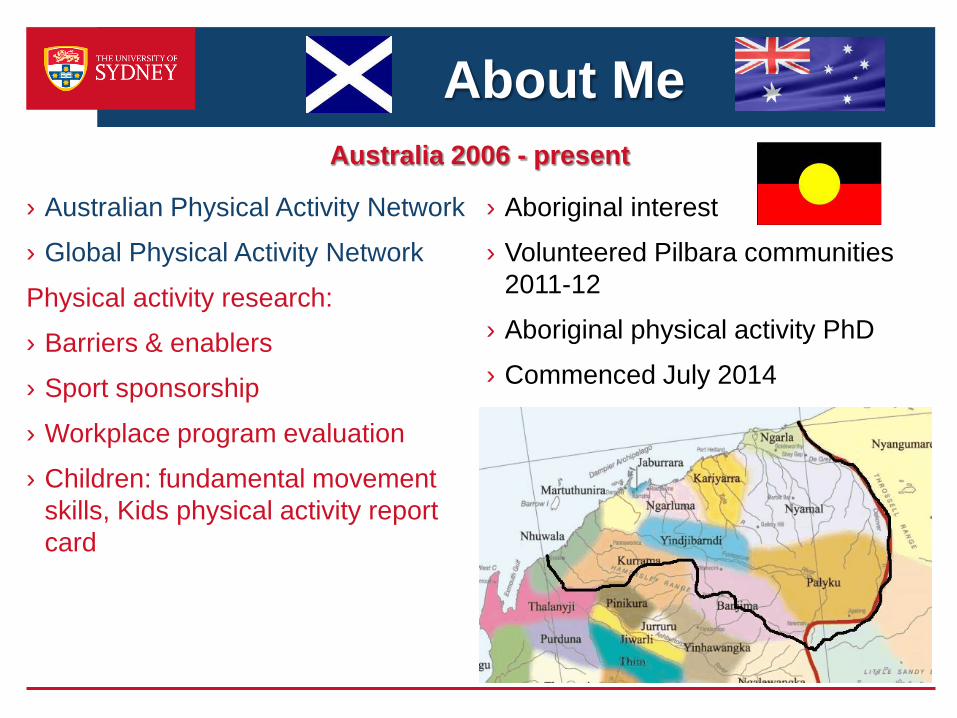
About Me
› Australian Physical Activity Network
› Global Physical Activity Network
Physical activity research:
› Barriers & enablers
› Sport sponsorship
› Workplace program evaluation
› Children: fundamental movement skills, Kids physical activity report card
› Aboriginal interest
› Volunteered Pilbara communities 2011-12
› Aboriginal physical activity PhD
› Commenced July 2014
Australia 2006 - present
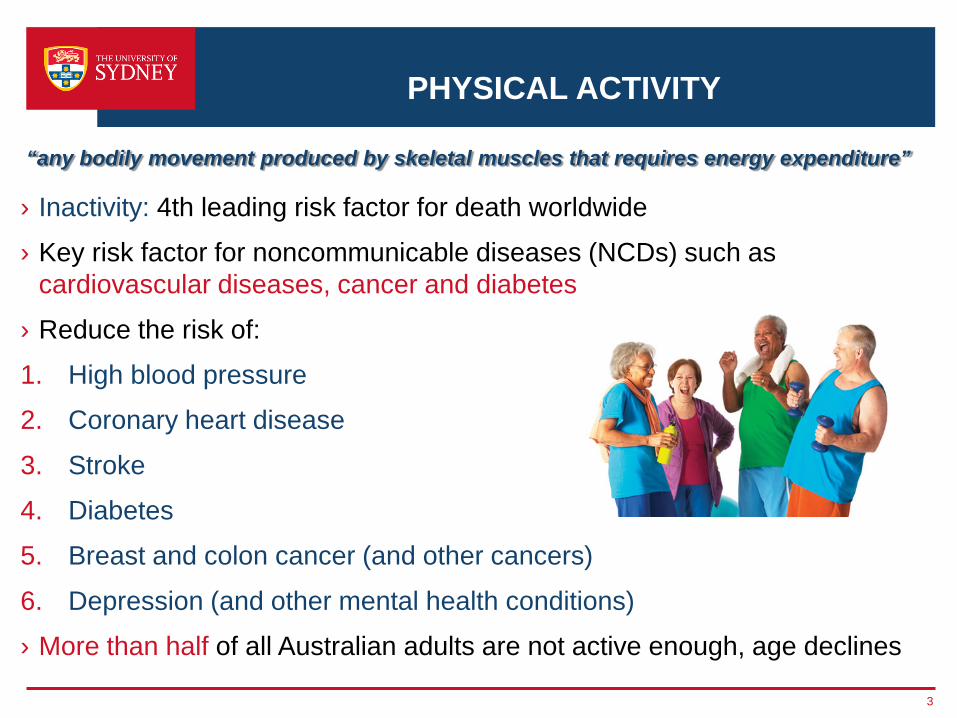
PHYSICAL ACTIVITY
› Inactivity: 4th leading risk factor for death worldwide
› Key risk factor for noncommunicable diseases (NCDs) such as cardiovascular diseases, cancer and diabetes
› Reduce the risk of:
1. High blood pressure
2. Coronary heart disease
3. Stroke
4. Diabetes
5. Breast and colon cancer (and other cancers)
6. Depression (and other mental health conditions)
› More than half of all Australian adults are not active enough, age declines
3
“any bodily movement produced by skeletal muscles that requires energy expenditure”
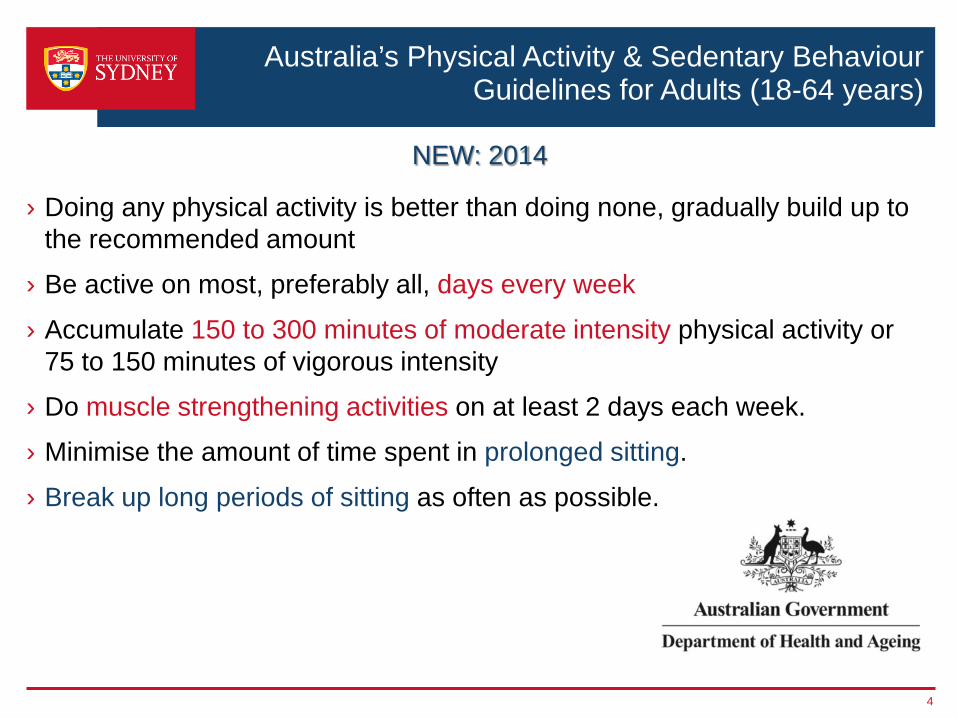
Australia’s Physical Activity & Sedentary Behaviour Guidelines for Adults (18-64 years)
› Doing any physical activity is better than doing none, gradually build up to the recommended amount
› Be active on most, preferably all, days every week
› Accumulate 150 to 300 minutes of moderate intensity physical activity or 75 to 150 minutes of vigorous intensity
› Do muscle strengthening activities on at least 2 days each week.
› Minimise the amount of time spent in prolonged sitting.
› Break up long periods of sitting as often as possible.
4
NEW: 2014
ABORIGINAL ADULTS
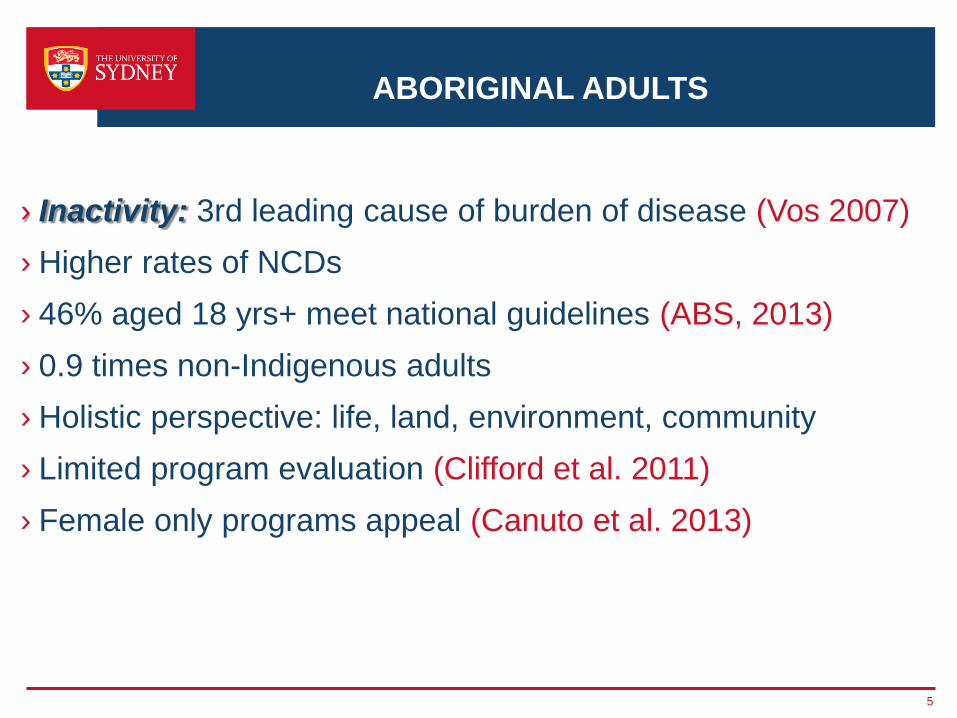
› Inactivity: 3rd leading cause of burden of disease (Vos 2007) › Higher rates of NCDs › 46% aged 18 yrs+ meet national guidelines (ABS, 2013) › 0.9 times non-Indigenous adults › Holistic perspective: life, land, environment, community › Limited program evaluation (Clifford et al. 2011) › Female only programs appeal (Canuto et al. 2013)
5
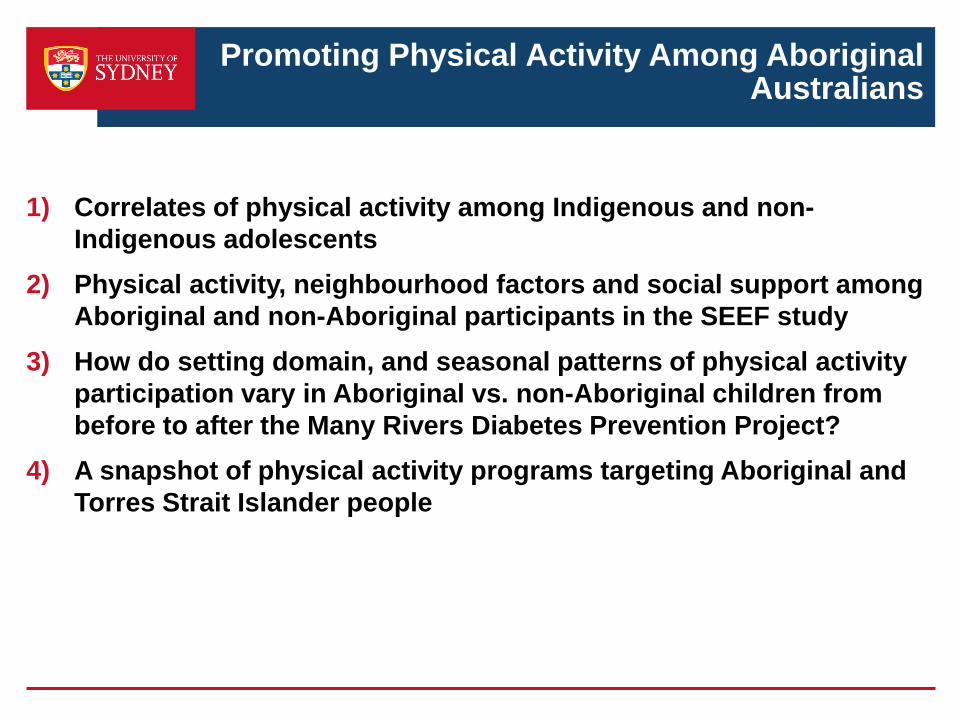
Promoting Physical Activity Among Aboriginal Australians
1) Correlates of physical activity among Indigenous and non-Indigenous adolescents
2) Physical activity, neighbourhood factors and social support among Aboriginal and non-Aboriginal participants in the SEEF study
3) How do setting domain, and seasonal patterns of physical activity participation vary in Aboriginal vs. non-Aboriginal children from before to after the Many Rivers Diabetes Prevention Project?
4) A snapshot of physical activity programs targeting Aboriginal and Torres Strait Islander people

Correlates of physical activity among Indigenous and non-Indigenous adolescents
Rona Macniven, Shane Hearn, Anne Grunseit, Justin Richards, Don
Nutbeam, Adrian Bauman
AIM
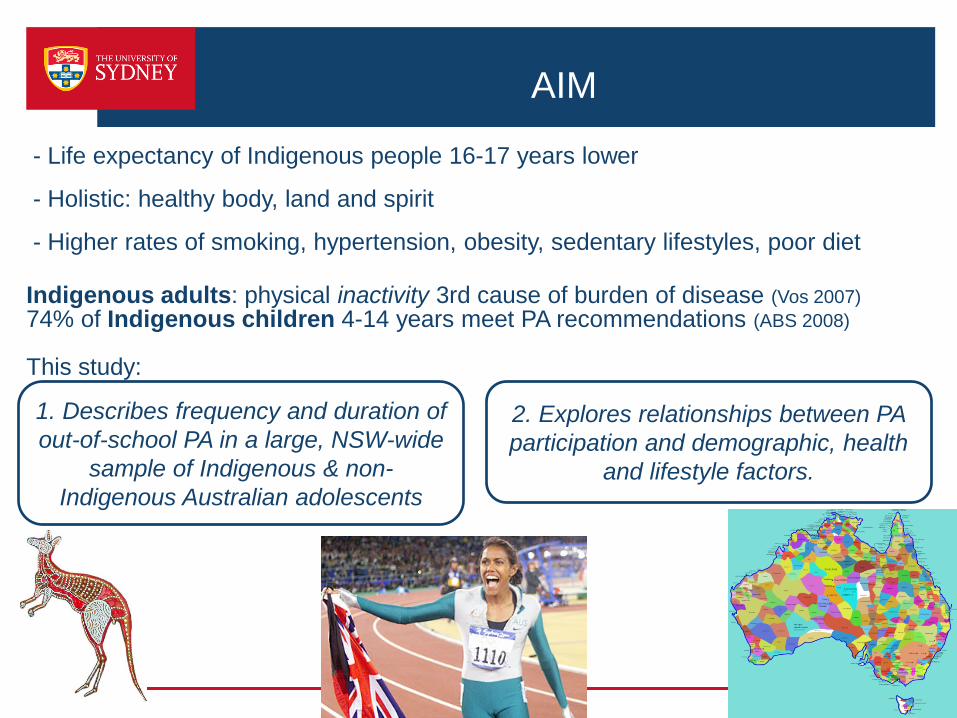
- Life expectancy of Indigenous people 16-17 years lower
- Holistic: healthy body, land and spirit
- Higher rates of smoking, hypertension, obesity, sedentary lifestyles, poor diet Indigenous adults: physical inactivity 3rd cause of burden of disease (Vos 2007) 74% of Indigenous children 4-14 years meet PA recommendations (ABS 2008) This study:
8
1. Describes frequency and duration of out-of-school PA in a large, NSW-wide
sample of Indigenous & non-Indigenous Australian adolescents
2. Explores relationships between PA participation and demographic, health
and lifestyle factors.
METHODS
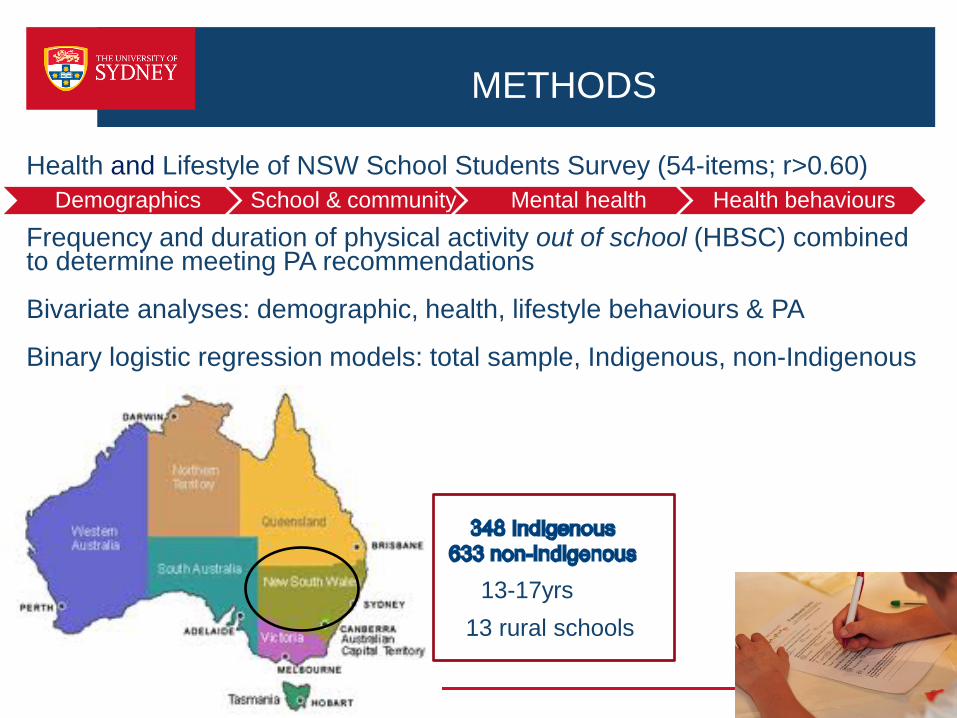
Health and Lifestyle of NSW School Students Survey (54-items; r>0.60) Frequency and duration of physical activity out of school (HBSC) combined to determine meeting PA recommendations Bivariate analyses: demographic, health, lifestyle behaviours & PA Binary logistic regression models: total sample, Indigenous, non-Indigenous
9
Demographics School & community Mental health Health behaviours
13-17yrs 13 rural schools
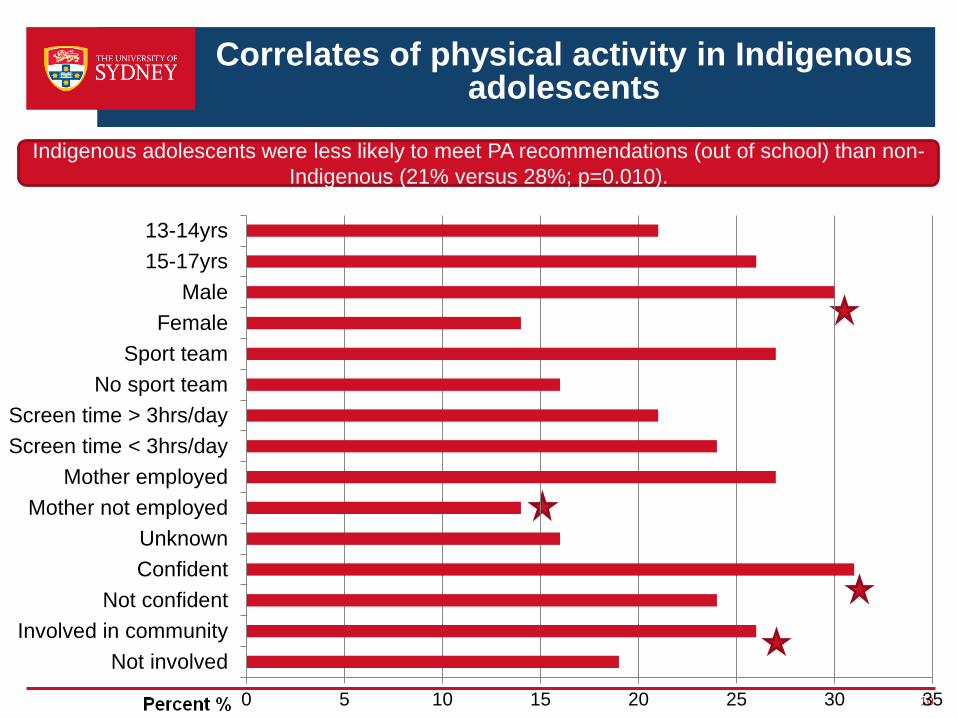
Correlates of physical activity in Indigenous adolescents
10
Indigenous adolescents were less likely to meet PA recommendations (out of school) than non-Indigenous (21% versus 28%; p=0.010).
0 5 10 15 20 25 30 35
Not involvedInvolved in community
Not confidentConfidentUnknown
Mother not employedMother employed
Screen time < 3hrs/dayScreen time > 3hrs/day
No sport teamSport team
FemaleMale
15-17yrs13-14yrs
Correlates of physical activity in Indigenous adolescents
11
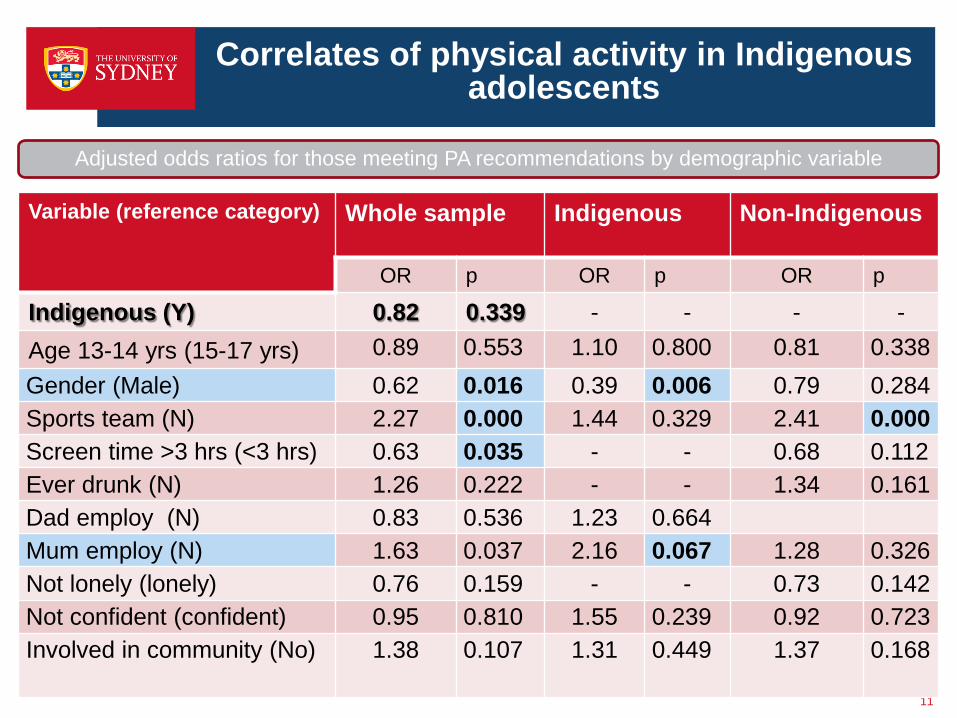
Variable (reference category) Whole sample Indigenous Non-Indigenous
OR p OR p OR p
Indigenous (Y) 0.82 0.339 - - - - Age 13-14 yrs (15-17 yrs) 0.89 0.553 1.10 0.800 0.81 0.338 Gender (Male) 0.62 0.016 0.39 0.006 0.79 0.284 Sports team (N) 2.27 0.000 1.44 0.329 2.41 0.000 Screen time >3 hrs (<3 hrs) 0.63 0.035 - - 0.68 0.112 Ever drunk (N) 1.26 0.222 - - 1.34 0.161 Dad employ (N) 0.83 0.536 1.23 0.664 Mum employ (N) 1.63 0.037 2.16 0.067 1.28 0.326 Not lonely (lonely) 0.76 0.159 - - 0.73 0.142 Not confident (confident) 0.95 0.810 1.55 0.239 0.92 0.723 Involved in community (No) 1.38 0.107 1.31 0.449 1.37 0.168
Adjusted odds ratios for those meeting PA recommendations by demographic variable
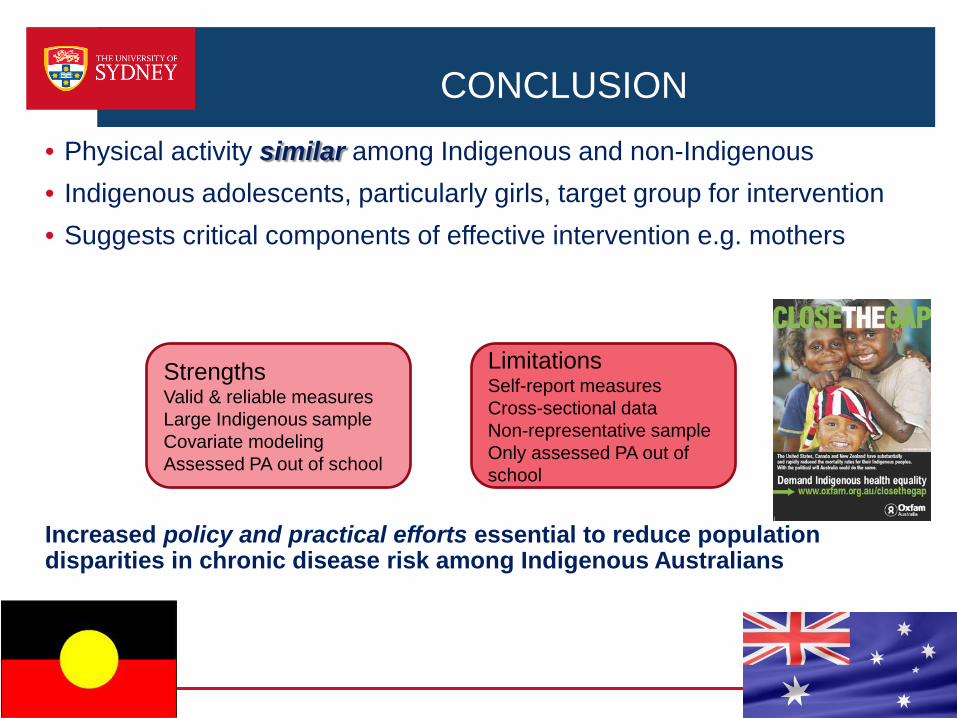
CONCLUSION
• Physical activity similar among Indigenous and non-Indigenous • Indigenous adolescents, particularly girls, target group for intervention • Suggests critical components of effective intervention e.g. mothers Increased policy and practical efforts essential to reduce population disparities in chronic disease risk among Indigenous Australians
12
Strengths Valid & reliable measures Large Indigenous sample Covariate modeling Assessed PA out of school
Limitations Self-report measures Cross-sectional data Non-representative sample Only assessed PA out of school
Promoting Physical Activity Among Aboriginal Australians
1) Correlates of physical activity among Indigenous and non-Indigenous adolescents
2) Physical activity, neighbourhood factors and social support among Aboriginal and non-Aboriginal participants in the SEEF study
Physical activity, neighbourhood factors and social support among Aboriginal and non-Aboriginal participants in the SEEF study
Rona Macniven1, Lina Gubhaju2, Sandra Eades2,3, Bridgette McNamara2, Emily Banks3,4, Grace Joshy4, Justin Richards1,
Adrian Bauman1 1School of Public Health, The University of Sydney
2Aboriginal Health Program, Baker IDI Heart and Diabetes Institute 3The Sax Institute
4National Centre for Epidemiology and Population Health, Australian National University
Aboriginal Health and Medical Research Council of New South Wales and Aboriginal people of New
South Wales
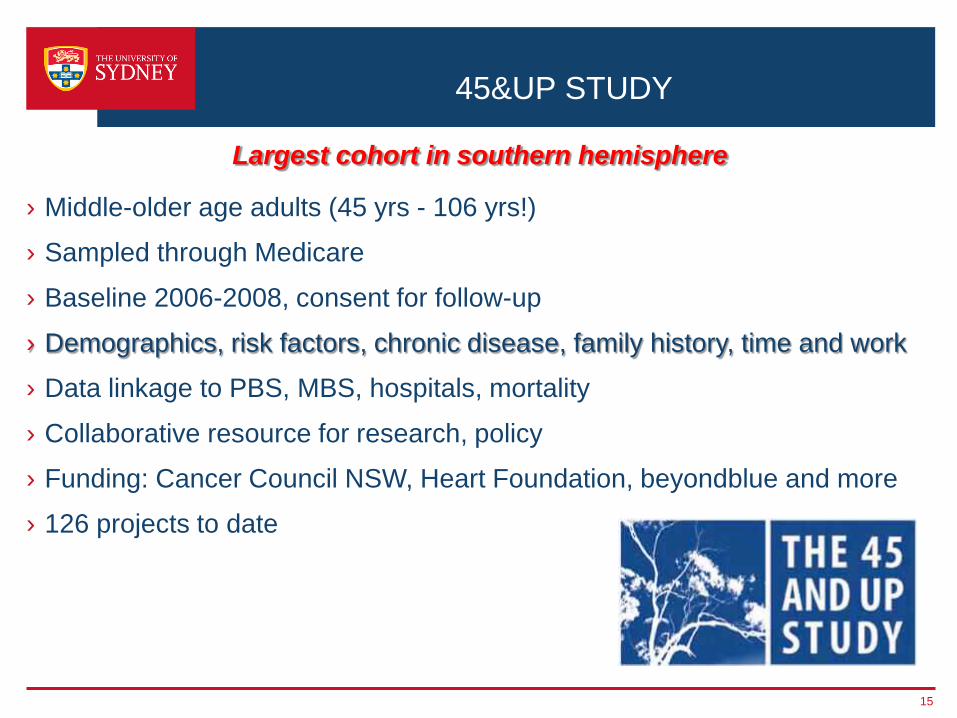
45&UP STUDY
› Middle-older age adults (45 yrs - 106 yrs!)
› Sampled through Medicare
› Baseline 2006-2008, consent for follow-up
› Demographics, risk factors, chronic disease, family history, time and work
› Data linkage to PBS, MBS, hospitals, mortality
› Collaborative resource for research, policy
› Funding: Cancer Council NSW, Heart Foundation, beyondblue and more
› 126 projects to date
15
Largest cohort in southern hemisphere
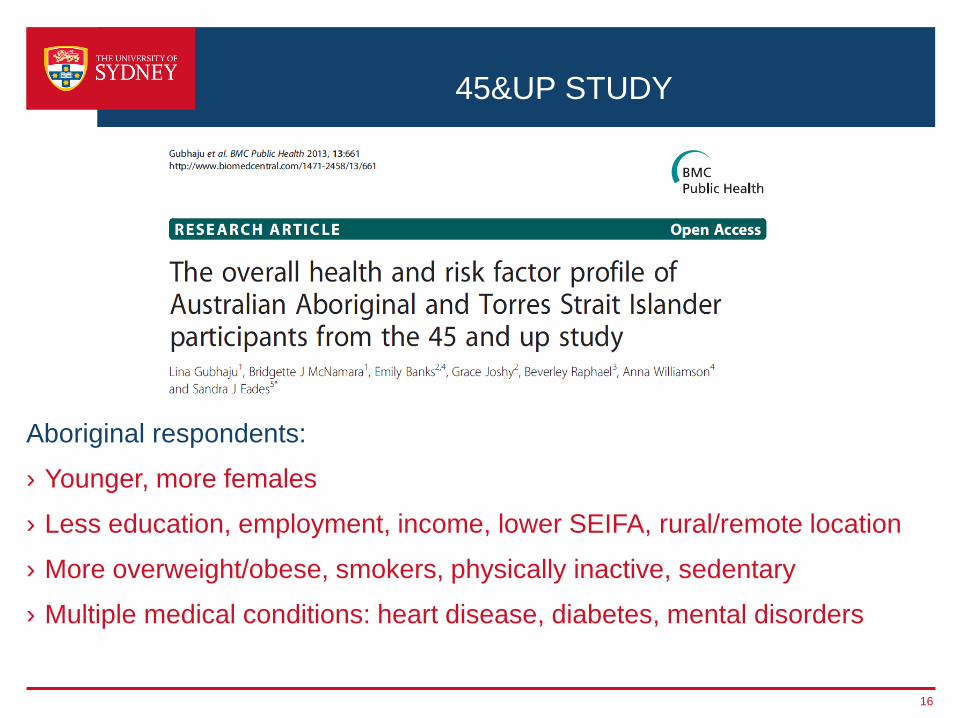
45&UP STUDY
Aboriginal respondents:
› Younger, more females
› Less education, employment, income, lower SEIFA, rural/remote location
› More overweight/obese, smokers, physically inactive, sedentary
› Multiple medical conditions: heart disease, diabetes, mental disorders
16
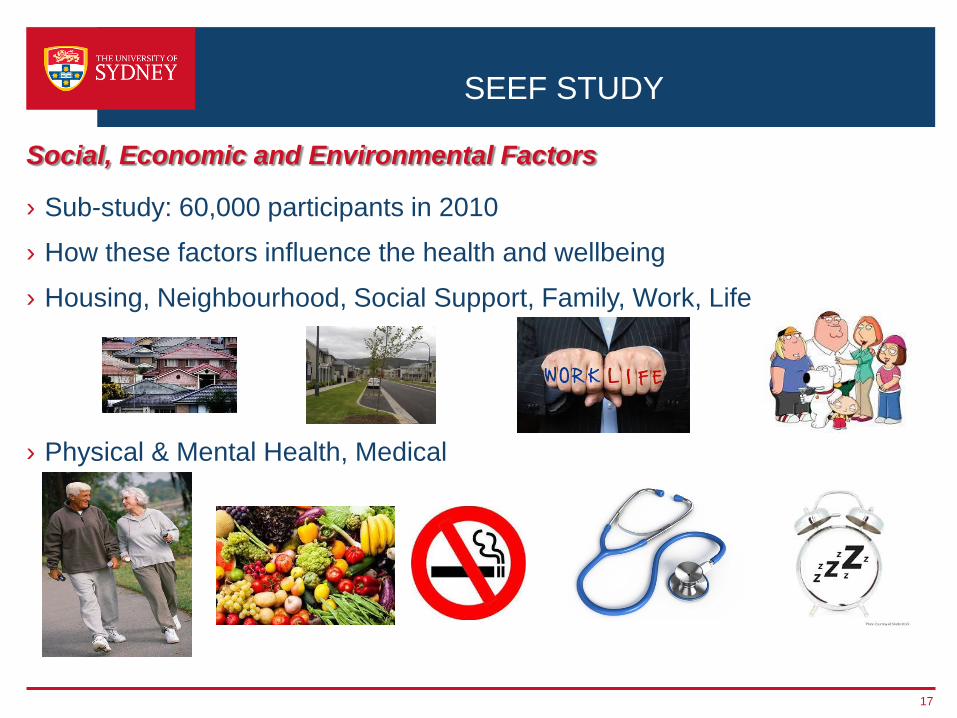
SEEF STUDY
› Sub-study: 60,000 participants in 2010
› How these factors influence the health and wellbeing
› Housing, Neighbourhood, Social Support, Family, Work, Life
› Physical & Mental Health, Medical
17
Social, Economic and Environmental Factors
DETERMINANTS OF PHYSICAL ACTIVITY
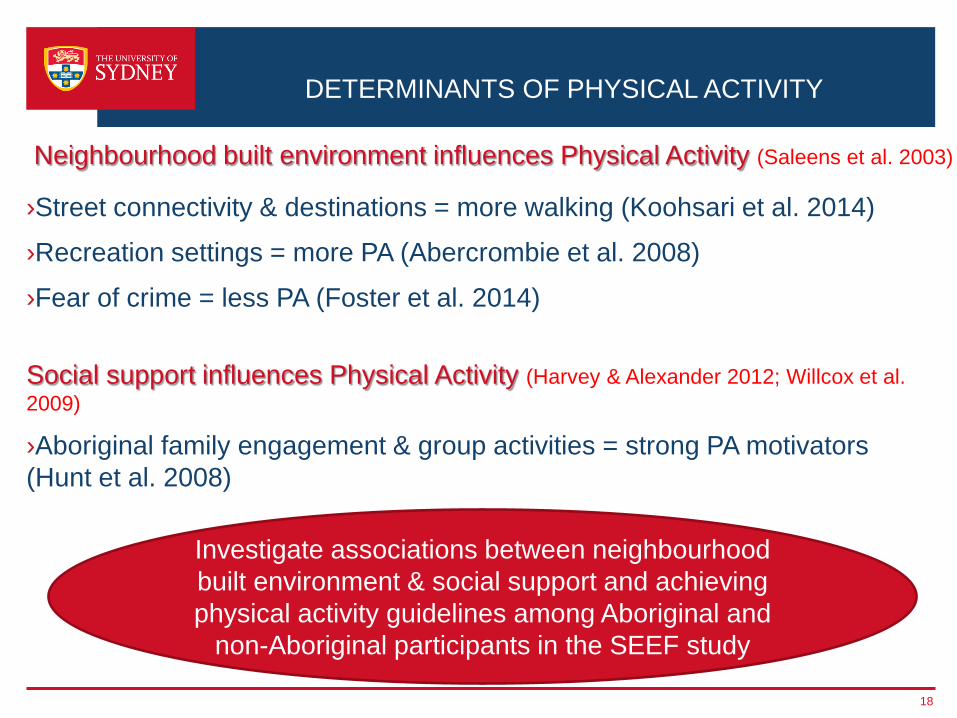
›Street connectivity & destinations = more walking (Koohsari et al. 2014)
›Recreation settings = more PA (Abercrombie et al. 2008)
›Fear of crime = less PA (Foster et al. 2014)
Social support influences Physical Activity (Harvey & Alexander 2012; Willcox et al. 2009)
›Aboriginal family engagement & group activities = strong PA motivators (Hunt et al. 2008)
18
Neighbourhood built environment influences Physical Activity (Saleens et al. 2003)
Investigate associations between neighbourhood built environment & social support and achieving physical activity guidelines among Aboriginal and
non-Aboriginal participants in the SEEF study
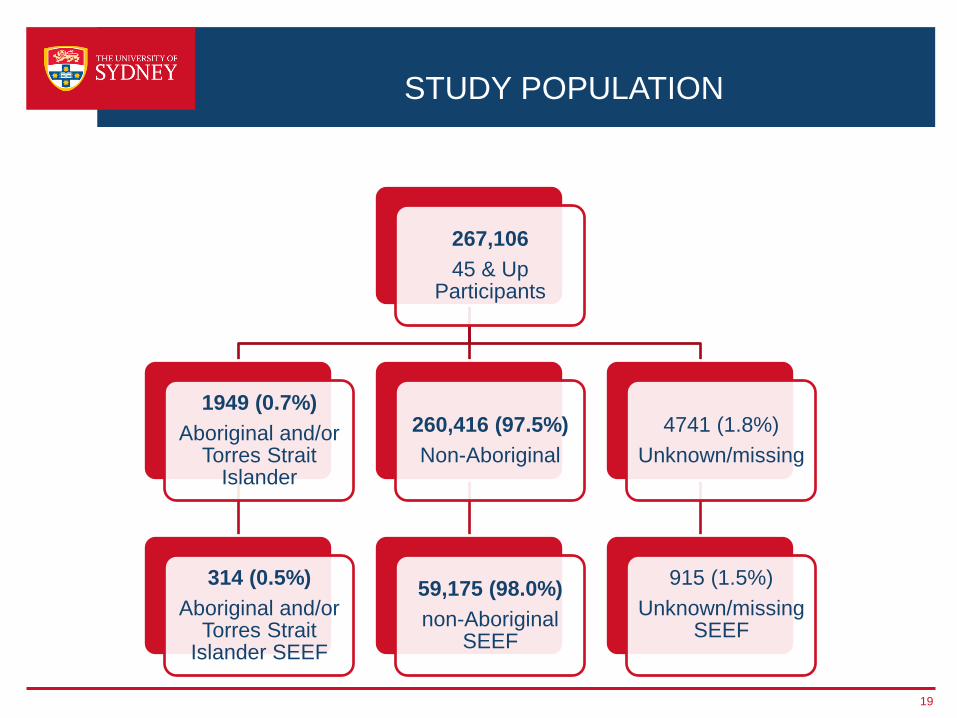
STUDY POPULATION
19
267,106 45 & Up
Participants
1949 (0.7%) Aboriginal and/or
Torres Strait Islander
314 (0.5%) Aboriginal and/or
Torres Strait Islander SEEF
260,416 (97.5%) Non-Aboriginal
59,175 (98.0%) non-Aboriginal
SEEF
4741 (1.8%) Unknown/missing
915 (1.5%) Unknown/missing
SEEF
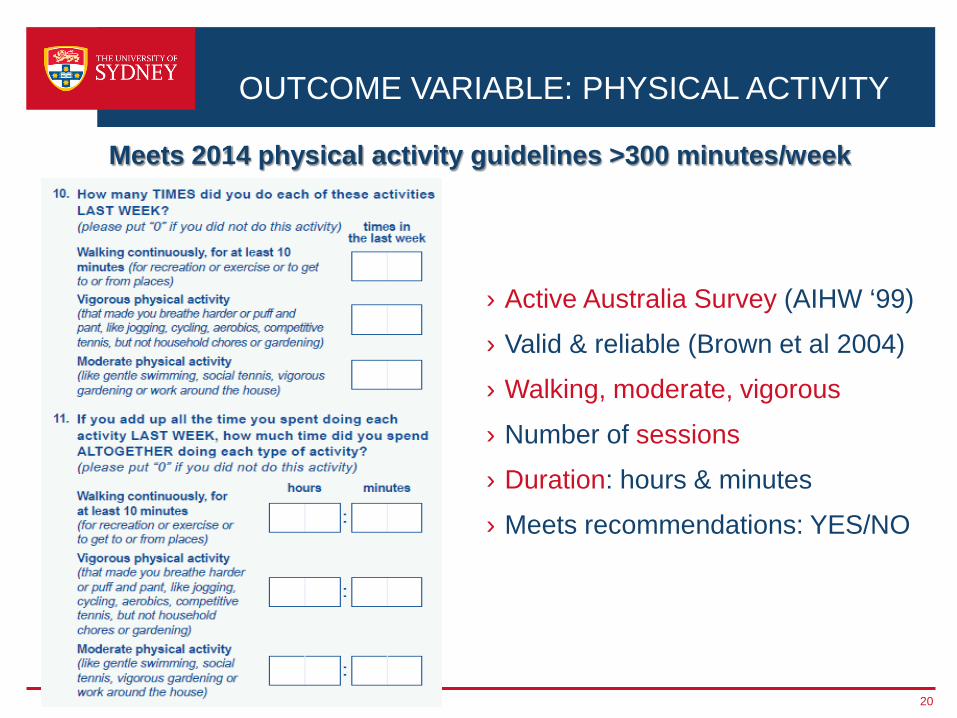
OUTCOME VARIABLE: PHYSICAL ACTIVITY
› Active Australia Survey (AIHW ‘99)
› Valid & reliable (Brown et al 2004)
› Walking, moderate, vigorous
› Number of sessions
› Duration: hours & minutes
› Meets recommendations: YES/NO
20
Meets 2014 physical activity guidelines >300 minutes/week
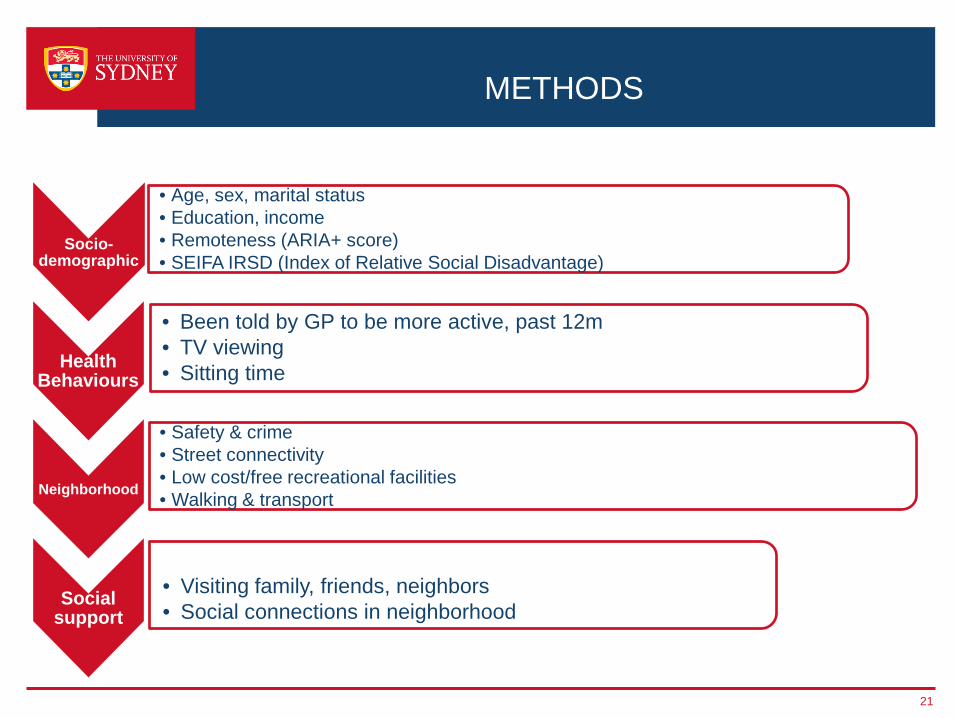
METHODS
Socio-demographic
• Age, sex, marital status • Education, income • Remoteness (ARIA+ score) • SEIFA IRSD (Index of Relative Social Disadvantage)
Health Behaviours
• Been told by GP to be more active, past 12m • TV viewing • Sitting time
Neighborhood
• Safety & crime • Street connectivity • Low cost/free recreational facilities • Walking & transport
Social support
• Visiting family, friends, neighbors • Social connections in neighborhood
21
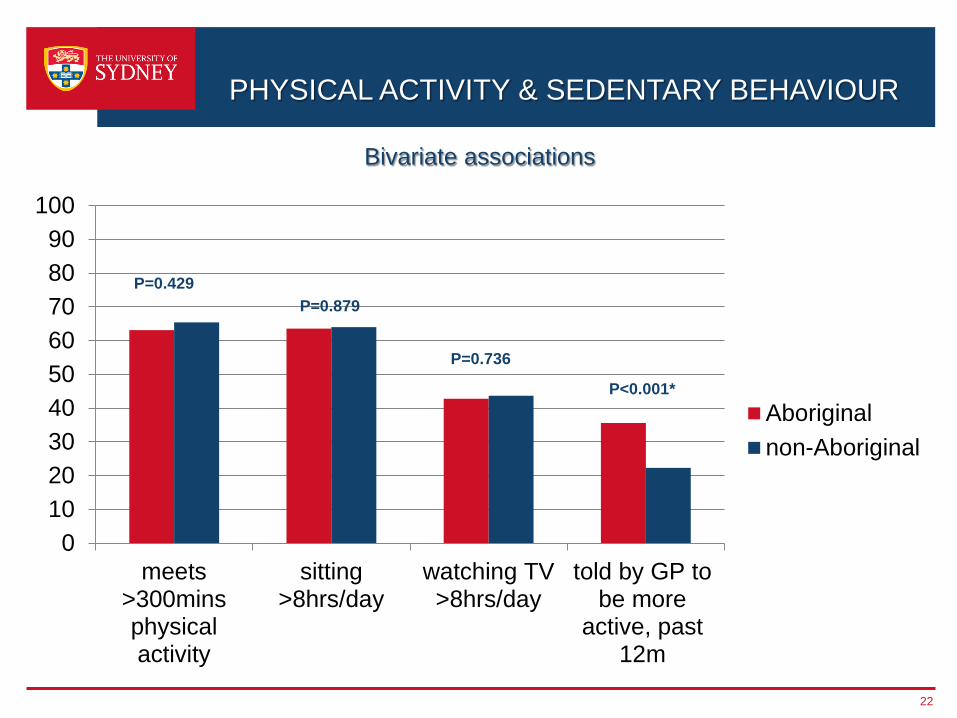
PHYSICAL ACTIVITY & SEDENTARY BEHAVIOUR
22
Bivariate associations
0102030405060708090
100
meets>300minsphysicalactivity
sitting>8hrs/day
watching TV>8hrs/day
told by GP tobe more
active, past12m
Aboriginalnon-Aboriginal
P=0.429
P<0.001*
P=0.736
P=0.879
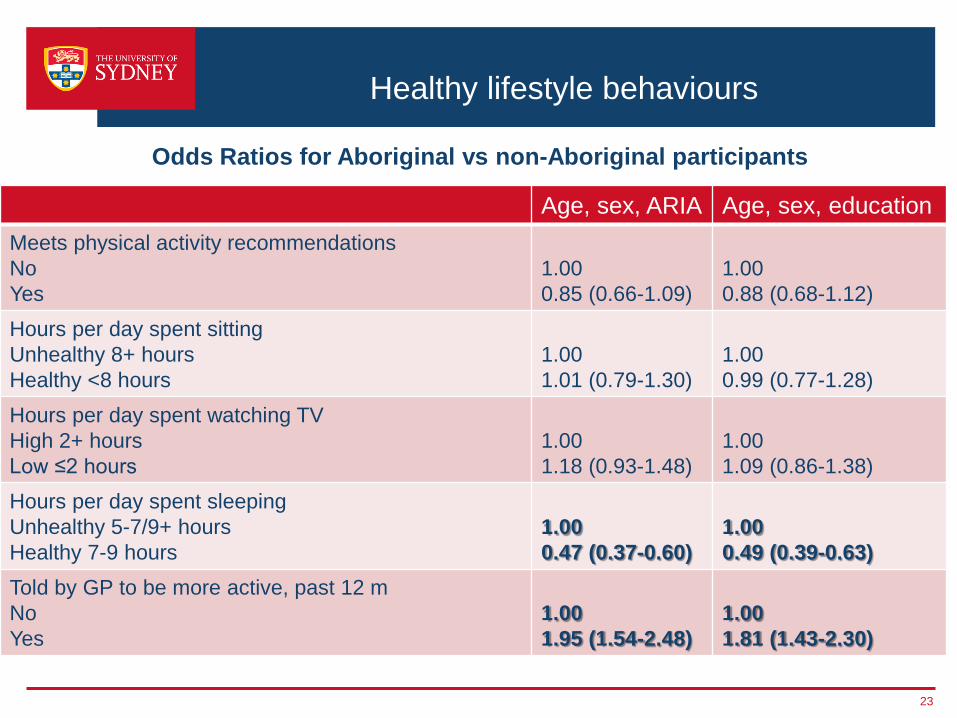
Healthy lifestyle behaviours
Age, sex, ARIA Age, sex, education Meets physical activity recommendations No Yes
1.00 0.85 (0.66-1.09)
1.00 0.88 (0.68-1.12)
Hours per day spent sitting Unhealthy 8+ hours Healthy <8 hours
1.00 1.01 (0.79-1.30)
1.00 0.99 (0.77-1.28)
Hours per day spent watching TV High 2+ hours Low ≤2 hours
1.00 1.18 (0.93-1.48)
1.00 1.09 (0.86-1.38)
Hours per day spent sleeping Unhealthy 5-7/9+ hours Healthy 7-9 hours
1.00 0.47 (0.37-0.60)
1.00 0.49 (0.39-0.63)
Told by GP to be more active, past 12 m No Yes
1.00 1.95 (1.54-2.48)
1.00 1.81 (1.43-2.30)
23
Odds Ratios for Aboriginal vs non-Aboriginal participants
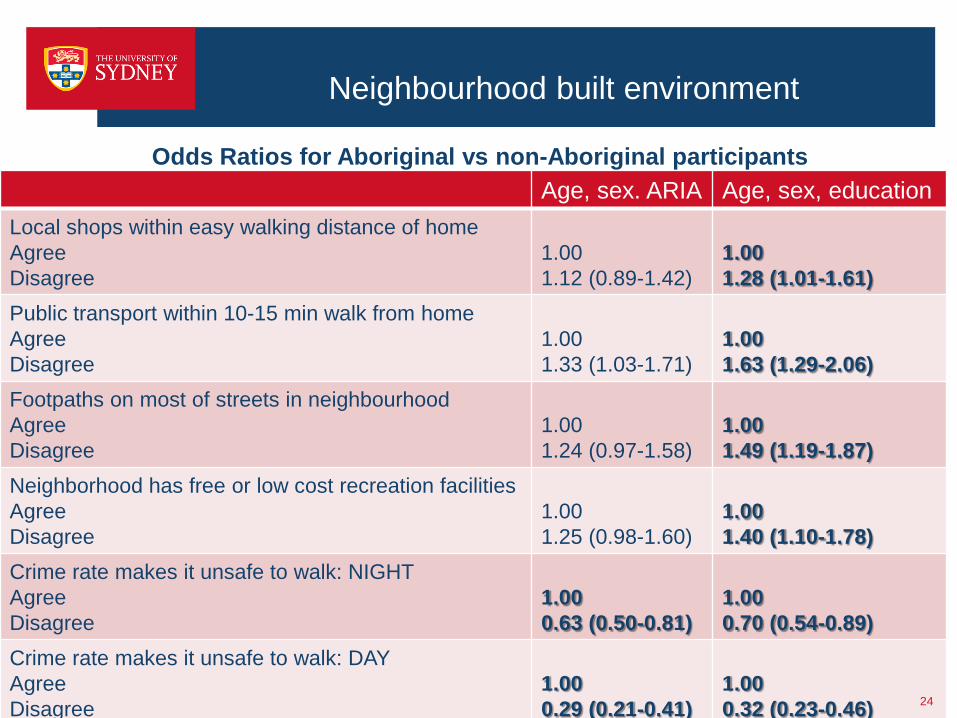
Neighbourhood built environment
Age, sex. ARIA Age, sex, education Local shops within easy walking distance of home Agree Disagree
1.00 1.12 (0.89-1.42)
1.00 1.28 (1.01-1.61)
Public transport within 10-15 min walk from home Agree Disagree
1.00 1.33 (1.03-1.71)
1.00 1.63 (1.29-2.06)
Footpaths on most of streets in neighbourhood Agree Disagree
1.00 1.24 (0.97-1.58)
1.00 1.49 (1.19-1.87)
Neighborhood has free or low cost recreation facilities Agree Disagree
1.00 1.25 (0.98-1.60)
1.00 1.40 (1.10-1.78)
Crime rate makes it unsafe to walk: NIGHT Agree Disagree
1.00 0.63 (0.50-0.81)
1.00 0.70 (0.54-0.89)
Crime rate makes it unsafe to walk: DAY Agree Disagree
1.00 0.29 (0.21-0.41)
1.00 0.32 (0.23-0.46) 24
Odds Ratios for Aboriginal vs non-Aboriginal participants
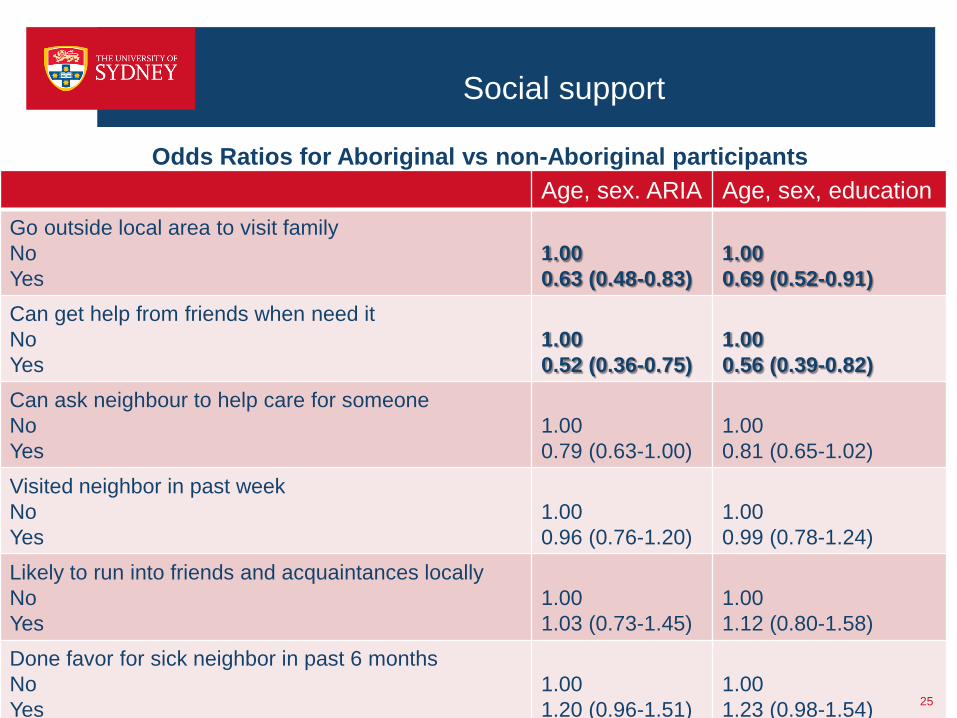
Social support
Age, sex. ARIA Age, sex, education Go outside local area to visit family No Yes
1.00 0.63 (0.48-0.83)
1.00 0.69 (0.52-0.91)
Can get help from friends when need it No Yes
1.00 0.52 (0.36-0.75)
1.00 0.56 (0.39-0.82)
Can ask neighbour to help care for someone No Yes
1.00 0.79 (0.63-1.00)
1.00 0.81 (0.65-1.02)
Visited neighbor in past week No Yes
1.00 0.96 (0.76-1.20)
1.00 0.99 (0.78-1.24)
Likely to run into friends and acquaintances locally No Yes
1.00 1.03 (0.73-1.45)
1.00 1.12 (0.80-1.58)
Done favor for sick neighbor in past 6 months No Yes
1.00 1.20 (0.96-1.51)
1.00 1.23 (0.98-1.54) 25
Odds Ratios for Aboriginal vs non-Aboriginal participants
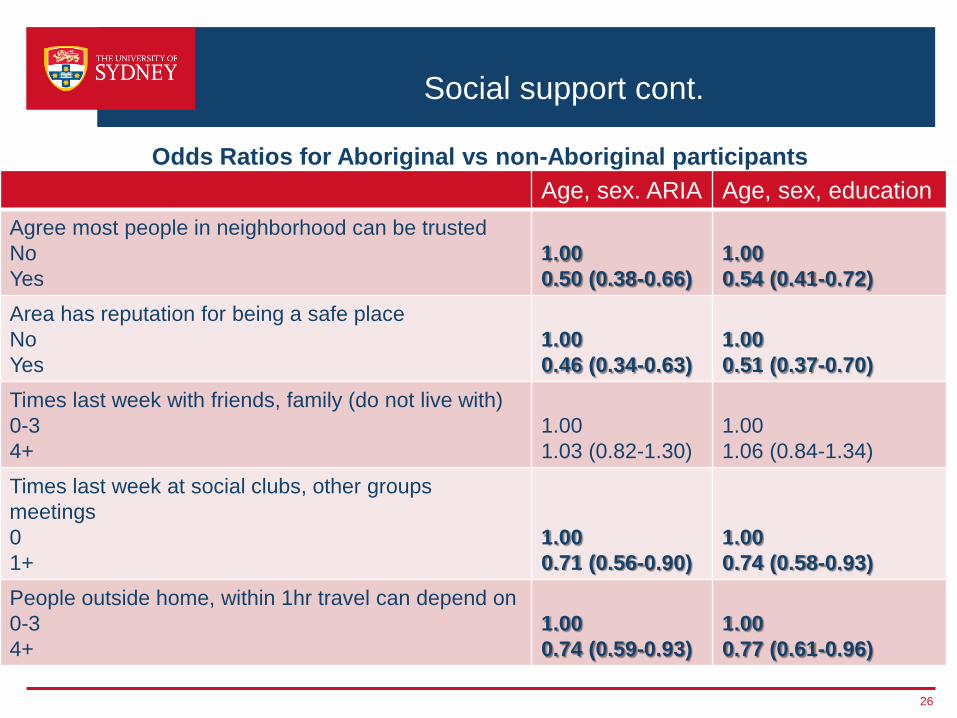
Social support cont.
Age, sex. ARIA Age, sex, education Agree most people in neighborhood can be trusted No Yes
1.00 0.50 (0.38-0.66)
1.00 0.54 (0.41-0.72)
Area has reputation for being a safe place No Yes
1.00 0.46 (0.34-0.63)
1.00 0.51 (0.37-0.70)
Times last week with friends, family (do not live with) 0-3 4+
1.00 1.03 (0.82-1.30)
1.00 1.06 (0.84-1.34)
Times last week at social clubs, other groups meetings 0 1+
1.00 0.71 (0.56-0.90)
1.00 0.74 (0.58-0.93)
People outside home, within 1hr travel can depend on 0-3 4+
1.00 0.74 (0.59-0.93)
1.00 0.77 (0.61-0.96)
26
Odds Ratios for Aboriginal vs non-Aboriginal participants
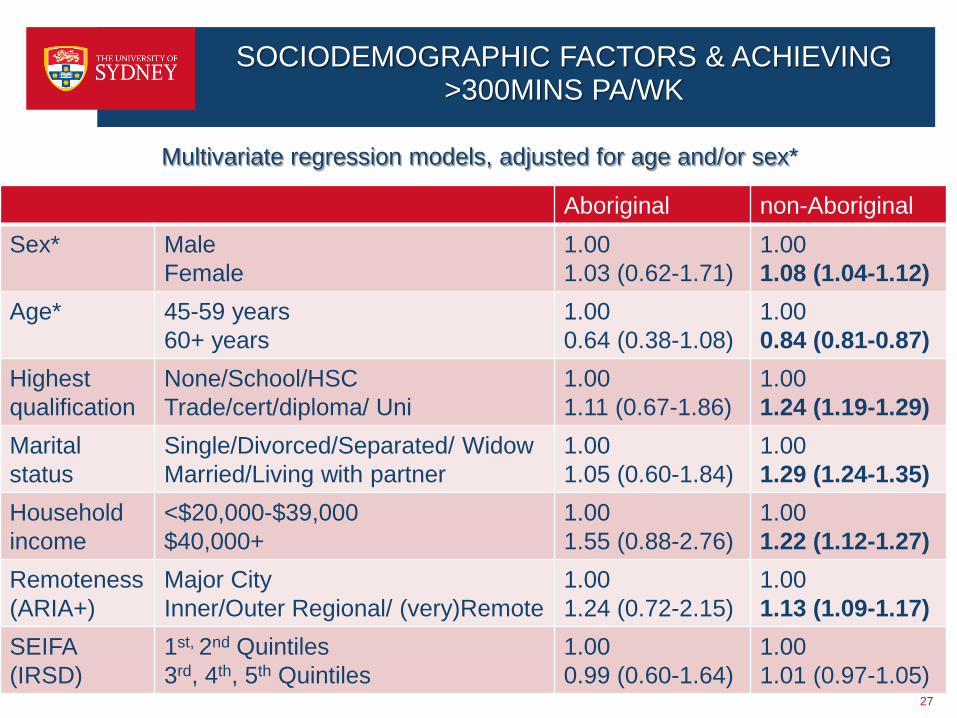
SOCIODEMOGRAPHIC FACTORS & ACHIEVING >300MINS PA/WK
Aboriginal non-Aboriginal Sex* Male
Female 1.00 1.03 (0.62-1.71)
1.00 1.08 (1.04-1.12)
Age* 45-59 years 60+ years
1.00 0.64 (0.38-1.08)
1.00 0.84 (0.81-0.87)
Highest qualification
None/School/HSC Trade/cert/diploma/ Uni
1.00 1.11 (0.67-1.86)
1.00 1.24 (1.19-1.29)
Marital status
Single/Divorced/Separated/ Widow Married/Living with partner
1.00 1.05 (0.60-1.84)
1.00 1.29 (1.24-1.35)
Household income
<$20,000-$39,000 $40,000+
1.00 1.55 (0.88-2.76)
1.00 1.22 (1.12-1.27)
Remoteness (ARIA+)
Major City Inner/Outer Regional/ (very)Remote
1.00 1.24 (0.72-2.15)
1.00 1.13 (1.09-1.17)
SEIFA (IRSD)
1st, 2nd Quintiles 3rd, 4th, 5th Quintiles
1.00 0.99 (0.60-1.64)
1.00 1.01 (0.97-1.05)
27
Multivariate regression models, adjusted for age and/or sex*
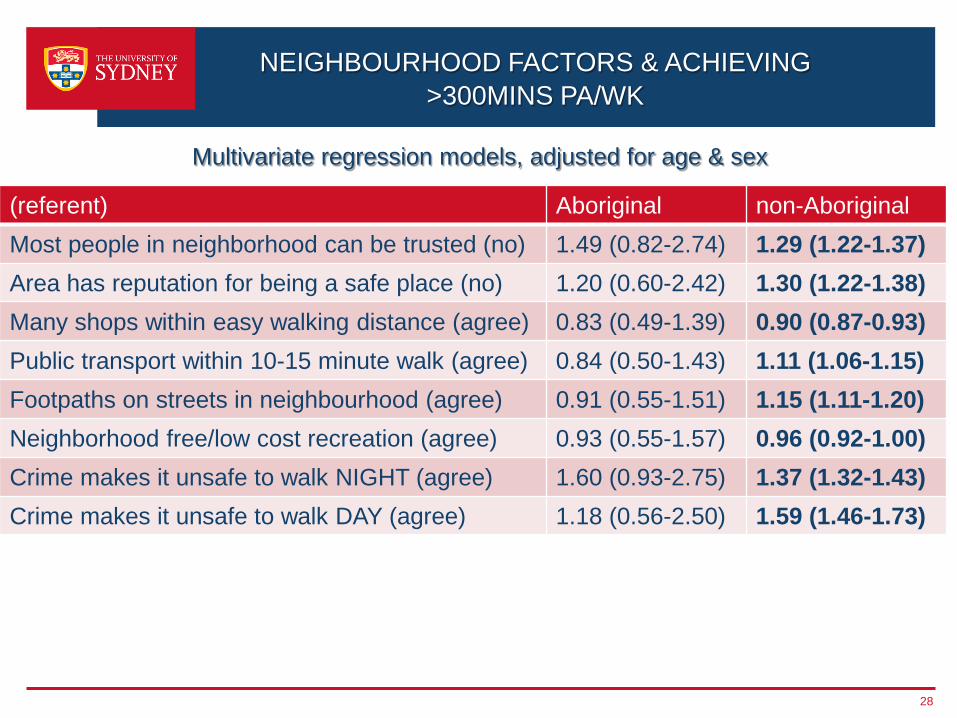
NEIGHBOURHOOD FACTORS & ACHIEVING >300MINS PA/WK
(referent) Aboriginal non-Aboriginal Most people in neighborhood can be trusted (no) 1.49 (0.82-2.74) 1.29 (1.22-1.37) Area has reputation for being a safe place (no) 1.20 (0.60-2.42) 1.30 (1.22-1.38) Many shops within easy walking distance (agree) 0.83 (0.49-1.39) 0.90 (0.87-0.93) Public transport within 10-15 minute walk (agree) 0.84 (0.50-1.43) 1.11 (1.06-1.15) Footpaths on streets in neighbourhood (agree) 0.91 (0.55-1.51) 1.15 (1.11-1.20) Neighborhood free/low cost recreation (agree) 0.93 (0.55-1.57) 0.96 (0.92-1.00) Crime makes it unsafe to walk NIGHT (agree) 1.60 (0.93-2.75) 1.37 (1.32-1.43) Crime makes it unsafe to walk DAY (agree) 1.18 (0.56-2.50) 1.59 (1.46-1.73)
28
Multivariate regression models, adjusted for age & sex
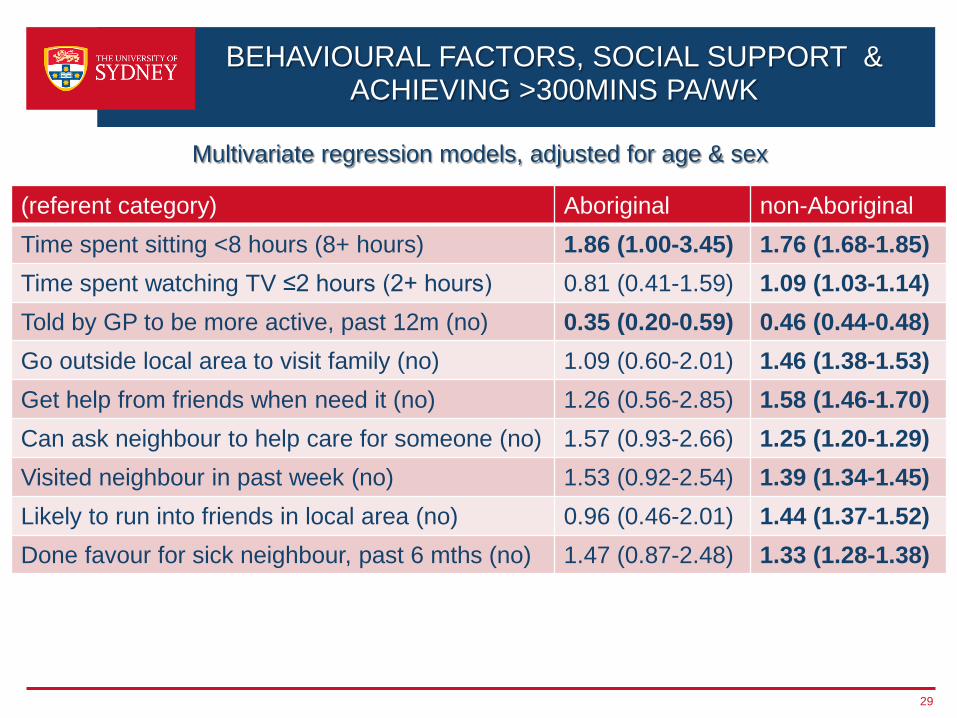
BEHAVIOURAL FACTORS, SOCIAL SUPPORT & ACHIEVING >300MINS PA/WK
(referent category) Aboriginal non-Aboriginal Time spent sitting <8 hours (8+ hours) 1.86 (1.00-3.45) 1.76 (1.68-1.85) Time spent watching TV ≤2 hours (2+ hours) 0.81 (0.41-1.59) 1.09 (1.03-1.14) Told by GP to be more active, past 12m (no) 0.35 (0.20-0.59) 0.46 (0.44-0.48) Go outside local area to visit family (no) 1.09 (0.60-2.01) 1.46 (1.38-1.53) Get help from friends when need it (no) 1.26 (0.56-2.85) 1.58 (1.46-1.70) Can ask neighbour to help care for someone (no) 1.57 (0.93-2.66) 1.25 (1.20-1.29) Visited neighbour in past week (no) 1.53 (0.92-2.54) 1.39 (1.34-1.45) Likely to run into friends in local area (no) 0.96 (0.46-2.01) 1.44 (1.37-1.52) Done favour for sick neighbour, past 6 mths (no) 1.47 (0.87-2.48) 1.33 (1.28-1.38)
29
Multivariate regression models, adjusted for age & sex
CONCLUSION AND NEXT STEPS
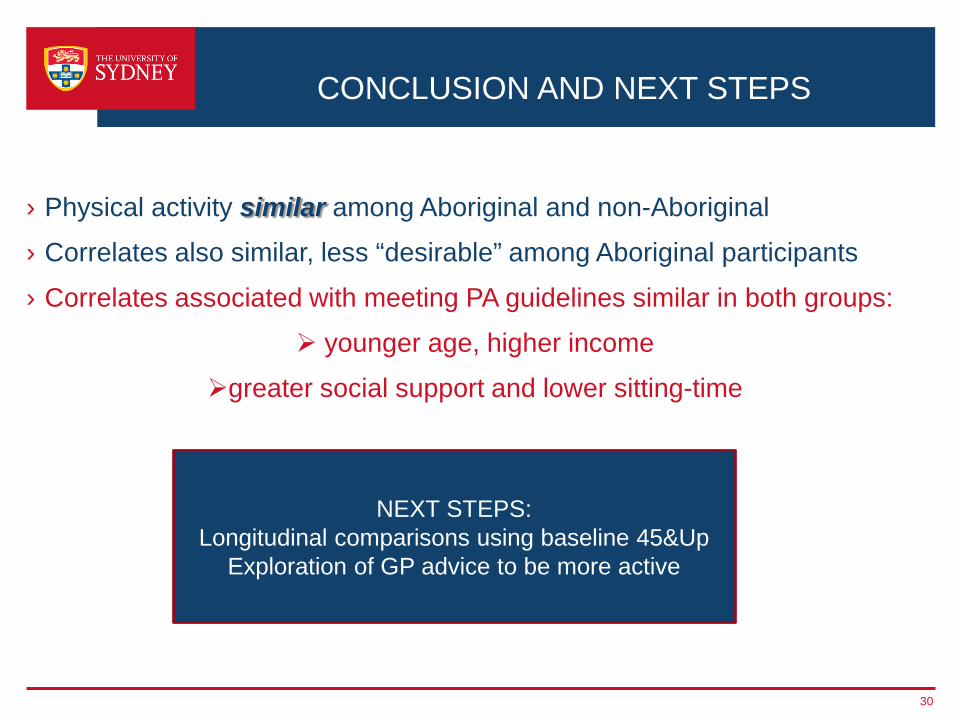
› Physical activity similar among Aboriginal and non-Aboriginal
› Correlates also similar, less “desirable” among Aboriginal participants
› Correlates associated with meeting PA guidelines similar in both groups:
younger age, higher income
greater social support and lower sitting-time
30
NEXT STEPS: Longitudinal comparisons using baseline 45&Up
Exploration of GP advice to be more active
Promoting Physical Activity Among Aboriginal Australians
1) Correlates of physical activity among Indigenous and non-Indigenous adolescents
2) Physical activity, neighbourhood factors and social support among Aboriginal and non-Aboriginal participants in the SEEF study
3) How do setting domain, and seasonal patterns of physical activity participation vary in Aboriginal vs. non-Aboriginal children from before to after the Many Rivers Diabetes Prevention Project?
How do setting domain, and seasonal patterns of physical activity participation vary in Aboriginal vs. non-Aboriginal children from before to after the Many Rivers Diabetes Prevention Project?
Biripi Aboriginal Corporation Medical Service Durri Aboriginal Corporation Medical Service
Rona Macniven, Josephine Gywnne, Nicole Turner, Justin Richards,
Adrian Bauman
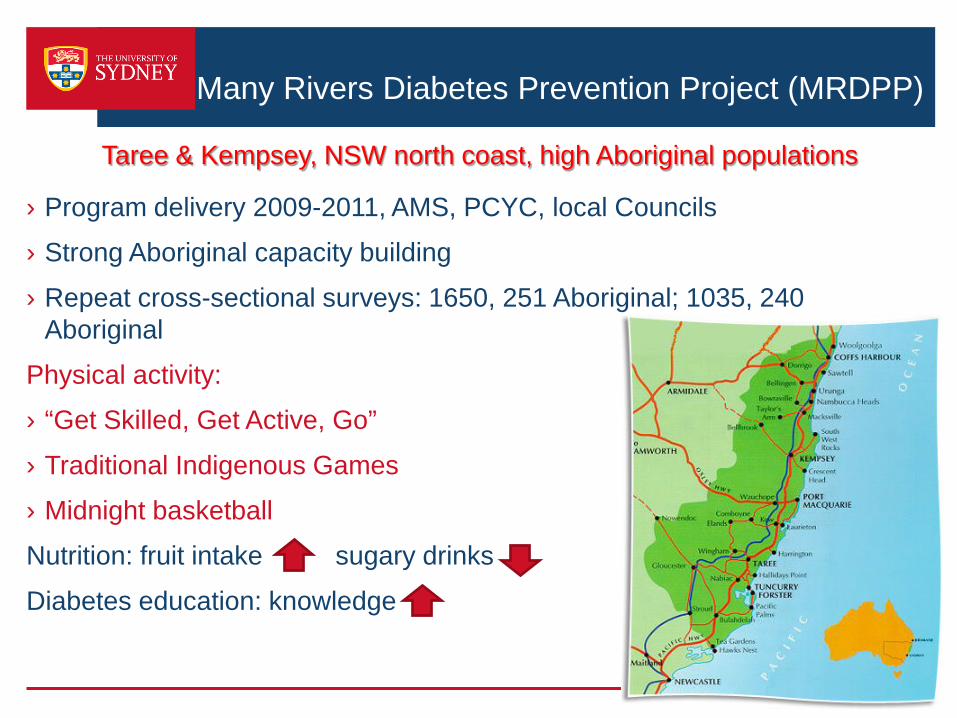
Many Rivers Diabetes Prevention Project (MRDPP)
› Program delivery 2009-2011, AMS, PCYC, local Councils
› Strong Aboriginal capacity building
› Repeat cross-sectional surveys: 1650, 251 Aboriginal; 1035, 240 Aboriginal
Physical activity:
› “Get Skilled, Get Active, Go”
› Traditional Indigenous Games
› Midnight basketball
Nutrition: fruit intake sugary drinks
Diabetes education: knowledge
Taree & Kempsey, NSW north coast, high Aboriginal populations
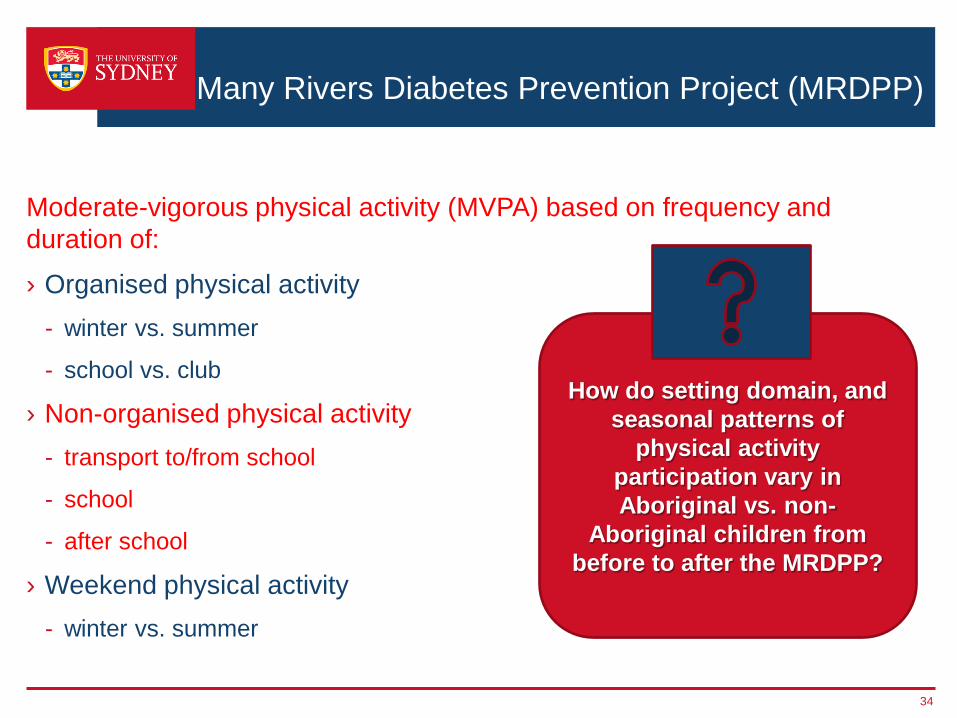
Many Rivers Diabetes Prevention Project (MRDPP)
Moderate-vigorous physical activity (MVPA) based on frequency and duration of:
› Organised physical activity - winter vs. summer
- school vs. club
› Non-organised physical activity - transport to/from school
- school
- after school
› Weekend physical activity - winter vs. summer
34
How do setting domain, and seasonal patterns of
physical activity participation vary in Aboriginal vs. non-
Aboriginal children from before to after the MRDPP?
Promoting Physical Activity Among Australian Aboriginal Australians
1) Correlates of physical activity among Indigenous and non-Indigenous adolescents
2) Physical activity, neighbourhood factors and social support among Aboriginal and non-Aboriginal participants in the SEEF study
3) How do setting domain, and seasonal patterns of physical activity participation vary in Aboriginal vs. non-Aboriginal children from before to after the Many Rivers Diabetes Prevention Project?
4) A snapshot of physical activity programs targeting Aboriginal and Torres Strait Islander people
A snapshot of physical activity programs targeting Aboriginal and Torres Strait Islander people
Rona Macniven, Justin Richards, Adrian Bauman
Kathy Ride, Michelle Elwell
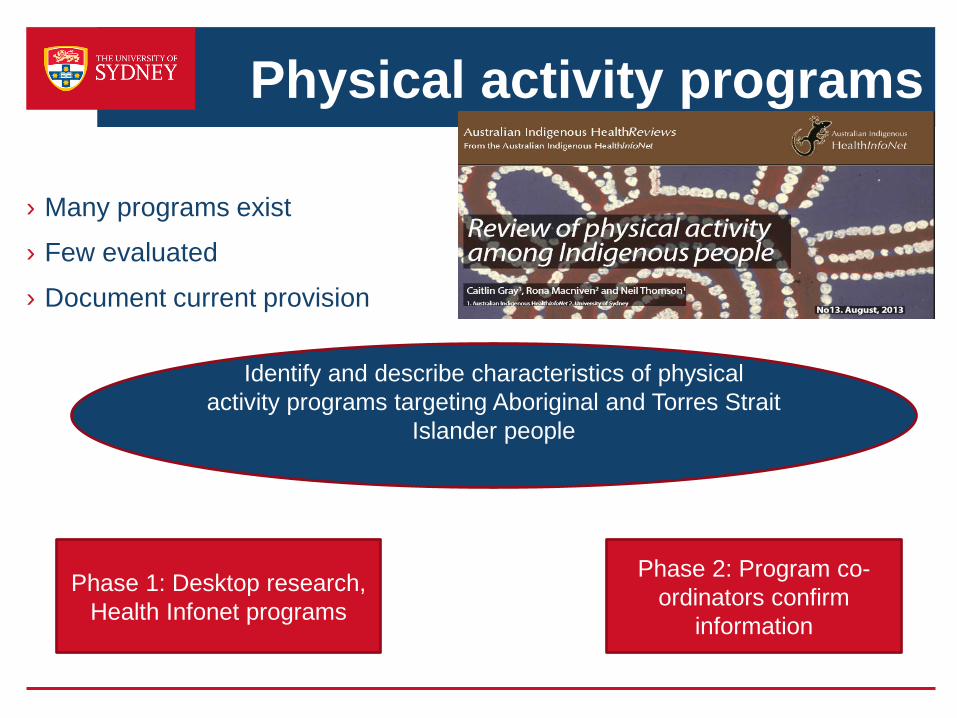
Physical activity programs
› Many programs exist
› Few evaluated
› Document current provision
Phase 1: Desktop research, Health Infonet programs
Phase 2: Program co-ordinators confirm
information
Identify and describe characteristics of physical activity programs targeting Aboriginal and Torres Strait
Islander people
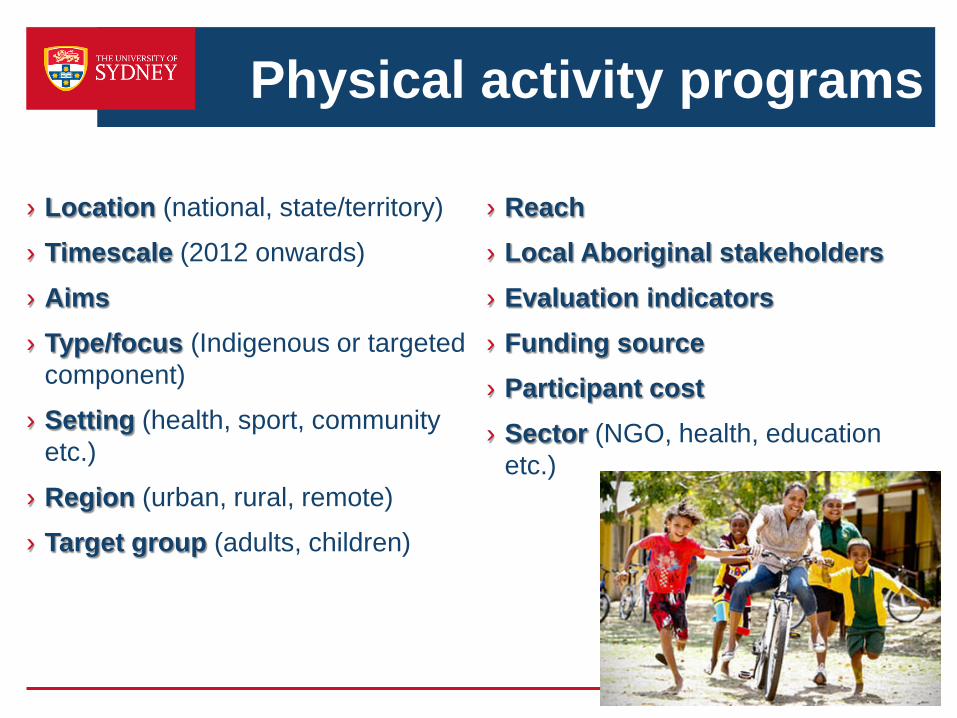
Physical activity programs
› Location (national, state/territory)
› Timescale (2012 onwards)
› Aims › Type/focus (Indigenous or targeted
component)
› Setting (health, sport, community etc.)
› Region (urban, rural, remote)
› Target group (adults, children)
› Reach › Local Aboriginal stakeholders › Evaluation indicators › Funding source › Participant cost › Sector (NGO, health, education
etc.)
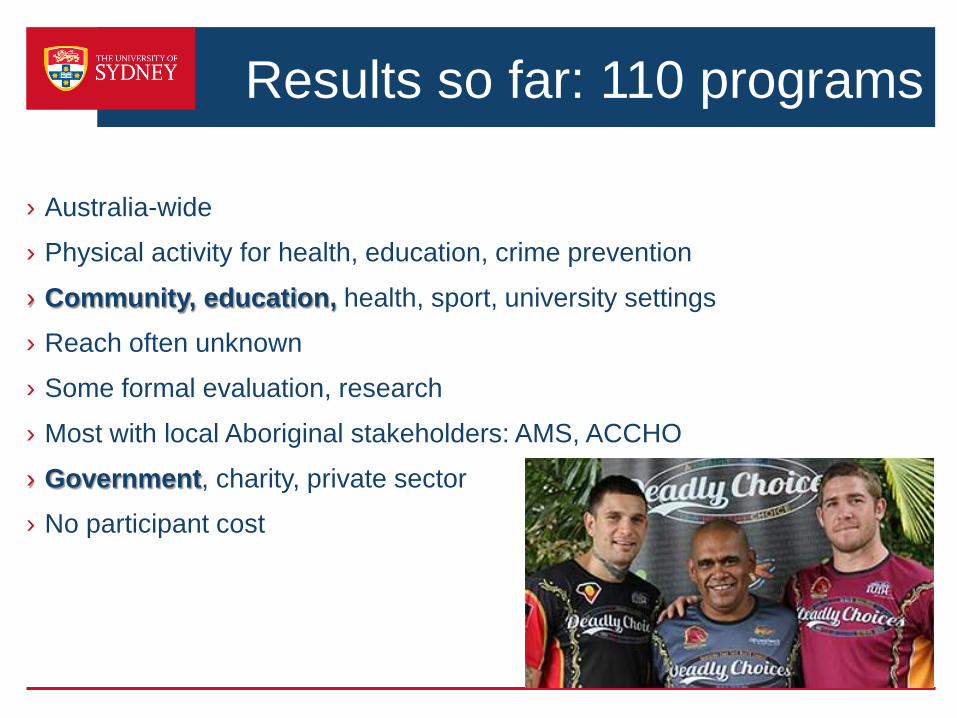
Results so far: 110 programs
› Australia-wide
› Physical activity for health, education, crime prevention
› Community, education, health, sport, university settings
› Reach often unknown
› Some formal evaluation, research
› Most with local Aboriginal stakeholders: AMS, ACCHO
› Government, charity, private sector
› No participant cost
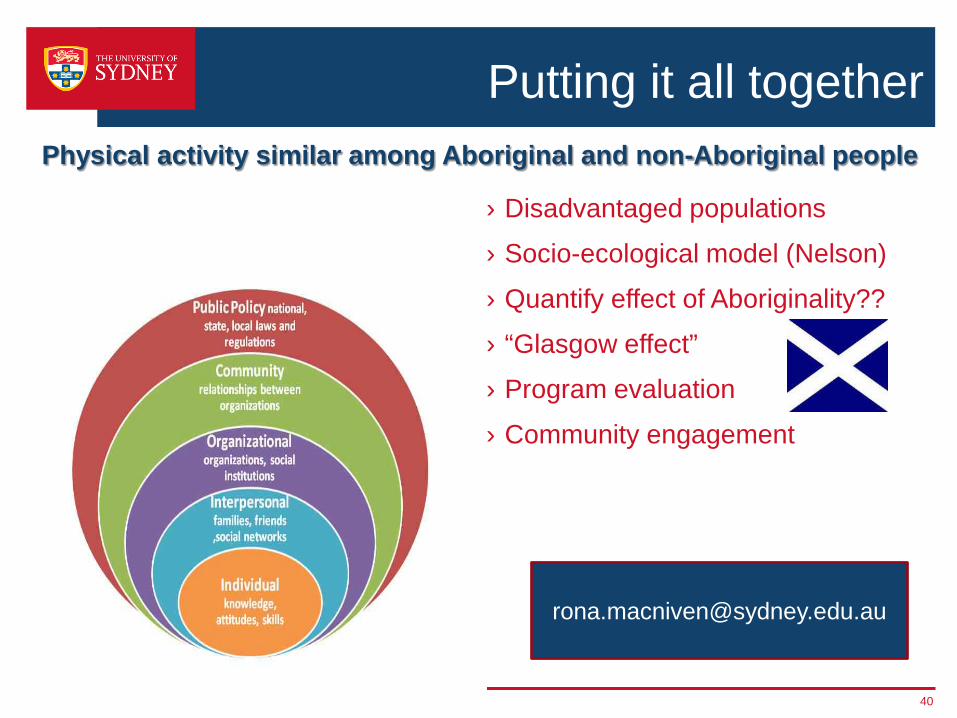
Putting it all together
› Disadvantaged populations
› Socio-ecological model (Nelson)
› Quantify effect of Aboriginality??
› “Glasgow effect”
› Program evaluation
› Community engagement
40
Physical activity similar among Aboriginal and non-Aboriginal people
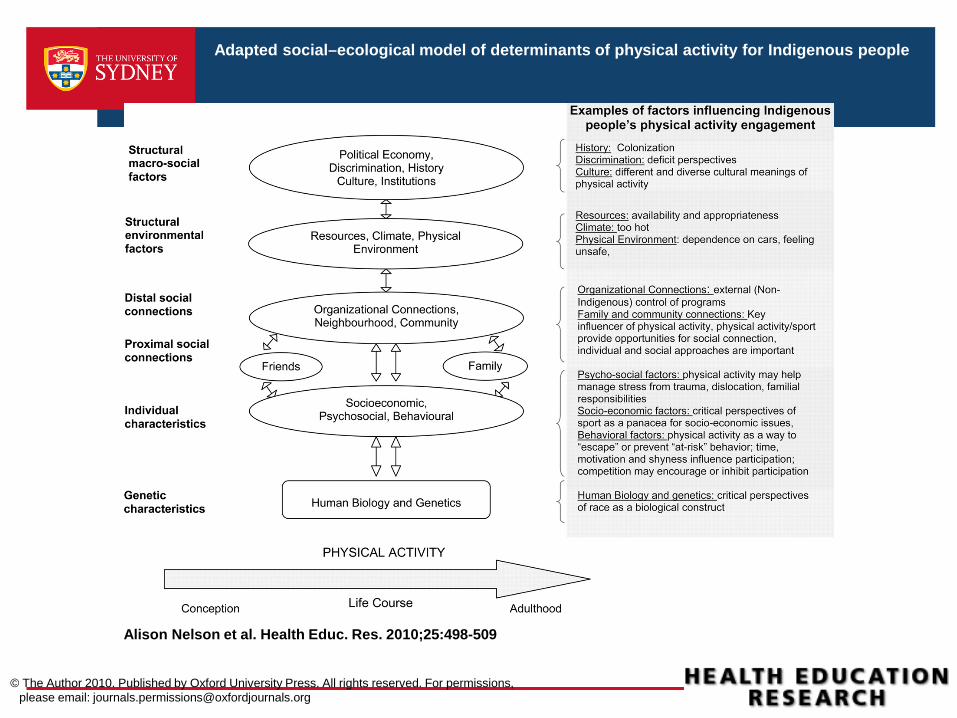
Adapted social–ecological model of determinants of physical activity for Indigenous people
Alison Nelson et al. Health Educ. Res. 2010;25:498-509
© The Author 2010. Published by Oxford University Press. All rights reserved. For permissions, please email: [email protected]