Embed Size (px)
Citation preview
This is a repository copy of Promoting water intake. The persuasiveness of a messaging intervention based on anticipated negative affective reactions and self-monitoring.
White Rose Research Online URL for this paper:http://eprints.whiterose.ac.uk/137172/
Version: Accepted Version
Article:
Carfora, V, Caso, D, Palumbo, F et al. (1 more author) (2018) Promoting water intake. The persuasiveness of a messaging intervention based on anticipated negative affective reactions and self-monitoring. Appetite, 130. pp. 236-246. ISSN 0195-6663
https://doi.org/10.1016/j.appet.2018.08.017
© 2018 Elsevier Ltd. This manuscript version is made available under the CC-BY-NC-ND 4.0 license http://creativecommons.org/licenses/by-nc-nd/4.0/.
[email protected]://eprints.whiterose.ac.uk/
Reuse
This article is distributed under the terms of the Creative Commons Attribution-NonCommercial-NoDerivs (CC BY-NC-ND) licence. This licence only allows you to download this work and share it with others as long as you credit the authors, but you can’t change the article in any way or use it commercially. More information and the full terms of the licence here: https://creativecommons.org/licenses/
Takedown
If you consider content in White Rose Research Online to be in breach of UK law, please notify us by emailing [email protected] including the URL of the record and the reason for the withdrawal request.
Promoting water intake. The persuasiveness of a messaging intervention based on anticipated
negative affective reactions and self-monitoring
Carfora, V., Caso, D., Palumbo, F., & Conner, M.
Appetite, 130, 236-246.
Abstract
Excessive sugar-sweetened beverages intake is a well publicised public health concern.
Several studies have reported a significant correlation between sugar-sweetened beverage
consumption and health issues such as obesity, diabetes, cardiovascular disease and poor oral health
(e.g., Vartanian, Schwartz, & Brownell, 2007). Previous studies have examined both correlates of
sugar-sweetened beverage consumption and interventions to reduce such consumption (e.g., Zoellner
et al. 2017). However, rather than simply eliminate this behaviour it may be more effective to replace
it with a healthier behaviour such as water intake (WI) (Cooper, Heron, & Heward, 2007). Therefore
the present research looks at ways to promote WI. In this regards, health institutions and experts
recommend to consume at least 8 glasses of water a day, that is at least 1.9 litres of water a day
(McCartney, 2011). Only one study has looked at the possibility to promote WI as a mean to reduce
sugar-sweetened beverage consumption (Tate et al., 2012), a gap the present research was designed
to fill.
1.1 Theory of planned behaviour for predicting drinking behaviour
Since behavioural interventions guided by theory are found to be more effective in changing
behaviours (Painter et al., 2008), we based our research on the theory of planned behaviour (TPB;
Ajzen 1991). The TPB helps to identify key determinants of healthy eating (e.g., Carfora, Caso &
Conner, 2016a) and drinking behaviour (e.g., McDermott et al., 2015) that can form the basis of
effective interventions.
TPB holds that intentions are the most proximal predictors of executing a behaviour, and that
in turn intentions are explained by three constructs: attitudes towards the behaviour, subjective norms
(which are related to the perceived social pressure in relation to perform a specific behaviour) and
perceived behavioural control (PBC) over the behaviour. We were only able to locate one TPB study
focused on drinking non-sugared mineral water (Astrom & Rise, 1996). Their findings showed that
intention to drink non-sugared mineral water (R2 = .48 among girls and .37 among boys) was best
explained by PBC, followed by attitude; while, subjective norm was a significant predictor of
intention only in boys. Behaviour (R2 = .25 in all sample) was significantly explained by intention
and PBC. Relatedly, Zoellner et al. (2012) showed that intentions had the strongest influence on
sugar-sweetened beverages intake in adults - independently explaining 51% of variance in behaviour
– and was in turn explained by attitude, subjective norm, and PBC. Similar findings were reported by
Kassem and Lee (2004) in a youth sample.
The present research expanded on previous work by examining the impact of past behaviour
and anticipated negative affective reactions (ANAR) and test an intervention to change WI in young
adults. Numerous studies now show that past behaviour adds to predictions of intention and
behaviour in the TPB (e.g., see McEachan et al., 2011 for a meta-analysis). Controlling for past
behaviour in analyses allows for examination of the predictors of behaviour change. ANAR have
been shown to be additional predictors of intentions to engage in healthy behaviours and to add to the
TPB more generally (Conner et al., 2016; Conner, Godin, Sheeran, & Germain, 2013). Anticipated
negative affective reactions refer to the anticipated negative feelings (e.g., guilty, angry, fear,
regret…) perceived when a person thinks that in the future he/she would not engage in a given
behaviour. Perugini and Bagozzi (2001) showed how anticipated emotions, which refer to the
perceived consequences of a goal achievement and a goal failure, increase the predictive validity of
the TPB model. Some scholars have applied the above consideration on the role of ANAR in the
domain of healthy choice. Sheeran and Armitage (2009) report a meta-analysis of anticipated affect
in the context of the TPB and concluded that anticipated affect directly impacts on intentions
controlling for TPB variables and moral norms. Particularly, most of the studies on the role of ANAR
in predicting intentions and behaviour focus on the role of anticipated regret. For example, Caso,
Carfora, and Conner (2016) show the important role of anticipated regret, controlling for past
behaviour, in determining intention to eat an adequate amount of fruit and vegetable. Rivis, Brewer,
DeFrank and Gilkey (2016) report the most comprehensive meta-analysis of anticipated regret and
show it is strongly associated both with intentions and healthy behaviours, as well as Sandberg and
Conner (2008) report a meta-analysis of the predictive role of anticipated regret in predicting
intentions and behaviour in the TPB. Since ANAR were shown to be important factors in determining
individuals’ intentions and behaviours, recent studies are focused on the ANAR manipulation to
change healthy behaviours. (e.g., Carfora, Caso & Conner, 2017b).
The present research (Study 1) tested the predictive power of the TPB plus past behaviour and
ANAR on intention and future behaviour in relation to the WI using a longitudinal design. Study 1
followed other research (e.g., Abraham & Sheeran, 2004) in examining the extent to which ANAR
moderated the impact of intentions on behaviour.
1.2. Intervention for increasing water intake
The present research (Study 2) also aimed to use the TPB as a basis for promoting WI. Previous
research had tried to directly reduce sugar-sweetened beverages intake (e.g., Zoellner et al., 2012).
A review by Daniels and Popkin (2010) suggests that consuming water in place of sugar-sweetened
beverages, fruit juice, and milk has health benefits associated with reduced energy intake. In this
regards, Tate et al. (2012) conduct a RCT study, which promoted non-caloric beverage substitution
as the primary weight-loss strategy in overweight adults. Their study shows that the replacement of
caloric beverages with non-caloric beverages as a weight-loss strategy results in average weight
losses of 2% to 2.5%. However, in the literature there is a need for more evidence regarding the
effectiveness of interventions aimed at promoting an adequate WI. Therefore, the present research
aimed to promote WI as a means to reduce energy intake. Study 2 extends Study 1 by assessing the
impact of targeting ANAR as a means to increase WI in an intervention study. We also took the
opportunity in Study 2 to explore the extent to which any intervention effects were mediated via
TPB components and ANAR. Given the intervention targeted ANAR we particularly expected
mediated effects via this variable although we were open to whether this might be a direct effects or
one further mediated by intentions (i.e., serial mediation via ANAR and then intentions onto
behaviour). Study 2 also used a manipulation of self-monitoring to promote WI.
According with past studies (e.g., Bagozzi, 1992; Naughton, McCarthy & McCarthy, 2015;
Scholz et al., 2009), a new behaviour can be adopted when individuals’ scrutinise their actions to
verify if they are concretely engaged in the pursuit of a goal. This evaluation process supports people
to plan future effort and commitment to achieve the goal (Bagozzi, 1992). In a review of self-
monitoring, Harkin et al. (2016) report that prompting recording of behaviour as a means to increase
self-monitoring is an effective behaviour change technique. In the healthy choice domain, some
studies use self-monitoring to promote healthy eating behaviours (e.g., Caso & Carfora, 2017). For
example, Scholz et al. (2009) show that change in behaviour is significantly associated with self-
regulation activities including dietary planning and self-monitoring. In the domain of the messaging
intervention to promote healthy practices, a study on the use of text messaging for monitoring sugar-
sweetened beverages, physical activity, and screen time in children (Shapiro et al., 2007) show
efficacy in reducing attrition and increasing acceptability and adherence to the treatment in children.
Moreover, a recent study demonstrates the power of supporting a reduction of red meat intake through
daily reminders combined with daily written self-monitoring (Carfora, Caso, & Conner, 2017a;
2017b). Finally, in literature on the healthy practices, the first attempt to combine self-monitoring and
the elicitation of ANAR by a messaging intervention (Carfora, Caso, & Conner, 2017b) have reported
promising results.
2. The Present Research
In summary, the present research reports two studies. Study 1 was a longitudinal study that
tested whether the TPB plus ANAR predicted intentions to drink at least 2 litres of water a day and
prospective behaviour (Time 2 – T2), controlling for past behaviour (Time 1 – T1). Moreover, we
tested if ANAR moderated the relationship between intention and future behaviour (T2). Study 2 used
a RCT design to test the effects of self-monitoring and daily text messages (eliciting ANAR)
compared to control condition on WI in young adults.
In the Study 1, our main hypotheses were that ANAR was both an important predictor of
intention and moderated the relationship between intention and future behaviour. Confirming these
hypotheses was useful to the design of the intervention study proposed in the Study 2. Consistent with
past studies (e.g., Carfora et al., 2017b), which showed that both self-monitoring and ANAR were
effective in promoting behavioural changes, here we expected that the SM-ANAR group, which self-
monitored WI and received SMS that daily elicited ANAR, would be more effective in producing
significant changes in WI over time.
3. Study 1: Predictors of water intake
3.1. Material and Method
3.1.1. Participants and procedures
In November 2016, a total of 350 emails were sent to a convenience sample of Italian
university students recruited from a list of available students that had agreed to participate in
university research to receive a training credit. In the email it was explained that the research
addressed healthy eating and that participation comprised of fill out two questionnaires one month
from each other. Since the present research focused on young adults, inclusion criteria were being
aged between 18 and 25 years old. At T1 those who agreed to be involved in the research (N = 311;
age mean = 20.41, SD = 1.51; Females = 188, Men = 123) filled out an online TPB questionnaire
plus measures of ANAR and past behaviour over the last month. One month later (T2) participants
were asked to re-fill out the same questionnaire. A total of 272 students (87.46% of the initial sample)
fully completed the second questionnaire (mean age = 20.41; SD = 1.54; Females = 177; Males =
95). Those who fully completed both questionnaires (T1 and T2) at time points were entered in the
following statistical analyses. The analyses focused on predicting intentions at T1 from other
variables at the same time point and behaviour at T2 from variables measured at T1.
3.1.2. Measures
All TPB variables were assessed on a 7-point Likert scale and each response was scored from 1 to 7
(adapted from Caso & Carfora, 2017; Carfora, Caso & Conner, 2016b; Caso et al., 2016).
Intentions were measured using three items (e.g. “I intend to drink daily at least two litres of
water …definitely do not – definitely do”). Higher scores indicated greater intentions to follow the
recommend amount of WI per day. Cronbach’s alpha was .92.
Two dimensions of attitudes were measured. Three items were used to assess instrumental
attitude towards daily WI (e.g., “Daily drinking at least two litres of water is … not worthwhile–
worthwhile; worthless-valuable”; harmful–beneficial”). Cronbach’s alpha was .94. Three items were
used to assess affective attitudes towards daily WI (e.g., “Daily drinking at least two litres of water
is … unenjoyable–enjoyable; unpleasant- pleasant; boring–exciting”). Cronbach’s alpha was .83.
Higher scores indicated positive instrumental and affective attitudes to follow the recommend amount
of WI per day.
In order to assess subjective norm, three items were used (e.g., “Most people who are
important to me think that I should drink at least two litres of water per day… extremely likely -
extremely unlikely”). Higher scores indicated greater level of subjective norm about the recommend
amount of water per day. Cronbach’s alpha was .85.
Perceived behavioural control (PBC) was measured by seven items (e.g., “I feel I have
personal control over drinking at least two litres of water per day?... strongly disagree - strongly
agree”). Higher values indicated greater control over drinking recommended amount of WI each day.
Cronbach’s alpha was .89.
ANAR was measured by three items on a 7-point Likert scale (e.g., “If during the day, I drink
less than two litres of water… this would bother me/I would feel worried/I would regret itざぶく
Cronbach’s alpha was .93. Higher scores mean more ANAR about failing to drink 2 litres of water
per day.
Past (T1) and future (T2) self-reported behaviour were assessed with the statement “How
much water do you drink during the day?” followed by: (1) less than 2 glass of water, (2) 3-4
glasses/about half a liter/a small bottle, (3) 5-6 glasses, (4) 7-8 glasses/about 1 litre/a half of a large
bottle, (5) 9-10 glasses, (6) 11-12 glasses/1 litre and a half/ two-thirds of a large bottle, (7) 13-14
glasses, (8) 15-16 glasses/about 2 litres/one large bottle, (9) more than 2 litres. The past behaviour
was recoded in a dichotomous variable, coding “0“ all the responses related to drinking less than 2
litres a day and “1” all the responses related do drinking at least 2 litres a day or more. This allowed
us to assess the impact of the TPB variables on intention and behaviour controlling for past behaviour
or not.
3.2. Data analyses
SPSS was used to run correlation analysis, which was conducted to verify the relationship between
the measured variables. Multiple regression analyses were used to assess the independent predictors
of intentions and future behaviour, controlling for past behaviour or not. Finally, moderation analysis,
using bootstrapping in SPSS (PROCESS macro for SPSS; Hayes, 2013), was conducted in order to
verify if ANAR moderated the effect of intention on future behaviour, when controlling for TPB
variables and past behaviour.
3.3. Results
Table 1 reports the correlation, mean and SD of all measures. In general, all measures showed
reasonable variation and were not unduly skewed. Examining the correlations (Table 1) indicated
that intention at T1 was most strongly related to PBC and affective attitude both at T1, whereas
behaviour at T2 was most strongly related to past behaviour (behaviour at T1), followed by intention
and PBC both at T1.
INSERT TABLE 1 HERE
A hierarchical regression (Table 2) was carried out to predict intention to drink at least 2 litres of
water a day from TPB predictors (affective attitude, instrumental attitudes, subjective norm and PBC)
(Step 1), ANAR (Step 2), and past behaviour (Step 3). Results showed that affective attitude and PBC
predicted participants’ intentions, while instrumental attitude and subjective norm did not (26.8% of
variance explained, F(4, 271) = 25.79, p < .001). Adding ANAR, after controlling for the other
components of TPB, explained significant additional variance in intentions (R2 change = .08, F(5, 271)=
29.87, p < .001). The addition of past behaviour (final equation R2 = .37, F(6, 271)= 27.75, p < .001)
also significantly increased the explained variance in intentions. Total explained variance at step 3
was 38.6%. At this final step (Table 2) the strongest significant (p < .001) predictors of intentions to
drink at least two litres of water a day were PBC (く = .32) and ANAR (く = .28), followed by affective
attitude (く = .20) and past behaviour (く = .17). Subjective norm and instrumental attitude were not
significant predictors of participants’ intentions.
INSERT TABLE 2 HERE
The second hierarchical regression was carried out to predict future behaviour, related to WI from
TPB variables (intention, affective attitude, instrumental attitude, subjective norm and PBC) (Step 1),
ANAR (Step 2), past behaviour (Step 3), and the intention x ANAR interaction (Step 4). Results
showed that intention and PBC predicted participants’ future behaviour, while neither instrumental
and affective attitude nor subjective norm appeared as significant predictors (34% of variance
explained, F(5, 271) = 28.93, p < .001). Adding ANAR, after controlling for the other TPB components,
regression analysis didn’t explain additional variance in future behaviour (R2change = .01, F(6, 271)=
26.77, p < .001), and ANAR was not a significant direct predictor of WI. The addition of past
behaviour did significantly increase the explained variance in behaviour (R2change = .09, F(6, 271)=
33.25 p < .001). At this step the strongest significant (p < .001) predictors of future behaviour were
positive PBC (く = .35) and higher past behaviour (く = .34), followed by intention (く = .28) and
subjective norm (く = .14). Affective and instrumental attitudes and ANAR were not significant
predictors of future behaviour.
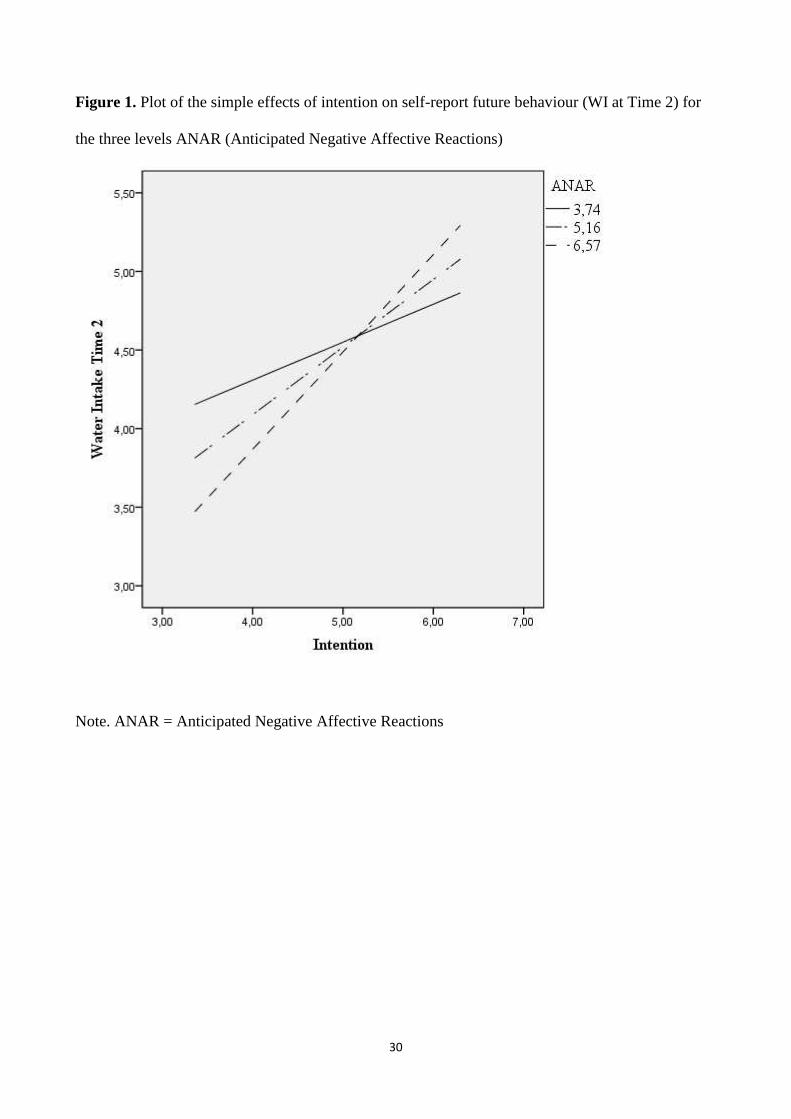
At the final step we added the interaction term between ANAR and intention in order to test the
moderating effects of ANAR on the intention-behaviour relationship. Addition of the interaction
explained significant additional variance in future behaviour (R2change = .03, F(7, 271)= 24.29, p <
.001) and the interaction term was significant (Table 2). The interaction was probed by testing the
conditional effects of intention at three levels of ANAR (one standard deviation below the mean, at
the mean, and one standard deviation above the mean (Figure 1). Intention was significantly related
to WI at all levels of ANAR (M-1SD = .24, p < .05; M = .43; p < .001; M+1SD = .62; p < .001) but
was a stronger at higher levels of ANAR.
Figure 1. Plot of the simple effects of intention on self-report future behaviour (WI at T2) for the
three levels ANAR
INSERT FIGURE 1 HERE
Note. ANAR = Anticipated Negative Affective Reactions
3.4. Discussion
Study 1 applied the TPB model to explain intentions to drink at least 2 litres of water a day
and related future behaviour, and the impact of ANAR plus past behaviour. In regressions, the major
predictors of intentions were PBC and ANAR, followed by affective attitude and past behaviour.
Subjective norm and instrumental attitude were also shown to have no effect on intentions when
controlling for other predictors (Table 2). Considering the regression results related to the prediction
of future behaviour, findings showed that it was directly predicted by intentions, past behaviour and
PBC. The model explained 46% of the variance in future behaviour. Interestingly, our main
hypotheses that ANAR was both an important predictor of intention and moderated the relationship
between intention and future behaviour were confirmed. Particularly, those who strongly perceived
ANAR about not drinking a regular amount of water tended to be more likely to translate their
behavioural intention into actual behaviour after 1 month.
4. Study 2: Intervening to promote WI
Study 2 was a RCT over three time points (Time 1 – T1: pre test, Time 2 – T2 : post test; Time
3 – T3: 1 month-later follow up) that tested three interventions: daily text messages eliciting ANAR
(ANAR group), self-monitoring (SM group), and combination of both strategies (SM-ANAR group)
compared to control condition (no messages) in relation to increasing WI in young adults. Moreover,
the study verified if the effects of the combined conditions (SM-ANAR group) were serially mediated
by changes in ANAR and intentions. Thus, the intervention used written prompts to self-monitor
behaviour and elicit ANAR (respective codes: 2.3 and 5.5; Michie et al., 2013) as behaviour change
techniques.
4.1 Method
4.1.1. Sample
Study 2 was conducted in January 2016, when a total of 281 emails were sent to a convenience sample
of Italian university students recruited from a list of students that declared themselves to be available
to participate in university research to receive a training credit. All members of this list were
contacted, excluding those who participated in the previous study. To participate, students were
required to be between 18 and 25 years of age, in possession of a personal smartphone with an Internet
connection and to have not participated to the previous correlational study. Before the intervention,
those young who accepted to participate (N = 260; age = 20.33, SD = 1.40; F = 159; M = 101) were
randomly assigned to one of the three experimental (SM group, ANAR group, SM-ANAR group) or
control (N = 65 in each condition) conditions. At T1, all participants involved in the study were asked
by email to fill out an online questionnaire. Over the next two weeks the intervention was
implemented. At T2 (immediately after the intervention) all participant were asked to fill out the
second questionnaire and a total of 219 (92.53% of original eligible sample) did so. One month later
(T3: follow-up), a total of 197 young (75.77% of original eligible sample) completed the follow-up
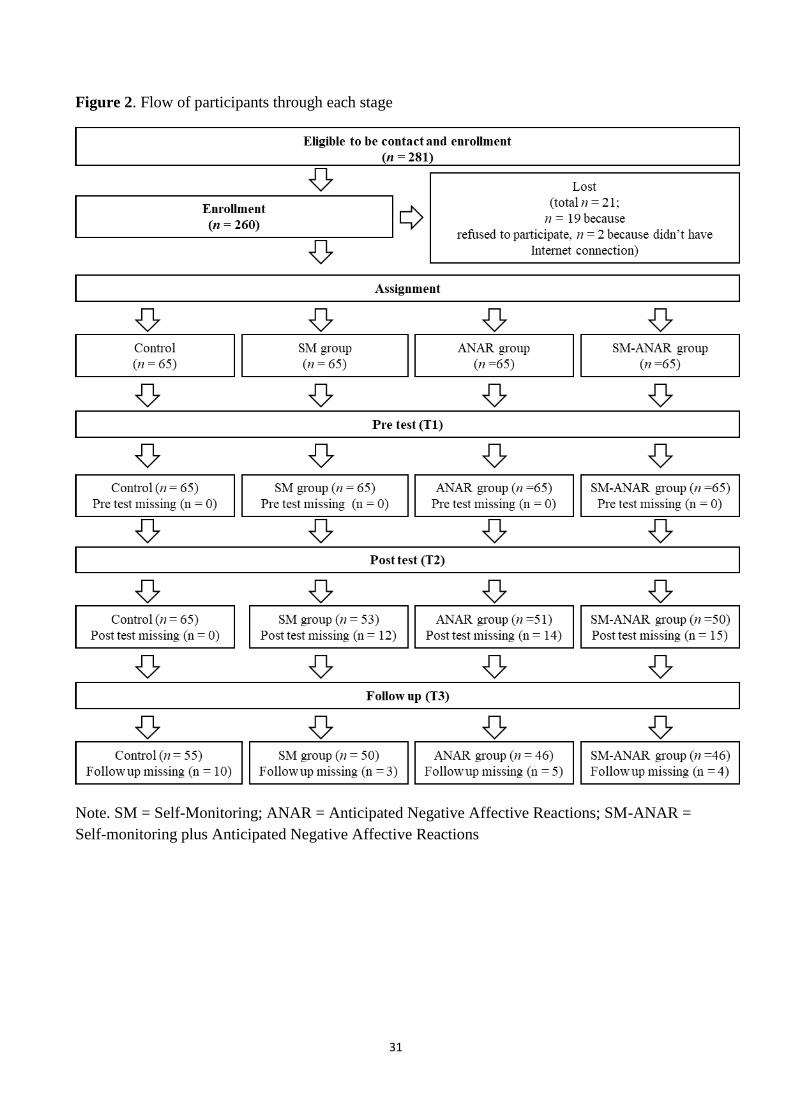
online questionnaire. Figure 2 shows the flow of participants through each stage of this intervention.
4.1.2. Procedure
The present study was implemented following receipt of ethical approval by the University of
Naples Federico II. Participants were contacted by experimenters using emails, which explained that
the study was aimed at investigating young adult’s healthy eating. Those participants who agreed to
be involved in this research provided their written consent and created a personal code to allow
matching of the three questionnaires; moreover, they provided their demographic information and
smart phone number. To reduce social desirability and acquiescence, participants were also reassured
that they would receive the credit independently of the content of their responses. To reduce the risk
of cross-contamination, students were explicitly requested not to discuss the content of messages with
other participants during the intervention.
After agreeing to participate participants were allocated to the four conditions in a 1:1:1:1
ratio, using a randomization sequence created using Excel 2007 (Microsoft). Figure 2 shows the flow
of participants through the study. Then, participants were requested by email to complete the first
online questionnaire. At T2 (after the two week intervention) and T3 (follow up one month after the
intervention) participants were requested by email to complete the second and third questionnaires.
All three questionnaires were identical.
4.1.3. Intervention
The intervention in Study 2 was implemented via text messages and thus represents an
mHealth intervention. mHealth is described as the use of mobile and wireless devices to improve
health outcomes and health research (National Institutes of Health Consensus Group, 2016). Mostly
smart-phones have been used both to deliver daily messages and to engage individuals in self-
monitoring in order to promote healthy behaviours. For example, Suffoletto et al. (2015) found that
a message intervention can reduce alcohol consumption in young adults. Although the efficacy of
mHealth for increasing WI among young has not been previously tested.
The present RCT was composed by four conditions: SM group, ANAR group, SM-ANAR
group and control. In the SM group (Self-Monitoring group) participants were asked to download an
APP to monitor their daily water consumption for two weeks. The APP allows them to easily insert
the amount of water consumed, for example selecting the quantity in litre or in images depicting
portions (e.g., small bottle, one cup, one medium glass). Participants in this condition received SMS
reminder of monitoring their consumption (“Remember to monitor your daily consumption by
reporting on the APP how many glasses or bottles of water you drank today”).
In the ANAR group (Anticipated Negative Affective Reactions group), participants daily
received text messages that focused on ANAR (e.g. “If you do not drink at least a litre and a half of
water a day, you may regret not thinking about your physical health”).
In the SM-ANAR group (Self-monitoring combined with Anticipated Negative Affective
Reactions group) participants daily received text messages that focused on ANAR plus self-
monitoring and they were also required to download and use an App to monitor their WI (e.g. “If you
do not drink at least a litre and a half of water a day, you may regret not thinking about your physical
health. Remember to monitor your daily consumption by reporting on the APP how many glasses or
bottles of water you drank today”).
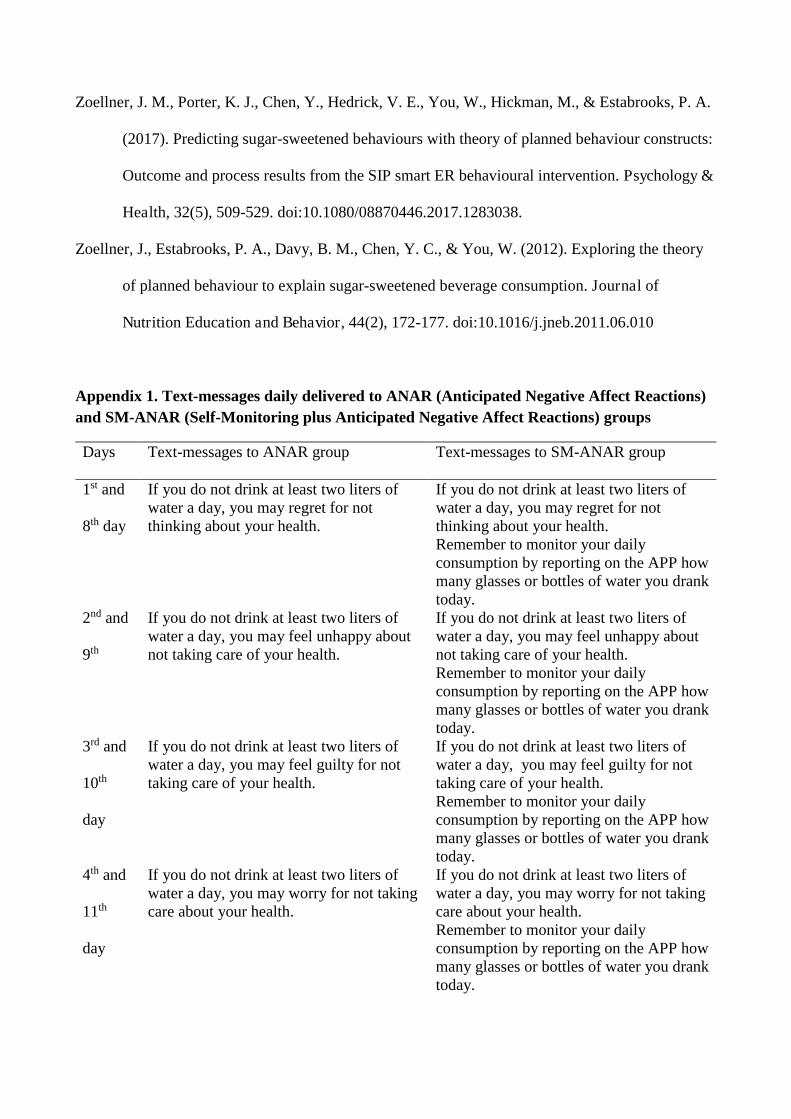
See Appendix A for list of all sent messages
The control group did not receive any messages or access to App.
For those in the conditions that received daily messages (SM, ANAR, and SM-ANAR groups),
messages were delivered each early morning (7:30 AM) for 14 days using Whatsapp, a cross-platform
mobile messaging application. Message content was framed based on previous literature and in
accordance with the guidelines (e.g., Hingle et al., 2013) about the content of the message
interventions (i.e., such as simple and clear messages). Researchers prepared 7 messages and each
message was repeated on two different days across two weeks. See Appendix A for full list of
messages.
After completing the T3 questionnaire participants received feedback on the findings of the
study, in which the benefits of adequate WI were explained; this procedure was adopted in order to
provide all groups with useful information on the benefits of WI.
INSERT FIGURE 2 HERE
4.1.3. Measures
At three time points participants received by email a link to an online questionnaire, which included
measures of TPB traditional and additional variables in relation to the WI, gender and age measures.
Emails with the link to the first questionnaire were sent two days before the beginning of the
intervention, requiring questionnaire completion no later than the first day of the intervention. Emails
with the link to the second questionnaire were sent the day after the end of the intervention, requiring
questionnaire completion within two days.
Study 2 used the same measures as Study 1 in each condition. All variables showed good
internal reliability: intentions (T1 g = .88; T2 g = .91, T3 g = .92), instrumental attitude (T1 g = .92;
T2 g = .91; T3 g = .87), affective attitude (T1 g = .74; T2 g = .78; T3 g = .81), subjective norm (T1
g = .89; T2 g = .85; T3 g = .89), PBC (T1 g = .83; T2 g = .89; T3 g = .89), ANAR (T1 g = .93; T2 g
= .94; T3 g = .94).
4.2. Data analysis
Analyses were conducted in SPSS 23. In preliminary analyses, we firstly checked if
randomization was adequate and the sample was biased by drop out using Chi-square and MANOVA.
The main analyses used ANOVA to compare the four conditions on behaviour at T2 and T3.
MANOVA was also used to compare condition differences in ANAR, intentions, instrumental and
affective attitudes, subjective norms and PBC. Finally, multiple mediation analyses, using
bootstrapping in SPSS (PROCESS macro for SPSS; Hayes, 2013), were conducted to test if any
differences between conditions in the future behaviour were mediated by changes in cognitions (with
a focus on ANAR and intentions). This latter analysis controlled for past behaviour.
4.3. Results
4.3.1. Preliminary analysis
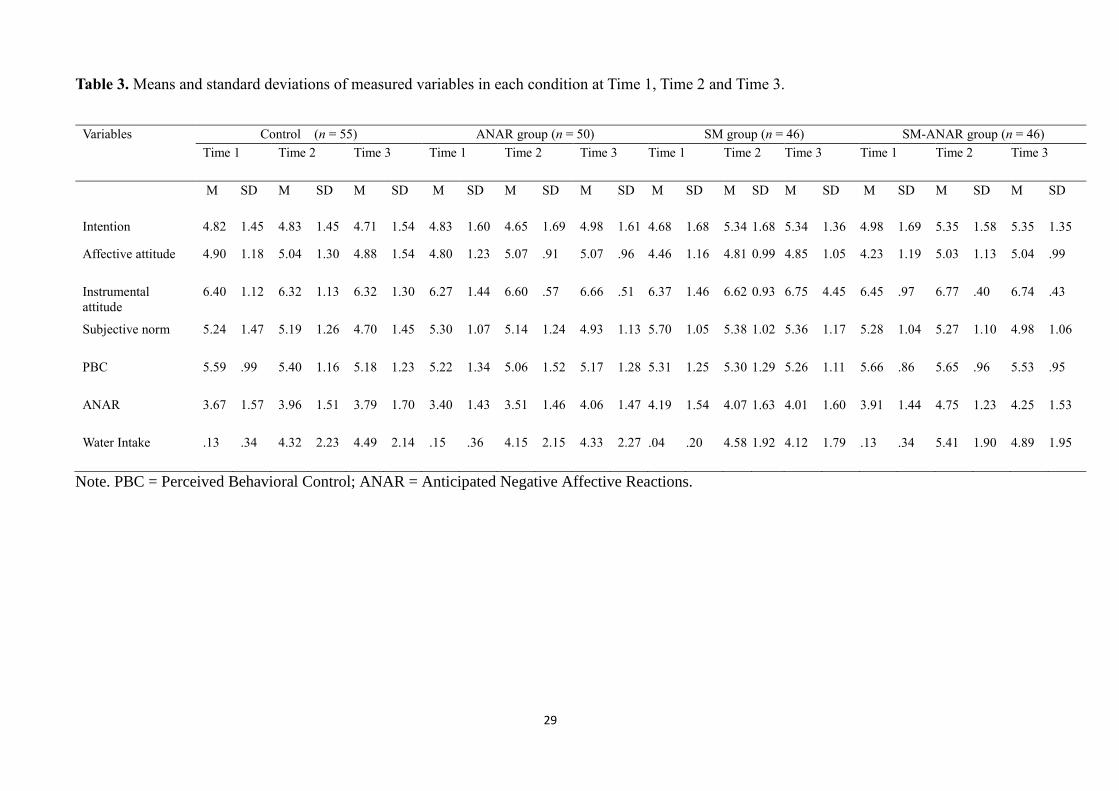
Multivariate analysis (MANOVA) did not find any significant differences among the four
groups (ps > .08) in T1 variables (intention, affective and instrumental attitudes, subjective norm,
descriptive norm, PBC, ANAR, past behaviour and age; Table 3). Chi-square did not show any
significant differences in gender (p > .19) across groups. Thus, preliminary findings confirmed that
randomisation was adequate and the four groups were matched on baseline variables and the
appropriateness of analysing differences at post-intervention (T2 and T3) on these variables without
the need to control for baseline differences.
Comparing TPB scores, age and gender between young adults who responded to all
questionnaires (T1, T2 and T3) and those who dropped out between the three time points, findings
indicated that there were significant differences between retained participants and those who dropped-
out only on instrumental attitude (F(1,128) = 4.96; p < .05, さp2 = .02). Those who completed all
measurements reported higher values in instrumental attitude (M = 6.37; SD = 1.24) compared to
those who didn’t complete all questionnaires (M = 5.71; SD = 1.80). This would suggest that our final
sample is biased towards those with more positive instrumental attitude towards daily consuming an
adequate amount of WI. Despite this difference, our main dependent variables (intentions, ANAR and
WI) were not significantly different between those who complete all three questionnaires and those
who dropped-out. Thus, the final sample is acceptably representative of the initial sample, except in
relation to instrumental attitude.
INSERT TABLE 3 HERE
4.3.2. Post-intervention (T2-T3) analyses
Since there were no significant differences between groups at T1, we used MANOVA of
condition x time (T2 vs T3) to verify the effects of the interventions across the different dependent
variables. This revealed multivariate effects for time (F(7,186) = 3.24; p < .001, さp2 = .11), condition
(F(21,564) = 2.08; p < .001, さp2 = .07) and the condition x time interaction (F(21,564) = 1.65; p < .05,
さp2 = .06). Exploration of the univariate effects indicated there were only significant main and/or
interaction effects on ANAR, intentions and behaviour that were further explored.
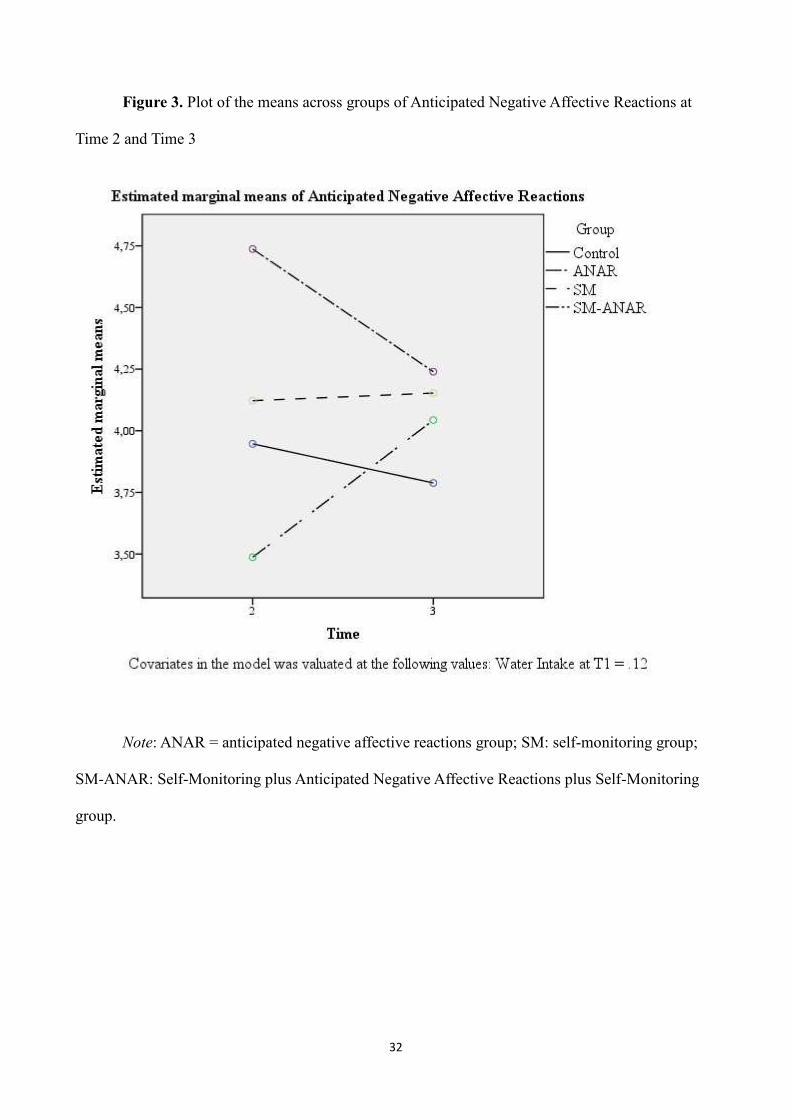
In relation to ANAR, there was no significant effect for time (F(1,193) = .04; p = .85; さp2 = .00)
or condition (F(3,193) = 2.50; p = .06; さp2 = .04), but there was a significant effect for condition x time
(F(3,193) = 5.34; p < .05; さp2 = .08). To examine this further we used post hoc comparisons (Bonferroni
tests) to assess differences between conditions separately at T2 and T3 and also for differences
between time points within each condition. This revealed that at T2, ANAR was significantly higher
in SM-ANAR group (M = 4.75, SD = 1.23) compared to control (M = 3.96, SD = 1.51) and to ANAR
group (M = 3.54; SD = 1.46), but no other differences between any other pair of conditions (ps > .39).
While at T3, there were no significant differences between any pair of conditions (ps > .51). There
were also significant increases in ANAR between Time 2 and 3 for the ANAR group (T2: M = 3.51,
SD = .46; T3: M = 4.06, SD = .47) and a significant decrease in ANAR for the SM-ANAR group (T2:
M = 4.75, SD = .18; T3: M = 4.25, SD = .22). These findings are shown in Figure 3 and would appear
to indicate that ANAR was higher in the SM-ANAR group compared to other groups at T2. However,
by T3 all groups had similar levels of ANAR.
INSERT FIGURE 3 HERE
In relation to intentions, there were significant effects for time (F(1,193) = 5.73; p < .05; さp2 =
.03) and condition (F(3,193) = 4.08; p < .05; さp2 = .06), but not for the condition x time interaction
(F(3,193) = 1.34; p = .26; さp2 = .02). Comparison of means (Bonferroni tests) indicated that intentions
were significantly higher at T3 (M = 5.08, SD = 1.48) compared to T2 (M = 5.04, SD = 1.61).
Comparison of the means for condition indicated that intentions were higher both in SM group (M =
5.43; SD = .18) and SM-ANAR group (M = 5.33; SD = .17) compared to control (M = 5.75; SD =
.19) when averaged across time points.
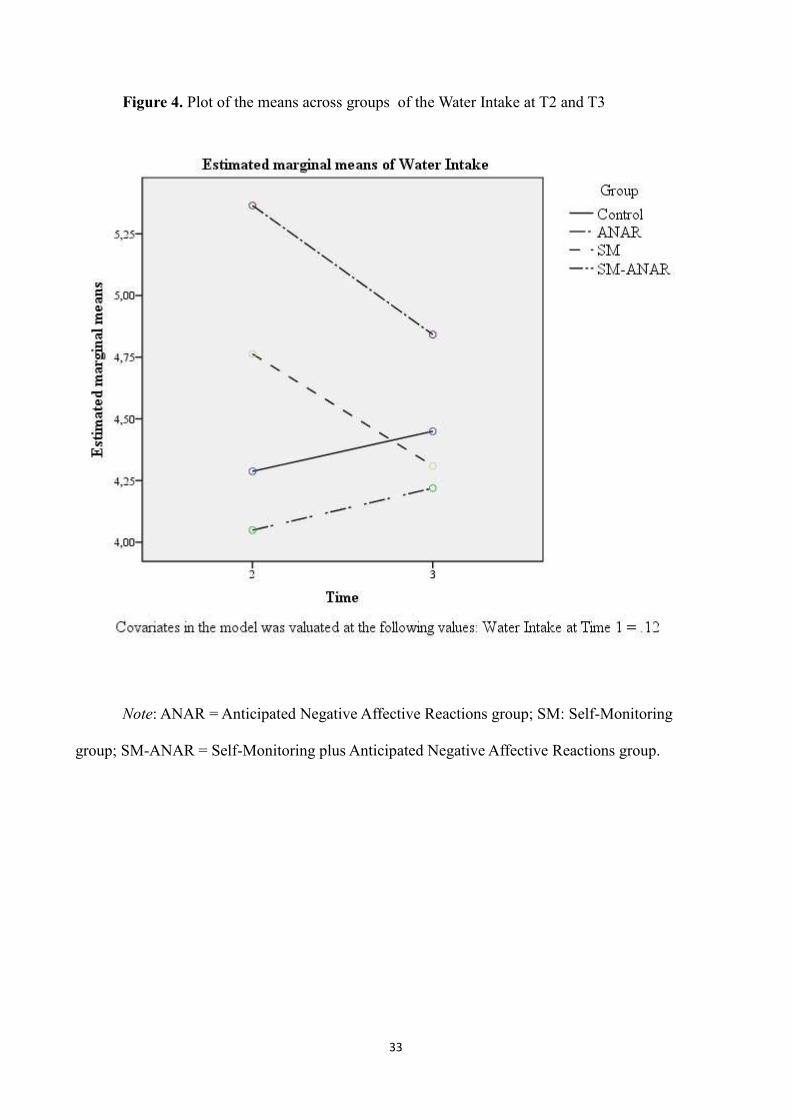
Finally, in relation to behaviour, there were no significant effects for time (F(1,193) = 1.99; p =
.16; さp2 = .01) or condition (F(3,193) = 2.25; p = .08; さp2 = .03), although there was a significant effect
for condition x time (F(3,193) = 2.73; p < .05; さp2 = .04). To examine this further we used post hoc
comparisons (Bonferroni tests) to assess differences between conditions at T2 and T3 and for
differences between time points within each condition. This revealed that at T2, behaviour was
significantly higher in SM-ANAR group (M = 5.41, SD = 1.90) compared to control (M = 4.33, SD
= 2.23) and no other pairs of conditions approached statistical significance (ps > .42). While by T3
there were no significant differences between groups (ps > .31). There were significant increases in
behaviour between T2 and 3 for the ANAR group (T2: M = 4.15; SD = 2.14; T3: M = 4.32; SD =
2.27) but significant decreases in behaviour for the SM group (T2: M = 4.58; SD = 1.2; T3: M = 4.12;
SD = 1.79) and the SM-ANAR group (T2: M = 5.41; SD = 1.90; T3: M = 4.89; SD = 1.95). As shown
in Figure 4 although the SM-ANAR group compared to control had higher WI at T2 this difference
was not maintained at T3 when all four groups showed similar levels of WI.
Figure 4. Plot of the means across groups of the Water Intake at Time 2 and Time 3
INSERT FIGURE 4 HERE
Note: ANAR = Anticipate Negative Affective Reactions group; SM: Self-Monitoring group;
SM-ANAR: Self-Monitoring group plus Anticipate Negative Affective Reactions regret ; T1 = Time
1.
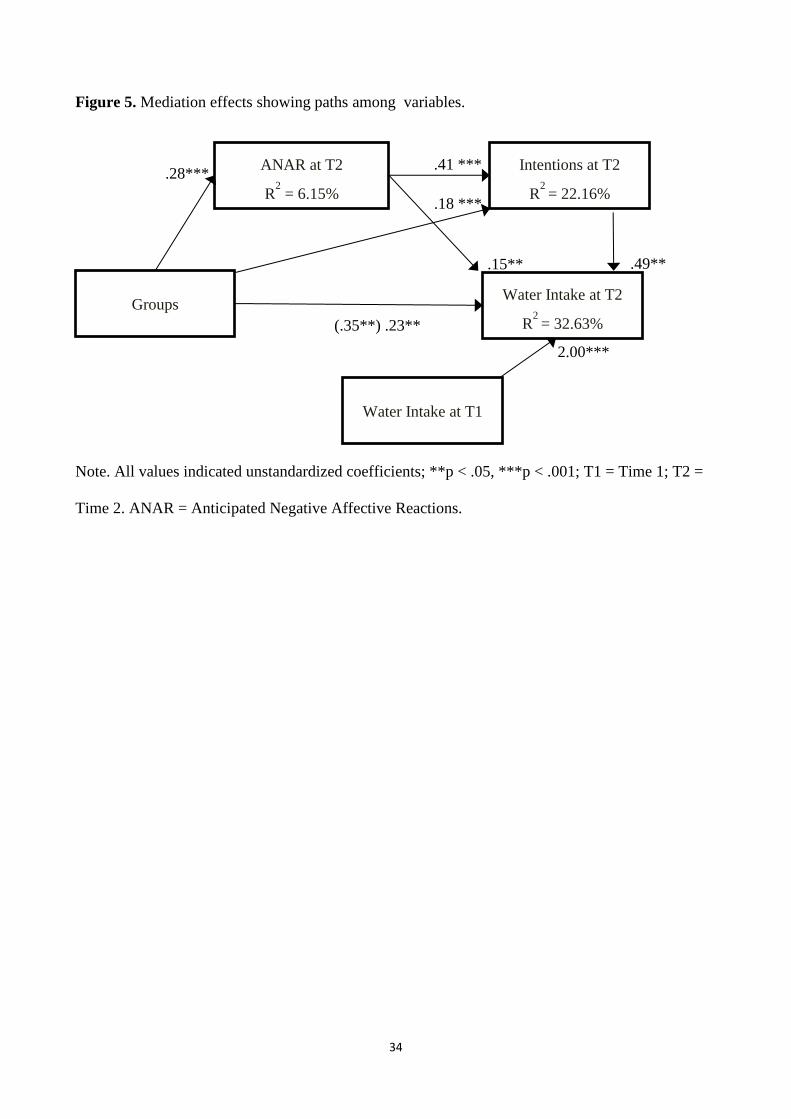
4.3.4. Mediation analyses
Sequential mediation analyses (Figure 5) were run to test whether the effect of SM-ANAR
group versus control on WI at T2 was sequentially mediated via each TPB variables and then intention
(both at T2), controlling for dichotomized past behaviour (WI at T1). The only significant result was
for the mediated path of ANAR and intention. The indirect effects were considered significant if
bootstrapped 95% confidence intervals (CI) did not include zero. The considered mediated paths
were: simple mediation paths from condition to WI at T2 via ANAR or intention and the sequential
mediation chain from condition to WI at T2 via ANAR and then intention. Results show that the only
one of the three mediated pathways was significant and the total indirect effect was significant (.15;
95% CI, .05; .27). The path between conditions and WI at T2, controlling for past WI (WI at T1),
remained significant (.23; 95% CI, .01; .46) indicating a partial mediation. Examination of the
mediated paths indicated that the only significant mediated effect was for the sequential mediation
chain from groups to WI at T2 via ANAR and then intention (.06; 95% CI, .02; .11). The simple
mediation paths from condition to WI at T2 via ANAR (.02; 95% CI, -.02; .17) or via intention (.06;
95% CI, -.02; .22) were not significant.
INSERT FIGURE 5 HERE
4.4. Discussion
Study 2 showed the impact of a brief intervention designed to promote WI in young adults
over a 2-week period. This study showed that immediately after the intervention the only effective
condition in increasing ANAR, intention and WI was the SM-ANAR group. However, the changes
in SM-ANAR group after the intervention were not maintained over the next month (T3). Finally, the
significant effect of the SM-ANAR intervention on WI at T2 was explained through a sequential
mediation analysis, which showed that the increase in the participants’ ANAR towards not drinking
enough water a day increased their WI intentions and consequentially increased WI at T2.
5. General discussion
The present research was aimed at contributing to the current literature in at least two ways:
testing the predictors of WI and testing an intervention to change WI.
Study 1 showed WI intentions to be mainly based on past behaviour, affective attitude,
perceived behavioural control and ANAR. The importance of our two affective variables on WI
intentions is notable and confirms previous work showing the importance of these affective variables
for a range of health behaviours (Conner et al., 2015; Conner et al., 2017). They also show the
importance of intentions, perceived behavioural control plus past behaviour and instrumental attitude
in predicting WI. The direct effect of instrumental attitudes on WI was unexpected. Interestingly,
ANAR moderated the impact of intentions on WI. This supports a number of other previous studies
(e.g., Abraham & Sheeran, 2004) suggesting that higher levels of ANAR binds individuals to their
intentions making them more likely to enact them.
Study 2 showed that daily messages, which elicited ANAR, when combined with prompted
self-monitoring were effective in increasing WI (at least compared to those who didn’t receive any
message). Mediation analyses indicated that this was attributable to the intervention increasing
ANAR and intentions. The results from Study 1 would suggest that higher levels of ANAR and
intentions are associated with stronger impact of intentions on WI. It is interesting to note that neither
ANAR messages nor a self-monitoring intervention alone were sufficient to produce changes in
behaviour even immediately after the intervention ceased. It was disappointing that none of the
intervention effects persisted one month after the intervention ceased. Future research could usefully
explore factors that might lead to the maintenance of behaviour change following the sort of
interventions used here. Particularly as it seems infeasible to indefinitely send text messages to
participants.
5.1. Limitations and methodological issues
There are several potential limitations for this research. In both Study 1 and 2 our findings
may not generalize to other samples, since data was collected in a single city in the South of Italy.
We used self-report food diaries to assess past and future behaviour in both studies. Objective
measures are to be preferred, although it may be difficult to generate such measures. A further
limitation is in relation to the knock-on effects of additional WI. The health benefits of additional WI
is likely to be mainly attributable to reduced overall calorie consumption and/or a reduction in the
amount of sweetened drinks consumed. Unfortunately neither was assessed here. Future research
could usefully confirm that interventions that successfully increase WI also have significant effects
in reducing overall calories or amount of sweetened drinks consumed.
A further weakness is that in Study 2, we used a passive control group, which received no
intervention and was thus not matched to other conditions on amount of required engagement, contact
time or the receiving of texts. We judged that it was more appropriate to send no texts to this group
rather than texts irrelevant to WI. However, it would be useful for future research to assess whether
this influenced the present results. Finally, given that self-monitoring was encouraged via daily SMS
reminder and the use of a mobile App, we didn’t control whether and how much participants in the
SM and SM-ANAR groups effectively and daily used the APP. Similarly, we didn’t assess whether
participants in ANAR and SM-ANAR groups actually read and engaged with the daily messages.
5.2. Future directions and practical implications
Despite the above methodological limitations, the present study could generate useful
recommendation for health-related intervention in young Italians based on the use of messaging
interventions to increase self-monitoring of healthy behaviour in young adults through the elicitation
of ANAR. Moreover, these findings could be a useful starting point in future messaging interventions,
particularly future studies could test if the proposed strategies may be effective with other age groups,
in different contexts or with other similar behaviours. In fact, health behaviours present various
similarities (McEachan, Lawton, & Conner, 2010) and knowledge about the factors connected to or
how to change a behaviour may generalise to other comparable behaviours. Particularly, future
research could attempt to applied them in multi-behaviour intervention (Conner & Norman, 2017),
simultaneously targeting more than one behaviour for change, and obtaining more likely highest level
of change, concluded that interventions targeting a moderate number of recommendations produced.
Finally, future research targeting WI could analyse the role both of healthy eating self-identity, since
people tend to be more likely to act, maintain and change behaviours which are in line with the beliefs
they have about themselves (Carfora, Caso, Sparks & Conner, 2017).
Conclusion
Our research sheds light on the determinants of WI and how to change it in young adults.
The prominent role of ANAR in relation to both prediction and change is notable.
References
Abraham, C., & Sheeran, P. (2004). Deciding to exercise: The role of anticipated regret. British
journal of health psychology, 9(2), 269-278. doi:10.1348/135910704773891096
Ajzen, I. (1991). The theory of planned behavior. Organizational Behavior and Human Decision
Processes, 50, 2, 179-211.
Astrom A. N., & Rise J. (1996). Analysis of adolescents' beliefs about the outcome of using dental
floss and drinking non-sugared mineral water. Community dentistry and oral epidemiology,
24, 3, 211–216. doi:10.1111/j.1600-0528.1996.tb00844.x
Bagozzi, R. P. (1992). The self-regulation of attitudes, intentions, and behavior. Social psychology
quarterly, 55(2), 178-204.
Brewer, N. T., DeFrank, J. T., & Gilkey, M. B. (2016). Anticipated regret and health behaviour: A
meta-analysis. Health Psychology, 35(11), 1264-1275. doi:10.1037/hea0000294
Carfora, V., Caso, D., & Conner, M. (2016a). The role of self-identity in predicting fruit and
vegetable intake. Appetite, 106, 23-29. doi:10.1016/j.appet.2015.12.020
Carfora, V., Caso, D., & Conner, M. (2016b). Randomized controlled trial of a messaging
intervention to increase fruit and vegetable intake in adolescents: Affective versus
instrumental messages. British Journal of Health Psychology, 21, 937-955.
doi:10.1111/bjhp.12208
Carfora, V., Caso, D., & Conner, M. (2017a). Correlational study and randomised controlled trial
for understanding and changing red meat consumption: The role of eating identities. Social
Science & Medicine, 175, 244-252. doi:10.1016/j.socscimed.2017.01.005
Carfora, V., Caso, D., & Conner, M. (2017b). Randomised controlled trial of a text messaging
intervention for reducing processed meat consumption: The mediating roles of anticipated
regret and intention. Appetite, 117, 152-160. doi:10.1016/j.appet.2017.06.025.
Carfora, V., Caso, D., Sparks, P., & Conner, M. (2017). Moderating effects of pro-environmental
self-identity on pro-environmental intentions and behaviour: A multi-behaviour study.
Journal of Environmental Psychology, 53, 92–99. doi:10.1016/j.jenvp.2017.07.001
Caso, D., & Carfora, V. (2017). Un intervento di messaggistica istantanea per la promozione del
monitoraggio del consumo di frutta e verdura [Messaging intervention for promoting self
monitoring of fruit and vegetable consumption]. Psicologia della Salute,1, 97–111.
doi:10.3280/pds2017-001005
Caso, D., Carfora, V., & Conner, M. (2016). Predicting intentions and consumption of fruit and
vegetables in Italian adolescents. Effects of anticipated regret and self-identity. Effects of
anticipated regret and self-identity, Psicologia Sociale, 3, 319-326. doi:10.1482/84668
Conner, M., & Norman, P. (2017). Health behaviour: Current issues and challenges. Psychology &
Health, 32(8), 895–906. doi:10.1080/08870446.2017.1336240
Conner, M., McEachan, R., Lawton, R., & Gardner, P. (2017). Applying the reasoned action
approach to understanding health protection and health risk behaviors. Social Science &
Medicine, 195, 140-148. doi:10.1016/j.socscimed.2017.10.022
Conner, M., McEachan, R., Taylor, N., O'Hara, J., & Lawton, R. (2015). Role of affective attitudes
and anticipated affective reactions in predicting health behaviors. Health Psychology, 34(6),
642. doi:10.1037/hea0000143
Conner, M., Godin, G., Sheeran, P., & Germain, M. (2013). Some feelings are more important:
Cognitive attitudes, affective attitudes, anticipated affect, and blood donation. Health
Psychology, 32(3), 264. doi:10.1037/a0028500
Cooper, J. O, Heron, T. E, & Heward, W.L. (2007). Applied Behaviour Analysis (2nd ed.). Upper
Saddle River, N. J.: Pearson/Merrill-Prentice Hall.
Daniels, M. C., & Popkin, B. M. (2010). Impact of water intake on energy intake and weight status:
a systematic review. Nutrition Reviews, 68(9), 505–521. doi:10.1111/j.1753-
4887.2010.00311.x
Harkin, B., Webb, T. L., Chang, B. P., Prestwich, A., Conner, M., Kellar, I., Benn, Y., & Sheeran,
P. (2016). Does monitoring goal progress promote goal attainment? A meta-analysis of the
experimental evidence. Psychological bulletin, 142(2), 198-229.doi:10.1037/bul0000025.
Hayes, D., & Ross, C. E. (1987). Concern with appearance, health beliefs and eating habits. Journal
of Health and Social Behavior, 28(2), 120-130. doi:10.2307/2137126
Hingle, M., Nichter, M., Medeiros, M., & Grace, S. (2013). Texting for health: the use of
participatory methods to develop healthy lifestyle messages for teens. Journal of Nutrition
Education and Behavior, 45(1), 12-19. doi:10.1016/j.jneb.2012.05.001.
Kassem, N. O., & Lee, J. W. (2004). Understanding soft drink consumption among male
adolescents using the theory of planned behaviour. Journal of Behavioural Medicine, 27(3),
273-296. doi:10.1023/B:Jobm.0000028499.29501.8f
McCartney, M. (2011). Waterlogged? British Medical Journal, 343:d4280. doi:10.1136/bmj.d4280
McDermott, M. S., Oliver, M., Svenson, A., Simnadis, T., Beck, E. J., Coltman, T., Iverson, D.,
Caputi, P. & Sharma, R. (2015). The theory of planned behaviour and discrete food choices:
A systematic review and meta-analysis. International Journal of Behavioral Nutrition and
Physical Activity, 12:162. doi:10.1186/s12966-015-0324-z
McEachan, R. R. C., Conner, M., Taylor, N. J., & Lawton, R. J. (2011). Prospective prediction of
health-related behaviours with the theory of planned behaviour: A meta-analysis. Health
Psychology Review, 5(2), 97-144. doi: 10.1080/17437199.2010.521684
McEachan, R. R. C., Lawton, R. J., & Conner, M. (2010). Classifying health-related behaviours:
Exploring similarities and differences amongst behaviours. British Journal of Health
Psychology, 15(2), 347–366. doi:10.1348/135910709x466487
Michie, S., Richardson, M., Johnston, M., Abraham, C., Francis, J., Hardeman, W., Eccles, M. P.,
Cane, J., & Wood, C. E. (2013). The behavior change technique taxonomy (v1) of 93
hierarchically clustered techniques: Building an international consensus for the reporting of
behavior change interventions. Annals of Behavioral Medicine, 46, 81-95.
doi:10.1007/s12160-013-9486-6
National Institutes of Health Consensus Group. (2016). Mobile health IT. Retrieved
from http://www.hrsa.gov/healthit/mhealth.html
Naughton, P., McCarthy, M., & McCarthy, S. (2015). Acting to self-regulate unhealthy eating
habits. An investigation into the effects of habit, hedonic hunger and self-regulation on sugar
consumption from confectionery foods. Food quality and preference, 46, 173-183.
doi:0.1016/j.foodqual.2015.08.001
Painter, J. E., Borba, C. P. C., Hynes, M., Mays, D., & Glanz, K. (2008). The use of theory in health
behaviour research from 2000 to 2005: A systematic review. Annals of Behavioural
Medicine, 35, 358–362. doi:10.1007/s12160-008-9042-y
Perugini, M., & Bagozzi, R. P. (2001). The role of desires and anticipated emotions in goal-directed
behaviours: Broadening and deepening the theory of planned behaviour. British Journal of
Social Psychology, 40, 79-98. doi:10.1348/014466601164704
Sandberg, T., & Conner, M. (2008). Anticipated regret as an additional predictor in the theory of
planned behaviour: A meta-analysis. British Journal of Social Psychology, 47, 589-606.
doi:10.1348/ 014466607X258704
Scholz, U., Nagy, G., Göhner, W., Luszczynska, A., & Kliegel, M. (2009). Changes in self-
regulatory cognitions as predictors of changes in smoking and nutrition
behaviour. Psychology and Health, 24(5), 545-561. doi:10.1080/08870440801902519
Shapiro, J. R., Bauer, S., Hamer, R. M., Kordy, H., Ward, D., & Bulik, C. M. (2008). Use of text
messaging for monitoring sugar-sweetened beverages, physical activity, and screen time in
children: A pilot study. Journal of nutrition education and behavior, 40(6), 385-391.
doi:10.1016/j.jneb.2007.09.014
Suffoletto, B., Kristan, J., Chung, T., Jeong, K., Fabio, A., Monti, P., & Clark, D. B. (2015). An
interactive text message intervention to reduce binge drinking in young adults: A
randomized controlled trial with 9-month outcomes. Plos One, 10(11), e0142877.
doi:10.1371/journal.pone.0142877
Tate, D. F., Turner-McGrievy, G., Lyons, E., Stevens, J., Erickson, K., Polzien, K., Diamond, M.,
Wang, X., & Popkin, B. (2012). Replacing caloric beverages with water or diet beverages
for weight loss in adults: Main results of the Choose Healthy Options Consciously Everyday
(CHOICE) randomized clinical trial. American Journal of Clinical Nutrition, 95, 555–563.
doi:10.3945/ajcn.111.026278
Vartanian, L. R., Schwartz, M. B., & Brownell, K. D. (2007). Effects of soft drink consumption on
nutrition and health: A systematic review and meta-analysis. American Journal of Public
Health, 97, 667–675. doi:10.2105/ajph.2005.083782
Zoellner, J. M., Porter, K. J., Chen, Y., Hedrick, V. E., You, W., Hickman, M., & Estabrooks, P. A.
(2017). Predicting sugar-sweetened behaviours with theory of planned behaviour constructs:
Outcome and process results from the SIP smart ER behavioural intervention. Psychology &
Health, 32(5), 509-529. doi:10.1080/08870446.2017.1283038.
Zoellner, J., Estabrooks, P. A., Davy, B. M., Chen, Y. C., & You, W. (2012). Exploring the theory
of planned behaviour to explain sugar-sweetened beverage consumption. Journal of
Nutrition Education and Behavior, 44(2), 172-177. doi:10.1016/j.jneb.2011.06.010
Appendix 1. Text-messages daily delivered to ANAR (Anticipated Negative Affect Reactions) and SM-ANAR (Self-Monitoring plus Anticipated Negative Affect Reactions) groups
Days Text-messages to ANAR group Text-messages to SM-ANAR group
1st and
8th day
If you do not drink at least two liters of water a day, you may regret for not thinking about your health.
If you do not drink at least two liters of water a day, you may regret for not thinking about your health. Remember to monitor your daily consumption by reporting on the APP how many glasses or bottles of water you drank today.
2nd and
9th
If you do not drink at least two liters of water a day, you may feel unhappy about not taking care of your health.
If you do not drink at least two liters of water a day, you may feel unhappy about not taking care of your health. Remember to monitor your daily consumption by reporting on the APP how many glasses or bottles of water you drank today.
3rd and
10th
day
If you do not drink at least two liters of water a day, you may feel guilty for not taking care of your health.
If you do not drink at least two liters of water a day, you may feel guilty for not taking care of your health. Remember to monitor your daily consumption by reporting on the APP how many glasses or bottles of water you drank today.
4th and
11th
day
If you do not drink at least two liters of water a day, you may worry for not taking care about your health.
If you do not drink at least two liters of water a day, you may worry for not taking care about your health. Remember to monitor your daily consumption by reporting on the APP how many glasses or bottles of water you drank today.
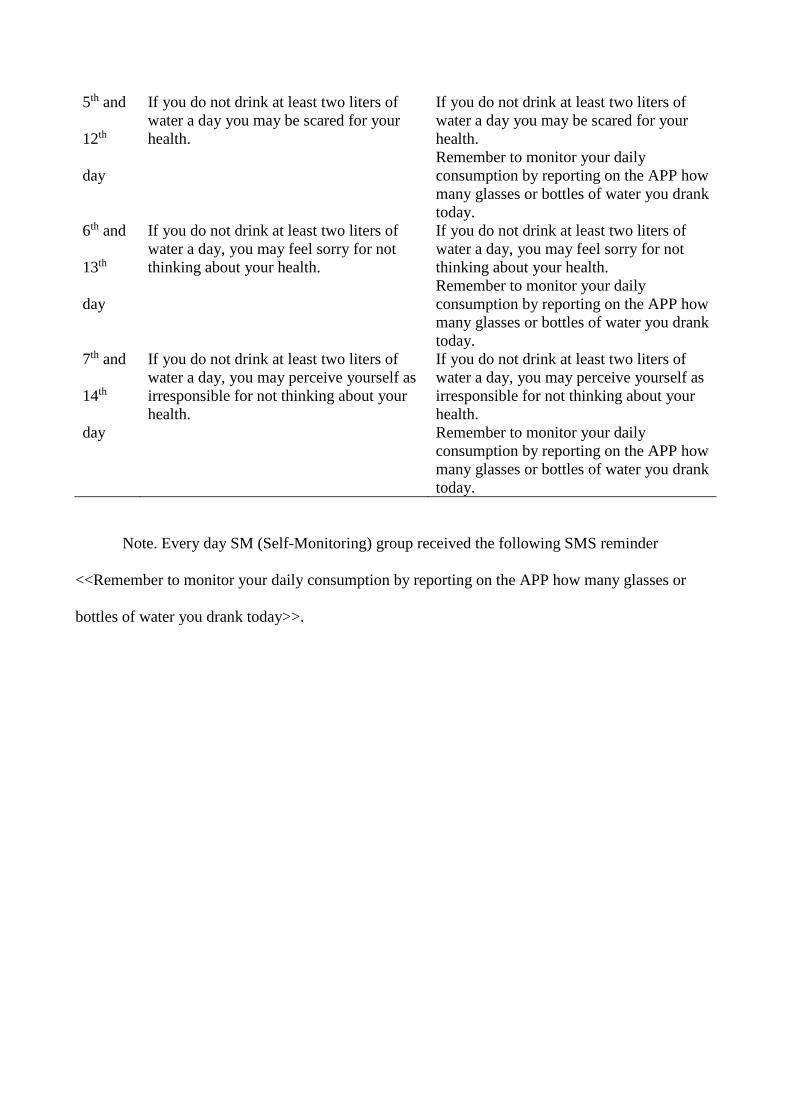
5th and
12th
day
If you do not drink at least two liters of water a day you may be scared for your health.
If you do not drink at least two liters of water a day you may be scared for your health. Remember to monitor your daily consumption by reporting on the APP how many glasses or bottles of water you drank today.
6th and
13th
day
If you do not drink at least two liters of water a day, you may feel sorry for not thinking about your health.
If you do not drink at least two liters of water a day, you may feel sorry for not thinking about your health. Remember to monitor your daily consumption by reporting on the APP how many glasses or bottles of water you drank today.
7th and
14th
day
If you do not drink at least two liters of water a day, you may perceive yourself as irresponsible for not thinking about your health.
If you do not drink at least two liters of water a day, you may perceive yourself as irresponsible for not thinking about your health. Remember to monitor your daily consumption by reporting on the APP how many glasses or bottles of water you drank today.
Note. Every day SM (Self-Monitoring) group received the following SMS reminder
<<Remember to monitor your daily consumption by reporting on the APP how many glasses or
bottles of water you drank today>>.
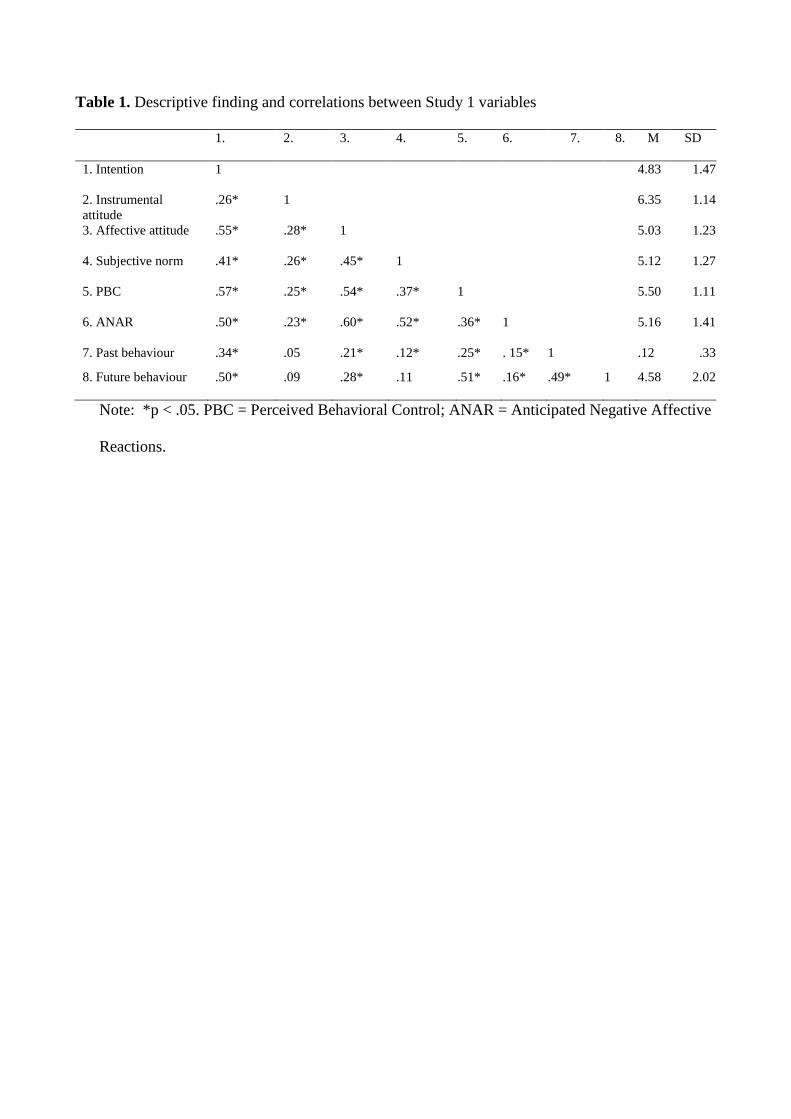
Table 1. Descriptive finding and correlations between Study 1 variables
1. 2. 3. 4. 5. 6. 7. 8. M SD
1. Intention 1 4.83 1.47
2. Instrumental attitude
.26* 1 6.35 1.14
3. Affective attitude .55* .28* 1 5.03 1.23
4. Subjective norm .41* .26* .45* 1 5.12 1.27
5. PBC .57* .25* .54* .37* 1 5.50 1.11
6. ANAR .50* .23* .60* .52* .36* 1 5.16 1.41
7. Past behaviour .34* .05 .21* .12* .25* . 15* 1 .12 .33
8. Future behaviour .50* .09 .28* .11 .51* .16* .49* 1 4.58 2.02
Note: *p < .05. PBC = Perceived Behavioral Control; ANAR = Anticipated Negative Affective
Reactions.
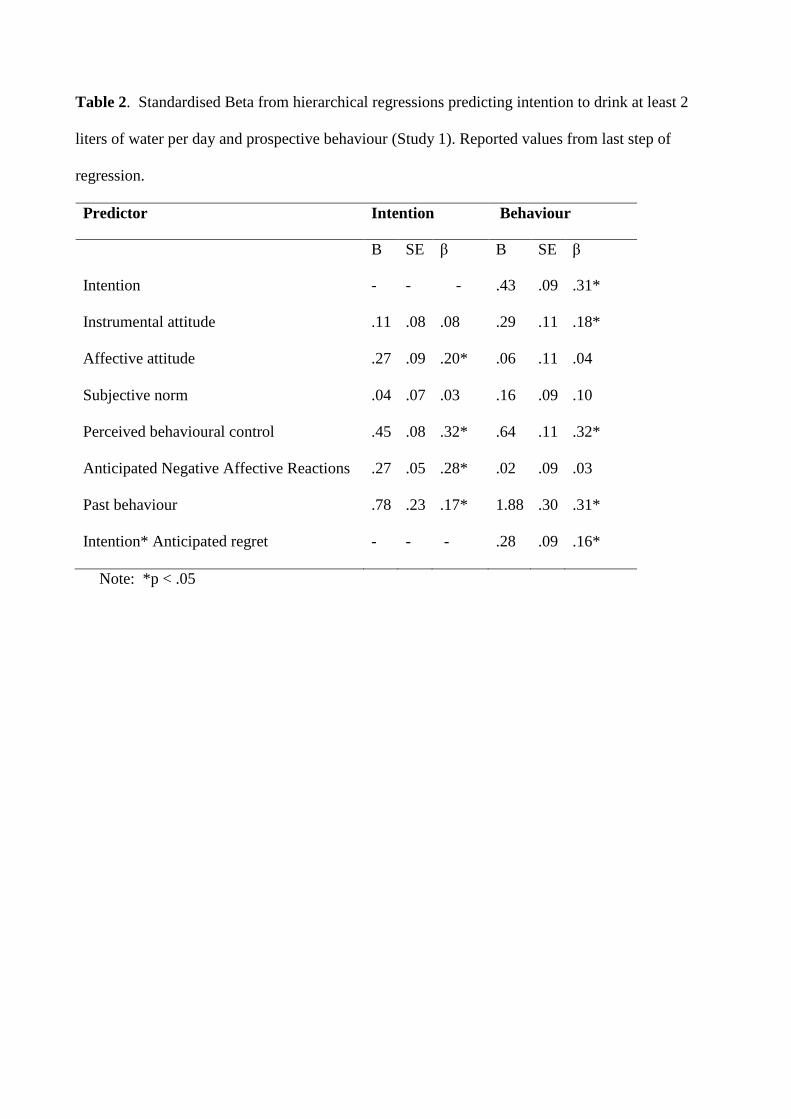
Table 2. Standardised Beta from hierarchical regressions predicting intention to drink at least 2
liters of water per day and prospective behaviour (Study 1). Reported values from last step of
regression.
Predictor Intention Behaviour
B SE く B SE く
Intention - - - .43 .09 .31*
Instrumental attitude .11 .08 .08 .29 .11 .18*
Affective attitude .27 .09 .20* .06 .11 .04
Subjective norm .04 .07 .03 .16 .09 .10
Perceived behavioural control .45 .08 .32* .64 .11 .32*
Anticipated Negative Affective Reactions .27 .05 .28* .02 .09 .03
Past behaviour .78 .23 .17* 1.88 .30 .31*
Intention* Anticipated regret - - - .28 .09 .16*
Note: *p < .05
29
Table 3. Means and standard deviations of measured variables in each condition at Time 1, Time 2 and Time 3.
Variables Control (n = 55) ANAR group (n = 50) SM group (n = 46) SM-ANAR group (n = 46) Time 1 Time 2 Time 3 Time 1 Time 2 Time 3 Time 1 Time 2 Time 3 Time 1 Time 2 Time 3
M SD M SD M SD M SD M SD M SD M SD M SD M SD M SD M SD M SD
Intention 4.82 1.45 4.83 1.45 4.71 1.54 4.83 1.60 4.65 1.69 4.98 1.61 4.68 1.68 5.34 1.68 5.34 1.36 4.98 1.69 5.35 1.58 5.35 1.35
Affective attitude 4.90 1.18 5.04 1.30 4.88 1.54 4.80 1.23 5.07 .91 5.07 .96 4.46 1.16 4.81 0.99 4.85 1.05 4.23 1.19 5.03 1.13 5.04 .99
Instrumental attitude
6.40 1.12 6.32 1.13 6.32 1.30 6.27 1.44 6.60 .57 6.66 .51 6.37 1.46 6.62 0.93 6.75 4.45 6.45 .97 6.77 .40 6.74 .43
Subjective norm 5.24 1.47 5.19 1.26 4.70 1.45 5.30 1.07 5.14 1.24 4.93 1.13 5.70 1.05 5.38 1.02 5.36 1.17 5.28 1.04 5.27 1.10 4.98 1.06
PBC 5.59 .99 5.40 1.16 5.18 1.23 5.22 1.34 5.06 1.52 5.17 1.28 5.31 1.25 5.30 1.29 5.26 1.11 5.66 .86 5.65 .96 5.53 .95
ANAR 3.67 1.57 3.96 1.51 3.79 1.70 3.40 1.43 3.51 1.46 4.06 1.47 4.19 1.54 4.07 1.63 4.01 1.60 3.91 1.44 4.75 1.23 4.25 1.53
Water Intake .13 .34 4.32 2.23 4.49 2.14 .15 .36 4.15 2.15 4.33 2.27 .04 .20 4.58 1.92 4.12 1.79 .13 .34 5.41 1.90 4.89 1.95
Note. PBC = Perceived Behavioral Control; ANAR = Anticipated Negative Affective Reactions.
30
Figure 1. Plot of the simple effects of intention on self-report future behaviour (WI at Time 2) for
the three levels ANAR (Anticipated Negative Affective Reactions)
Note. ANAR = Anticipated Negative Affective Reactions
31
Figure 2. Flow of participants through each stage
Note. SM = Self-Monitoring; ANAR = Anticipated Negative Affective Reactions; SM-ANAR = Self-monitoring plus Anticipated Negative Affective Reactions
32
Figure 3. Plot of the means across groups of Anticipated Negative Affective Reactions at
Time 2 and Time 3
Note: ANAR = anticipated negative affective reactions group; SM: self-monitoring group;
SM-ANAR: Self-Monitoring plus Anticipated Negative Affective Reactions plus Self-Monitoring
group.
33
Figure 4. Plot of the means across groups of the Water Intake at T2 and T3
Note: ANAR = Anticipated Negative Affective Reactions group; SM: Self-Monitoring
group; SM-ANAR = Self-Monitoring plus Anticipated Negative Affective Reactions group.
34
Figure 5. Mediation effects showing paths among variables.
Note. All values indicated unstandardized coefficients; **p < .05, ***p < .001; T1 = Time 1; T2 =
Time 2. ANAR = Anticipated Negative Affective Reactions.
.49***
2.00***
.15**
Groups
ANAR at T2
R2 = 6.15%
Water Intake at T2
R2 = 32.63%
Water Intake at T1
(.35**) .23**
.28*** Intentions at T2
R2 = 22.16%
.41 ***
.18 ***