Embed Size (px)
Citation preview
Promotional Guidelines
WorldatWork
February 2015
About WorldatWork® – The Total Rewards Association
WorldatWork (www.worldatwork.org) is a nonprofit human resources association for
professionals and organizations focused on compensation, benefits, work-life effec-
tiveness and total rewards – strategies to attract, motivate and retain an engaged and
productive workforce. WorldatWork and its affiliates provide comprehensive education,
certification, research, advocacy and community, enhancing careers of professionals
and, ultimately, achieving better results for the organizations they serve. WorldatWork
has more than 65,000 members and subscribers worldwide; 95 percent of Fortune 500
companies employ a WorldatWork member. Founded in 1955, WorldaWork is affiliated
with more than 70 local human resources associations and has offices in Scottsdale,
Ariz., and Washington, D.C.
WorldatWork Society of Certified Professionals® is the certifying body for six presti-
gious designations: the Certified Compensation Professional® (CCP®), Certified Benefits
Professional® (CBP), Global Remuneration Professional (GRP®), Work-Life Certified
Professional® (WLCP®), Certified Sales Compensation Professional (CSCP)™ and
Certified Executive Compensation Professional (CECP)™.
The WorldatWork group of registered marks also includes: Alliance for Work-Life
Progress or AWLP, workspan and WorldatWork Journal.
Contact:
WorldatWork Customer Relations
14040 N. Northsight Blvd.
Scottsdale, Arizona USA
85260-3601
Toll free: 877-951-9191
Fax 480-483-8352
©2014 WorldatWork Any laws, regulations or other legal requirements noted in this publication are, to the best of the publisher’s knowledge, accurate and current
as of this report’s publishing date. WorldatWork is providing this information with the understanding that WorldatWork is not engaged, directly or by implication, in
rendering legal, accounting or other related professional services. You are urged to consult with an attorney, accountant or other qualified professional concerning
your own specific situation and any questions that you may have related to that.
No portion of this publication may be reproduced in any form without express written permission from WorldatWork.
Promotional Guidelines WorldatWork 1
Introduction & Methodology
This report summarizes the results of a November 2014 survey of WorldatWork members to gather information
about current trends in promotional guidelines. This survey focuses on a variety of practices and policies,
including what employers consider to be promotions as well as the standard pay increases that often accompany
promotions.
On Nov. 12, 2014, survey invitations were sent electronically to 4,989 WorldatWork members. Randomly
selected members had designated compensation only or compensation and benefits as their primary job function
in their WorldatWork member profile. The survey closed on Dec. 12, 2014, with 541 responses, an 11% response
rate. The dataset was cleaned, resulting in a final dataset of 443 responses.
In order to provide the most accurate data possible, the data was cleaned and analyzed using statistical software.
Any duplicate records were removed. Data comparisons with any relevant, statistically significant differences are
noted within this report.
The demographics of the survey sample and the respondents are similar to the WorldatWork membership as a
whole. The typical WorldatWork member works at the managerial level or higher in the headquarters of a large
company in North America.
The frequencies or response distributions listed in the report show the number of times or percentage of times a
value appears in a dataset. Due to rounding, frequencies of data responses provided in this survey may not total
exactly 100%.
WorldatWork conducted similar promotional guidelines surveys in 2012, 2010 and 2006. The reports can be
viewed on the WorldatWork website. Many historical comparisons from 2012 and 2010 are illustrated in this
report; however, the 2006 data is not shown in this report due to various changes in questions and limited space.
Please visit the WorldatWork website to view the 2006 data in its entirety.
Promotional Guidelines WorldatWork 2
Table of Figures
Demographics
Figure 1: Sector ................................................................................................................................................ 4
Figure 2: Organization size .............................................................................................................................. 4
Figure 3: Industry ............................................................................................................................................. 5
Figure 4: Region ............................................................................................................................................... 5
Definition of Promotion
Figure 5: Promotion definitions and criteria ................................................................................................... 9
Size and Determination of Promotional Increases
Figure 6: Average promotional increase ......................................................................................................... 9
Figure 7: Influential factor(s) in determining rates of promotional increase .................................................. 10
Number of Promotions
Figure 8: Percentage of employees promoted .................................................................................................. 10
Funding of Promotional Increases
Figure 9: Funding of promotional increases ..................................................................................................... 11
Figure 10: Size limitation on promotional increases ........................................................................................ 11
Figure 11: Maximum amount of promotional increases .................................................................................. 12
Communicating Promotional Guidelines
Figure 12: Communication of promotional guidelines or policies ................................................................... 12
Position Movement
Figure 13: Limitations on grades, levels or bands employees are permitted to move ..................................... 13
Figure 14: Number of grades, bands or levels an employee can move in one promotion ............................... 13
Figure 15: Employee eligibility for an increase when moving laterally .......................................................... 14
Effect of Promotions on Merit Increases and Variable Pay Awards
Figure 16: Management of merit increases for promoted employees ............................................................. 14
Timing and Frequency
Figure 17: When promotions occur .................................................................................................................. 15
Figure 18: Promotion eligibility after an employee is hired............................................................................. 15
Figure 19: Frequency of employee eligibility for a promotion ........................................................................ 16
Figure 20: Calculation of bonuses or incentives after a promotion ................................................................. 17
Promotional Opportunities and Employee Motivation
Figure 21: Promotional opportunities to attract new employees ...................................................................... 17
Figure 22: Effect on employee engagement and motivation ............................................................................ 18
Global Practices
Promotional Guidelines WorldatWork 3
Figure 23: Promotional guidelines or policies designed and administered by global regions ......................... 19
Figure 24: Consistency of promotional guidelines or policies by global regions ............................................ 19
Additional Analysis Comparisons by Sector
Figure 25: Organization sector, by percentage of employees promoted .......................................................... 20
Comparisons by Effect of Promotional Opportunities on Employee Engagement
Figure 26: Communication approach of promotional guidelines or policy, by effect on employee
engagement ...................................................................................................................................................... 21
Promotional Guidelines WorldatWork 4
Demographics
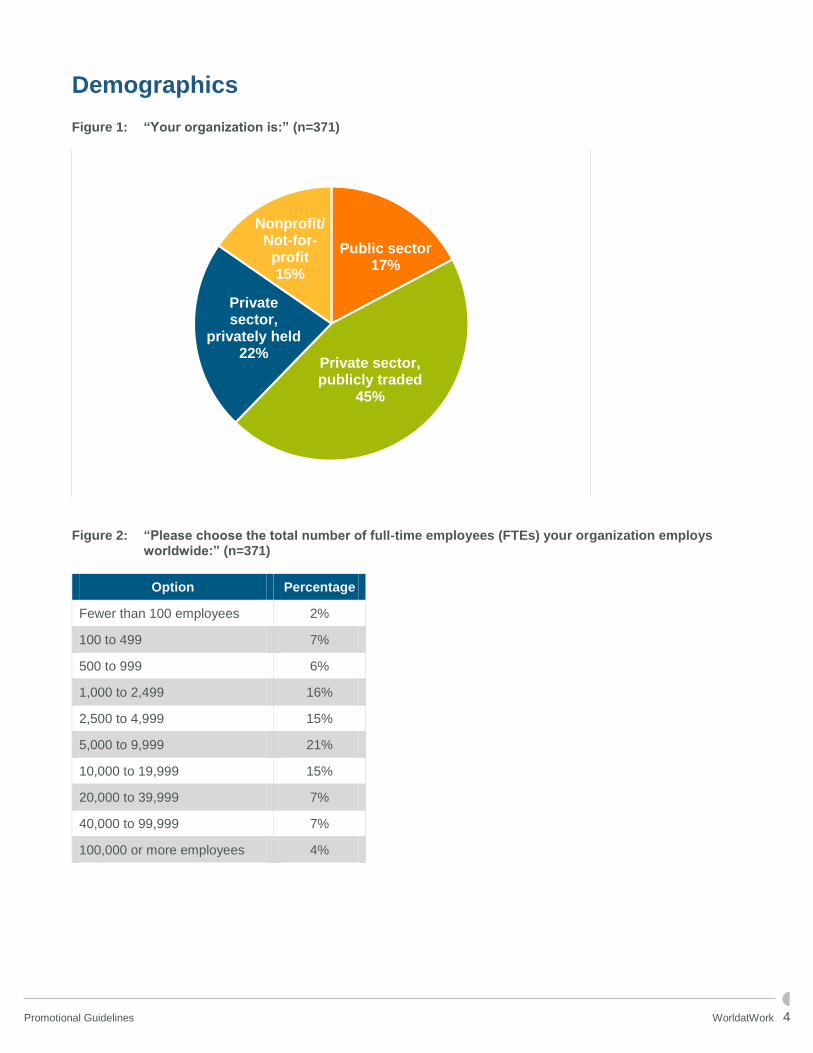
Figure 1: “Your organization is:” (n=371)
Figure 2: “Please choose the total number of full-time employees (FTEs) your organization employs
worldwide:” (n=371)
Option Percentage
Fewer than 100 employees 2%
100 to 499 7%
500 to 999 6%
1,000 to 2,499 16%
2,500 to 4,999 15%
5,000 to 9,999 21%
10,000 to 19,999 15%
20,000 to 39,999 7%
40,000 to 99,999 7%
100,000 or more employees 4%
Public sector17%
Private sector, publicly traded
45%
Private sector,
privately held 22%
Nonprofit/Not-for-profit 15%
Promotional Guidelines WorldatWork 5
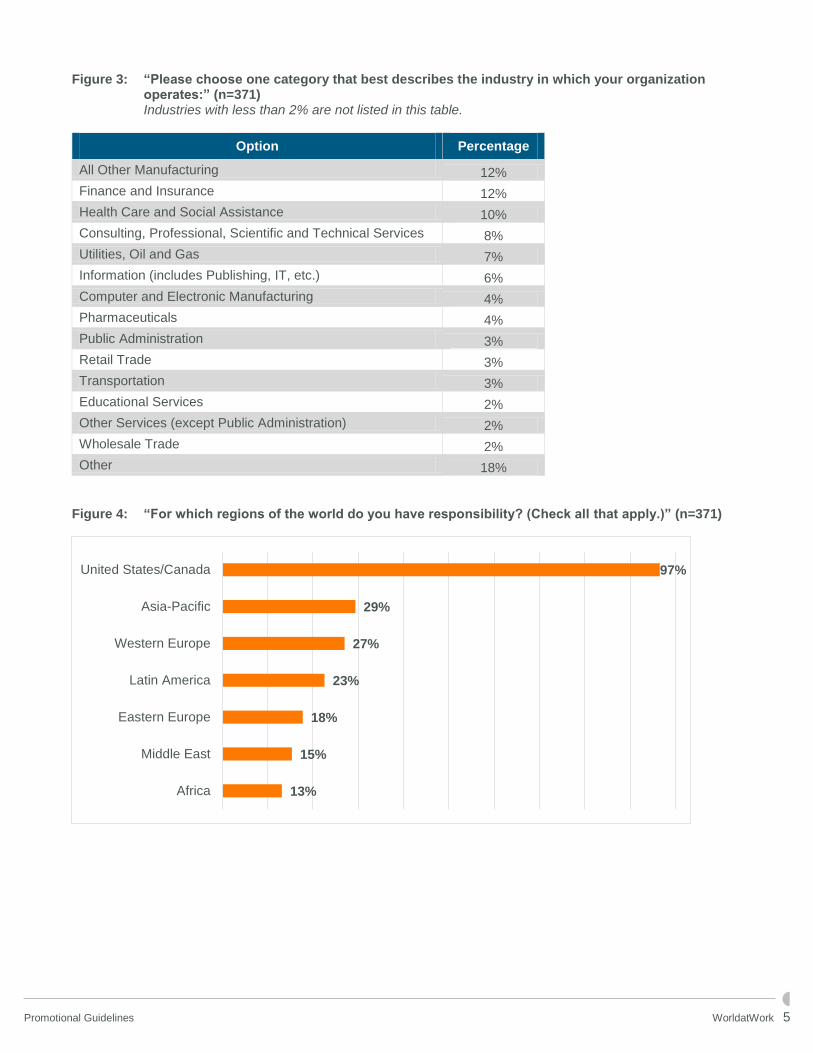
Figure 3: “Please choose one category that best describes the industry in which your organization operates:” (n=371)
Industries with less than 2% are not listed in this table.
Option Percentage
All Other Manufacturing 12%
Finance and Insurance 12%
Health Care and Social Assistance 10%
Consulting, Professional, Scientific and Technical Services 8%
Utilities, Oil and Gas 7%
Information (includes Publishing, IT, etc.) 6%
Computer and Electronic Manufacturing 4%
Pharmaceuticals 4%
Public Administration 3%
Retail Trade 3%
Transportation 3%
Educational Services 2%
Other Services (except Public Administration) 2%
Wholesale Trade 2%
Other 18% Figure 4: “For which regions of the world do you have responsibility? (Check all that apply.)” (n=371)
97%
29%
27%
23%
18%
15%
13%
United States/Canada
Asia-Pacific
Western Europe
Latin America
Eastern Europe
Middle East
Africa
Promotional Guidelines WorldatWork 6
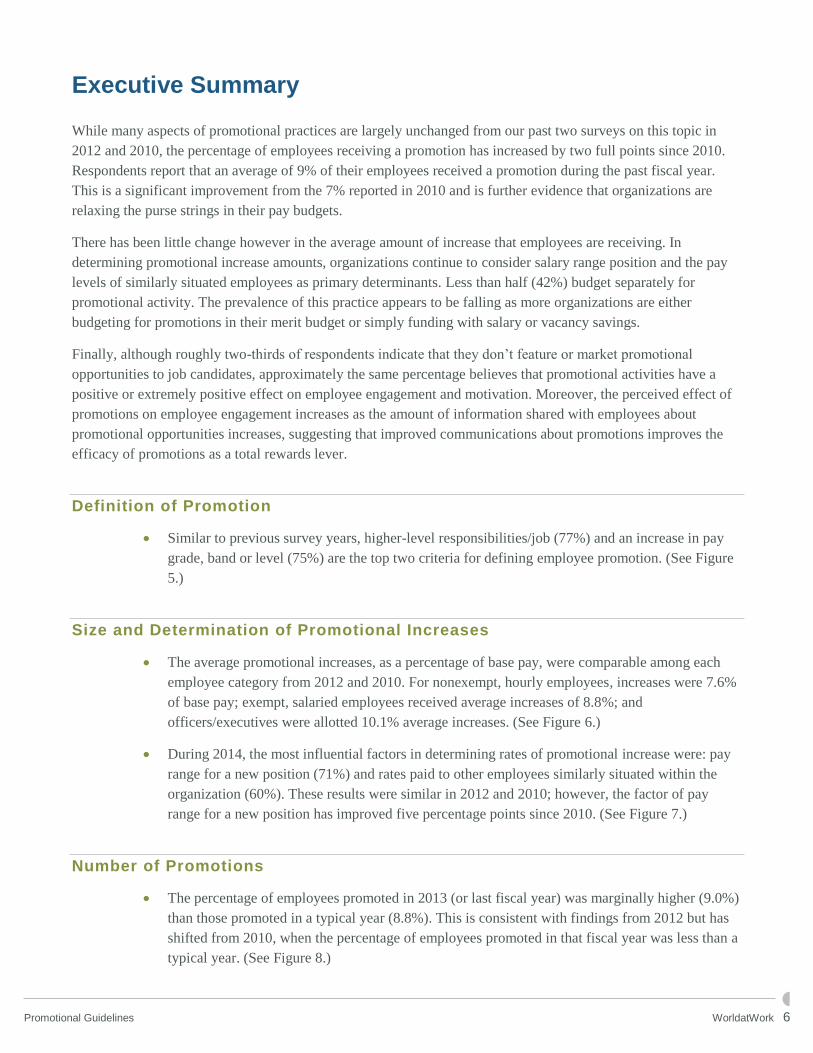
Executive Summary
While many aspects of promotional practices are largely unchanged from our past two surveys on this topic in
2012 and 2010, the percentage of employees receiving a promotion has increased by two full points since 2010.
Respondents report that an average of 9% of their employees received a promotion during the past fiscal year.
This is a significant improvement from the 7% reported in 2010 and is further evidence that organizations are
relaxing the purse strings in their pay budgets.
There has been little change however in the average amount of increase that employees are receiving. In
determining promotional increase amounts, organizations continue to consider salary range position and the pay
levels of similarly situated employees as primary determinants. Less than half (42%) budget separately for
promotional activity. The prevalence of this practice appears to be falling as more organizations are either
budgeting for promotions in their merit budget or simply funding with salary or vacancy savings.
Finally, although roughly two-thirds of respondents indicate that they don’t feature or market promotional
opportunities to job candidates, approximately the same percentage believes that promotional activities have a
positive or extremely positive effect on employee engagement and motivation. Moreover, the perceived effect of
promotions on employee engagement increases as the amount of information shared with employees about
promotional opportunities increases, suggesting that improved communications about promotions improves the
efficacy of promotions as a total rewards lever.
Definition of Promotion
Similar to previous survey years, higher-level responsibilities/job (77%) and an increase in pay
grade, band or level (75%) are the top two criteria for defining employee promotion. (See Figure
5.)
Size and Determination of Promotional Increases
The average promotional increases, as a percentage of base pay, were comparable among each
employee category from 2012 and 2010. For nonexempt, hourly employees, increases were 7.6%
of base pay; exempt, salaried employees received average increases of 8.8%; and
officers/executives were allotted 10.1% average increases. (See Figure 6.)
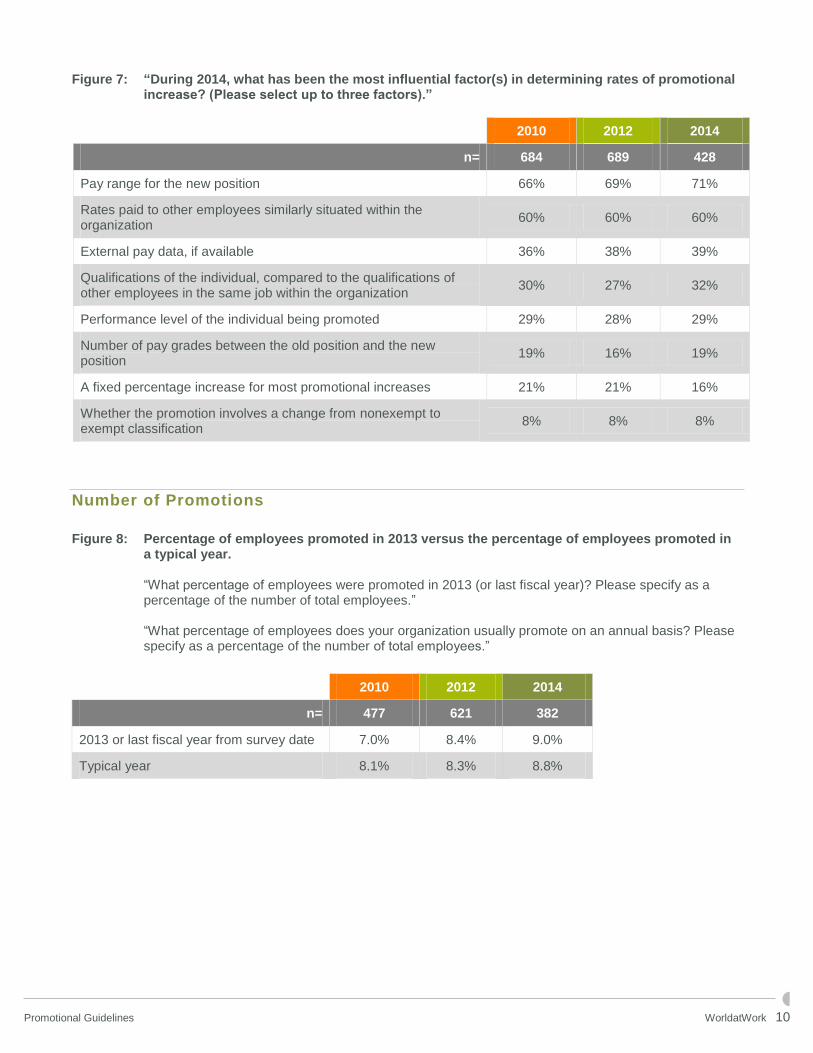
During 2014, the most influential factors in determining rates of promotional increase were: pay
range for a new position (71%) and rates paid to other employees similarly situated within the
organization (60%). These results were similar in 2012 and 2010; however, the factor of pay
range for a new position has improved five percentage points since 2010. (See Figure 7.)
Number of Promotions
The percentage of employees promoted in 2013 (or last fiscal year) was marginally higher (9.0%)
than those promoted in a typical year (8.8%). This is consistent with findings from 2012 but has
shifted from 2010, when the percentage of employees promoted in that fiscal year was less than a
typical year. (See Figure 8.)
Promotional Guidelines WorldatWork 7
Funding of Promotional Increases
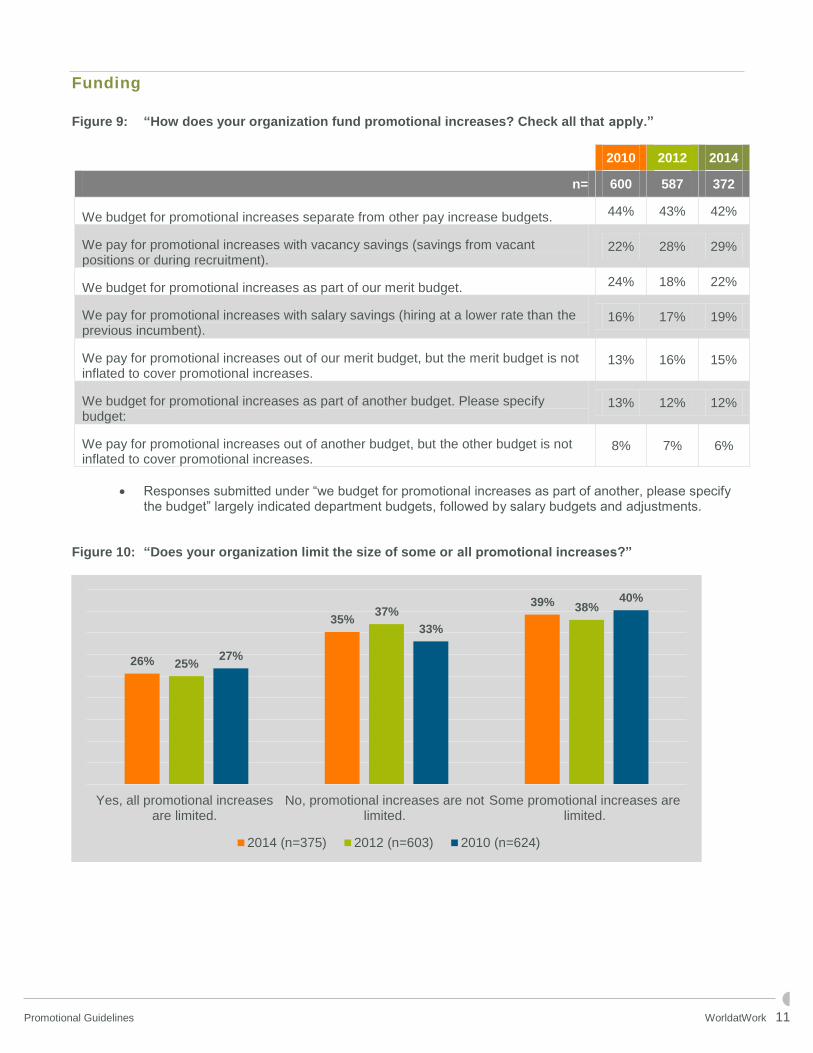
42% of organizations fund promotional increases by budgeting for these separate from other pay
increase budgets, which is down slightly compared to previous years. In addition, 29% of
promotions are funded with vacancy savings (savings from vacant positions or during
recruitment). This source has increased by seven percentage points since 2010. (See Figure 9.)
There is fairly even distribution of organizations’ stances on limiting the size of some or all
promotional increases. Overall, 39% limit some increases; 35% do not limit increases; and 26%
limit all increases. (See Figure 10.)
Communicating Promotional Guidelines
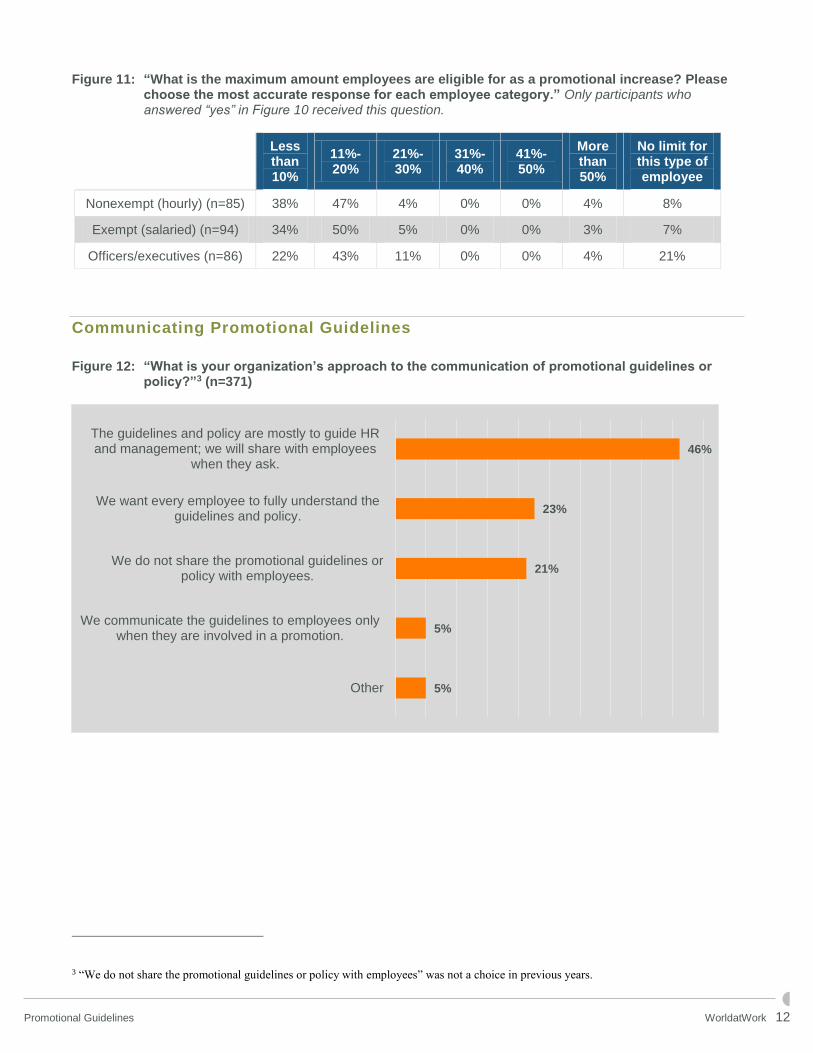
46% of organizations use the guidelines and policies to direct human resources and management,
communicating with employees when they ask. (See Figure 12.)
Position Movement
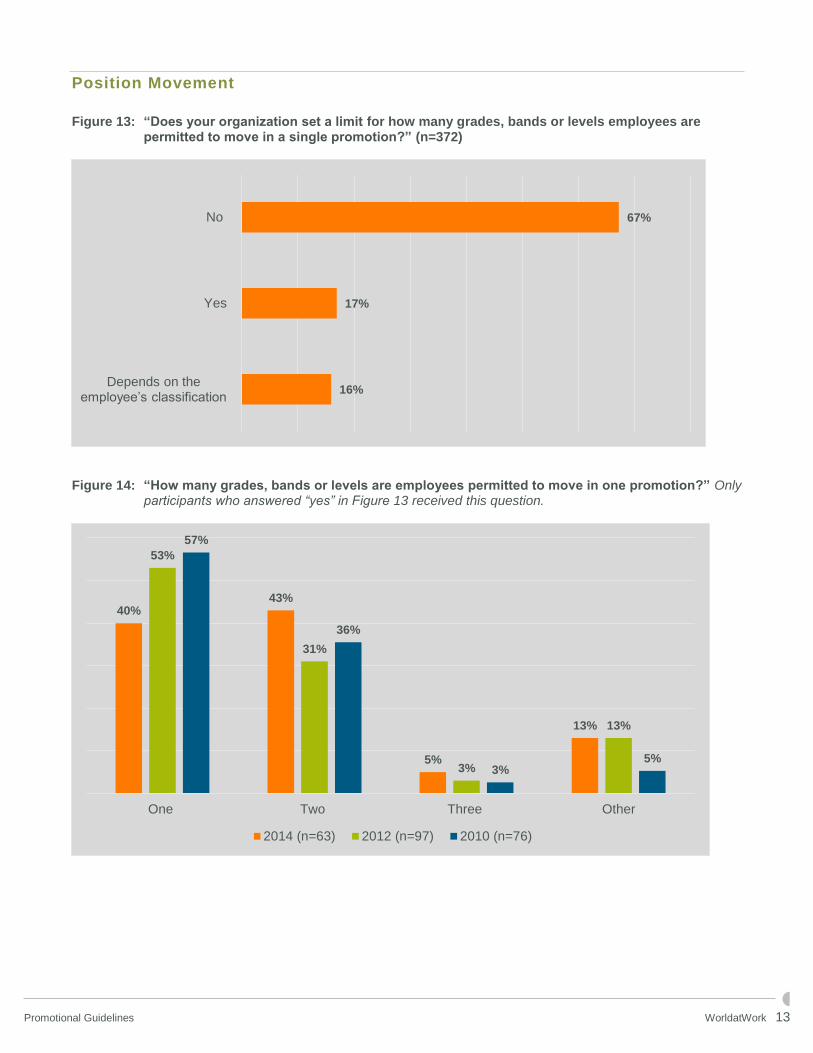
Most organizations do not set limits for how many grades, bands or levels employees are
permitted to move in a single promotion (67%). (See Figure 13.) Of the 17% who responded that
there was a limit for moving in a single promotion, more than half of those organizations either
permit one or two grades, bands or levels. (See Figure 14.)
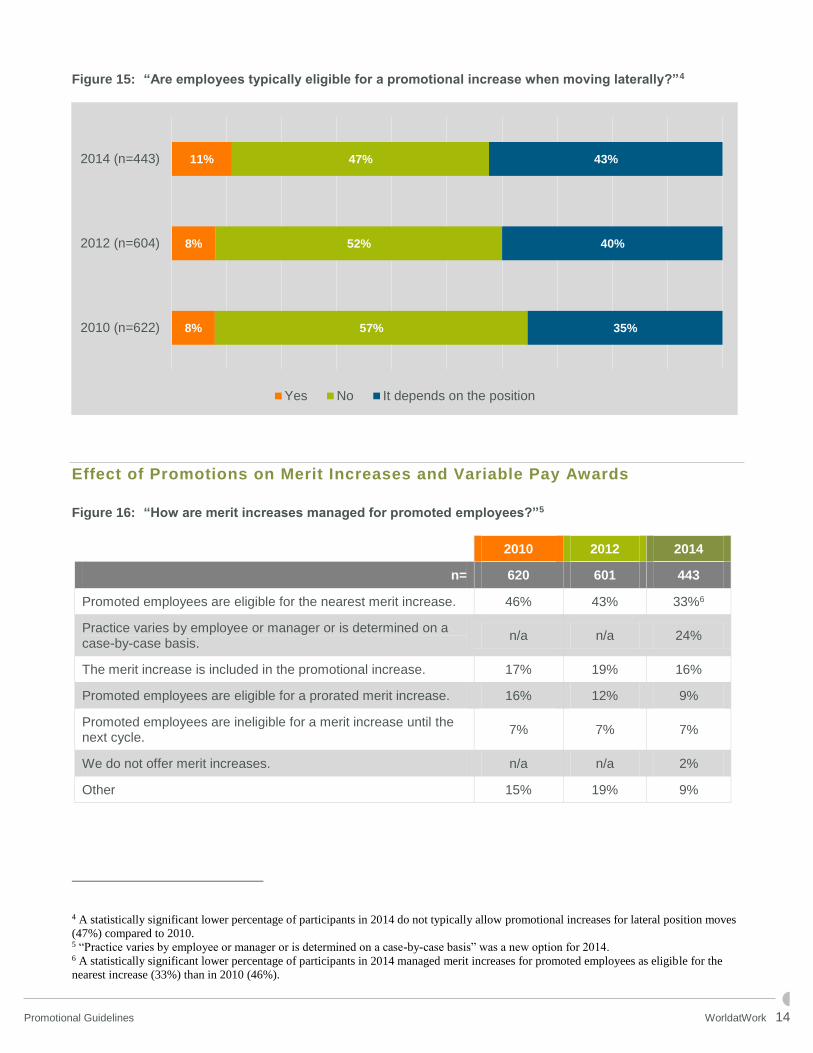
Although most employees typically remain ineligible for lateral promotional increases (47%),
many organizations are moving toward it depending on the position (43%). (See Figure 15.)
Effect of Promotions on Merit Increases and Variable Pay Awards
Like 2012 and 2010, most organizations manage their merit increases for promoted employees by
making them eligible for the nearest merit increase, though this has declined 13 percentage points
since 2010. (See Figure 16.)
Timing and Frequency
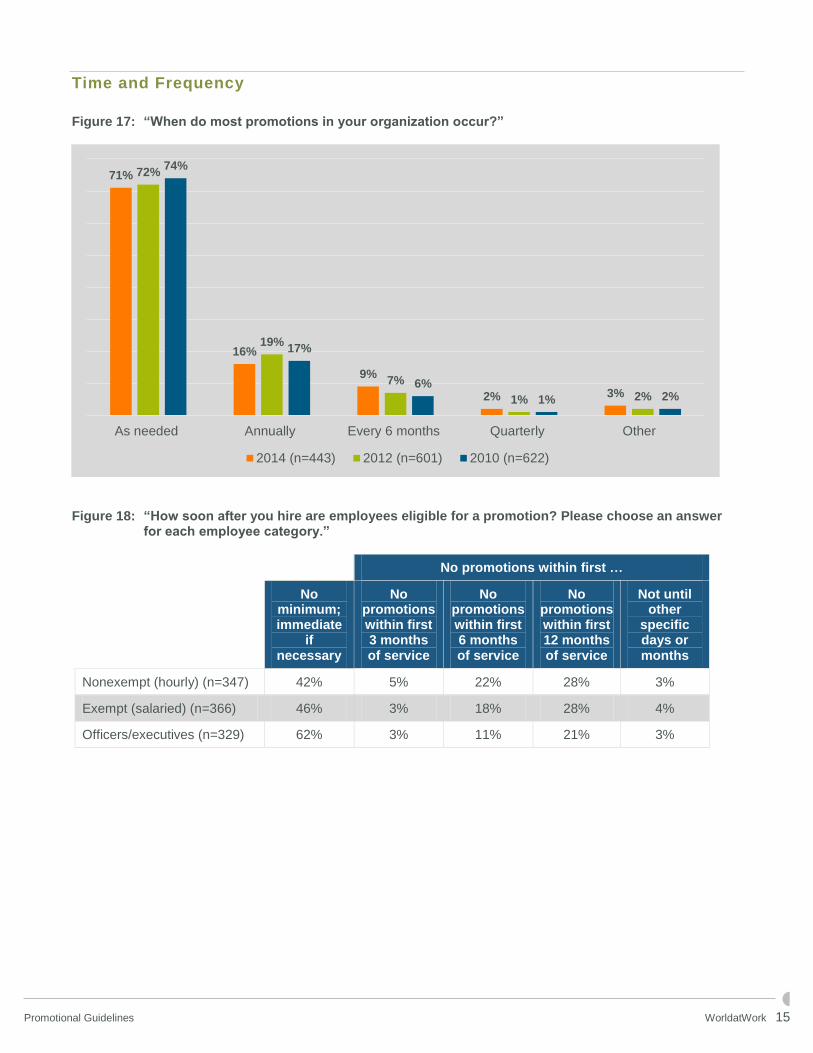
A majority of promotions occur as needed (71%), followed by on an annual basis (16%). (See
Figure 17.)
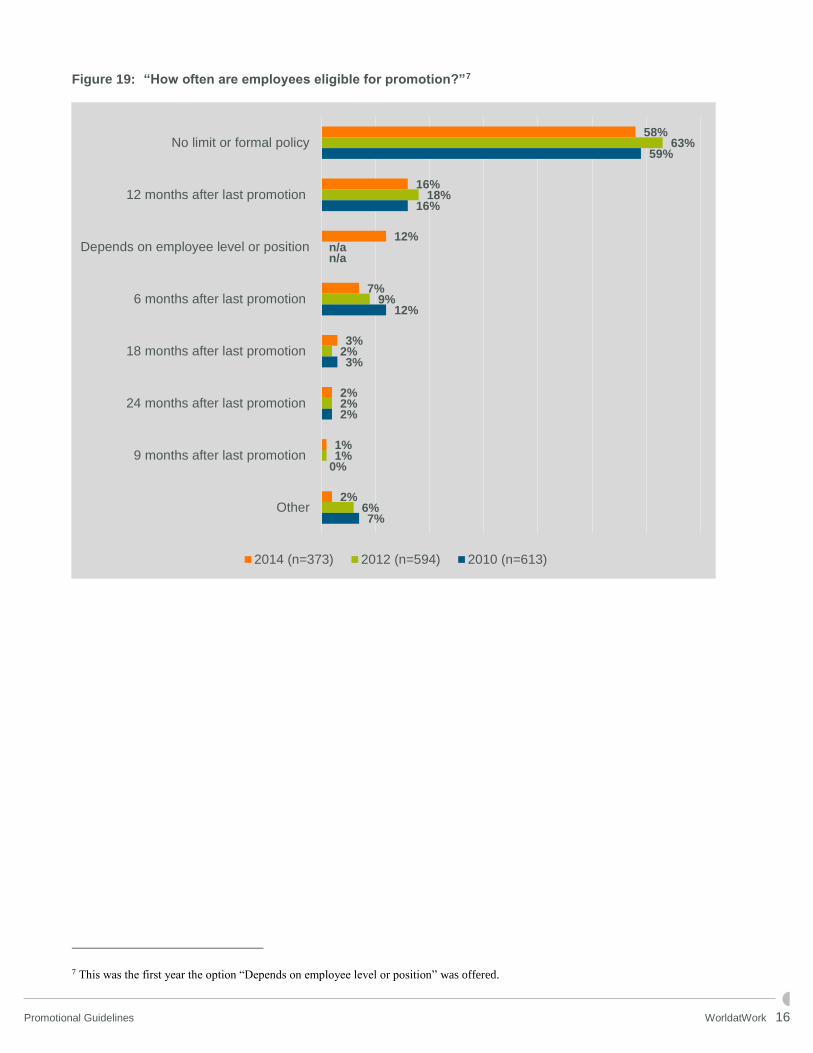
There is largely no limit or formal policy for how often employees are eligible for a promotion
(58%). (See Figure 19.) Officers/executives have the most flexibility among employee
classifications to be eligible for a promotion after being hired, with no minimum time limit
(62%). However, exempt, salaried (46%) and nonexempt hourly employees (42%) often have no
minimum time requirement for eligibility for promotions either. (See Figure 18.)
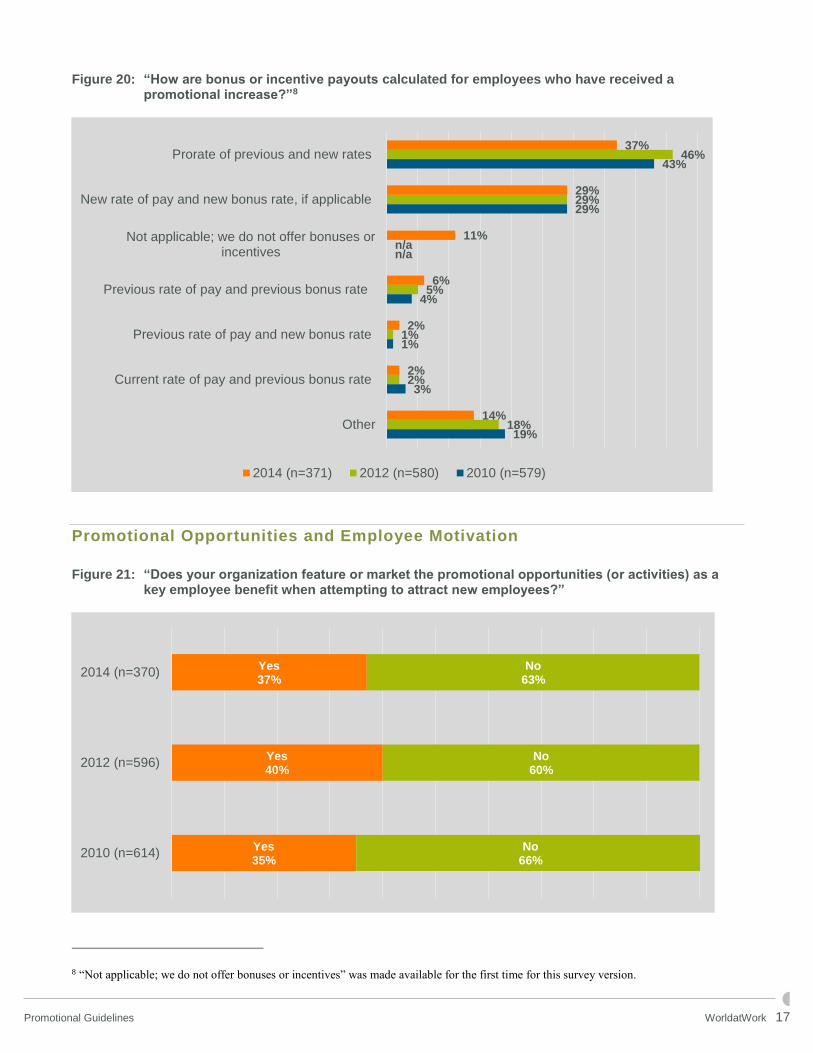
Most organizations calculate bonus or incentive payouts for employee promotional increases by
prorating previous and new rates (37%), or just use the new rate of pay and new bonus rate, if
applicable (29%). (See Figure 20.)
Promotional Guidelines WorldatWork 8
Promotional Opportunities and Employee Motivation
Consistent with previous years, over half of organizations do not feature or market their
promotional opportunities or activities as a key employee benefit to attract new employees. (See
Figure 21.)
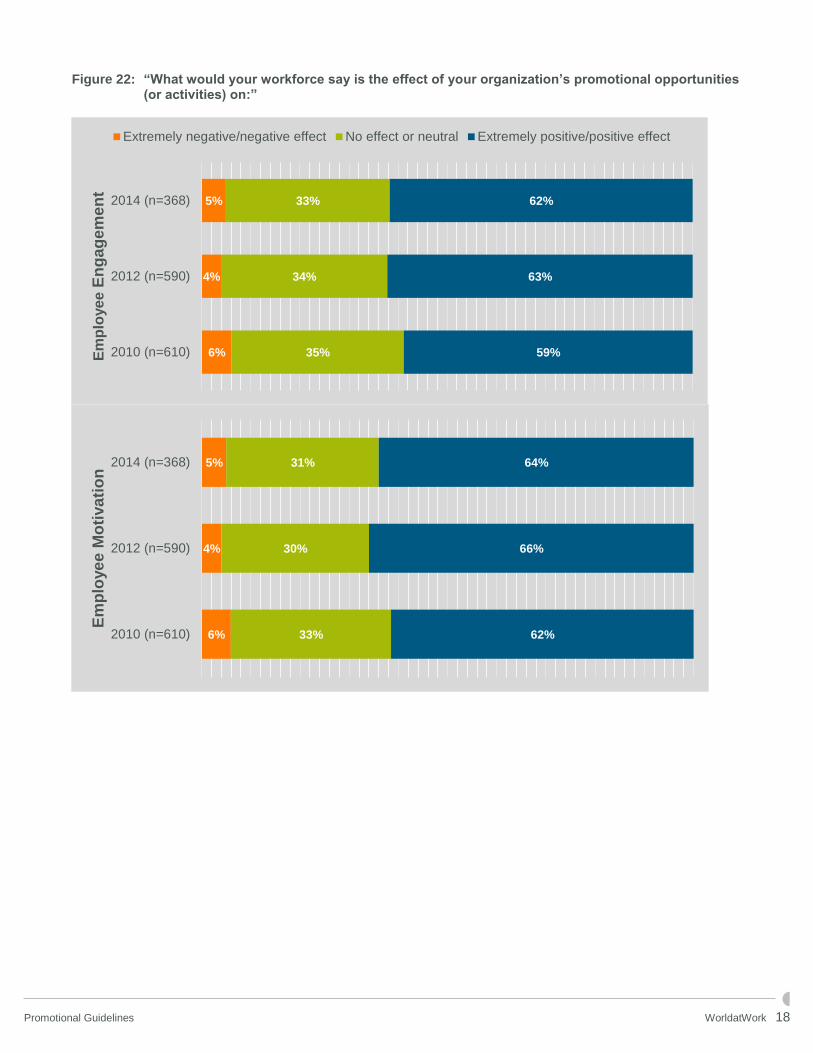
More than 60% of workforces would consider their organization’s promotional opportunities (or
activities) to have a positive effect on employee engagement and employee motivation. (See
Figure 22.)
Global Practices
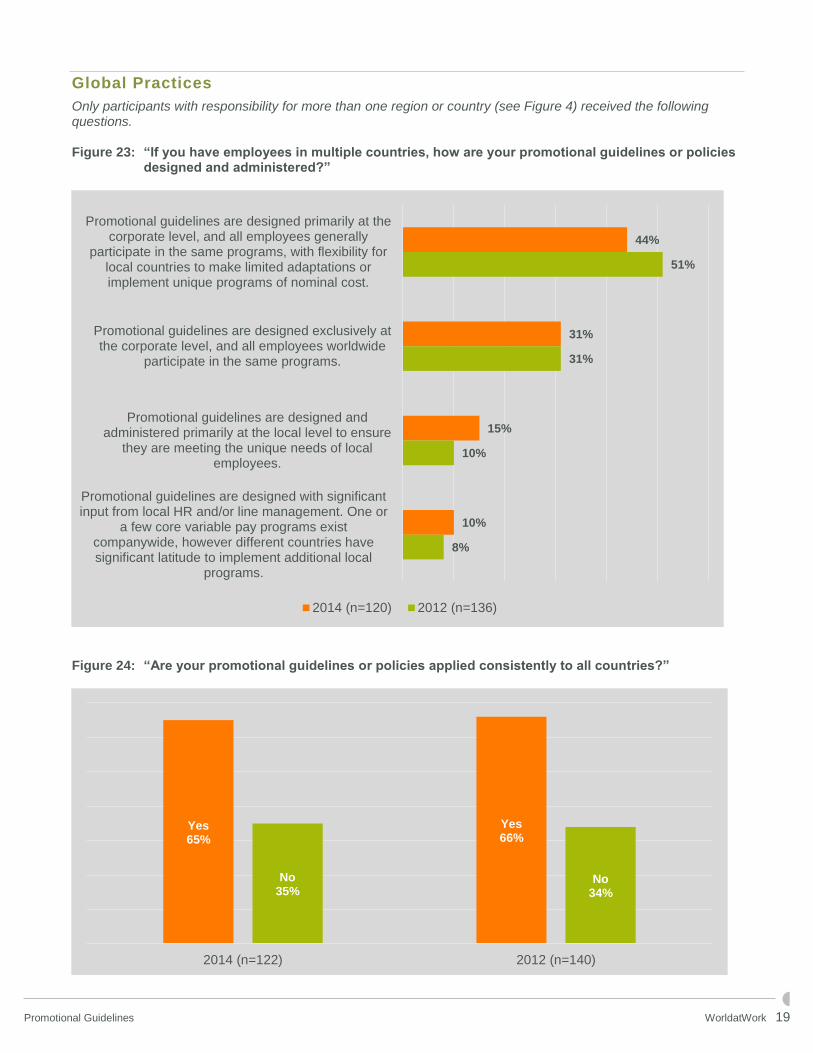
42% of organizations say their promotional guidelines are designed primarily at the corporate
level, and all employees generally participate in the same programs, with flexibility for local
countries to make limited adaptations or implement unique programs of nominal cost. This
continues to be the main method global organizations use to design and administer promotional
guidelines or policies, though this has decreased by seven percentage points from 2012. (See
Figure 23.)
Similar to 2012, more than 6 of 10 organizations consistently apply promotional guidelines or
policies to all countries. (See Figure 24.)
Promotional Guidelines WorldatWork 9
Results and Analysis
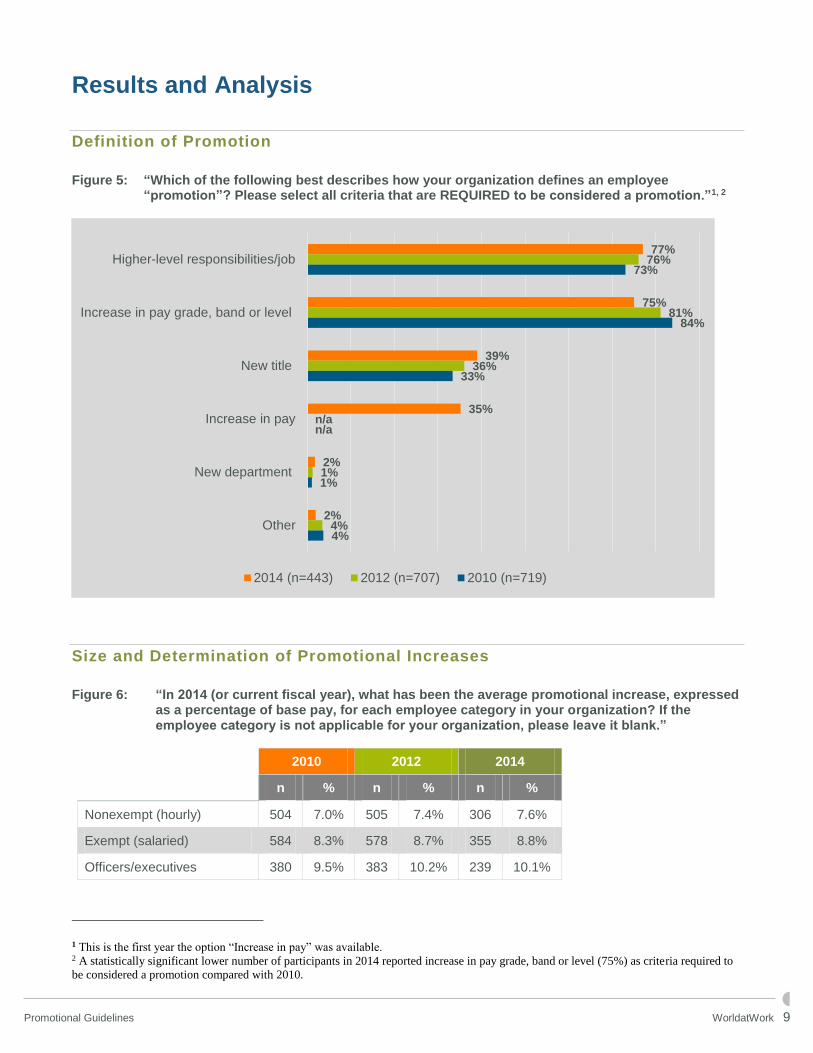
Definition of Promotion
Figure 5: “Which of the following best describes how your organization defines an employee
“promotion”? Please select all criteria that are REQUIRED to be considered a promotion.”1, 2
Size and Determination of Promotional Increases
Figure 6: “In 2014 (or current fiscal year), what has been the average promotional increase, expressed
as a percentage of base pay, for each employee category in your organization? If the employee category is not applicable for your organization, please leave it blank.”
2010 2012 2014
n % n % n %
Nonexempt (hourly) 504 7.0% 505 7.4% 306 7.6%
Exempt (salaried) 584 8.3% 578 8.7% 355 8.8%
Officers/executives 380 9.5% 383 10.2% 239 10.1%
1 This is the first year the option “Increase in pay” was available. 2 A statistically significant lower number of participants in 2014 reported increase in pay grade, band or level (75%) as criteria required to
be considered a promotion compared with 2010.
77%
75%
39%
35%
2%
2%
76%
81%
36%
n/a
1%
4%
73%
84%
33%
n/a
1%
4%
Higher-level responsibilities/job
Increase in pay grade, band or level
New title
Increase in pay
New department
Other
2014 (n=443) 2012 (n=707) 2010 (n=719)
Promotional Guidelines WorldatWork 10
Figure 7: “During 2014, what has been the most influential factor(s) in determining rates of promotional increase? (Please select up to three factors).”
2010 2012 2014
n= 684 689 428
Pay range for the new position 66% 69% 71%
Rates paid to other employees similarly situated within the organization
60% 60% 60%
External pay data, if available 36% 38% 39%
Qualifications of the individual, compared to the qualifications of other employees in the same job within the organization
30% 27% 32%
Performance level of the individual being promoted 29% 28% 29%
Number of pay grades between the old position and the new position
19% 16% 19%
A fixed percentage increase for most promotional increases 21% 21% 16%
Whether the promotion involves a change from nonexempt to exempt classification
8% 8% 8%
Number of Promotions
Figure 8: Percentage of employees promoted in 2013 versus the percentage of employees promoted in
a typical year. “What percentage of employees were promoted in 2013 (or last fiscal year)? Please specify as a
percentage of the number of total employees.”
“What percentage of employees does your organization usually promote on an annual basis? Please specify as a percentage of the number of total employees.”
2010 2012 2014
n= 477 621 382
2013 or last fiscal year from survey date 7.0% 8.4% 9.0%
Typical year 8.1% 8.3% 8.8%
Promotional Guidelines WorldatWork 11
Funding
Figure 9: “How does your organization fund promotional increases? Check all that apply.”
2010 2012 2014
n= 600 587 372
We budget for promotional increases separate from other pay increase budgets. 44% 43% 42%
We pay for promotional increases with vacancy savings (savings from vacant positions or during recruitment).
22% 28% 29%
We budget for promotional increases as part of our merit budget. 24% 18% 22%
We pay for promotional increases with salary savings (hiring at a lower rate than the previous incumbent).
16% 17% 19%
We pay for promotional increases out of our merit budget, but the merit budget is not inflated to cover promotional increases.
13% 16% 15%
We budget for promotional increases as part of another budget. Please specify budget:
13% 12% 12%
We pay for promotional increases out of another budget, but the other budget is not inflated to cover promotional increases.
8% 7% 6%
Responses submitted under “we budget for promotional increases as part of another, please specify the budget” largely indicated department budgets, followed by salary budgets and adjustments.
Figure 10: “Does your organization limit the size of some or all promotional increases?”
26%
35%
39%
25%
37% 38%
27%
33%
40%
Yes, all promotional increasesare limited.
No, promotional increases are notlimited.
Some promotional increases arelimited.
2014 (n=375) 2012 (n=603) 2010 (n=624)
Promotional Guidelines WorldatWork 12
Figure 11: “What is the maximum amount employees are eligible for as a promotional increase? Please choose the most accurate response for each employee category.” Only participants who answered “yes” in Figure 10 received this question.
Less than 10%
11%-20%
21%-30%
31%-40%
41%-50%
More than 50%
No limit for this type of employee
Nonexempt (hourly) (n=85) 38% 47% 4% 0% 0% 4% 8%
Exempt (salaried) (n=94) 34% 50% 5% 0% 0% 3% 7%
Officers/executives (n=86) 22% 43% 11% 0% 0% 4% 21%
Communicating Promotional Guidelines
Figure 12: “What is your organization’s approach to the communication of promotional guidelines or policy?”3 (n=371)
3 “We do not share the promotional guidelines or policy with employees” was not a choice in previous years.
46%
23%
21%
5%
5%
The guidelines and policy are mostly to guide HRand management; we will share with employees
when they ask.
We want every employee to fully understand theguidelines and policy.
We do not share the promotional guidelines orpolicy with employees.
We communicate the guidelines to employees onlywhen they are involved in a promotion.
Other
Promotional Guidelines WorldatWork 13
Position Movement
Figure 13: “Does your organization set a limit for how many grades, bands or levels employees are
permitted to move in a single promotion?” (n=372)
Figure 14: “How many grades, bands or levels are employees permitted to move in one promotion?” Only
participants who answered “yes” in Figure 13 received this question.
67%
17%
16%
No
Yes
Depends on the employee’s classification
40%43%
5%
13%
53%
31%
3%
13%
57%
36%
3%5%
One Two Three Other
2014 (n=63) 2012 (n=97) 2010 (n=76)
Promotional Guidelines WorldatWork 14
Figure 15: “Are employees typically eligible for a promotional increase when moving laterally?”4
Effect of Promotions on Merit Increases and Variable Pay Awards
Figure 16: “How are merit increases managed for promoted employees?”5
2010 2012 2014
n= 620 601 443
Promoted employees are eligible for the nearest merit increase. 46% 43% 33%6
Practice varies by employee or manager or is determined on a case-by-case basis.
n/a n/a 24%
The merit increase is included in the promotional increase. 17% 19% 16%
Promoted employees are eligible for a prorated merit increase. 16% 12% 9%
Promoted employees are ineligible for a merit increase until the next cycle.
7% 7% 7%
We do not offer merit increases. n/a n/a 2%
Other 15% 19% 9%
4 A statistically significant lower percentage of participants in 2014 do not typically allow promotional increases for lateral position moves
(47%) compared to 2010. 5 “Practice varies by employee or manager or is determined on a case-by-case basis” was a new option for 2014. 6 A statistically significant lower percentage of participants in 2014 managed merit increases for promoted employees as eligible for the
nearest increase (33%) than in 2010 (46%).
8%
8%
11%
57%
52%
47%
35%
40%
43%
2010 (n=622)
2012 (n=604)
2014 (n=443)
Yes No It depends on the position
Promotional Guidelines WorldatWork 15
Time and Frequency
Figure 17: “When do most promotions in your organization occur?”
Figure 18: “How soon after you hire are employees eligible for a promotion? Please choose an answer
for each employee category.”
No promotions within first …
No minimum; immediate
if necessary
No promotions within first 3 months of service
No promotions within first 6 months of service
No promotions within first 12 months of service
Not until other
specific days or months
Nonexempt (hourly) (n=347) 42% 5% 22% 28% 3%
Exempt (salaried) (n=366) 46% 3% 18% 28% 4%
Officers/executives (n=329) 62% 3% 11% 21% 3%
71%
16%
9%
2% 3%
72%
19%
7%
1% 2%
74%
17%
6%
1% 2%
As needed Annually Every 6 months Quarterly Other
2014 (n=443) 2012 (n=601) 2010 (n=622)
Promotional Guidelines WorldatWork 16
Figure 19: “How often are employees eligible for promotion?”7
7 This was the first year the option “Depends on employee level or position” was offered.
58%
16%
12%
7%
3%
2%
1%
2%
63%
18%
n/a
9%
2%
2%
1%
6%
59%
16%
n/a
12%
3%
2%
0%
7%
No limit or formal policy
12 months after last promotion
Depends on employee level or position
6 months after last promotion
18 months after last promotion
24 months after last promotion
9 months after last promotion
Other
2014 (n=373) 2012 (n=594) 2010 (n=613)
Promotional Guidelines WorldatWork 17
Figure 20: “How are bonus or incentive payouts calculated for employees who have received a promotional increase?”8
Promotional Opportunities and Employee Motivation
Figure 21: “Does your organization feature or market the promotional opportunities (or activities) as a
key employee benefit when attempting to attract new employees?”
8 “Not applicable; we do not offer bonuses or incentives” was made available for the first time for this survey version.
37%
29%
11%
6%
2%
2%
14%
46%
29%
n/a
5%
1%
2%
18%
43%
29%
n/a
4%
1%
3%
19%
Prorate of previous and new rates
New rate of pay and new bonus rate, if applicable
Not applicable; we do not offer bonuses orincentives
Previous rate of pay and previous bonus rate
Previous rate of pay and new bonus rate
Current rate of pay and previous bonus rate
Other
2014 (n=371) 2012 (n=580) 2010 (n=579)
Yes35%
Yes40%
Yes37%
No66%
No60%
No63%
2010 (n=614)
2012 (n=596)
2014 (n=370)
Promotional Guidelines WorldatWork 18
Figure 22: “What would your workforce say is the effect of your organization’s promotional opportunities (or activities) on:”
6%
4%
5%
35%
34%
33%
59%
63%
62%
2010 (n=610)
2012 (n=590)
2014 (n=368)
Em
plo
ye
e E
ng
ag
em
en
t
Extremely negative/negative effect No effect or neutral Extremely positive/positive effect
6%
4%
5%
33%
30%
31%
62%
66%
64%
2010 (n=610)
2012 (n=590)
2014 (n=368)
Em
plo
ye
e M
oti
va
tio
n
Promotional Guidelines WorldatWork 19
Global Practices
Only participants with responsibility for more than one region or country (see Figure 4) received the following questions. Figure 23: “If you have employees in multiple countries, how are your promotional guidelines or policies
designed and administered?”
Figure 24: “Are your promotional guidelines or policies applied consistently to all countries?”
44%
31%
15%
10%
51%
31%
10%
8%
Promotional guidelines are designed primarily at thecorporate level, and all employees generally
participate in the same programs, with flexibility forlocal countries to make limited adaptations orimplement unique programs of nominal cost.
Promotional guidelines are designed exclusively atthe corporate level, and all employees worldwide
participate in the same programs.
Promotional guidelines are designed andadministered primarily at the local level to ensure
they are meeting the unique needs of localemployees.
Promotional guidelines are designed with significantinput from local HR and/or line management. One or
a few core variable pay programs existcompanywide, however different countries havesignificant latitude to implement additional local
programs.
2014 (n=120) 2012 (n=136)
Yes65%
Yes66%
No35%
No34%
2014 (n=122) 2012 (n=140)
Promotional Guidelines WorldatWork 20
Additional Analysis
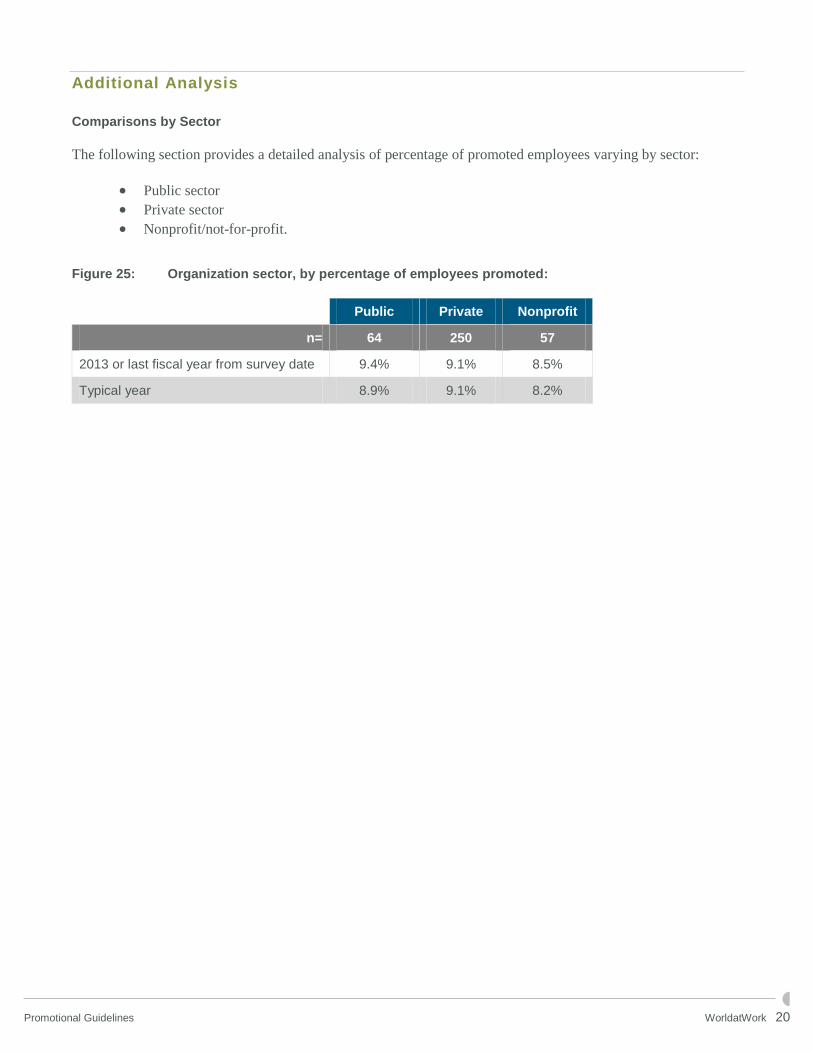
Comparisons by Sector
The following section provides a detailed analysis of percentage of promoted employees varying by sector:
Public sector
Private sector
Nonprofit/not-for-profit.
Figure 25: Organization sector, by percentage of employees promoted:
Public Private Nonprofit
n= 64 250 57
2013 or last fiscal year from survey date 9.4% 9.1% 8.5%
Typical year 8.9% 9.1% 8.2%
Promotional Guidelines WorldatWork 21
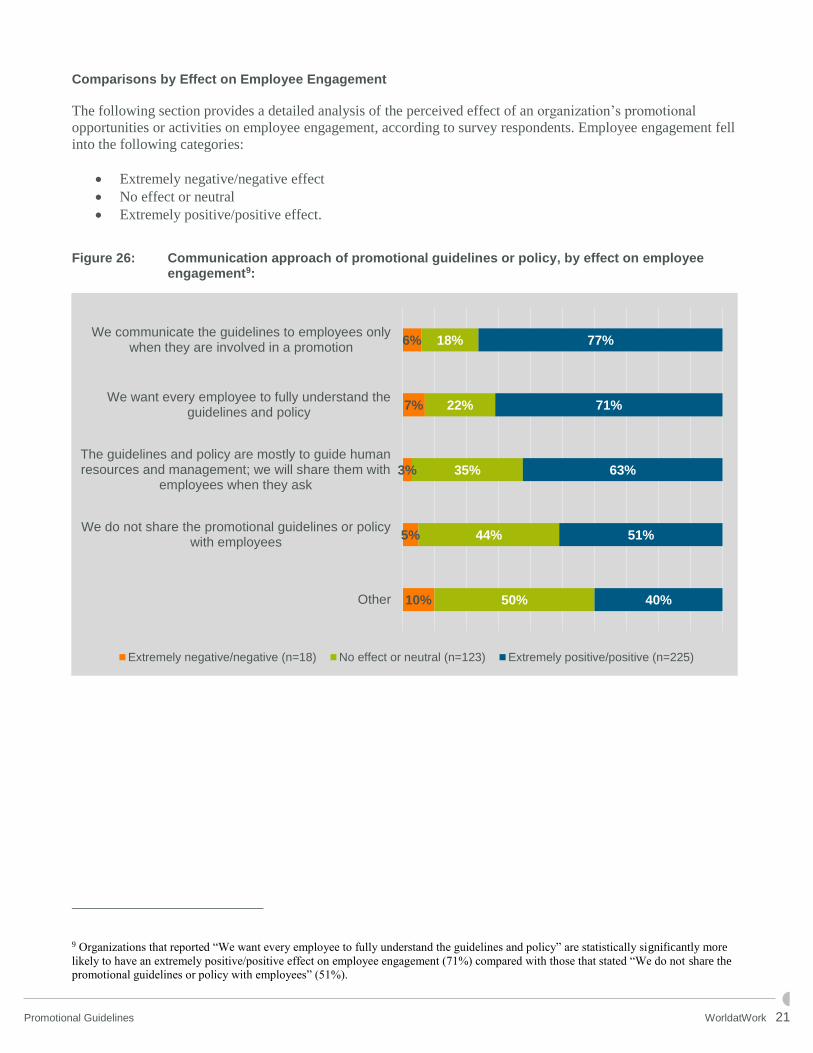
Comparisons by Effect on Employee Engagement
The following section provides a detailed analysis of the perceived effect of an organization’s promotional
opportunities or activities on employee engagement, according to survey respondents. Employee engagement fell
into the following categories:
Extremely negative/negative effect
No effect or neutral
Extremely positive/positive effect.
Figure 26: Communication approach of promotional guidelines or policy, by effect on employee engagement9:
9 Organizations that reported “We want every employee to fully understand the guidelines and policy” are statistically significantly more
likely to have an extremely positive/positive effect on employee engagement (71%) compared with those that stated “We do not share the
promotional guidelines or policy with employees” (51%).
6%
7%
3%
5%
10%
18%
22%
35%
44%
50%
77%
71%
63%
51%
40%
We communicate the guidelines to employees onlywhen they are involved in a promotion
We want every employee to fully understand theguidelines and policy
The guidelines and policy are mostly to guide humanresources and management; we will share them with
employees when they ask
We do not share the promotional guidelines or policywith employees
Other
Extremely negative/negative (n=18) No effect or neutral (n=123) Extremely positive/positive (n=225)
Promotional Guidelines WorldatWork 22
Participating Organizations
2020
Abu Dhabi Commercial Bank
Adecco Group
ADP
Advocate Health Care
AEG (Anschutz Entertainment Group)
AgStar Financial Services
Air Canada
Air Products
Akron General Health System
Alaska Airlines
Alkermes
Allegion
Alliance Data
Allstate Insurance Co.
ALSAC/St. Jude
Amadeus North America
American Dental Association
Ameritas
Amgen Inc.
Andersen
Apptio Inc.
Arlington County Government
ARRIS
Aspen Technology
Astoria Bank
Asurion
ATCO Energy Solutions Ltd.
ATCO Power
ATCO Structures & Logistics
Atmel Corp.
Autodesk
Automatic Data Processing LLC
Babcock & Wilcox
Balfour Beatty Construction US
Banner Health
Bayer Corp.
Baystate Health
Berry Appleman & Leiden
BI Inc.
Black & Veatch
Blue Cross & Blue Shield of Rhode Island
BlueCross BlueShield of South Carolina
BlueLinx Co.
BNSF Railway Co.
Bonfils Blood Center
Bridgestone Europe n.v.
Briggs & Stratton Corp.
Brigham Young University
Bruker Corp.
Build-A-Bear Workshop
Cambia Health Solutions
Cancer Treatment Centers of America
Canon USA
Canon Virginia Inc.
Capital Metropolitan Transportation Authority
CareerBuilder
Carter's Inc.
CDK Global
Centene Corp.
CenterPoint Energy
CH2M HILL Plateau Remediation Co.
CHI Health
Ciena Corp.
Clean Harbors
CME Group
Colgate Palmolive
Colorado PERA
CommScope
Community Coffee Company LLC
County of Kent
County of Riverside
Cree Inc.
CSX Transportation
Cytec Industries Inc.
Daiichi Sankyo Inc.
Dart Container Corp.
Dave & Buster's
Daymon Worldwide
Dealertrack Technologies
Dean Foods
Department of Defense
DLL
Dr. Reddy's Laboratories Inc.
Dun and Bradstreet
DynCorp International
Energy Northwest
Ensign Energy
Evonik Corp.
Evraz
Fannie Mae
Farmers Insurance
FedEx Ground
Ferring Pharmaceuticals Inc.
FINRA
Florida Blue
FMC Corp.
Follett Corp.
Fort Worth Independent School District
Franciscan Missionaries of Our Lady Health System
Freedom Mortgage
Froedtert Health
Promotional Guidelines WorldatWork 23
Frost Bank
FT Services
Fujifilm Medical Systems U.S.A. Inc.
Geisinger Health System
General Atomics
General Dynamics Corporation Gulfstream
Aerospace Corporation
GfK
Glanbia Performance Nutrition
Glu Mobile Inc.
Hackensack University Medical Center
Halcon Resources
Hawaiian Electric Company Inc.
Helen of Troy Limited of Nevada
Henkels & McCoy
Herman Miller Inc.
Hitachi America Ltd.
Horizon Blue Cross Blue Shield of New Jersey
HSN
ICON
IHG
IHS
IM Flash Technologies
Insight
Insitu
Institute for Defense Analyses
Integra Life Sciences
INTEGRIS Health
Interactive Intelligence
inVentiv Health
ITC Holdings Corp.
Jack Henry & Associates Inc.
Jackson National Life Insurance Co.
Jarden Consumer Solutions
Kyocera International Inc.
L-3 WESCAM
Lancaster General Health
Leukemia and Lymphoma society
LexisNexis Risk Solutions
Liberty Mutual Insurance Group
Lockton Cos.
Louisiana Department of State Civil Service
LPL Financial
Lutheran Social Service of Minnesota
MacDonald, Dettwiler and Associates Ltd.
Macy's Systems and Technology
Magellan Midstream Partners
MAQUET Medical
MARTA
Mathworks
McCain Foods Ltd.
Merck & Company Inc.
Mercy Health
Merkle Inc.
MFS Investments
Micro Motion Inc. (Emerson Process Management)
MidMichigan Health
Miraca Life Sciences
MITRE
Moen
Momentive
Moody's
Mosaic
–MRA — The Management Association Inc.
MSA
Murphy USA
National Grid
Nautilus Inc.
New Balance Athletic Shoe Inc.
Newmont USA Ltd.
Nielsen
Nike Inc.
Nova Southeastern University
NuStar Energy
ODYSSEY RE
OKI Data Americas
Olympus Corporation of the Americas
Omaha Public Power District
One Call Care Management
Ontario Teachers' Pension Plan Board
Orrick, Herrington & Sutcliffe LLP
Otterbein Senior Lifestyle Choices
Owensboro Health Regional Hospital
Oxford Industries Inc.
Pacific Dental Services
Pegasystems Inc.
PeroxyChem LLC
Phoenix Children's Hospital
Piramal Enterprises Ltd.
PNM Resources Inc.
Polaris Industries Inc.
Polymer Group Inc.
PROS Inc.
Provident Bank
Public Health Ontario
QAD
QBE North America
Qualcomm Inc.
Randstad US
Razorfish
RBC
Red Bull North America Inc.
Red Hat Inc.
Red Robin
Regeneron Pharmaceuticals
Republic Airways Holdings
Rexnord
RGA
Promotional Guidelines WorldatWork 24
Rosetta Stone
Royal Caribbean Cruises Ltd.
SAIC
Salesforce
Salt Lake City Corp.
Santee Cooper
SAP
SCL Health
Snap-on Inc.
Solar Turbines Inc.
SolarWinds
Spectra Energy
St. Jude Children's Research Hospital
St. Luke's University Health Network
Staples
State Farm Insurance
–State of Colorado — Department of Personnel &
Administration
State of Hawaii
STIHL Inc.
STMicroelectronics Inc.
SunGard
Superior Energy Services
Sutter Medical Center Sacramento
Synnex Corp.
TCF National Bank
TD Ameritrade
TE Connectivity
Teacher Retirement System of Texas
Teekay Corp.
Terracon Consultants Inc.
Texas Children's
The E.W. Scripps Co.
The Johns Hopkins University Applied Physics
Laboratory
The Manitowoc Co.
The Minto Group
The National Academies
The Principal Financial Group
The University of Texas Health Science Center at
San Antonio
Theravance Biopharma
Thomson Reuters
Thrivent Financial
Time Warner Cable
TransAlta
Transat
Trina Solar
Tyson Foods Inc.
UAP Inc.
Unisys
United Space Alliance
United Stationers
United Technologies Aerospace Systems
University of Pennsylvania
University of Pennsylvania Health System
U.S. Pharmacopeial Convention
USAA
Vantiv
Veolia North America
Walt Disney Parks & Resorts
Washington Metro Transit Authority
Weber Shandwick
Weill Cornell Medical College
Western Union
Westinghouse Electric Co.
Workplace & Safety Insurance Board
Wright State University
Wyle CAS
Zoetis Inc.
Zurich North America