Embed Size (px)
Citation preview
13th World Conference on Earthquake Engineering Vancouver, B.C., Canada
August 1-6, 2004 Paper No. 483
PROPOSAL OF STRATEGIC SEISMIC OBSERVATION OF SOIL-STRUCTURE SYSTEM AND DATA PUBLICATION THROUGH WEB
Nobuo FUKUWA1, Jun TOBITA2 and Hiroaki KOJIMA3
SUMMARY The soil-structure interaction (SSI) is very important factor for the ordinary buildings. The reduction effect of seismic force due to SSI should be qualified through the seismic observation. However, the experimental or observational verification is not enough yet. For the acquisition of high-quality data which can evaluate SSI effect, the systematic and strategic observation should be planned. The ideal datasets are the same buildings with different soil conditions, the different height buildings with same structure and soil conditions, and the different structural buildings with same height and soil conditions. Here, the several observation examples conducted by us are introduced. The exchange of useful data is also important matter. In order to promote the data circulation, the web system which opens data to public through Internet is the most suitable. Here the prototype system is demonstrated. In order to increase the seismic observation data of ordinary buildings, the inexpensive and easily constructed seismic observation system should be proposed. In this paper, the low price seismometer is newly developed by converting the air-bag sensor. Also, sensors have been combined with PCs, warning light towers, meteorological sensors, live cameras, etc. and connected to the Internet. The design allows expansion of the system to allow for multiple uses such as emergency alarm, disaster mitigation, ordinary crime prevention, environmental monitoring, education or other purposes.
INTRODUCTION A better understanding of how buildings resist earthquakes and quake-induced loads is necessary to further performance-based seismic design. The extensive damage resulting from the Hyogo-ken Nambu Earthquake showed, however, highlighted how little we really know about this subject. The actual response behavior of the structures and the forces acting on the structures during the earthquake appear to
1 Professor, Nagoya Univ., Nagoya, Japan, Email: [email protected] 2 Associate Professor, Nagoya Univ., Nagoya, Japan, Email: [email protected] 3 Graduate Student, Nagoya Univ., Nagoya, Japan, Email: [email protected]
have differed significantly from those predicted by current analytical methods. Since there are scant records from areas struck by earthquakes, however, there is no way to prove it. A lot of data have been recorded for super high rise buildings and base isolated buildings during earthquakes, and methods for analyzing structural responses to these loads have been developed to match the observations. However, the structures of ordinary buildings are complicated so that the analytical investigation is difficult. There has also been a dearth of data. Thus, our understanding of building behavior during earthquakes has proven to be entirely inadequate. In order to rectify this lack of information, (i) a far larger number of buildings must be equipped for observations during earthquakes, (ii) observations must be performed with the specific purpose of understanding building behavior, and (iii) a system for wide dissemination of the observation records must be assembled. In this paper, a list of items for earthquake observations is presented, which allows the data to be analyzed to determine the most important factors contributing to the structural behavior during earthquake. An example of the seismic response observation network and some examples of analysis of observations are described. An example of an internet-based system for publishing observation records and data from structures and soil is also presented. Finally, an inexpensive seismic sensor is developed to ease the financial burden of deploying instrumentation to make such observations. The system is also expandable beyond use simply for seismic engineering, with possible uses for disaster measures, environmental monitoring and warning, crime prevention and education.
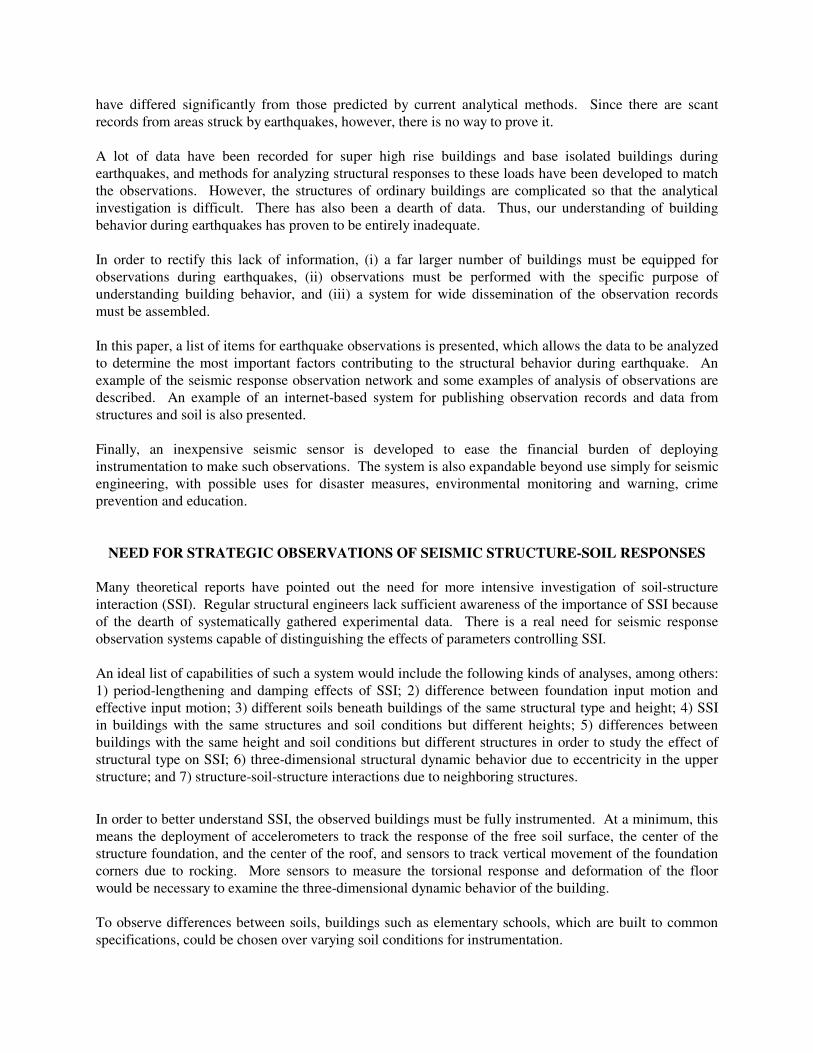
NEED FOR STRATEGIC OBSERVATIONS OF SEISMIC STRUCTURE-SOIL RESPONSES Many theoretical reports have pointed out the need for more intensive investigation of soil-structure interaction (SSI). Regular structural engineers lack sufficient awareness of the importance of SSI because of the dearth of systematically gathered experimental data. There is a real need for seismic response observation systems capable of distinguishing the effects of parameters controlling SSI. An ideal list of capabilities of such a system would include the following kinds of analyses, among others: 1) period-lengthening and damping effects of SSI; 2) difference between foundation input motion and effective input motion; 3) different soils beneath buildings of the same structural type and height; 4) SSI in buildings with the same structures and soil conditions but different heights; 5) differences between buildings with the same height and soil conditions but different structures in order to study the effect of structural type on SSI; 6) three-dimensional structural dynamic behavior due to eccentricity in the upper structure; and 7) structure-soil-structure interactions due to neighboring structures.
In order to better understand SSI, the observed buildings must be fully instrumented. At a minimum, this means the deployment of accelerometers to track the response of the free soil surface, the center of the structure foundation, and the center of the roof, and sensors to track vertical movement of the foundation corners due to rocking. More sensors to measure the torsional response and deformation of the floor would be necessary to examine the three-dimensional dynamic behavior of the building. To observe differences between soils, buildings such as elementary schools, which are built to common specifications, could be chosen over varying soil conditions for instrumentation.
To understand the differences between structurally similar buildings with different numbers of floors, observations can be carried out in a single building, as earthquakes occur when different floor levels have been reached during construction. This data would also be useful for developing a better understanding of the differences between effective input motion and foundation input motion. In addition, continual observations of pile foundations would allow analysis to distinguish between the influence of inertia of the upper structure and the influence of soil deformation. Simultaneous observations of buildings of the same height on the same site but of different structural types would provide data on the effect of different structures. Another method for obtaining a similar result would be to observe the responses to earthquakes before and after a building is retrofitted for earthquake resistance. The effect of the presence of neighboring structures can be examined by instrumenting a building neighboring a site where another building is scheduled to be erected and observing it during earthquakes before and after the second building is built. The effect of eccentricity of the upper floors can be examined by instrumenting a building scheduled for an addition and observing it before and after construction of the addition. Fortunately, at Nagoya University, where the authors work, there are a large number of buildings, many still of original construction or under construction of additions, including seismic retrofit measures. Figure 1 shows a list of observations offered for access.
④建物階数依存性
⑤2次部材依存性
⑦地盤・基礎条件依存性
⑥隣接建物間相互作用
①偏心の有無
増築後
②基礎・建物剛性の差
SRC S PC
③大規模免震建物の立体振動挙動・群杭挙動
(a) Eccentricity
Build outAddition
(b) Rigidity of superstructure
(c) Three dimensional movement of base isolated structure on group pile foundation
(d) Building height
(e) Non structural member
(e)
Fou
ndat
ion
type
and
soi
l stif
fnes
s
(f)
Adj
acen
t str
uctu
re
Observation during constructionSt
anda
rd e
lem
enta
ry s
choo
l bui
ldin
g w
ith d
iffe
rent
soi
l con
dtio
n
Figure 1 Seismic response observation items for analysis of factors contributing to the dynamic behavior of buildings
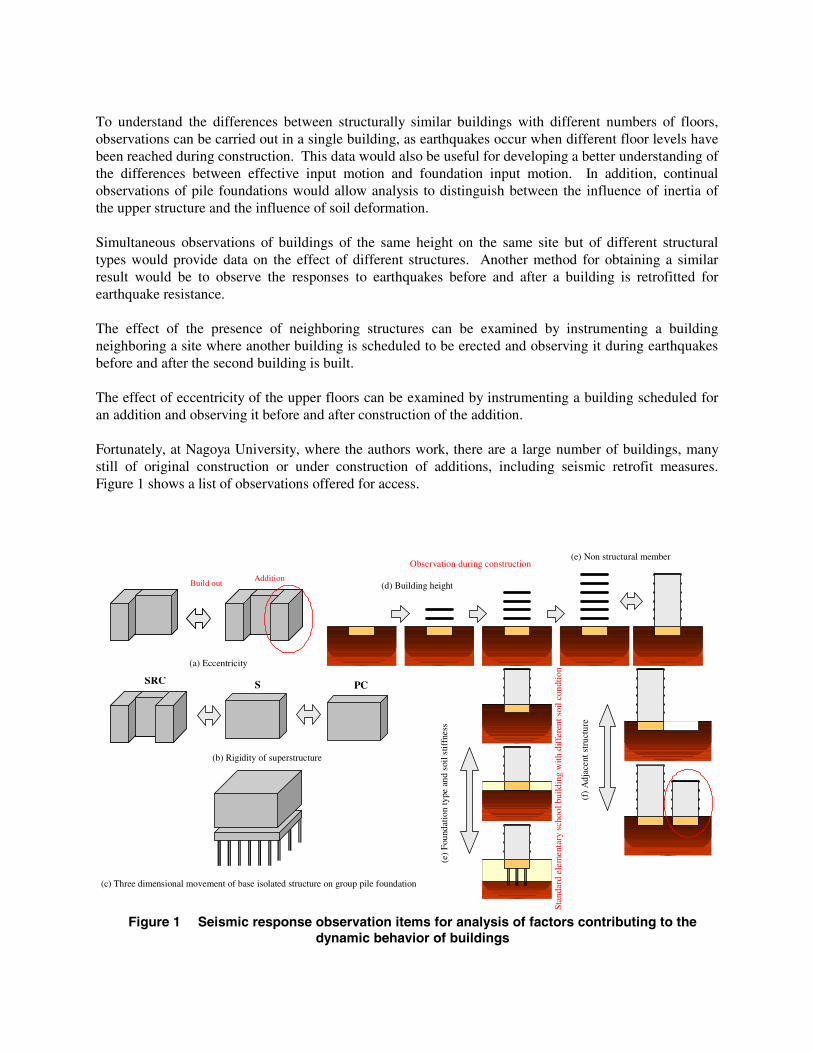
SEISMIC RESPONSE OBSERVATIONS OF STRUCTURES AND SOIL IN NAGOYA UNIVERSITY
Observations of seismic response are currently being carried out or are scheduled to begin soon at thirteen structures shown in Figure 2. These structures are on the Higashiyama and Tsurumai campuses of Nagoya university. Off campus, three residential buildings, two buildings with base isolation, one temple, and three governmental buildings are also under observation. The seismometers in the Nagoya University buildings are interfaced to the university LAN. As shown in Fig. 2, the records are in a form suitable for publishing and are made available on the Internet. The concept diagrams, structural drawings, soil data, observation point locations, sensor specifications, list of observed earthquakes, observed waveforms, microtremor records, and other data are always available via the Internet. It is also possible to download digitalized records of confirmed observation data. HTML programs are also available to ease the task of publishing seismic data on the web for other institutions.
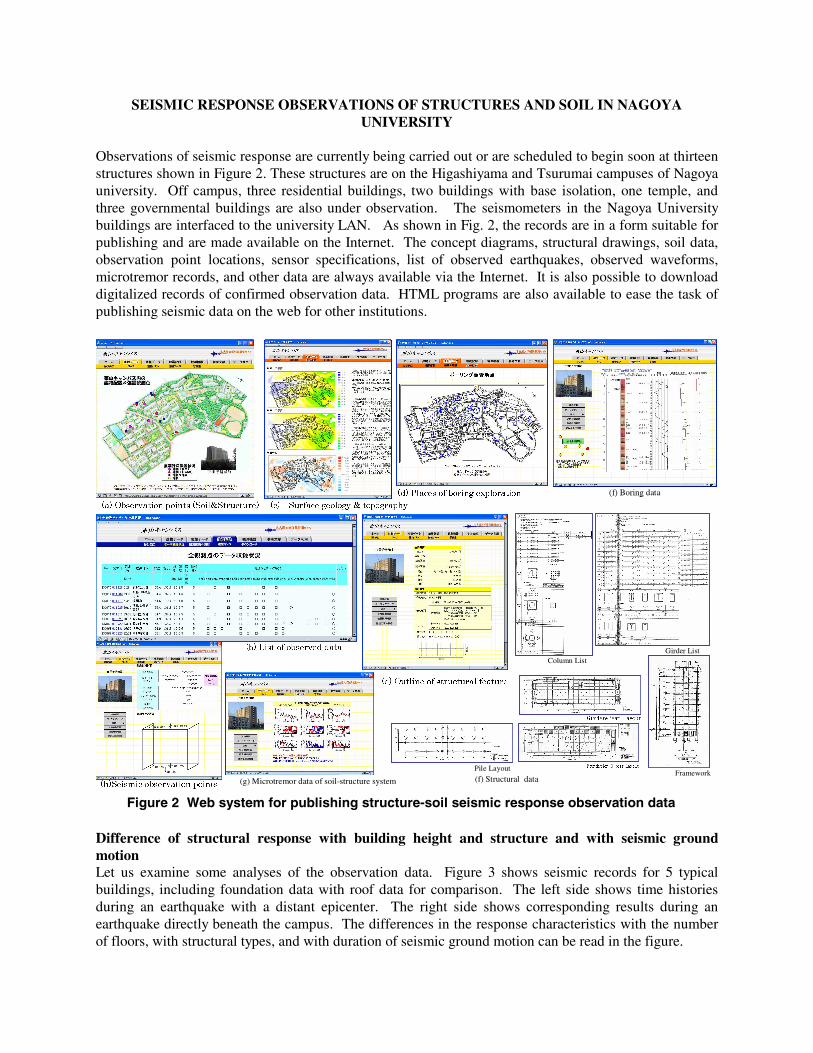
Difference of structural response with building height and structure and with seismic ground motion Let us examine some analyses of the observation data. Figure 3 shows seismic records for 5 typical buildings, including foundation data with roof data for comparison. The left side shows time histories during an earthquake with a distant epicenter. The right side shows corresponding results during an earthquake directly beneath the campus. The differences in the response characteristics with the number of floors, with structural types, and with duration of seismic ground motion can be read in the figure.
(a) Observation points (Soil&Structure) (c) Surface geology & topography
(d) Places of boring exploration(d) Places of boring exploration
(f) Structural data (h)Seismic observation points (g) Microtremor data of soil-structure system
(e) Outline of structural feature
(f) Boring data(f) Boring data
(b) List of observed data
Column List
Framework
Girder&Beam Layout
Foundation Girder LayoutPile Layout
Girder List
Figure 2 Web system for publishing structure-soil seismic response observation data
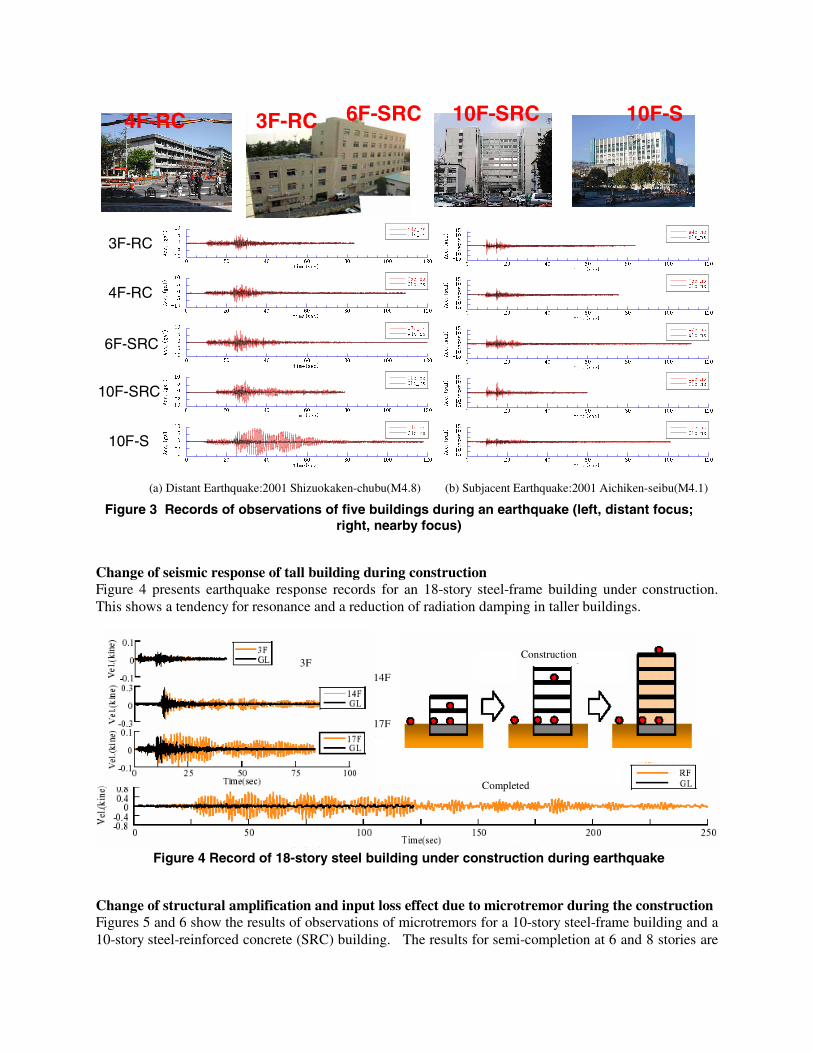
Change of seismic response of tall building during construction Figure 4 presents earthquake response records for an 18-story steel-frame building under construction. This shows a tendency for resonance and a reduction of radiation damping in taller buildings.
Change of structural amplification and input loss effect due to microtremor during the construction Figures 5 and 6 show the results of observations of microtremors for a 10-story steel-frame building and a 10-story steel-reinforced concrete (SRC) building. The results for semi-completion at 6 and 8 stories are
-15-10-5051015
0 20 40 60 80 100 120
11c_ns01c_ns
Acc.(gal)
time(sec)
-15-10-5051015
0 20 40 60 80 100 120
w7c_nsw1c_ns
Acc.(gal)
time(sec)
-15-10-5051015
0 20 40 60 80 100 120
e4c_nse1s_ns
Acc.(gal)
time(sec)
-15-10-5051015
0 20 40 60 80 100 120
05c_ns01c_ns
Acc.(gal)
time(sec)
-15-10-5051015
0 20 40 60 80 100 120
11c_ns01c_ns
Acc.(gal)
time(sec)
-15-10-5051015
0 20 40 60 80 100 120
11c_ns01c_ns
Acc.(gal)
time(sec)
-15-10-5051015
0 20 40 60 80 100 120
w7c_nsw1c_ns
Acc.(gal)
time(sec)
-15-10-5051015
0 20 40 60 80 100 120
e4c_nse1s_ns
Acc.(gal)
time(sec)
-15-10-5051015
0 20 40 60 80 100 120
05c_ns01c_ns
Acc.(gal)
time(sec)
-15-10-5051015
0 20 40 60 80 100 120
11c_ns01c_ns
Acc.(gal)
time(sec)
-10
-5
0
5
10
0 20 40 60 80 100 120
11c_ns01c_ns
Acc.(gal)
time(sec)
-10
-5
0
5
10
0 20 40 60 80 100 120
11c_ns01c_ns
Acc.(gal)
time(sec)
-10
-5
0
5
10
0 20 40 60 80 100 120
w7c_nsw1c_ns
Acc.(gal)
time(sec)
-10
-5
0
5
10
0 20 40 60 80 100 120
e4c_nse1s_ns
Acc.(gal)
time(sec)
-10
-5
0
5
10
0 20 40 60 80 100 120
05c_ns01c_ns
Acc.(gal)
time(sec)
-10
-5
0
5
10
0 20 40 60 80 100 120
11c_ns01c_ns
Acc.(gal)
time(sec)
-10
-5
0
5
10
0 20 40 60 80 100 120
11c_ns01c_ns
Acc.(gal)
time(sec)
-10
-5
0
5
10
0 20 40 60 80 100 120
w7c_nsw1c_ns
Acc.(gal)
time(sec)
-10
-5
0
5
10
0 20 40 60 80 100 120
e4c_nse1s_ns
Acc.(gal)
time(sec)
-10
-5
0
5
10
0 20 40 60 80 100 120
05c_ns01c_ns
Acc.(gal)
time(sec)
10F-S
10F-SRC
3F-RC
6F-SRC
4F-RC
4F-RC 3F-RC 6F-SRC 10F-SRC 10F-S
(a) Distant Earthquake:2001 Shizuokaken-chubu(M4.8) (b) Subjacent Earthquake:2001 Aichiken-seibu(M4.1)
Figure 3 Records of observations of five buildings during an earthquake (left, distant focus; right, nearby focus)
3F
17F
14F
Completed
Construction
Figure 4 Record of 18-story steel building under construction during earthquake
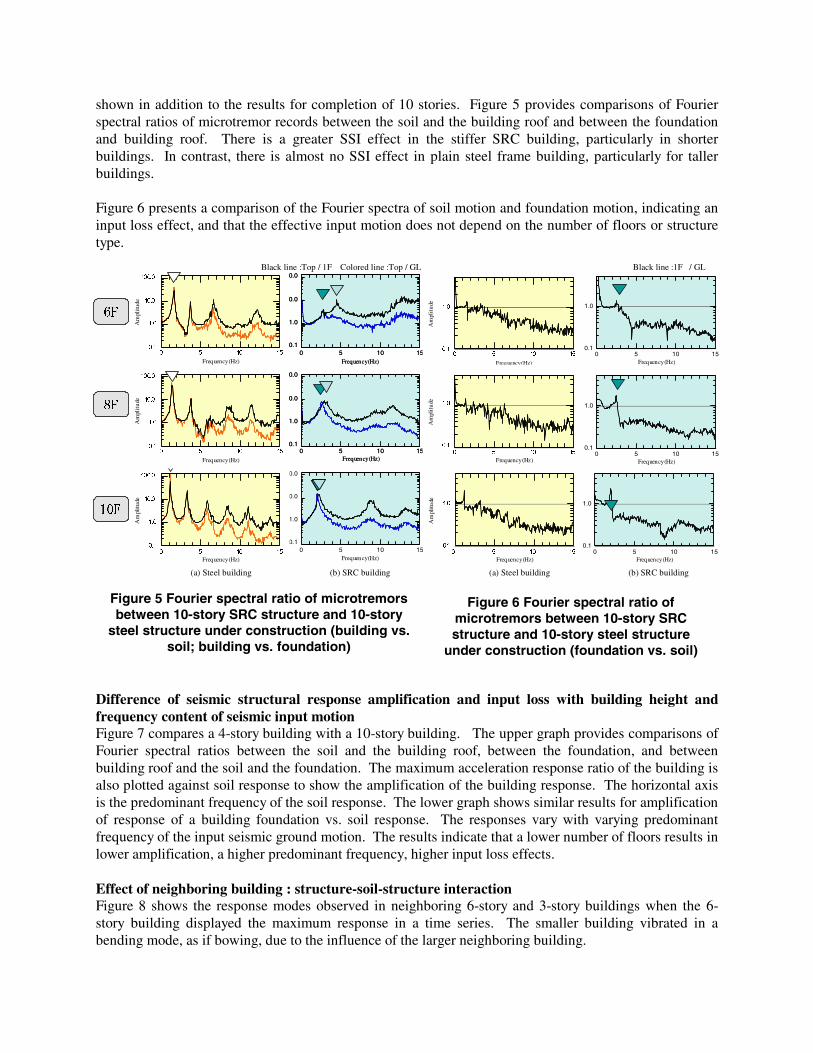
shown in addition to the results for completion of 10 stories. Figure 5 provides comparisons of Fourier spectral ratios of microtremor records between the soil and the building roof and between the foundation and building roof. There is a greater SSI effect in the stiffer SRC building, particularly in shorter buildings. In contrast, there is almost no SSI effect in plain steel frame building, particularly for taller buildings. Figure 6 presents a comparison of the Fourier spectra of soil motion and foundation motion, indicating an input loss effect, and that the effective input motion does not depend on the number of floors or structure type.
Difference of seismic structural response amplification and input loss with building height and frequency content of seismic input motion Figure 7 compares a 4-story building with a 10-story building. The upper graph provides comparisons of Fourier spectral ratios between the soil and the building roof, between the foundation, and between building roof and the soil and the foundation. The maximum acceleration response ratio of the building is also plotted against soil response to show the amplification of the building response. The horizontal axis is the predominant frequency of the soil response. The lower graph shows similar results for amplification of response of a building foundation vs. soil response. The responses vary with varying predominant frequency of the input seismic ground motion. The results indicate that a lower number of floors results in lower amplification, a higher predominant frequency, higher input loss effects. Effect of neighboring building : structure-soil-structure interaction Figure 8 shows the response modes observed in neighboring 6-story and 3-story buildings when the 6-story building displayed the maximum response in a time series. The smaller building vibrated in a bending mode, as if bowing, due to the influence of the larger neighboring building.
0.1
1.0
10.0
100.0
0 5 10 15
Am
plit
ude
Frequency(Hz)
0.1
1.0
10.0
100.0
0 5 10 15
Am
plit
ude
Frequency(Hz)
0.1
1.0
10.0
100.0
0 5 10 15
Am
plit
ude
Frequency(Hz)
0.1
1.0
10.0
100.0
0 5 10 15
Am
plit
ude
Frequency(Hz)
0.1
1.0
10.0
100.0
0 5 10 15
Am
plit
ude
Frequency(Hz)
0.1
1.0
0 5 10 15
Am
plit
ude
Frequency(Hz)
0.1
1.0
0 5 10 15
Am
plit
ude
Frequency(Hz)
0.1
1.0
0 5 10 15
Am
plit
ude
Frequency(Hz)
0.1
1.0
0 5 10 15
Am
plit
ude
Frequency(Hz)
0.1
1.0
0 5 10 15
Am
plit
ude
Frequency(Hz)
0.1
1.0
0 5 10 15
Am
plit
ude
Frequency(Hz)
0.1
1.0
10.0
100.0
0 5 10 15
Am
plit
ude
Frequency(Hz)
0.1
1.0
10.0
100.0
0 5 10 15
Am
plit
ude
Frequency(Hz)
0.1
1.0
10.0
100.0
0 5 10 15
Am
plit
ude
Frequency(Hz)
0.1
1.0
10.0
100.0
0 5 10 15
Am
plit
ude
Frequency(Hz)
0.1
1.0
10.0
100.0
0 5 10 15
Am
plit
ude
Frequency(Hz)
0.1
1.0
10.0
100.0
0 5 10 15
Am
plit
ude
Frequency(Hz)
(a) Steel building (b) SRC building
Black line :1F / GL
6F
10F
8F
(a) Steel building (b) SRC building
Black line :Top / 1F Colored line :Top / GL
Figure 5 Fourier spectral ratio of microtremors between 10-story SRC structure and 10-story
steel structure under construction (building vs. soil; building vs. foundation)
Figure 6 Fourier spectral ratio of microtremors between 10-story SRC structure and 10-story steel structure
under construction (foundation vs. soil)
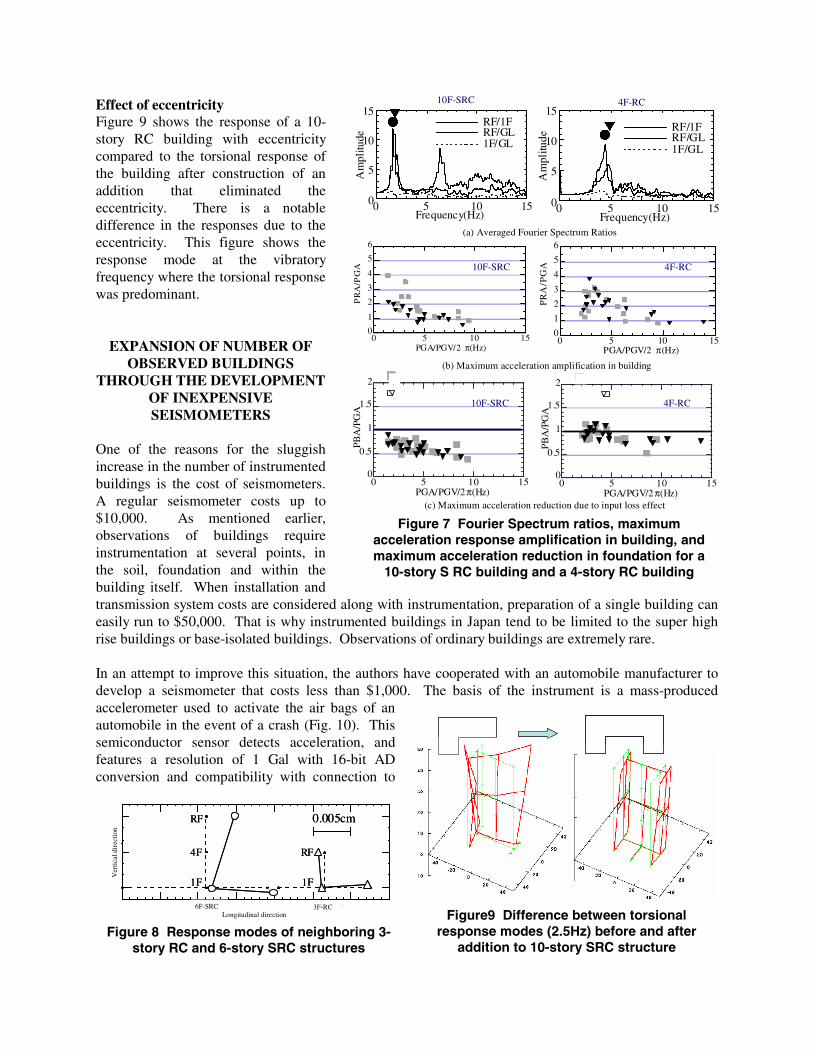
Effect of eccentricity Figure 9 shows the response of a 10-story RC building with eccentricity compared to the torsional response of the building after construction of an addition that eliminated the eccentricity. There is a notable difference in the responses due to the eccentricity. This figure shows the response mode at the vibratory frequency where the torsional response was predominant.
EXPANSION OF NUMBER OF OBSERVED BUILDINGS
THROUGH THE DEVELOPMENT OF INEXPENSIVE SEISMOMETERS
One of the reasons for the sluggish increase in the number of instrumented buildings is the cost of seismometers. A regular seismometer costs up to $10,000. As mentioned earlier, observations of buildings require instrumentation at several points, in the soil, foundation and within the building itself. When installation and transmission system costs are considered along with instrumentation, preparation of a single building can easily run to $50,000. That is why instrumented buildings in Japan tend to be limited to the super high rise buildings or base-isolated buildings. Observations of ordinary buildings are extremely rare.
In an attempt to improve this situation, the authors have cooperated with an automobile manufacturer to develop a seismometer that costs less than $1,000. The basis of the instrument is a mass-produced accelerometer used to activate the air bags of an automobile in the event of a crash (Fig. 10). This semiconductor sensor detects acceleration, and features a resolution of 1 Gal with 16-bit AD conversion and compatibility with connection to
10F-SRC 4F-RC
0
5
10
15
0 5 10 15
RF/1FRF/GL1F/GL
Frequency(Hz)
Am
plitu
de ●▼
0
1
2
3
4
5
6
0 5 10 15
PR
A/P
GA
PGA/PGV/2 π(Hz)
0
5
10
15
0 5 10 15
RF/1FRF/GL1F/GL
Frequency(Hz)
Am
plitu
de
●▼
0
1
2
3
4
5
6
0 5 10 15
PR
A/P
GA
PGA/PGV/2 π(Hz)
0
0.5
1
1.5
2
0 5 10 15
PBA
/PG
A
PGA/PGV/2 π(Hz)
0
0.5
1
1.5
2
0 5 10 15
PBA
/PG
A
PGA/PGV/2 π(Hz)
(a) Averaged Fourier Spectrum Ratios
(b) Maximum acceleration amplification in building
(c) Maximum acceleration reduction due to input loss effect
10F-SRC 4F-RC
10F-SRC 4F-RC
Figure 7 Fourier Spectrum ratios, maximum acceleration response amplification in building, and maximum acceleration reduction in foundation for a
10-story S RC building and a 4-story RC building
Figure9 Difference between torsional response modes (2.5Hz) before and after
addition to 10-story SRC structure Figure 8 Response modes of neighboring 3-
story RC and 6-story SRC structures
RF
4F
1F
RF
1F
0.005cm
長辺6F建物 3F建物
上下
6F-SRC 3F-RCLongitudinal direction
Ver
tica
l dir
ecti
on
RF
4F
1F
RF
1F
0.005cm
長辺6F建物 3F建物
上下
6F-SRC 3F-RCLongitudinal direction
Ver
tica
l dir
ecti
on
6F-SRC 3F-RCLongitudinal direction
Ver
tica
l dir
ecti
on
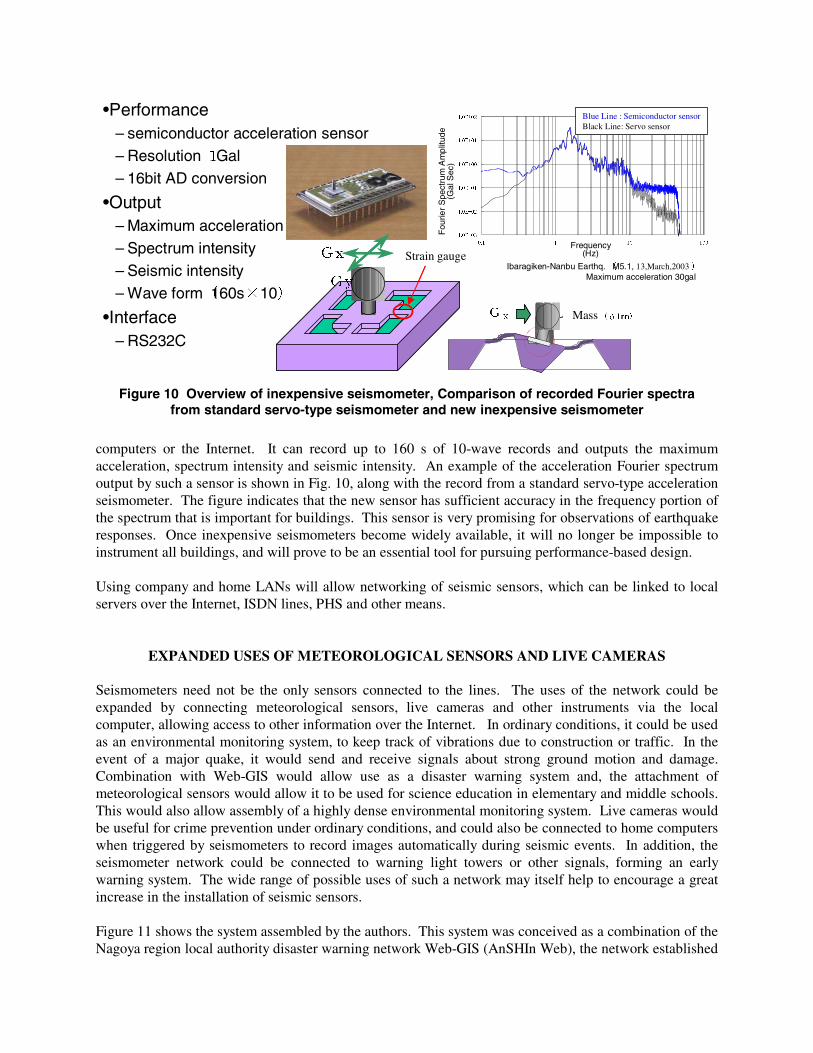
computers or the Internet. It can record up to 160 s of 10-wave records and outputs the maximum acceleration, spectrum intensity and seismic intensity. An example of the acceleration Fourier spectrum output by such a sensor is shown in Fig. 10, along with the record from a standard servo-type acceleration seismometer. The figure indicates that the new sensor has sufficient accuracy in the frequency portion of the spectrum that is important for buildings. This sensor is very promising for observations of earthquake responses. Once inexpensive seismometers become widely available, it will no longer be impossible to instrument all buildings, and will prove to be an essential tool for pursuing performance-based design. Using company and home LANs will allow networking of seismic sensors, which can be linked to local servers over the Internet, ISDN lines, PHS and other means.
EXPANDED USES OF METEOROLOGICAL SENSORS AND LIVE CAMERAS
Seismometers need not be the only sensors connected to the lines. The uses of the network could be expanded by connecting meteorological sensors, live cameras and other instruments via the local computer, allowing access to other information over the Internet. In ordinary conditions, it could be used as an environmental monitoring system, to keep track of vibrations due to construction or traffic. In the event of a major quake, it would send and receive signals about strong ground motion and damage. Combination with Web-GIS would allow use as a disaster warning system and, the attachment of meteorological sensors would allow it to be used for science education in elementary and middle schools. This would also allow assembly of a highly dense environmental monitoring system. Live cameras would be useful for crime prevention under ordinary conditions, and could also be connected to home computers when triggered by seismometers to record images automatically during seismic events. In addition, the seismometer network could be connected to warning light towers or other signals, forming an early warning system. The wide range of possible uses of such a network may itself help to encourage a great increase in the installation of seismic sensors.
Figure 11 shows the system assembled by the authors. This system was conceived as a combination of the Nagoya region local authority disaster warning network Web-GIS (AnSHIn Web), the network established
1.0E-03
1.0E-02
1.0E-01
1.0E+00
1.0E+01
1.0E+02
0.1 1 10 100周波数[Hz]
フーリエスペクトル[gal*sec]
従来型
半導体
GX 変心マス(φ1mm)
Gx
Gy
歪みゲージ
偏心マス(φ1mm)
GX 変心マス(φ1mm)
Gx
Gy
歪みゲージ
偏心マス(φ1mm)
•Performance– semiconductor acceleration sensor – Resolution 1Gal– 16bit AD conversion
•Output– Maximum acceleration– Spectrum intensity– Seismic intensity– Wave form(160s×10)
•Interface– RS232C
Ibaragiken-Nanbu Earthq. (M5.1, 13,March,2003)Maximum acceleration 30gal
Strain gauge
Mass
Blue Line : Semiconductor sensorBlack Line: Servo sensor
Fou
rier
Spe
ctru
m A
mp
litud
e (G
al S
ec)
Frequency (Hz)
Figure 10 Overview of inexpensive seismometer, Comparison of recorded Fourier spectra from standard servo-type seismometer and new inexpensive seismometer
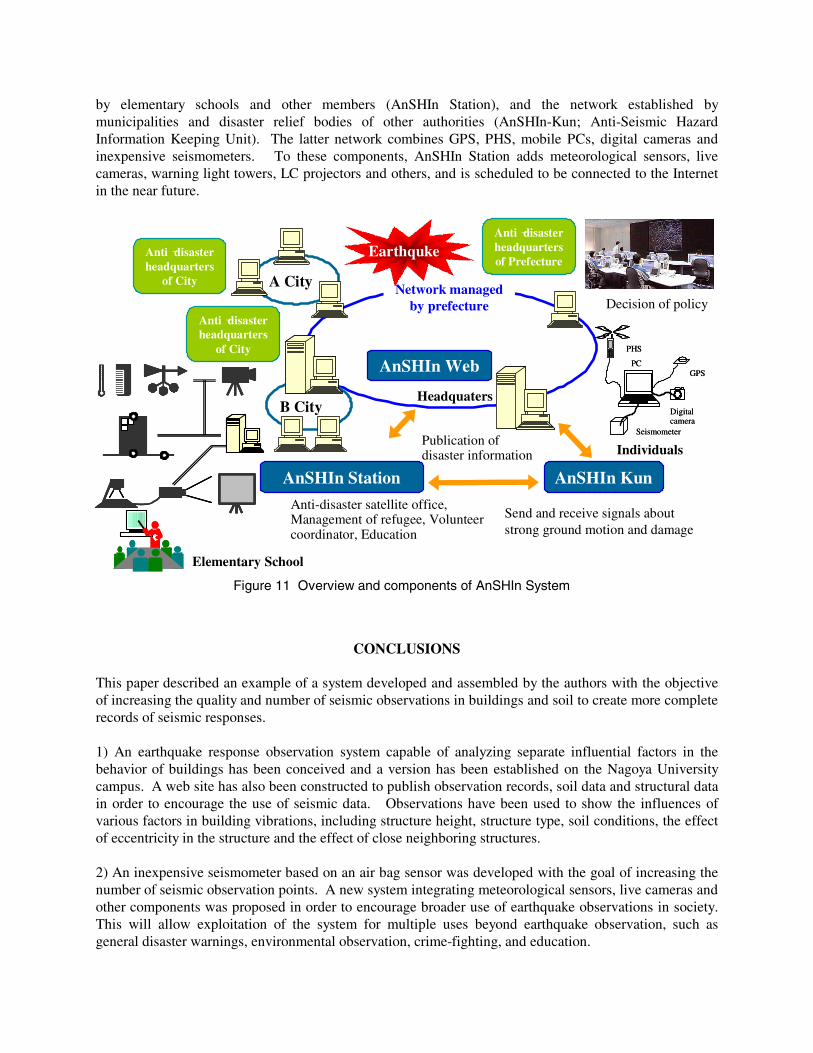
by elementary schools and other members (AnSHIn Station), and the network established by municipalities and disaster relief bodies of other authorities (AnSHIn-Kun; Anti-Seismic Hazard Information Keeping Unit). The latter network combines GPS, PHS, mobile PCs, digital cameras and inexpensive seismometers. To these components, AnSHIn Station adds meteorological sensors, live cameras, warning light towers, LC projectors and others, and is scheduled to be connected to the Internet in the near future.
CONCLUSIONS
This paper described an example of a system developed and assembled by the authors with the objective of increasing the quality and number of seismic observations in buildings and soil to create more complete records of seismic responses. 1) An earthquake response observation system capable of analyzing separate influential factors in the behavior of buildings has been conceived and a version has been established on the Nagoya University campus. A web site has also been constructed to publish observation records, soil data and structural data in order to encourage the use of seismic data. Observations have been used to show the influences of various factors in building vibrations, including structure height, structure type, soil conditions, the effect of eccentricity in the structure and the effect of close neighboring structures. 2) An inexpensive seismometer based on an air bag sensor was developed with the goal of increasing the number of seismic observation points. A new system integrating meteorological sensors, live cameras and other components was proposed in order to encourage broader use of earthquake observations in society. This will allow exploitation of the system for multiple uses beyond earthquake observation, such as general disaster warnings, environmental observation, crime-fighting, and education.
Figure 11 Overview and components of AnSHIn System
A City Network managed by prefecture
B City
AnSHIn Web
AnSHIn Station
Anti-disaster satellite office, Management of refugee, Volunteer coordinator, Education
Publication of disaster information
Decision of policy
Individuals
AnSHIn Kun
Send and receive signals about strong ground motion and damage
Earthquke
Seismometer
Digital camera
GPSPC
PHS
Seismometer
Digital camera
GPSPC
PHS
Anti‐disaster headquarters
of City
Anti‐disaster headquarters
of City
Elementary School
Headquaters
Anti‐disaster headquarters of Prefecture

REFERENCES 1. Fukuwa N., Ghannad M. A., Tobita J. and Nishizaka R.”Analytical AND Experimental Studies on the
Effect of Soil-Structure Interaction on Damping, Natural Frequency and Effective Input Motion of Buildings,” 1st US-Japan Soil Structure Interaction Workshop, Menlo Park, CA 1998: Paper No.14
2. Fukuwa N. and Tobita J. “SSI Effect on Dynamic Characteristics of Low & Medium Rise Buildings Based on Simplified Analysis and Observation,” 2nd US-Japan Soil Structure Interaction Workshop, Tsukuba 2001
3. Tobita J. and Fukuwa N.”Anshin-System :Intercommunication System for Earthquake Hazard and Disaster Information,” The 2002 Japan-Taiwan Joint Seminar on Earthquake Mechanisms and Hazards, Nagoya 2002: pp.66-67
4. Fukuwa N., Tobita J., Takai H. and Ishida E. “Effective Application of Geographic Information Ssystem in the Field of Earthquake Engineering and Disaster Prevention,” 12th World Conference on Earthquake Engineering 2000: Paper No.2229
RELATED WEB PAGES
1. http://www.sharaku.nuac.nagoya-u.ac.jp/%7Esmsr/higashi/index.htm 2. http://133.6.193.81/earthquake/main.asp?MENUID=3&TIMESPAN=0 3. http://133.6.193.81/weather/