Embed Size (px)
Citation preview

PROPOSED SERVICE STATION REDEVELOPMENT
CUNNINGHAM HIGHWAY, COOLMUNDA QLD 4387
TRAFFIC IMPACT STATEMENT
2 JUNE 2016
PREPARED FOR
TFA PROJECT GROUP ON BEHALF OF ADDS (NSW) PTY LTD
DOCUMENT CONTROL RECORD
DOCUMENT
Report Title: Service Station - Cunningham Highway, Coolmunda Traffic Impact Statement
Client: ADDS (NSW) Pty ltd
Project Number: 16-270
REV PURPOSE DATE AUTHOR REVIEWER APPROVED SIGNED
A FINAL JUN-16 CMB AAP
AAP
(RPEQ 5286)
COPYRIGHT
This work is copyright. Apart from any use permitted under the Copyright Act 1968, no part may
be produced without prior permission. Requests and inquiries concerning reproduction and rights
should be directed to:
The Director
Pekol Traffic and Transport
GD02, 67 St Pauls Terrace
Spring Hill QLD 4000
DISCLAIMER
This document is produced solely for the benefit of and use by our client in accordance with the
terms and conditions of our appointment. PTT does not accept liability to third parties arising from
their use of or reliance upon the contents of this report.
TABLE OF CONTENTS
1.0 INTRODUCTION 1
1.1 Background 1
1.2 Aim 1
1.3 Scope of Report 1
2.0 EXISTING CONDITIONS 2
2.1 Subject Site 2
2.2 Existing Use 2
2.3 Access 3
2.4 Road Network 3
2.5 Traffic Volumes 3
2.6 Sight Distance 3
3.0 PROPOSED DEVELOPMENT 5
3.1 Site Layout 5
3.2 Vehicular Access Arrangements 6
3.3 Queuing 6
3.4 Car / Truck Parking 7
3.5 Servicing 8
4.0 TRAFFIC OPERATIONS 11
4.1 Traffic Generation 11
4.2 Site Access Turn Warrants 11
4.3 Traffic Impact 12
5.0 CONCLUSIONS 13
APPENDIX A: DEVELOPMENT SITE LAYOUT
APPENDIX B: VEHICLE SWEPT PATHS
APPENDIX C: SDAP CODES MODULES 19.1
APPENDIX D: AADT DATA
1.0 INTRODUCTION
1.1 Background
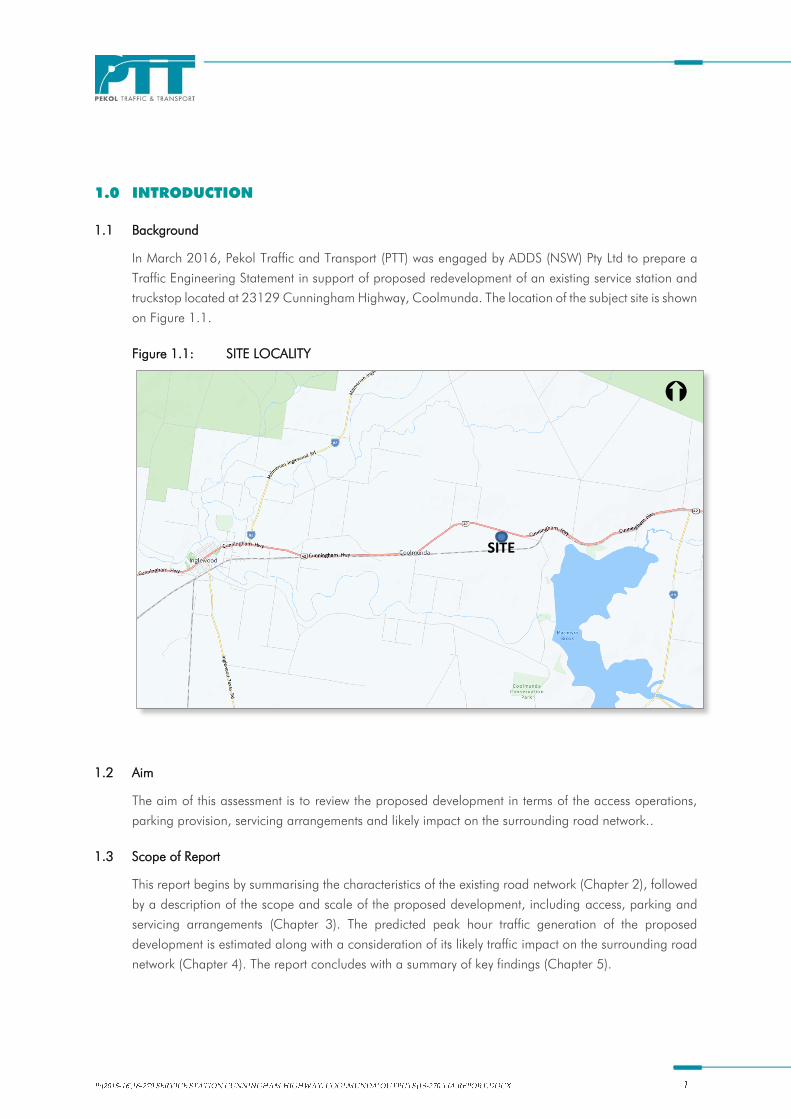
In March 2016, Pekol Traffic and Transport (PTT) was engaged by ADDS (NSW) Pty Ltd to prepare a
Traffic Engineering Statement in support of proposed redevelopment of an existing service station and
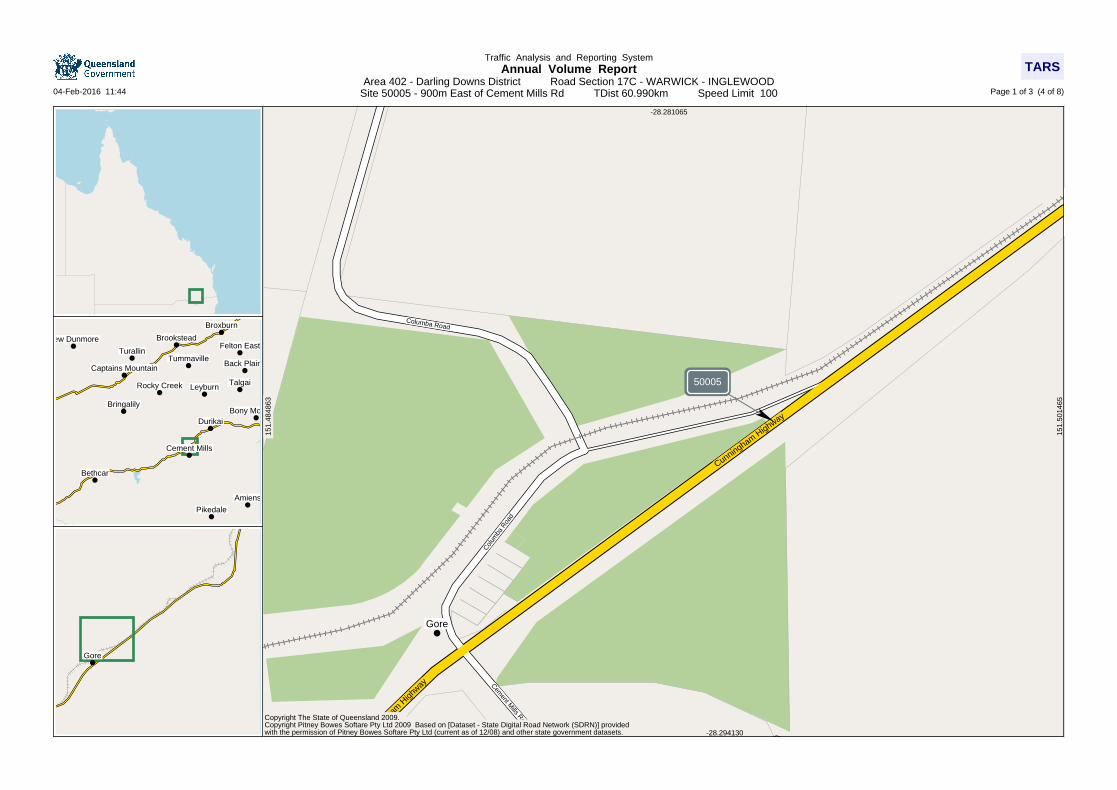
truckstop located at 23129 Cunningham Highway, Coolmunda. The location of the subject site is shown
on Figure 1.1.
Figure 1.1: SITE LOCALITY
1.2 Aim
The aim of this assessment is to review the proposed development in terms of the access operations,
parking provision, servicing arrangements and likely impact on the surrounding road network..
1.3 Scope of Report
This report begins by summarising the characteristics of the existing road network (Chapter 2), followed
by a description of the scope and scale of the proposed development, including access, parking and
servicing arrangements (Chapter 3). The predicted peak hour traffic generation of the proposed
development is estimated along with a consideration of its likely traffic impact on the surrounding road
network (Chapter 4). The report concludes with a summary of key findings (Chapter 5).
SITE
2.0 EXISTING CONDITIONS
2.1 Subject Site
The subject site is located at 23129 Cunningham Highway, Coolmunda. The subject site is
approximately 400m west of the Coolmunda Dam Access Road and some 13km east of the town of
Inglewood. Falling within the jurisdiction of Goondiwindi Regional Council, the subject site is identified
as Lot 1 on RP159143 and includes a total area of approximately 14,700m2.
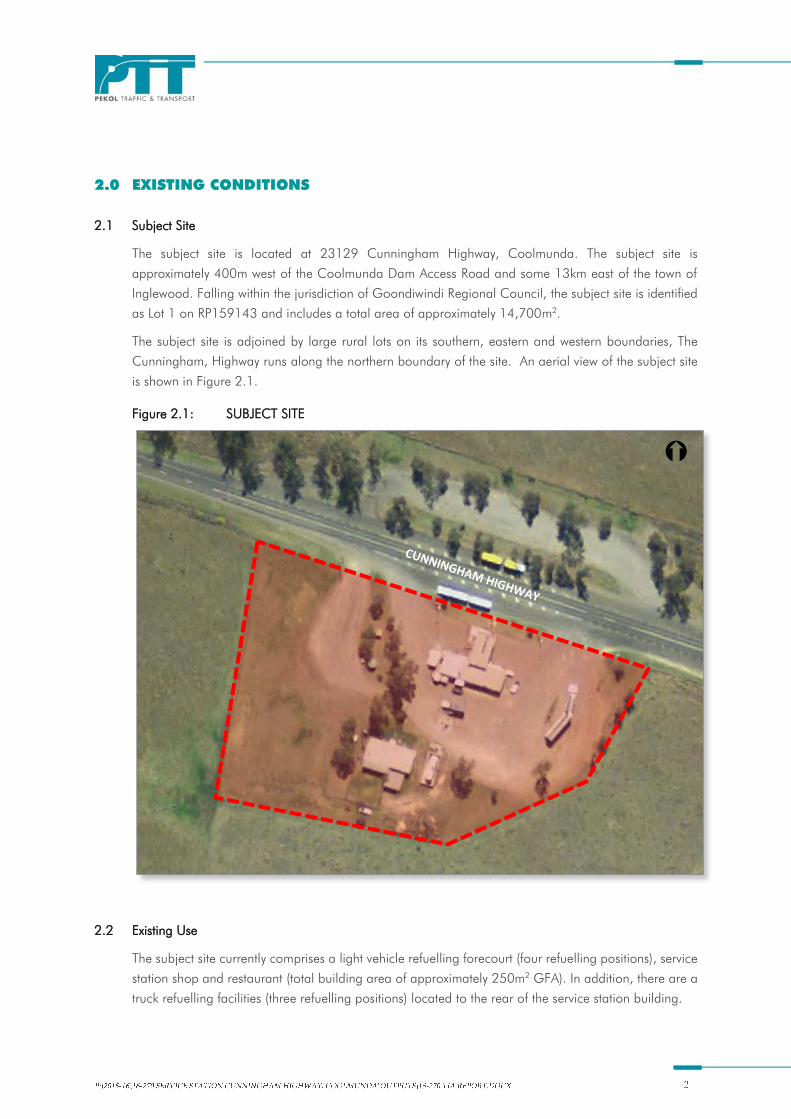
The subject site is adjoined by large rural lots on its southern, eastern and western boundaries, The
Cunningham, Highway runs along the northern boundary of the site. An aerial view of the subject site
is shown in Figure 2.1.
Figure 2.1: SUBJECT SITE
2.2 Existing Use
The subject site currently comprises a light vehicle refuelling forecourt (four refuelling positions), service
station shop and restaurant (total building area of approximately 250m2 GFA). In addition, there are a
truck refuelling facilities (three refuelling positions) located to the rear of the service station building.
There is informal on-site car and truck parking located to the south, east and west of the service station
building.
There is also an existing residential dwelling located at the rear of the site. This is used as
accommodation for staff operating the service station and truckstop.
2.3 Access
The subject site has three existing driveways on the Cunningham Highway as shown in Figure 2.1. None
of the driveways have formal line marking or signage and all currently accommodate both entry and
exit traffic movements.
The eastern access has a short auxiliary left turn AUL(S) treatment approximately 50m in length. The
AUL(S) treatment enables turning vehicles to undertake most deceleration in the turn lane, with minimal
impact on through traffic on the Cunningham Highway.
In terms of right turn treatments, the Cunningham Highway has wide shoulders with chevron markings
along the site frontage, which acts in a similar manner to a basic right turn (BAR) treatment. This would
allow a through vehicle to pass a vehicle waiting to turn right into the subject site. It is noted that truck
parking regularly takes place in the shoulders, as shown in Figure 2.1. However, even with a truck
parked in the shoulder, there should be sufficient width (ie around 6.5m) to allow a vehicle to pass
another vehicle waiting to turn right.
2.4 Road Network
The Cunningham Highway forms part of the state controlled road network is administered by the
Department of Transport and Main Roads (DTMR). It is an important trade and freight route to and from
Brisbane and therefore carries a large proportion of heavy vehicle traffic, including b-doubles and
occasional road trains.
In the vicinity of the subject site, it has a single lane of traffic in each direction. The speed limit on the
Cunningham Highway adjacent to the site is 100km/hr.
2.5 Traffic Volumes
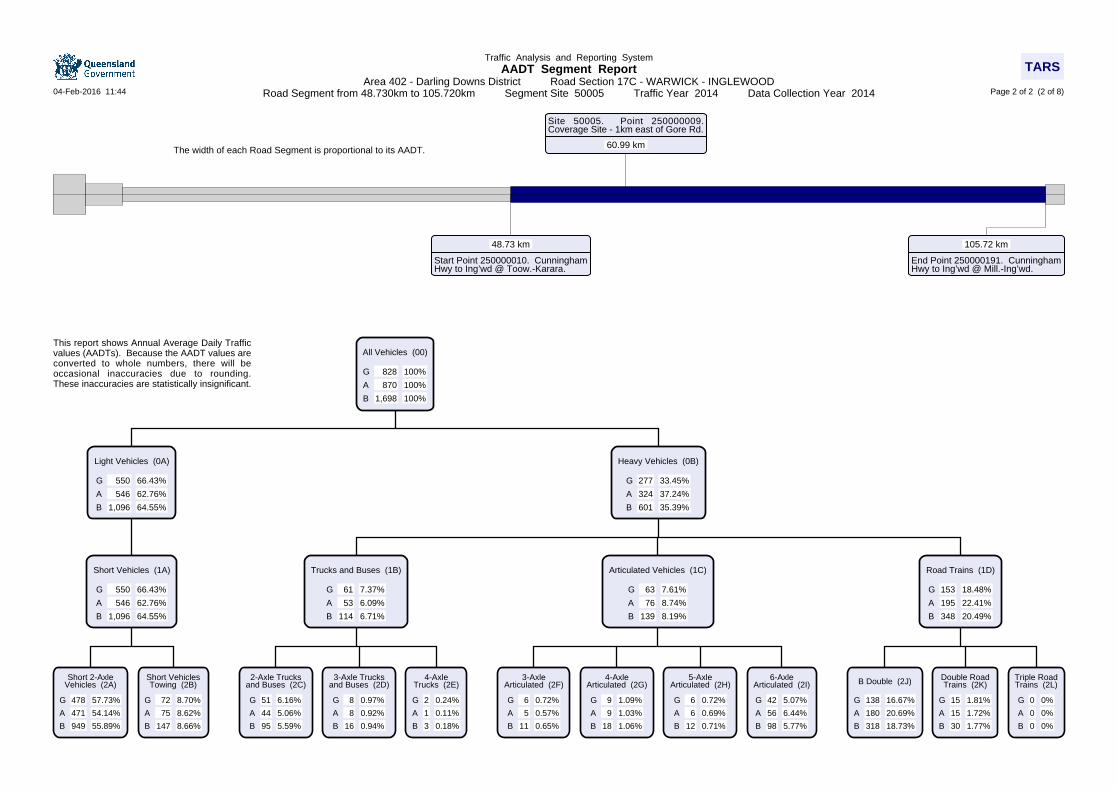
We have obtained 2014 average annual daily traffic (AADT) data from the Department of Transport
and Main Roads (DTMR) for the Cunningham Highway from a nearby counter site (identification number
50005). This counter site is located approximately 35km to the east of the subject site. The data shows
that the 2014 AADT volumes on this section of the Cunningham Highway were as follows:
870 vehicles per day (vpd) travelling in the eastbound direction (with 37% heavy vehicles)
830 vpd travelling in the westbound direction (with 33% heavy vehicles)
1,700 vpd two-way (with 35% heavy vehicles)
2.6 Sight Distance
The available sight distance at the site access driveways is very good due to the straight alignment of
the highway and flat topography at this location. We estimate that there is in excess of 300m safe
intersection sight distance (SISD) available in both directions, as demonstrated in Figure 2.2.
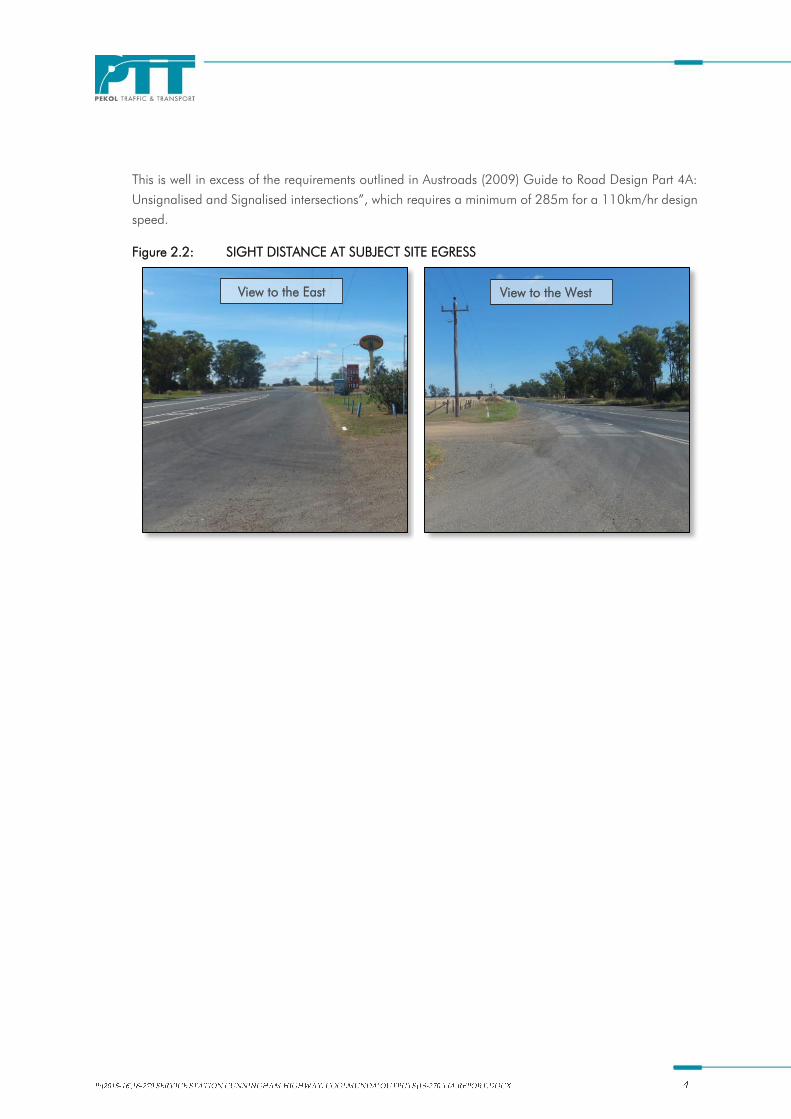
This is well in excess of the requirements outlined in Austroads (2009) Guide to Road Design Part 4A:
Unsignalised and Signalised intersections”, which requires a minimum of 285m for a 110km/hr design
speed.
Figure 2.2: SIGHT DISTANCE AT SUBJECT SITE EGRESS
View to the East View to the West
3.0 PROPOSED DEVELOPMENT
3.1 Site Layout
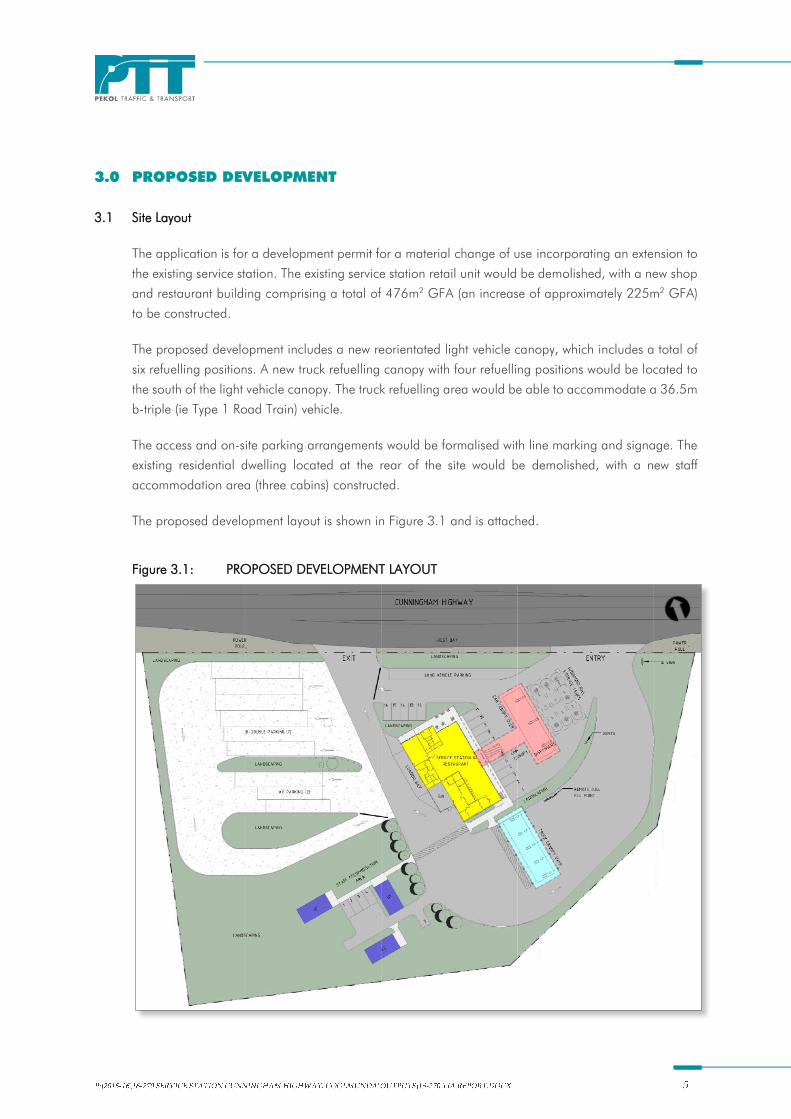
The application is for a development permit for a material change of use incorporating an extension to
the existing service station. The existing service station retail unit would be demolished, with a new shop
and restaurant building comprising a total of 476m2 GFA (an increase of approximately 225m
2 GFA)
to be constructed.
The proposed development includes a new reorientated light vehicle canopy, which includes a total of
six refuelling positions. A new truck refuelling canopy with four refuelling positions would be located to
the south of the light vehicle canopy. The truck refuelling area would be able to accommodate a 36.5m
b-triple (ie Type 1 Road Train) vehicle.
The access and on-site parking arrangements would be formalised with line marking and signage. The
existing residential dwelling located at the rear of the site would be demolished, with a new staff
accommodation area (three cabins) constructed.
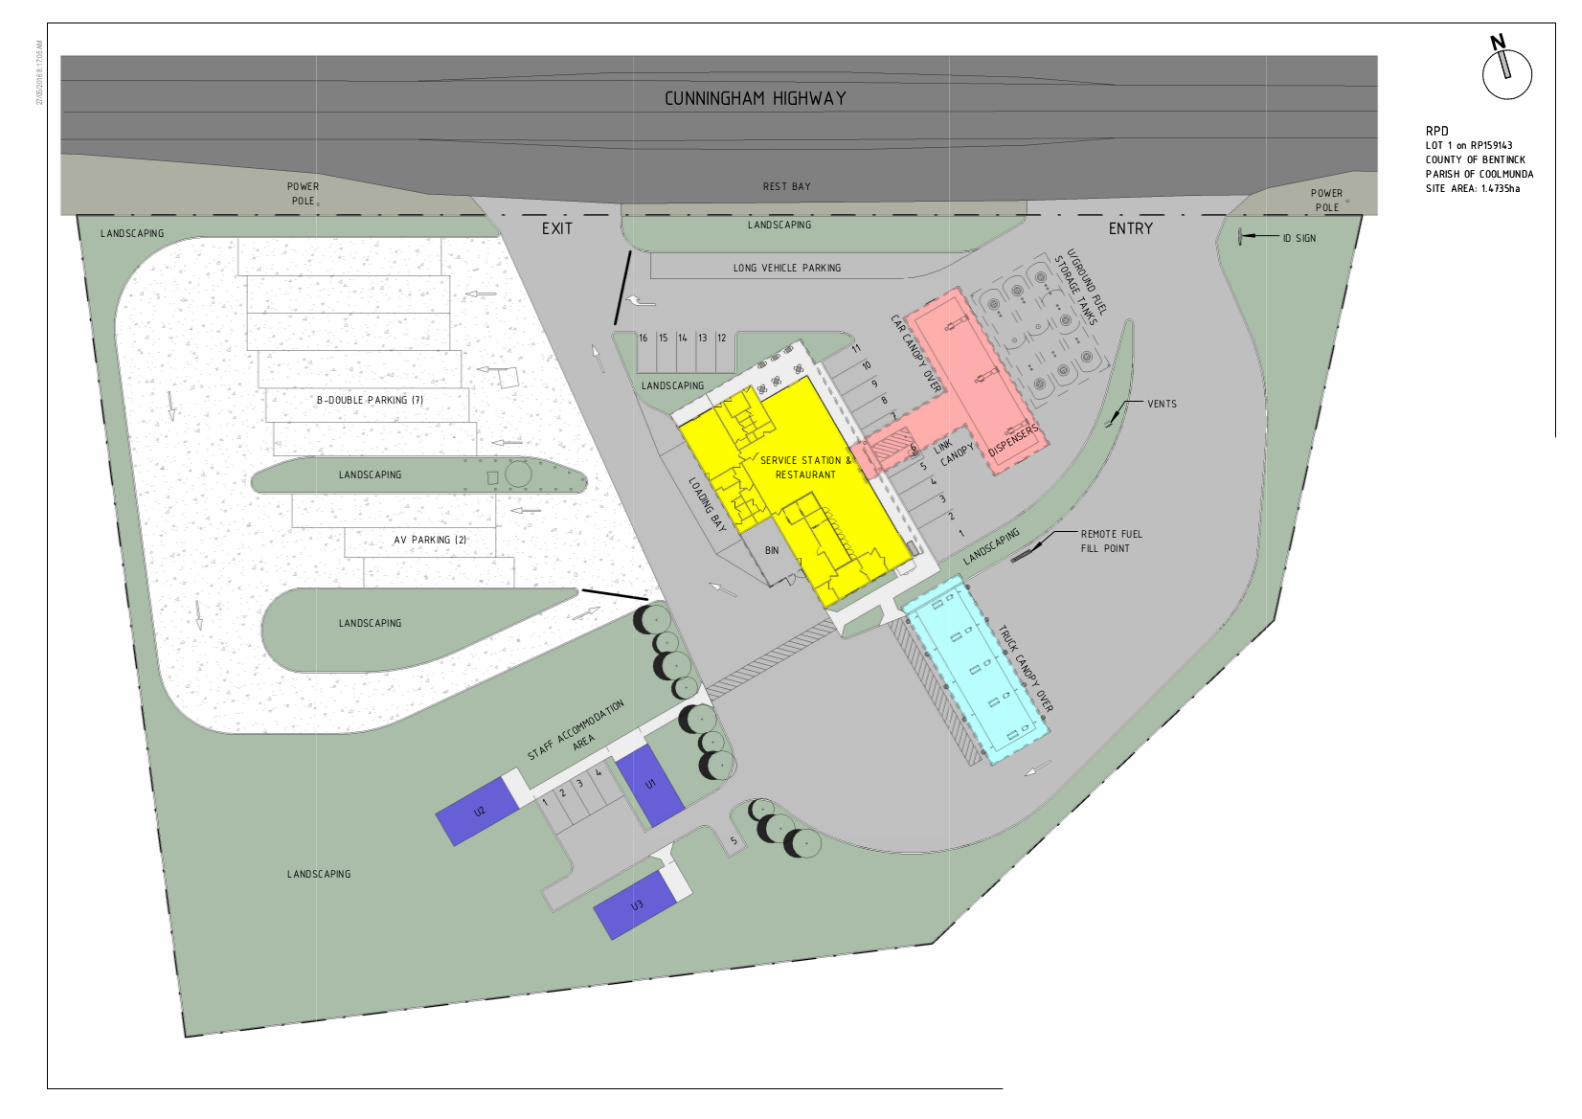
The proposed development layout is shown in Figure 3.1 and is attached.
Figure 3.1: PROPOSED DEVELOPMENT LAYOUT
3.2 Vehicular Access Arrangements
As shown in Figure 3.1, it is proposed to utilise the existing two eastern most accesses on the
Cunningham Highway to provide separate entry and exit driveways. The existing western most driveway
would be removed, which provides a safety benefit in turns of rationalising the number of access points
and reducing potential conflict points.
The proposed entry driveway on the Cunningham Highway is approximately 25m wide at the property
boundary, which is sufficient to enable b-triple vehicles to safely undertake turn movements into the site.
The entry driveway has a formal AUL(S), which would enable turning vehicles to undertake all
deceleration in the turn lane with minimal impact on through moving vehicles on the Cunningham
Highway.
The BAR type treatment on the Cunningham Highway would allow a through vehicle to pass a vehicle
waiting to right into the subject site. The formalised on-site truck parking provision associated with the
proposed development (see below) is expected to reduce parking in the shoulders on the Cunningham
Highway and improve the operation of the right turn facility.
Based on the traffic generated by the development and the passing volumes on the Cunningham
Highway, the existing turn treatments at the subject site access are appropriate (as demonstrated in
Section 4.2 below).
The exit driveway is approximately 18m wide at the property boundary, which is also sufficient to enable
the largest vehicles to safely turn out of the site. The exit driveway crossover achieves more than 300m
sight distance in both directions, which is well in excess of the minimum requirements set out in Austroads
and the DTMR Road Planning and Design Manual.
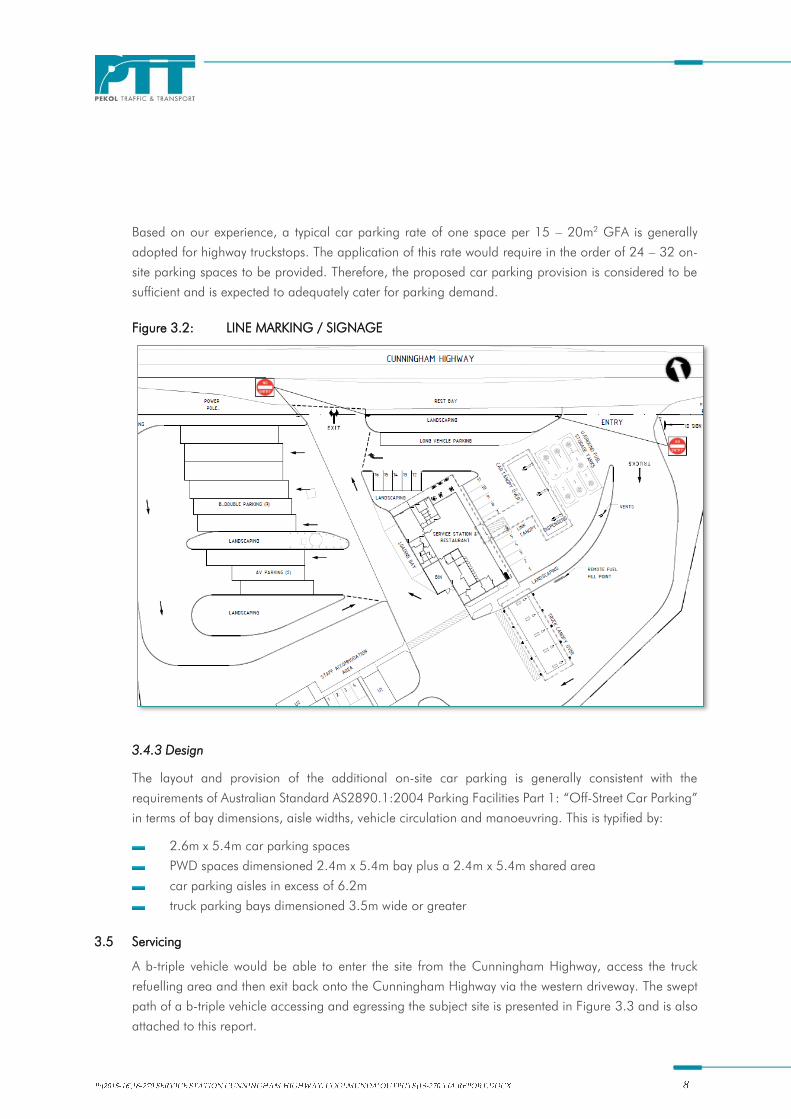
It is recommended that signage / line-marking (ie pavement arrows) be installed at the entry and exit
driveways on the Cunningham Highway in accordance with the Manual of Uniform Traffic Control
Devices. These recommendations are summarised in Figure 3.2.
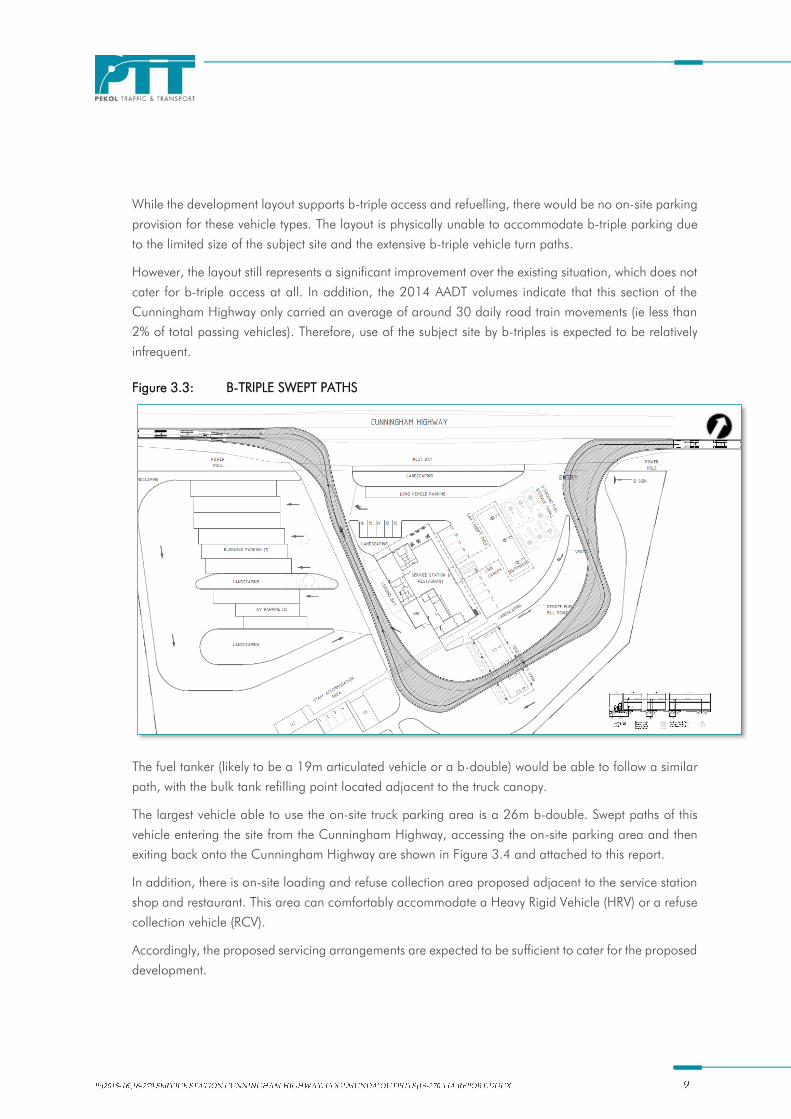
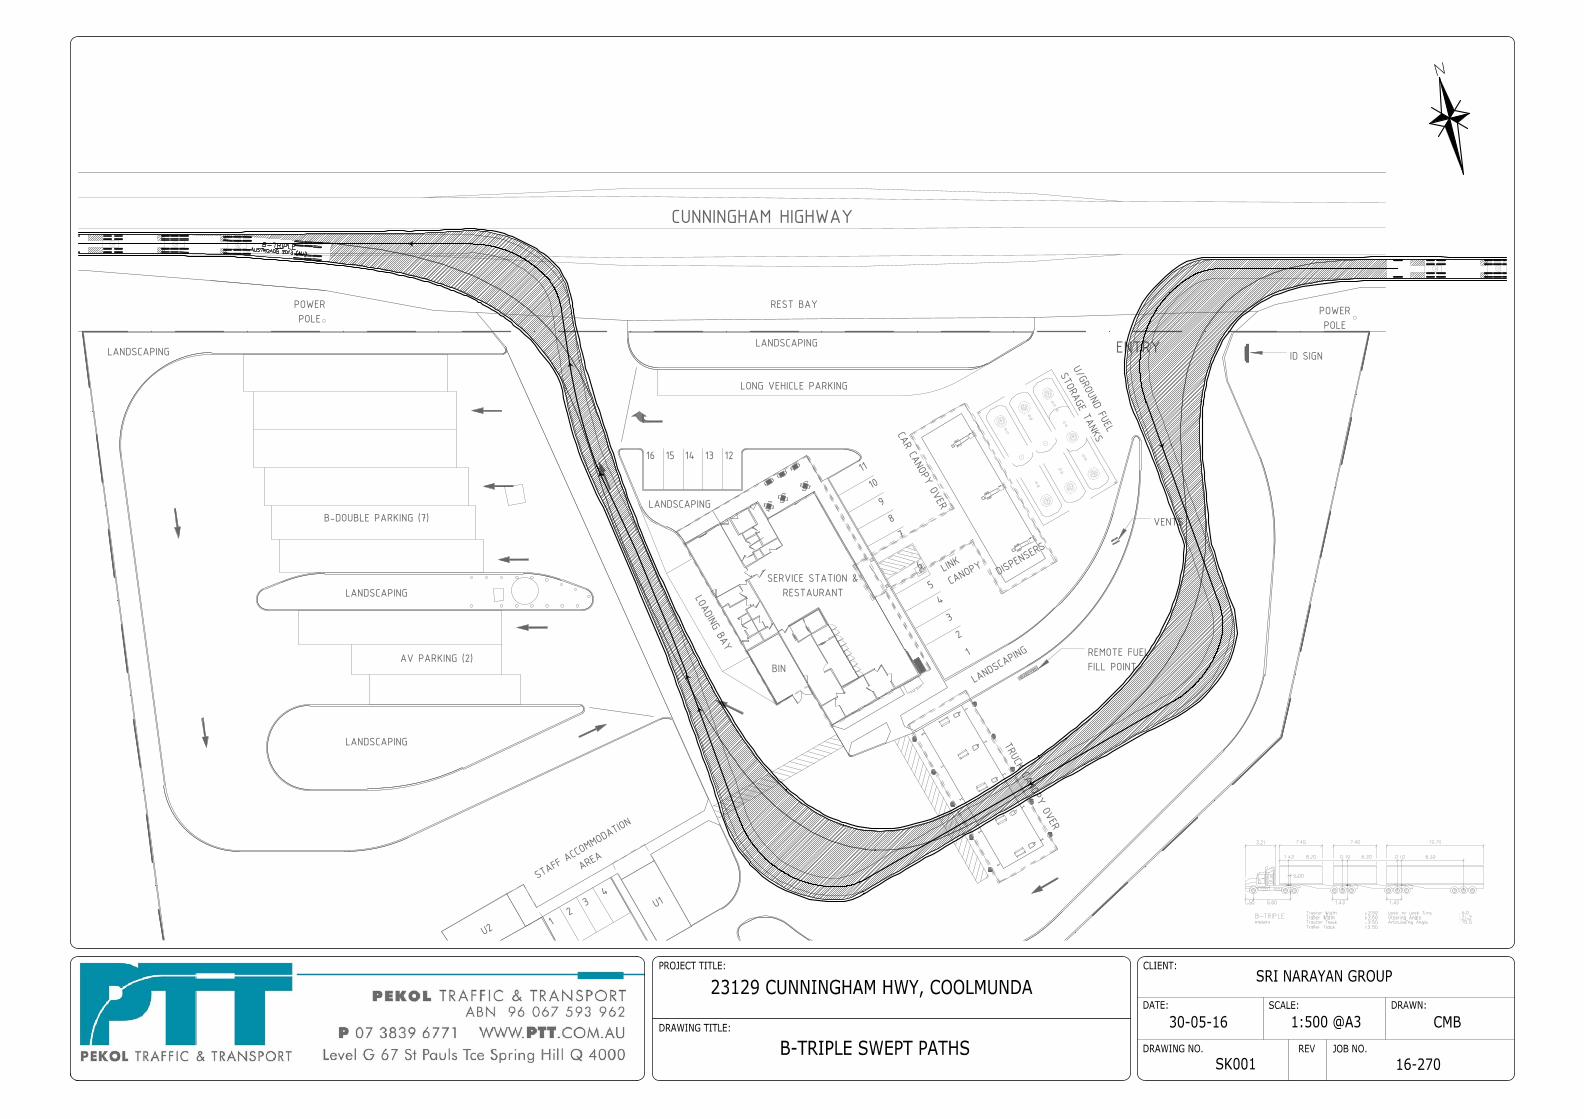
Vehicle swept paths for a b-triple entering and exiting the proposed development are shown in Figure
3.3 and attached.
Based on the above, the proposed access arrangements associated with the development are not
expected to adversely impact the safety, function and operational efficiency of the state controlled road.
In fact, the proposed access represents a significant improvement over the existing arrangements in
terms of greater formalisation of permitted turn movements and fewer potential conflicts.
3.3 Queuing
The proposed development layout provides adequate provision for queuing vehicles between the site
access and both the light vehicle and truck refuelling canopies. Therefore, the proposed development
would not result in any queuing back on to the Cunningham Highway.
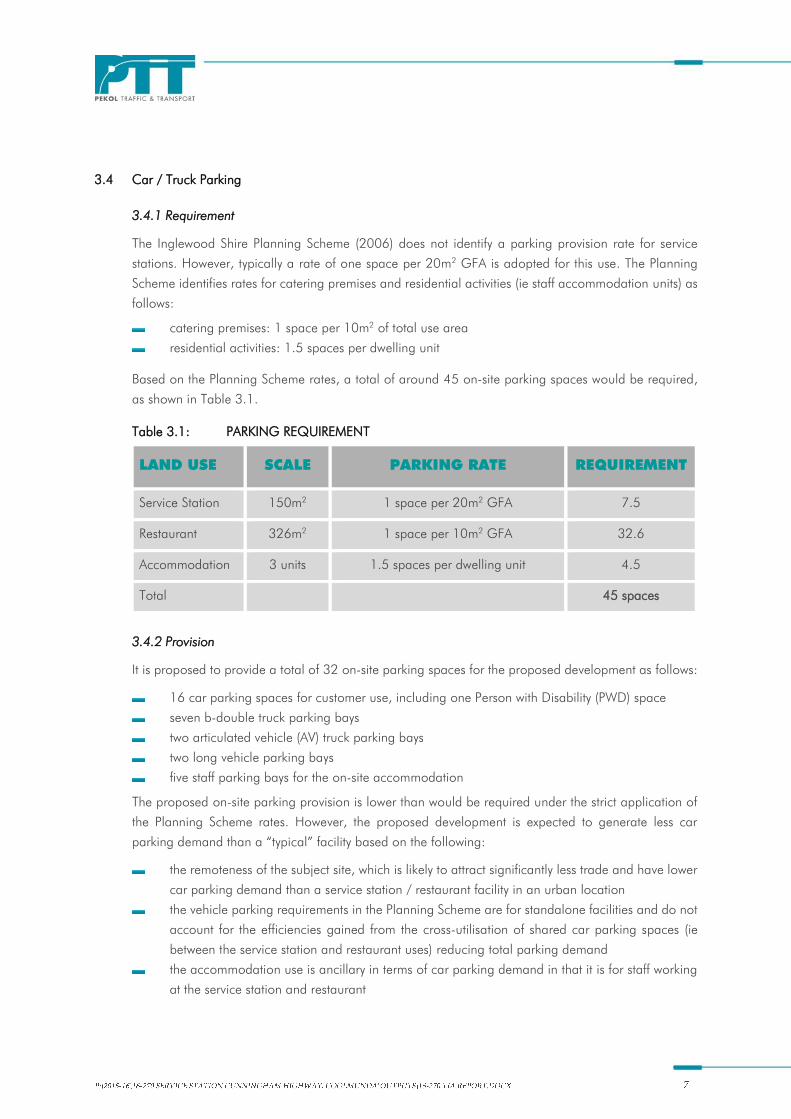
3.4 Car / Truck Parking
3.4.1 Requirement
The Inglewood Shire Planning Scheme (2006) does not identify a parking provision rate for service
stations. However, typically a rate of one space per 20m2 GFA is adopted for this use. The Planning
Scheme identifies rates for catering premises and residential activities (ie staff accommodation units) as
follows:
catering premises: 1 space per 10m2 of total use area
residential activities: 1.5 spaces per dwelling unit
Based on the Planning Scheme rates, a total of around 45 on-site parking spaces would be required,
as shown in Table 3.1.
Table 3.1: PARKING REQUIREMENT
LAND USE SCALE PARKING RATE REQUIREMENT
Service Station 150m2 1 space per 20m
2 GFA 7.5
Restaurant 326m2
1 space per 10m2 GFA 32.6
Accommodation 3 units 1.5 spaces per dwelling unit 4.5
Total 45 spaces
3.4.2 Provision
It is proposed to provide a total of 32 on-site parking spaces for the proposed development as follows:
16 car parking spaces for customer use, including one Person with Disability (PWD) space
seven b-double truck parking bays
two articulated vehicle (AV) truck parking bays
two long vehicle parking bays
five staff parking bays for the on-site accommodation
The proposed on-site parking provision is lower than would be required under the strict application of
the Planning Scheme rates. However, the proposed development is expected to generate less car
parking demand than a “typical” facility based on the following:
the remoteness of the subject site, which is likely to attract significantly less trade and have lower
car parking demand than a service station / restaurant facility in an urban location
the vehicle parking requirements in the Planning Scheme are for standalone facilities and do not
account for the efficiencies gained from the cross-utilisation of shared car parking spaces (ie
between the service station and restaurant uses) reducing total parking demand
the accommodation use is ancillary in terms of car parking demand in that it is for staff working
at the service station and restaurant
Based on our experience, a typical car parking rate of one space per 15 – 20m2 GFA is generally
adopted for highway truckstops. The application of this rate would require in the order of 24 – 32 on-
site parking spaces to be provided. Therefore, the proposed car parking provision is considered to be
sufficient and is expected to adequately cater for parking demand.
Figure 3.2: LINE MARKING / SIGNAGE
3.4.3 Design
The layout and provision of the additional on-site car parking is generally consistent with the
requirements of Australian Standard AS2890.1:2004 Parking Facilities Part 1: “Off-Street Car Parking”
in terms of bay dimensions, aisle widths, vehicle circulation and manoeuvring. This is typified by:
2.6m x 5.4m car parking spaces
PWD spaces dimensioned 2.4m x 5.4m bay plus a 2.4m x 5.4m shared area
car parking aisles in excess of 6.2m
truck parking bays dimensioned 3.5m wide or greater
3.5 Servicing
A b-triple vehicle would be able to enter the site from the Cunningham Highway, access the truck
refuelling area and then exit back onto the Cunningham Highway via the western driveway. The swept
path of a b-triple vehicle accessing and egressing the subject site is presented in Figure 3.3 and is also
attached to this report.
While the development layout supports b-triple access and refuelling, there would be no on-site parking
provision for these vehicle types. The layout is physically unable to accommodate b-triple parking due
to the limited size of the subject site and the extensive b-triple vehicle turn paths.
However, the layout still represents a significant improvement over the existing situation, which does not
cater for b-triple access at all. In addition, the 2014 AADT volumes indicate that this section of the
Cunningham Highway only carried an average of around 30 daily road train movements (ie less than
2% of total passing vehicles). Therefore, use of the subject site by b-triples is expected to be relatively
infrequent.
Figure 3.3: B-TRIPLE SWEPT PATHS
The fuel tanker (likely to be a 19m articulated vehicle or a b-double) would be able to follow a similar
path, with the bulk tank refilling point located adjacent to the truck canopy.
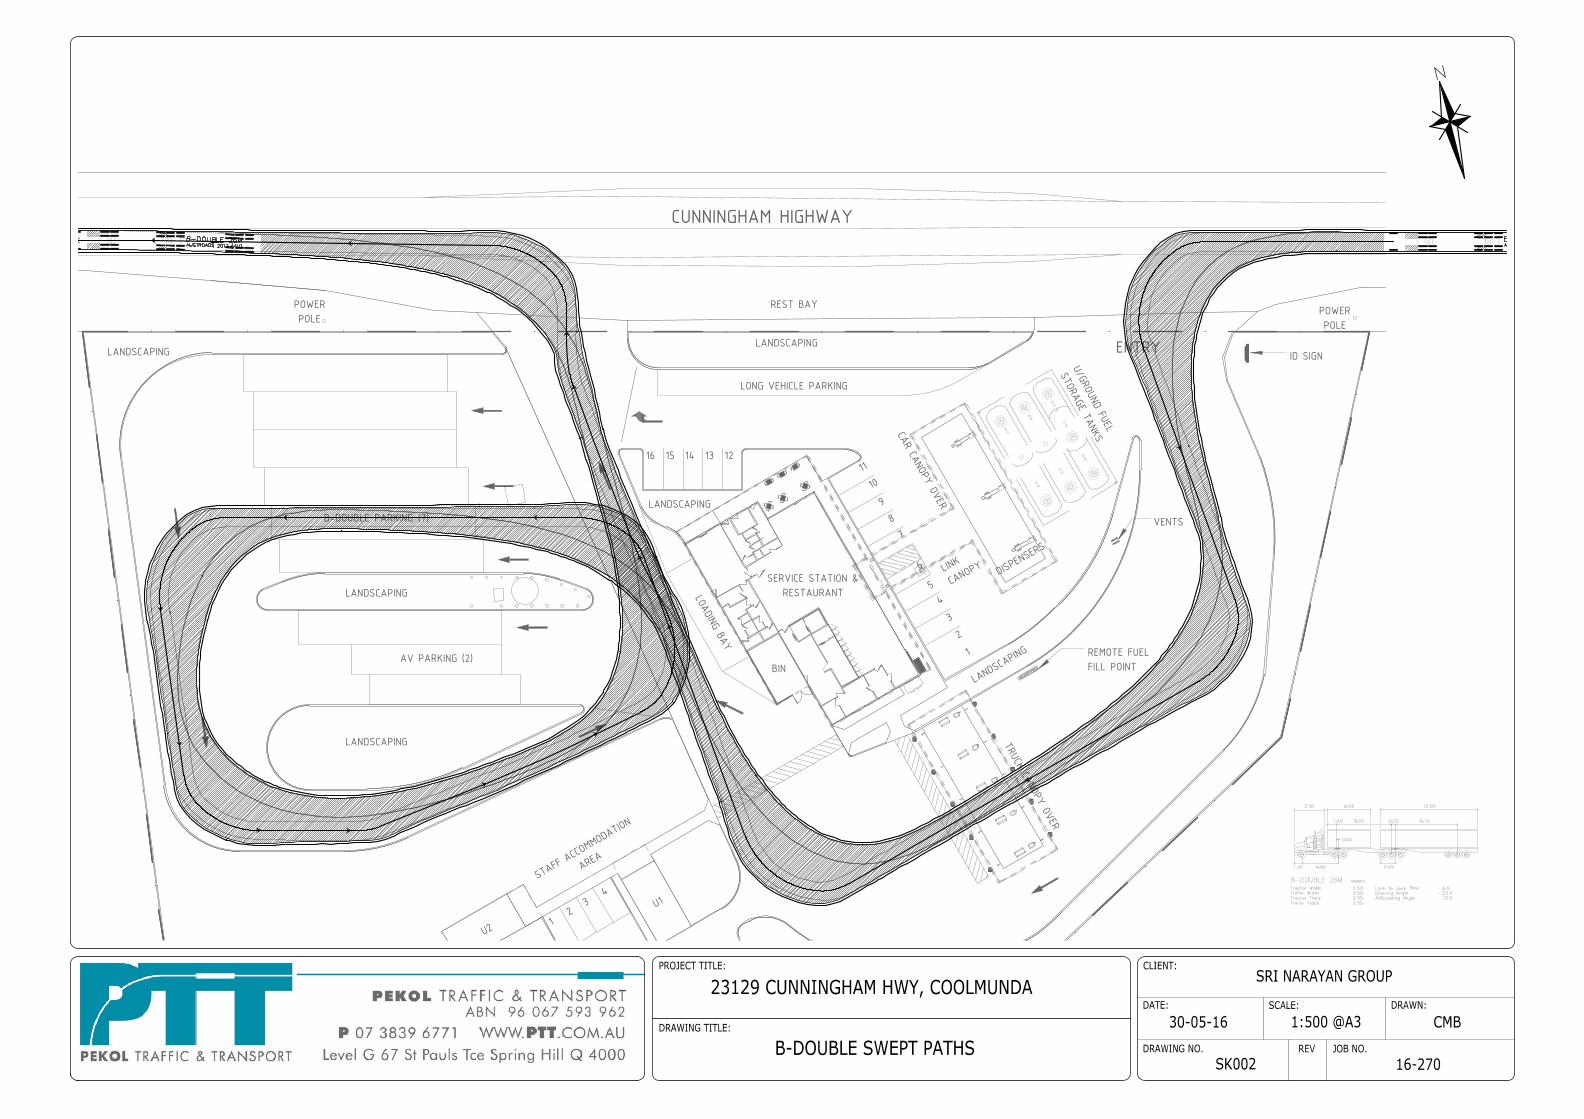
The largest vehicle able to use the on-site truck parking area is a 26m b-double. Swept paths of this
vehicle entering the site from the Cunningham Highway, accessing the on-site parking area and then
exiting back onto the Cunningham Highway are shown in Figure 3.4 and attached to this report.
In addition, there is on-site loading and refuse collection area proposed adjacent to the service station
shop and restaurant. This area can comfortably accommodate a Heavy Rigid Vehicle (HRV) or a refuse
collection vehicle (RCV).
Accordingly, the proposed servicing arrangements are expected to be sufficient to cater for the proposed
development.
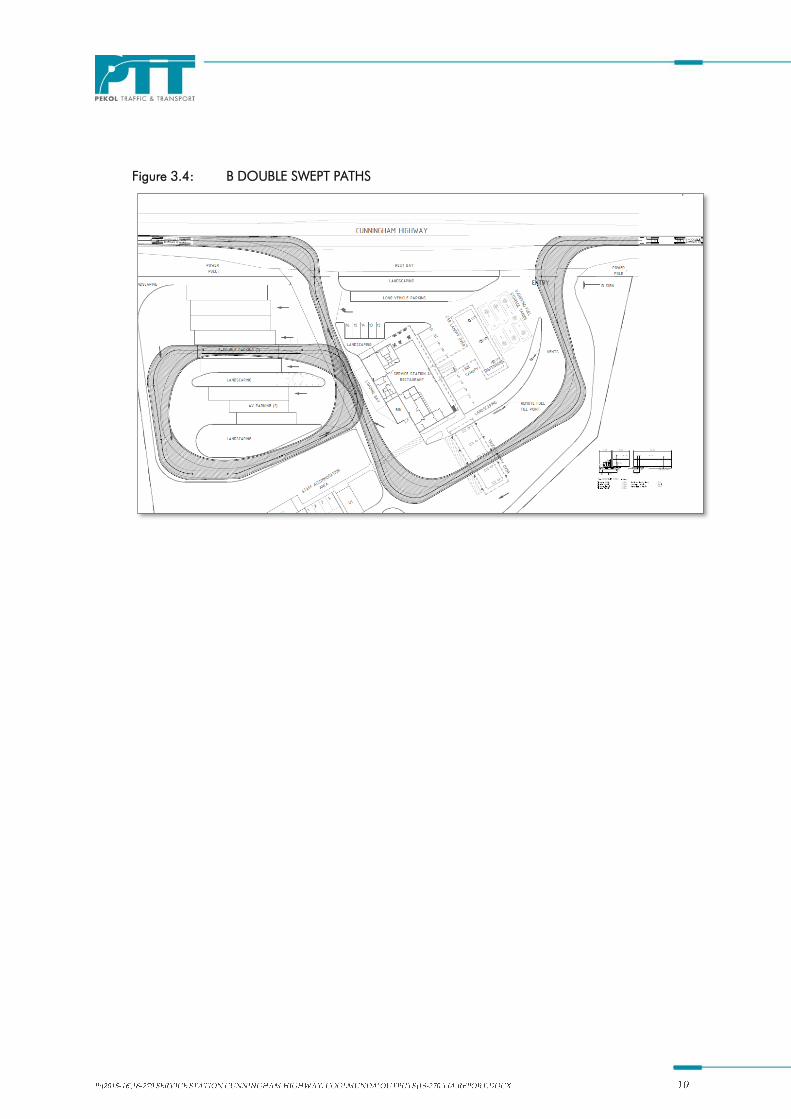
Figure 3.4: B DOUBLE SWEPT PATHS
4.0 TRAFFIC OPERATIONS
4.1 Traffic Generation
The DTMR Road Planning and Design Manual and RTA Guide to Traffic Generating Development
provide traffic generation rates for service stations (with a convenience store) in urban locations. There
are no corresponding rates for service stations / service centres / truck-stops located on major rural
highways. These facilities experience significantly different traffic generation rates and patterns to those
in urban areas.
We have previously undertaken traffic surveys of service centres (including service station and
convenience food offerings) on major state-controlled roads. These surveys found that during the typical
morning and evening peak hours, the volume of vehicles entering from the highway is typically around
10% of the (one-way) passing traffic volumes.
To be conservative, we have adopted a traffic generation rate of 20% of the passing (two-way) highway
traffic. A higher generation rate is considered appropriate in this instance give the remoteness of the
subject site and the lack of competing facilities.
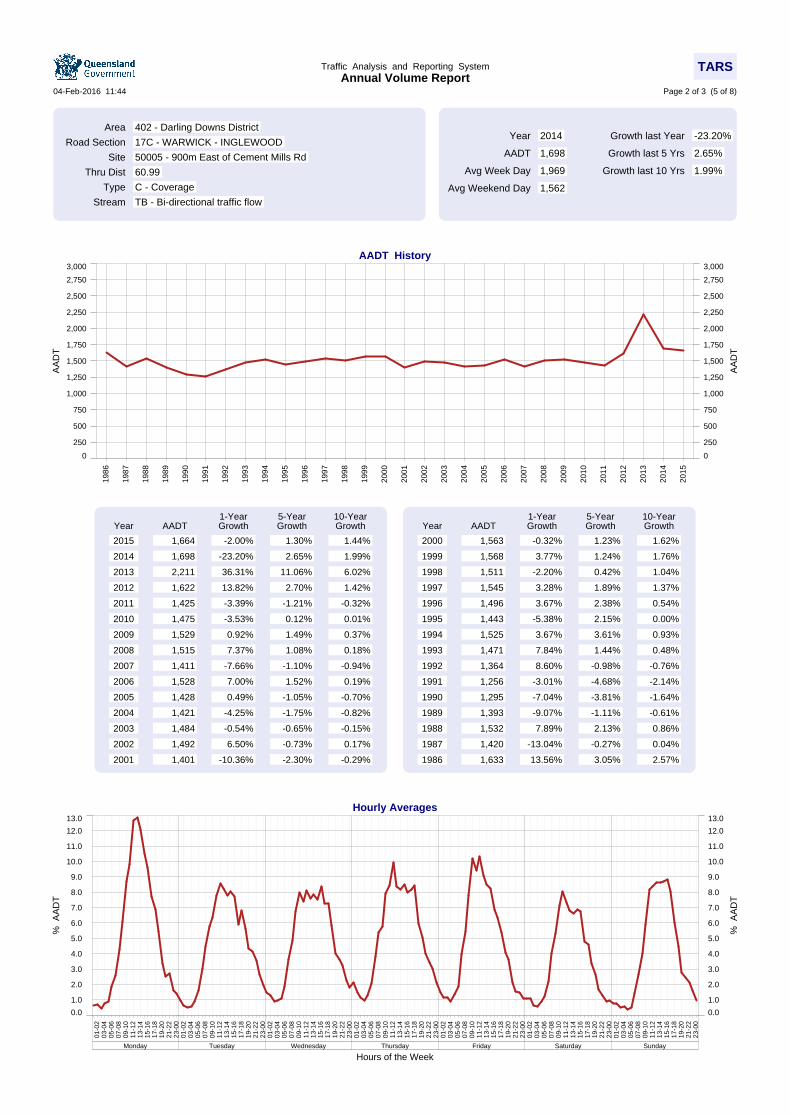
We have estimated the peak hour volumes on the Cunningham Highway by applying a 10% peak hour
factor to the AADT flow. This is consistent with the peak hourly averages contained in the attached
DTMR AADT data report for this section of the Cunningham Highway.
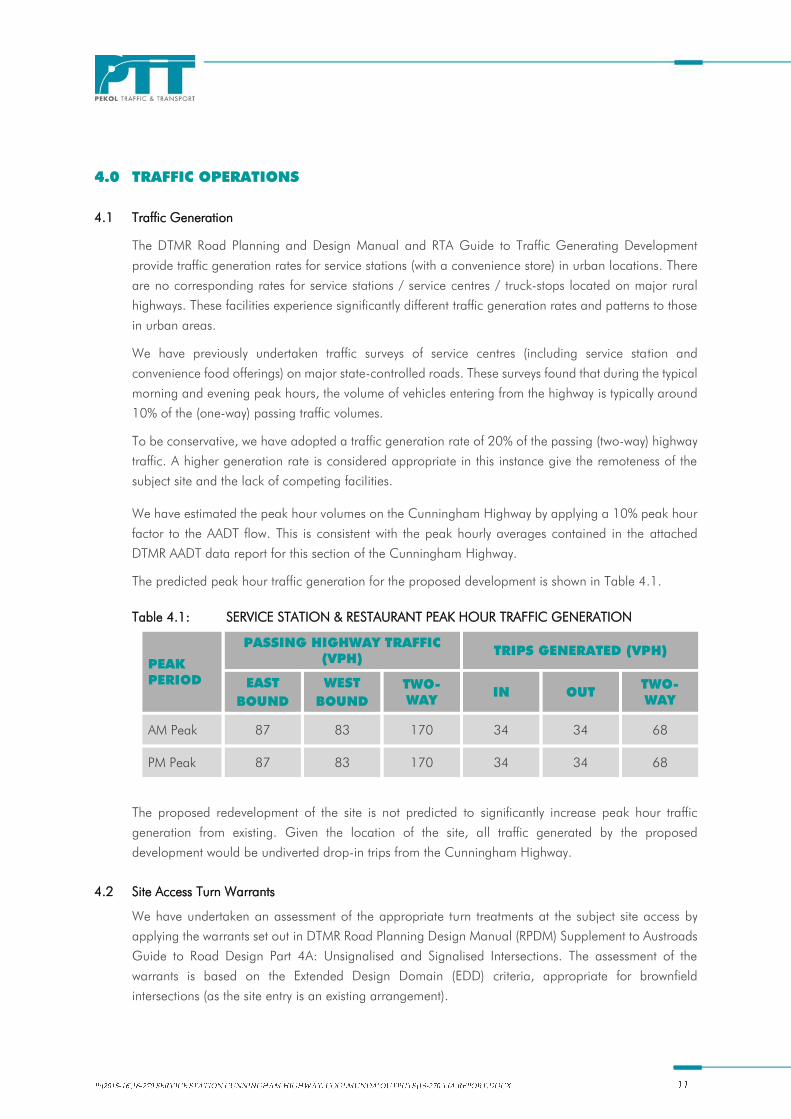
The predicted peak hour traffic generation for the proposed development is shown in Table 4.1.
Table 4.1: SERVICE STATION & RESTAURANT PEAK HOUR TRAFFIC GENERATION
PEAK
PERIOD
PASSING HIGHWAY TRAFFIC
(VPH) TRIPS GENERATED (VPH)
EAST
BOUND
WEST
BOUND
TWO-
WAY IN OUT
TWO-
WAY
AM Peak 87 83 170 34 34 68
PM Peak 87 83 170 34 34 68
The proposed redevelopment of the site is not predicted to significantly increase peak hour traffic
generation from existing. Given the location of the site, all traffic generated by the proposed
development would be undiverted drop-in trips from the Cunningham Highway.
4.2 Site Access Turn Warrants
We have undertaken an assessment of the appropriate turn treatments at the subject site access by
applying the warrants set out in DTMR Road Planning Design Manual (RPDM) Supplement to Austroads
Guide to Road Design Part 4A: Unsignalised and Signalised Intersections. The assessment of the
warrants is based on the Extended Design Domain (EDD) criteria, appropriate for brownfield
intersections (as the site entry is an existing arrangement).
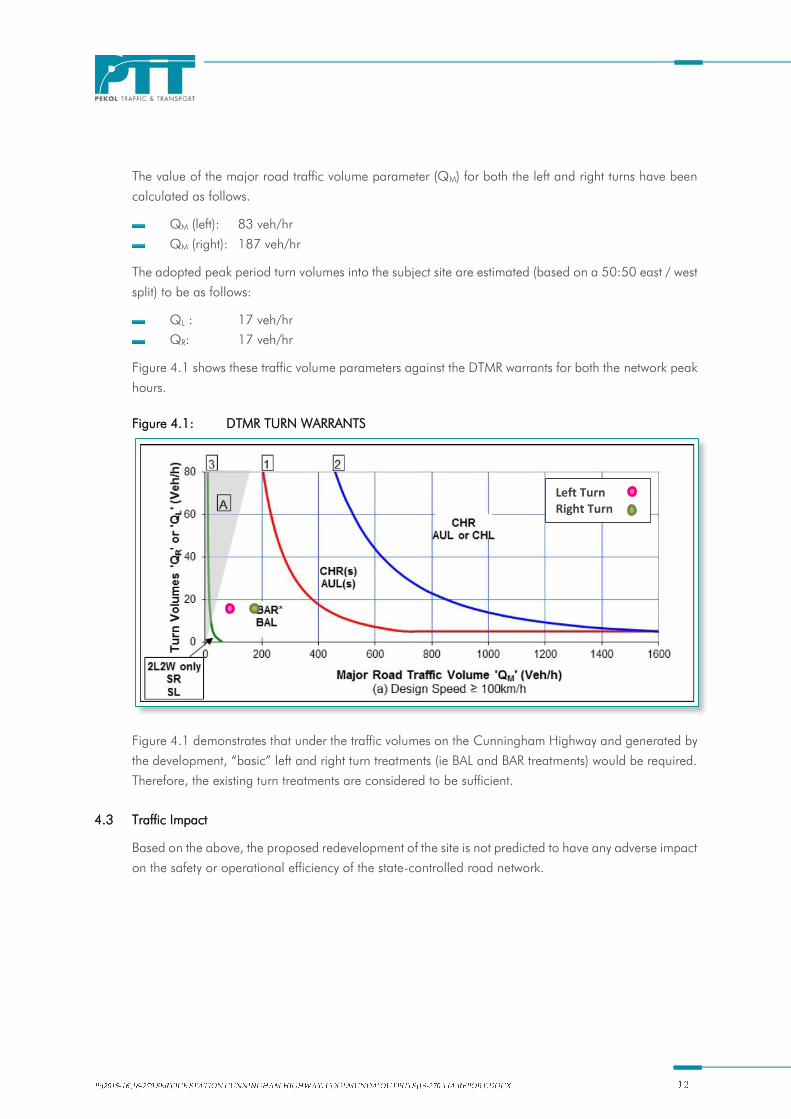
The value of the major road traffic volume parameter (QM) for both the left and right turns have been
calculated as follows.
QM (left): 83 veh/hr
QM (right): 187 veh/hr
The adopted peak period turn volumes into the subject site are estimated (based on a 50:50 east / west
split) to be as follows:
QL : 17 veh/hr
QR: 17 veh/hr
Figure 4.1 shows these traffic volume parameters against the DTMR warrants for both the network peak
hours.
Figure 4.1: DTMR TURN WARRANTS
Figure 4.1 demonstrates that under the traffic volumes on the Cunningham Highway and generated by
the development, “basic” left and right turn treatments (ie BAL and BAR treatments) would be required.
Therefore, the existing turn treatments are considered to be sufficient.
4.3 Traffic Impact
Based on the above, the proposed redevelopment of the site is not predicted to have any adverse impact
on the safety or operational efficiency of the state-controlled road network.
Left Turn Right Turn
5.0 CONCLUSIONS
The proposed redevelopment of an existing service station and truckstop located at 23129 Cunningham
Highway, Coolmunda has been evaluated in terms of its impact on the surrounding road network, site
access operations and internal layout. The main points to note are:
the proposed redevelopment comprises the same number of re-fuelling positions as the existing
service station, with a small increase (ie approximately 225m2 GFA) to the shop and restaurant
building to provide a total of 476m2 GFA
it is proposed to utilise the existing access arrangements to the subject development, with the
existing western-most driveway removed
the site access has an existing AUL(S) treatment and a BAR type arrangement, which are sufficient
based on the traffic generated by the development and the passing volumes on the Cunningham
Highway
the sight distance available at the site egress exceeds the recommended minimum requirements
a total of 32 on-site parking spaces are proposed to support the proposed redevelopment, which
is expected to adequately cater for parking demand
the internal layout of the subject site has been designed to accommodate a b-triple vehicle
an on-site refuse collection area and loading bay located is proposed adjacent to the western
edge of the service station and restaurant building
the proposed redevelopment is not predicted to significantly increase peak hour traffic generation
the traffic movements associated with the redevelopment are not expected to have a significant
impact on the operation of the Cunningham Highway

APPENDIX A
DEVELOPMENT SITE LAYOUT

APPENDIX B
SWEPT PATHS
1
SERVICE STATION &RESTAURANT
REMOTE FUELFILL POINT
DISPENS
ERS
U/GROUND FUEL
STORAGE TANKS
LINK
CANOPY
CAR CANOPY OVER
LOADING BAY
LONG VEHICLE PARKING
ENTRY
23
45
6
78
910
111213141516
STAFF
ACCOMM
ODATIO
N
AREA
B-DOUBLE PARKING (7)
AV PARKING (2)
LANDSCAPING
LANDSCAPING
LANDSCAPINGLANDSCAPING
BINLAN
DSCAPI
NG
LANDSCAPING
REST BAY
CUNNINGHAM HIGHWAY
POWERPOLE
VENTS
ID SIGN
TRUCK CANOPY OVER
1
POWERPOLE
23
4U1
U2
1
SERVICE STATION &RESTAURANT
REMOTE FUELFILL POINT
DISPENS
ERS
U/GROUND FUEL
STORAGE TANKS
LINK
CANOPY
CAR CANOPY OVER
LOADING BAY
LONG VEHICLE PARKING
ENTRY
23
45
6
78
910
111213141516
STAFF
ACCOMM
ODATIO
N
AREA
B-DOUBLE PARKING (7)
AV PARKING (2)
LANDSCAPING
LANDSCAPING
LANDSCAPINGLANDSCAPING
BINLAN
DSCAPI
NG
LANDSCAPING
REST BAY
CUNNINGHAM HIGHWAY
POWERPOLE
VENTS
ID SIGN
TRUCK CANOPY OVER
1
POWERPOLE
23
4U1
U2
APPENDIX C
SDAP CODES (MODULES 19.1 & 19.2)
State development assessment provisions Module 19 — State transport network functionality 19.1 Access to state-controlled roads state code 22 April 2016 V1.8 Page 1 of 4
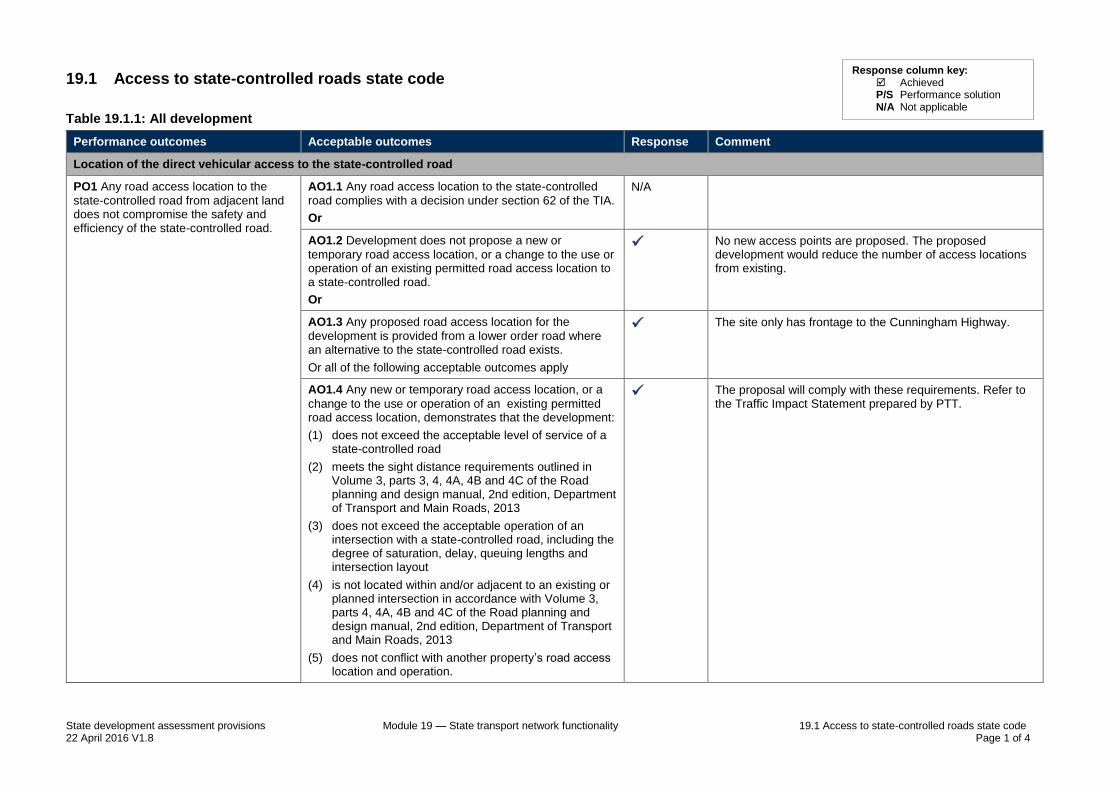
19.1 Access to state-controlled roads state code
Table 19.1.1: All development
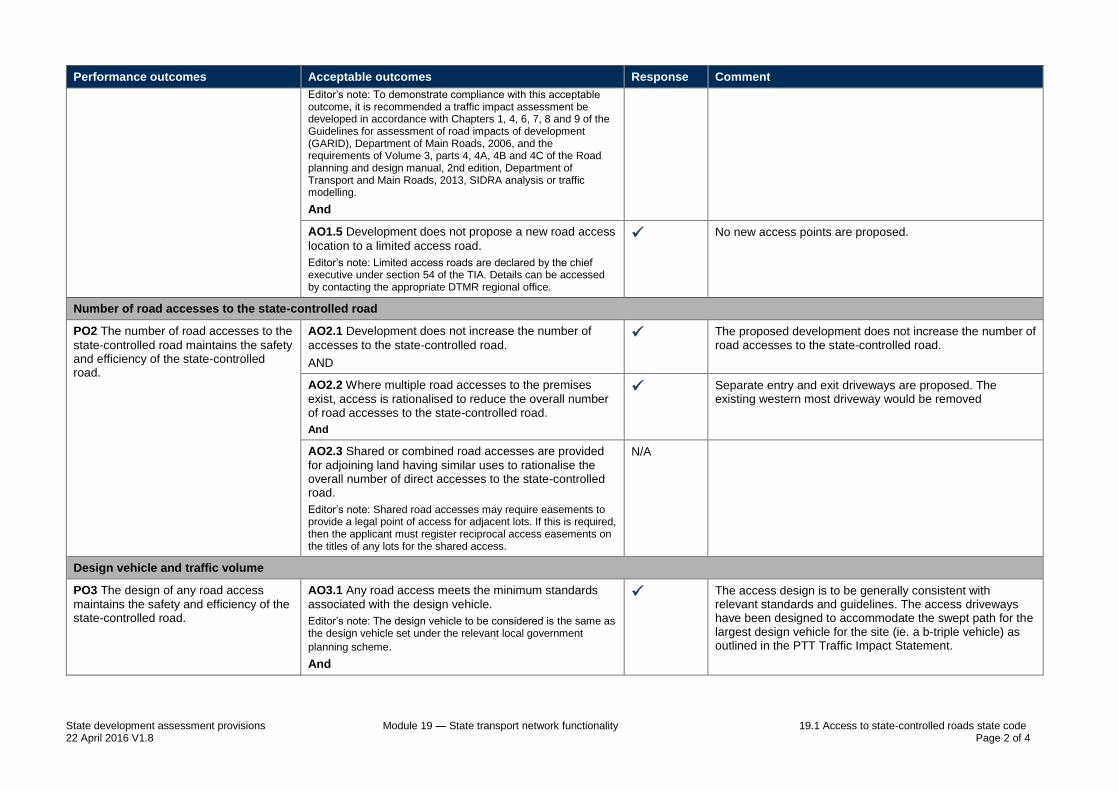
Performance outcomes Acceptable outcomes Response Comment
Location of the direct vehicular access to the state-controlled road
PO1 Any road access location to the
state-controlled road from adjacent land does not compromise the safety and efficiency of the state-controlled road.
AO1.1 Any road access location to the state-controlled
road complies with a decision under section 62 of the TIA.
Or
N/A
AO1.2 Development does not propose a new or
temporary road access location, or a change to the use or operation of an existing permitted road access location to a state-controlled road.
Or
No new access points are proposed. The proposed development would reduce the number of access locations from existing.
AO1.3 Any proposed road access location for the
development is provided from a lower order road where an alternative to the state-controlled road exists.
Or all of the following acceptable outcomes apply
The site only has frontage to the Cunningham Highway.
AO1.4 Any new or temporary road access location, or a
change to the use or operation of an existing permitted road access location, demonstrates that the development:
(1) does not exceed the acceptable level of service of a state-controlled road
(2) meets the sight distance requirements outlined in Volume 3, parts 3, 4, 4A, 4B and 4C of the Road planning and design manual, 2nd edition, Department of Transport and Main Roads, 2013
(3) does not exceed the acceptable operation of an intersection with a state-controlled road, including the degree of saturation, delay, queuing lengths and intersection layout
(4) is not located within and/or adjacent to an existing or planned intersection in accordance with Volume 3, parts 4, 4A, 4B and 4C of the Road planning and design manual, 2nd edition, Department of Transport and Main Roads, 2013
(5) does not conflict with another property’s road access location and operation.
The proposal will comply with these requirements. Refer to the Traffic Impact Statement prepared by PTT.
Response column key: Achieved P/S Performance solution N/A Not applicable
State development assessment provisions Module 19 — State transport network functionality 19.1 Access to state-controlled roads state code 22 April 2016 V1.8 Page 2 of 4
Performance outcomes Acceptable outcomes Response Comment
Editor’s note: To demonstrate compliance with this acceptable outcome, it is recommended a traffic impact assessment be developed in accordance with Chapters 1, 4, 6, 7, 8 and 9 of the Guidelines for assessment of road impacts of development (GARID), Department of Main Roads, 2006, and the requirements of Volume 3, parts 4, 4A, 4B and 4C of the Road planning and design manual, 2nd edition, Department of Transport and Main Roads, 2013, SIDRA analysis or traffic modelling.
And
AO1.5 Development does not propose a new road access
location to a limited access road.
Editor’s note: Limited access roads are declared by the chief executive under section 54 of the TIA. Details can be accessed by contacting the appropriate DTMR regional office.
No new access points are proposed.
Number of road accesses to the state-controlled road
PO2 The number of road accesses to the
state-controlled road maintains the safety and efficiency of the state-controlled road.
AO2.1 Development does not increase the number of
accesses to the state-controlled road.
AND
The proposed development does not increase the number of road accesses to the state-controlled road.
AO2.2 Where multiple road accesses to the premises
exist, access is rationalised to reduce the overall number of road accesses to the state-controlled road.
And
Separate entry and exit driveways are proposed. The existing western most driveway would be removed
AO2.3 Shared or combined road accesses are provided
for adjoining land having similar uses to rationalise the overall number of direct accesses to the state-controlled road.
Editor’s note: Shared road accesses may require easements to provide a legal point of access for adjacent lots. If this is required, then the applicant must register reciprocal access easements on the titles of any lots for the shared access.
N/A
Design vehicle and traffic volume
PO3 The design of any road access
maintains the safety and efficiency of the state-controlled road.
AO3.1 Any road access meets the minimum standards
associated with the design vehicle.
Editor’s note: The design vehicle to be considered is the same as the design vehicle set under the relevant local government
planning scheme.
And
The access design is to be generally consistent with relevant standards and guidelines. The access driveways have been designed to accommodate the swept path for the largest design vehicle for the site (ie. a b-triple vehicle) as outlined in the PTT Traffic Impact Statement.
State development assessment provisions Module 19 — State transport network functionality 19.1 Access to state-controlled roads state code 22 April 2016 V1.8 Page 3 of 4
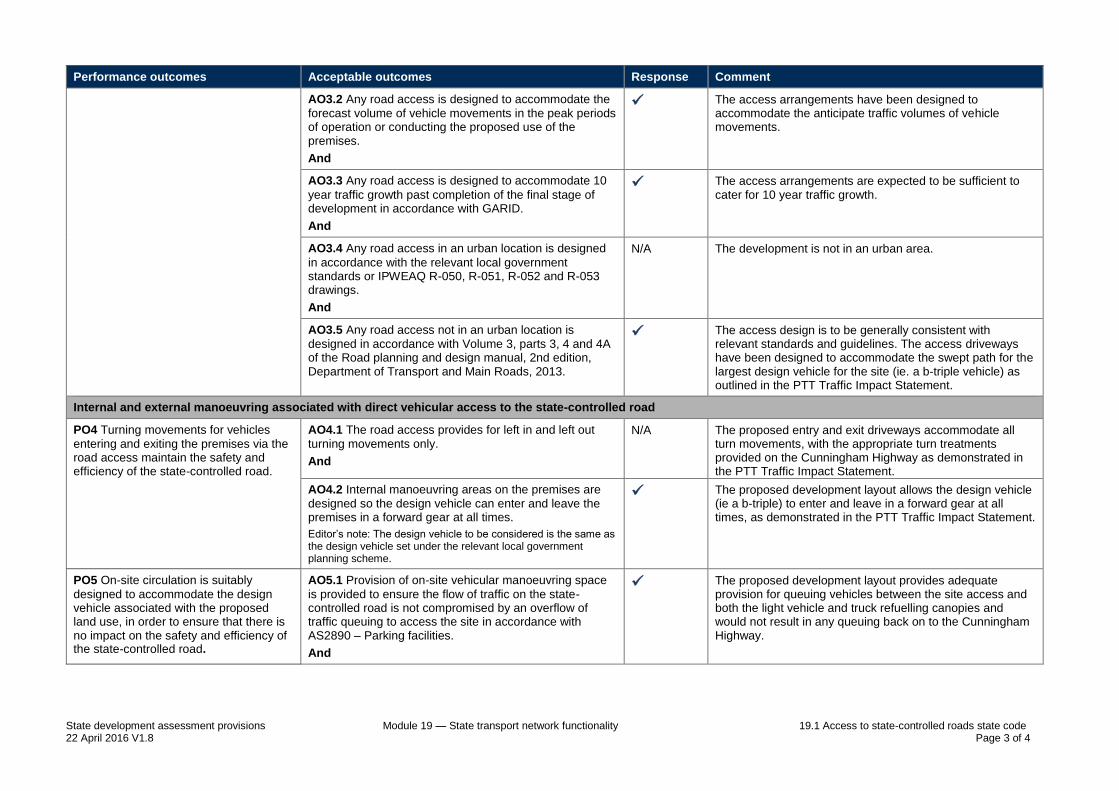
Performance outcomes Acceptable outcomes Response Comment
AO3.2 Any road access is designed to accommodate the
forecast volume of vehicle movements in the peak periods of operation or conducting the proposed use of the premises.
And
The access arrangements have been designed to accommodate the anticipate traffic volumes of vehicle movements.
AO3.3 Any road access is designed to accommodate 10
year traffic growth past completion of the final stage of development in accordance with GARID.
And
The access arrangements are expected to be sufficient to cater for 10 year traffic growth.
AO3.4 Any road access in an urban location is designed
in accordance with the relevant local government standards or IPWEAQ R-050, R-051, R-052 and R-053 drawings.
And
N/A The development is not in an urban area.
AO3.5 Any road access not in an urban location is
designed in accordance with Volume 3, parts 3, 4 and 4A of the Road planning and design manual, 2nd edition, Department of Transport and Main Roads, 2013.
The access design is to be generally consistent with relevant standards and guidelines. The access driveways have been designed to accommodate the swept path for the largest design vehicle for the site (ie. a b-triple vehicle) as outlined in the PTT Traffic Impact Statement.
Internal and external manoeuvring associated with direct vehicular access to the state-controlled road
PO4 Turning movements for vehicles
entering and exiting the premises via the road access maintain the safety and efficiency of the state-controlled road.
AO4.1 The road access provides for left in and left out
turning movements only.
And
N/A The proposed entry and exit driveways accommodate all turn movements, with the appropriate turn treatments provided on the Cunningham Highway as demonstrated in the PTT Traffic Impact Statement.
AO4.2 Internal manoeuvring areas on the premises are
designed so the design vehicle can enter and leave the premises in a forward gear at all times.
Editor’s note: The design vehicle to be considered is the same as the design vehicle set under the relevant local government planning scheme.
The proposed development layout allows the design vehicle (ie a b-triple) to enter and leave in a forward gear at all times, as demonstrated in the PTT Traffic Impact Statement.
PO5 On-site circulation is suitably
designed to accommodate the design vehicle associated with the proposed land use, in order to ensure that there is no impact on the safety and efficiency of the state-controlled road.
AO5.1 Provision of on-site vehicular manoeuvring space
is provided to ensure the flow of traffic on the state-controlled road is not compromised by an overflow of traffic queuing to access the site in accordance with AS2890 – Parking facilities.
And
The proposed development layout provides adequate provision for queuing vehicles between the site access and both the light vehicle and truck refuelling canopies and would not result in any queuing back on to the Cunningham Highway.
State development assessment provisions Module 19 — State transport network functionality 19.1 Access to state-controlled roads state code 22 April 2016 V1.8 Page 4 of 4
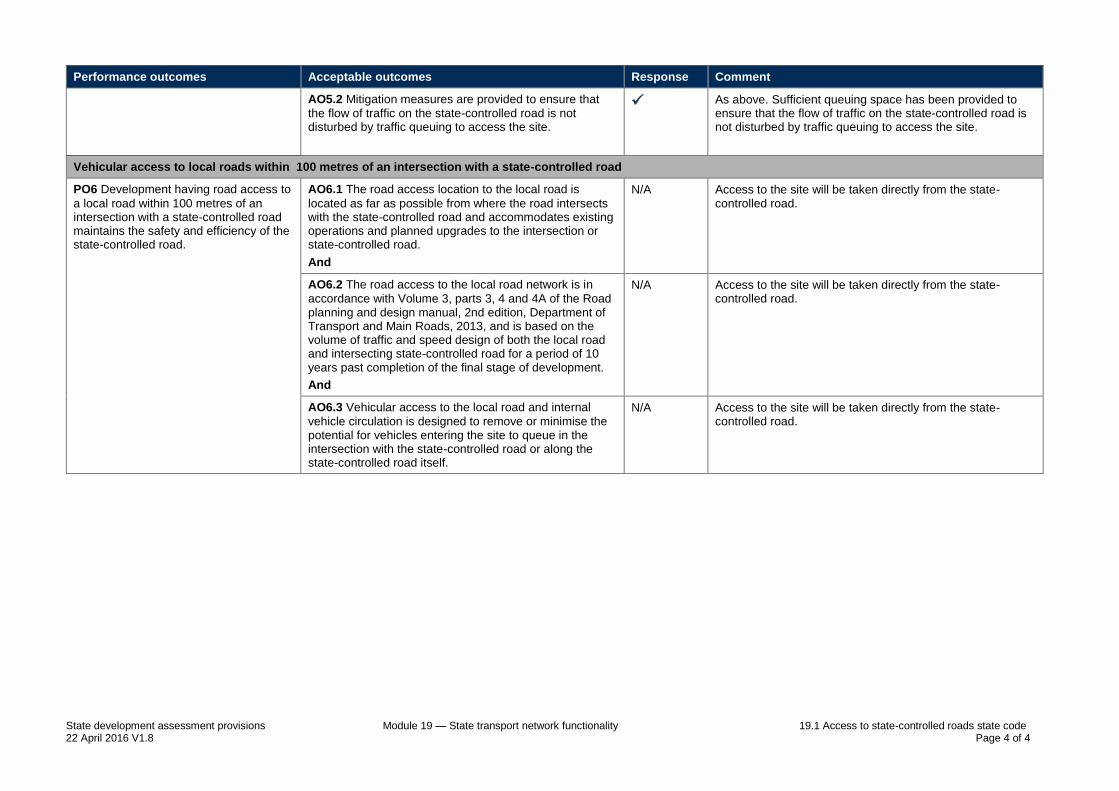
Performance outcomes Acceptable outcomes Response Comment
AO5.2 Mitigation measures are provided to ensure that
the flow of traffic on the state-controlled road is not disturbed by traffic queuing to access the site.
As above. Sufficient queuing space has been provided to ensure that the flow of traffic on the state-controlled road is not disturbed by traffic queuing to access the site.
Vehicular access to local roads within 100 metres of an intersection with a state-controlled road
PO6 Development having road access to
a local road within 100 metres of an intersection with a state-controlled road maintains the safety and efficiency of the state-controlled road.
AO6.1 The road access location to the local road is
located as far as possible from where the road intersects with the state-controlled road and accommodates existing operations and planned upgrades to the intersection or state-controlled road.
And
N/A Access to the site will be taken directly from the state-controlled road.
AO6.2 The road access to the local road network is in
accordance with Volume 3, parts 3, 4 and 4A of the Road planning and design manual, 2nd edition, Department of Transport and Main Roads, 2013, and is based on the volume of traffic and speed design of both the local road and intersecting state-controlled road for a period of 10 years past completion of the final stage of development.
And
N/A Access to the site will be taken directly from the state-controlled road.
AO6.3 Vehicular access to the local road and internal
vehicle circulation is designed to remove or minimise the potential for vehicles entering the site to queue in the intersection with the state-controlled road or along the state-controlled road itself.
N/A Access to the site will be taken directly from the state-controlled road.

APPENDIX D
AADT DATA
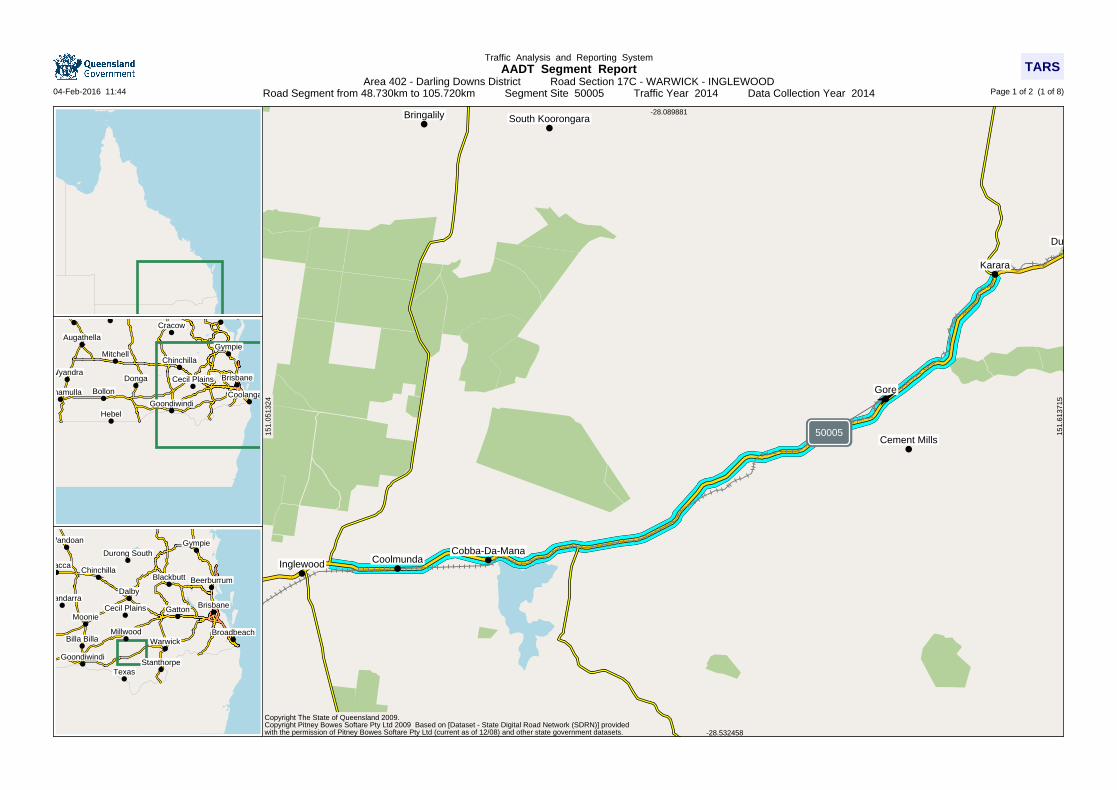
TARSTraffic Analysis and Reporting System
AADT Segment ReportArea 402 - Darling Downs District Road Section 17C - WARWICK - INGLEWOOD
Road Segment from 48.730km to 105.720km Segment Site 50005 Traffic Year 2014 Data Collection Year 201404-Feb-2016 11:44
Brisbane
Bundaberg
Augathella
Chinchilla
CunnamullaGoondiwindi
GympieMitchell
Tambo
Bollon
Cecil Plains
Coolangatta
Cracow
Hebel
Wyandra
Carnarvon
Donga
Brisbane
Bundaberg
Chinchilla
Dalby
Gatton
Goondiwindi
Gympie
Hervey Bay
Stanthorpe
Warwick
Abercorn
Ban Ban Springs
BeerburrumBlackbutt
Booyal
Broadbeach
Cecil Plains
Cracow
Dulacca
Durong South
Meandarra
Millwood
Moonie
Texas
Theodore
Wandoan
Billa Billa
Amiens
Aubigny
Back Plains
Bapaume
Bethcar
Biddeston
Bony Mountain
Boodua
Boora Mugga
Bringalily
Brookstead
Broxburn
Bunkers Hill
Cambooya
Captains Mountain
Cecil Plains
Cement Mills
Clontarf
Cobba-Da-ManaCoolmunda
Durikai
Ellangowan
Felton East
Felton South
Formartin
Gore
Horrane
Inglewood
Irongate
Karara
Kelvinhaugh
Kingsthorpe
Leyburn
Mallow
Millmerran
Millwood
Mondam
Montrose
Mount Emlyn
Mount Irving
Muniganeen
MywybillaNangwee
Neylons
North Branch
Norwin
Oakey
Pampas
Pikedale
Pittsworth
Pratten
Rocky Creek
Ryeford
South Koorongara
SouthbrookSpringside
Tangkam
Thane
Thanes Creek
Tipton
Tummaville
Turallin
Umbiram
Wallingford
Whetstone
Wyreema
Yargullen
Yarranlea
Jondaryan Woolshed
New Dunmore
Allawah
Yandilla
Cuppine
Western Creek
Bonray
Bongeen
Talgai
Purrawunda
Sundown
50005
Copyright The State of Queensland 2009.Copyright Pitney Bowes Softare Pty Ltd 2009 Based on [Dataset - State Digital Road Network (SDRN)] providedwith the permission of Pitney Bowes Softare Pty Ltd (current as of 12/08) and other state government datasets.
-28.089881
-28.532458
151.
6137
15
151.
0513
24
Page 1 of 2 (1 of 8)
TARSTraffic Analysis and Reporting System
AADT Segment ReportArea 402 - Darling Downs District Road Section 17C - WARWICK - INGLEWOOD
Road Segment from 48.730km to 105.720km Segment Site 50005 Traffic Year 2014 Data Collection Year 201404-Feb-2016 11:44
60.99 km
Site 50005. Point 250000009.Coverage Site - 1km east of Gore Rd.
The width of each Road Segment is proportional to its AADT.
48.73 km
Start Point 250000010. CunninghamHwy to Ing’wd @ Toow.-Karara.
105.72 km
End Point 250000191. CunninghamHwy to Ing’wd @ Mill.-Ing’wd.
All Vehicles (00)
G 828 100%
A 870 100%
B 1,698 100%
Light Vehicles (0A)
G 550 66.43%
A 546 62.76%
B 1,096 64.55%
Heavy Vehicles (0B)
G 277 33.45%
A 324 37.24%
B 601 35.39%
Short Vehicles (1A)
G 550 66.43%
A 546 62.76%
B 1,096 64.55%
Trucks and Buses (1B)
G 61 7.37%
A 53 6.09%
B 114 6.71%
Articulated Vehicles (1C)
G 63 7.61%
A 76 8.74%
B 139 8.19%
Road Trains (1D)
G 153 18.48%
A 195 22.41%
B 348 20.49%
Short 2-AxleVehicles (2A)
G 478 57.73%
A 471 54.14%
B 949 55.89%
Short VehiclesTowing (2B)
G 72 8.70%
A 75 8.62%
B 147 8.66%
2-Axle Trucksand Buses (2C)
G 51 6.16%
A 44 5.06%
B 95 5.59%
3-Axle Trucksand Buses (2D)
G 8 0.97%
A 8 0.92%
B 16 0.94%
4-AxleTrucks (2E)
G 2 0.24%
A 1 0.11%
B 3 0.18%
3-AxleArticulated (2F)
G 6 0.72%
A 5 0.57%
B 11 0.65%
4-AxleArticulated (2G)
G 9 1.09%
A 9 1.03%
B 18 1.06%
5-AxleArticulated (2H)
G 6 0.72%
A 6 0.69%
B 12 0.71%
6-AxleArticulated (2I)
G 42 5.07%
A 56 6.44%
B 98 5.77%
B Double (2J)
G 138 16.67%
A 180 20.69%
B 318 18.73%
Double RoadTrains (2K)
G 15 1.81%
A 15 1.72%
B 30 1.77%
Triple RoadTrains (2L)
G 0 0%
A 0 0%
B 0 0%
This report shows Annual Average Daily Trafficvalues (AADTs). Because the AADT values areconverted to whole numbers, there will beoccasional inaccuracies due to rounding.These inaccuracies are statistically insignificant.
Page 2 of 2 (2 of 8)
TARSTraffic Analysis and Reporting SystemReport Notes for AADT Segment Report
04-Feb-2016 11:44
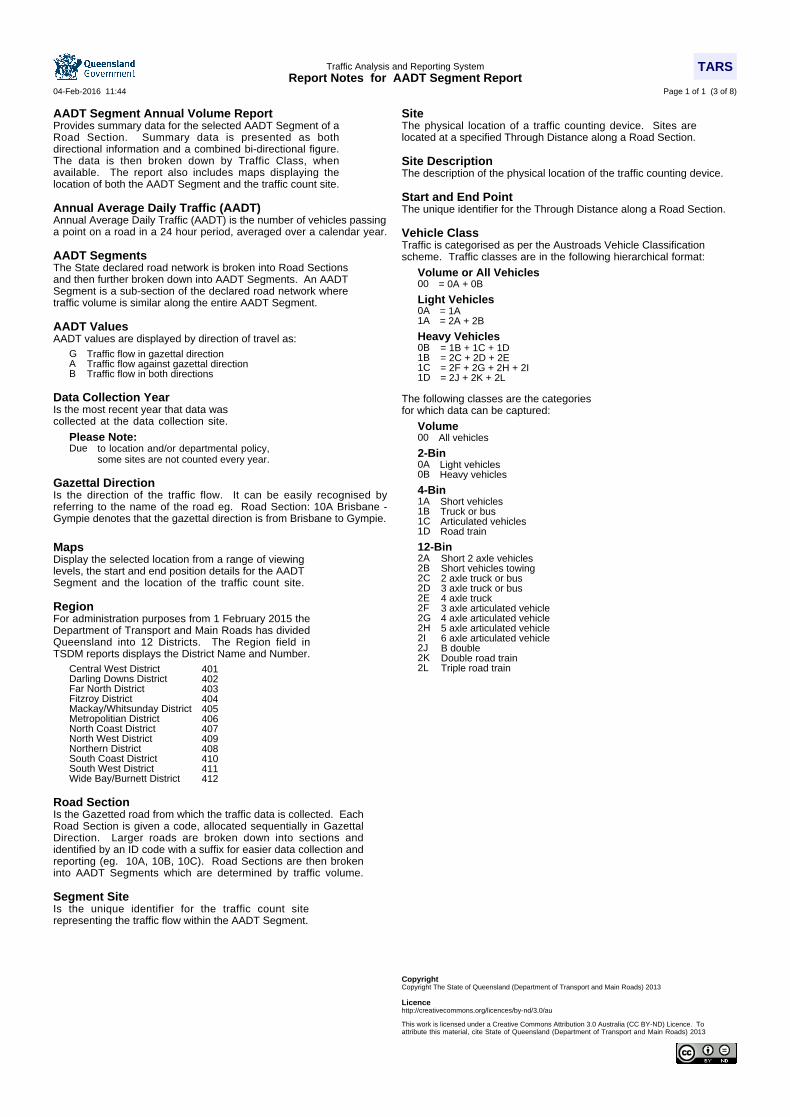
AADT Segment Annual Volume ReportProvides summary data for the selected AADT Segment of aRoad Section. Summary data is presented as bothdirectional information and a combined bi-directional figure.The data is then broken down by Traffic Class, whenavailable. The report also includes maps displaying thelocation of both the AADT Segment and the traffic count site.
Annual Average Daily Traffic (AADT)Annual Average Daily Traffic (AADT) is the number of vehicles passinga point on a road in a 24 hour period, averaged over a calendar year.
AADT SegmentsThe State declared road network is broken into Road Sectionsand then further broken down into AADT Segments. An AADTSegment is a sub-section of the declared road network wheretraffic volume is similar along the entire AADT Segment.
AADT ValuesAADT values are displayed by direction of travel as:
G Traffic flow in gazettal directionA Traffic flow against gazettal directionB Traffic flow in both directions
Data Collection YearIs the most recent year that data wascollected at the data collection site.
Please Note:Due to location and/or departmental policy,
some sites are not counted every year.
Gazettal DirectionIs the direction of the traffic flow. It can be easily recognised byreferring to the name of the road eg. Road Section: 10A Brisbane -Gympie denotes that the gazettal direction is from Brisbane to Gympie.
MapsDisplay the selected location from a range of viewinglevels, the start and end position details for the AADTSegment and the location of the traffic count site.
RegionFor administration purposes from 1 February 2015 theDepartment of Transport and Main Roads has dividedQueensland into 12 Districts. The Region field inTSDM reports displays the District Name and Number.
Central West District 401Darling Downs District 402Far North District 403Fitzroy District 404Mackay/Whitsunday District 405Metropolitian District 406North Coast District 407North West District 409Northern District 408South Coast District 410South West District 411Wide Bay/Burnett District 412
Road SectionIs the Gazetted road from which the traffic data is collected. EachRoad Section is given a code, allocated sequentially in GazettalDirection. Larger roads are broken down into sections andidentified by an ID code with a suffix for easier data collection andreporting (eg. 10A, 10B, 10C). Road Sections are then brokeninto AADT Segments which are determined by traffic volume.
Segment SiteIs the unique identifier for the traffic count siterepresenting the traffic flow within the AADT Segment.
SiteThe physical location of a traffic counting device. Sites arelocated at a specified Through Distance along a Road Section.
Site DescriptionThe description of the physical location of the traffic counting device.
Start and End PointThe unique identifier for the Through Distance along a Road Section.
Vehicle ClassTraffic is categorised as per the Austroads Vehicle Classificationscheme. Traffic classes are in the following hierarchical format:
Volume or All Vehicles00 = 0A + 0B
Light Vehicles0A = 1A1A = 2A + 2B
Heavy Vehicles0B = 1B + 1C + 1D1B = 2C + 2D + 2E1C = 2F + 2G + 2H + 2I1D = 2J + 2K + 2L
The following classes are the categoriesfor which data can be captured:
Volume00 All vehicles
2-Bin0A Light vehicles0B Heavy vehicles
4-Bin1A Short vehicles1B Truck or bus1C Articulated vehicles1D Road train
12-Bin2A Short 2 axle vehicles2B Short vehicles towing2C 2 axle truck or bus2D 3 axle truck or bus2E 4 axle truck2F 3 axle articulated vehicle2G 4 axle articulated vehicle2H 5 axle articulated vehicle2I 6 axle articulated vehicle2J B double2K Double road train2L Triple road train
CopyrightCopyright The State of Queensland (Department of Transport and Main Roads) 2013
Licencehttp://creativecommons.org/licences/by-nd/3.0/au
This work is licensed under a Creative Commons Attribution 3.0 Australia (CC BY-ND) Licence. Toattribute this material, cite State of Queensland (Department of Transport and Main Roads) 2013
Page 1 of 1 (3 of 8)
TARSTraffic Analysis and Reporting System
Annual Volume ReportArea 402 - Darling Downs District Road Section 17C - WARWICK - INGLEWOOD
Site 50005 - 900m East of Cement Mills Rd TDist 60.990km Speed Limit 10004-Feb-2016 11:44
Amiens
Aubigny
Back Plains
Bethcar
Bony Mountain
Boodua
Bringalily
Brookstead
Broxburn
Captains Mountain
Cecil Plains
Cement Mills
Durikai
Felton East
Formartin
Leyburn
Pikedale
Rocky Creek
TummavilleTurallin
New Dunmore
Bonray
Talgai
Gore
Gore
Cunnin
gham
High
way
Cunningham Highway
Cement M
ills Road
Col
umba
Roa
d
Columba Road
Colum
ba R
oad
Dungorm Road
50005
Copyright The State of Queensland 2009.Copyright Pitney Bowes Softare Pty Ltd 2009 Based on [Dataset - State Digital Road Network (SDRN)] providedwith the permission of Pitney Bowes Softare Pty Ltd (current as of 12/08) and other state government datasets.
-28.281065
-28.294130
151.
5014
65
151.
4848
63
Page 1 of 3 (4 of 8)
TARSTraffic Analysis and Reporting SystemAnnual Volume Report
04-Feb-2016 11:44
Area 402 - Darling Downs District
Road Section 17C - WARWICK - INGLEWOOD
Site 50005 - 900m East of Cement Mills Rd
Thru Dist 60.99
Type C - Coverage
Stream TB - Bi-directional traffic flow
Year 2014
AADT 1,698
Avg Week Day 1,969
Avg Weekend Day 1,562
Growth last Year -23.20%
Growth last 5 Yrs 2.65%
Growth last 10 Yrs 1.99%
1986
1987
1988
1989
1990
1991
1992
1993
1994
1995
1996
1997
1998
1999
2000
2001
2002
2003
2004
2005
2006
2007
2008
2009
2010
2011
2012
2013
2014
2015
0
250
500
750
1,000
1,250
1,500
1,750
2,000
2,250
2,500
2,750
3,000
AA
DT
0
250
500
750
1,000
1,250
1,500
1,750
2,000
2,250
2,500
2,750
3,000
AA
DT
AADT History
1-Year 1-Year5-Year 5-Year10-Year 10-YearYear YearAADT AADTGrowth GrowthGrowth GrowthGrowth Growth
2015 1,664 -2.00% 1.30% 1.44%
2014 1,698 -23.20% 2.65% 1.99%
2013 2,211 36.31% 11.06% 6.02%
2012 1,622 13.82% 2.70% 1.42%
2011 1,425 -3.39% -1.21% -0.32%
2010 1,475 -3.53% 0.12% 0.01%
2009 1,529 0.92% 1.49% 0.37%
2008 1,515 7.37% 1.08% 0.18%
2007 1,411 -7.66% -1.10% -0.94%
2006 1,528 7.00% 1.52% 0.19%
2005 1,428 0.49% -1.05% -0.70%
2004 1,421 -4.25% -1.75% -0.82%
2003 1,484 -0.54% -0.65% -0.15%
2002 1,492 6.50% -0.73% 0.17%
2001 1,401 -10.36% -2.30% -0.29%
2000 1,563 -0.32% 1.23% 1.62%
1999 1,568 3.77% 1.24% 1.76%
1998 1,511 -2.20% 0.42% 1.04%
1997 1,545 3.28% 1.89% 1.37%
1996 1,496 3.67% 2.38% 0.54%
1995 1,443 -5.38% 2.15% 0.00%
1994 1,525 3.67% 3.61% 0.93%
1993 1,471 7.84% 1.44% 0.48%
1992 1,364 8.60% -0.98% -0.76%
1991 1,256 -3.01% -4.68% -2.14%
1990 1,295 -7.04% -3.81% -1.64%
1989 1,393 -9.07% -1.11% -0.61%
1988 1,532 7.89% 2.13% 0.86%
1987 1,420 -13.04% -0.27% 0.04%
1986 1,633 13.56% 3.05% 2.57%
01-0
203
-04
05-0
607
-08
09-1
011
-12
13-1
415
-16
17-1
819
-20
21-2
223
-00
01-0
203
-04
05-0
607
-08
09-1
011
-12
13-1
415
-16
17-1
819
-20
21-2
223
-00
01-0
203
-04
05-0
607
-08
09-1
011
-12
13-1
415
-16
17-1
819
-20
21-2
223
-00
01-0
203
-04
05-0
607
-08
09-1
011
-12
13-1
415
-16
17-1
819
-20
21-2
223
-00
01-0
203
-04
05-0
607
-08
09-1
011
-12
13-1
415
-16
17-1
819
-20
21-2
223
-00
01-0
203
-04
05-0
607
-08
09-1
011
-12
13-1
415
-16
17-1
819
-20
21-2
223
-00
01-0
203
-04
05-0
607
-08
09-1
011
-12
13-1
415
-16
17-1
819
-20
21-2
223
-00
Monday Tuesday Wednesday Thursday Friday Saturday Sunday
Hours of the Week
0.0
1.0
2.0
3.0
4.0
5.0
6.0
7.0
8.0
9.0
10.0
11.0
12.0
13.0
% A
AD
T
0.0
1.0
2.0
3.0
4.0
5.0
6.0
7.0
8.0
9.0
10.0
11.0
12.0
13.0
% A
AD
T
Hourly Averages
Page 2 of 3 (5 of 8)

TARSTraffic Analysis and Reporting SystemAnnual Volume Report
04-Feb-2016 11:44
Mon
Tue
Wed
Thu F
ri
Sat
Sun
Days of the Week
8085
90
95
100
105
110
115
120
125130
% A
AD
T
8085
90
95
100
105
110
115
120
125130
% A
AD
T
Daily Averages
26-D
ec -
01-
Jan
02-J
an -
08-
Jan
09-J
an -
15-
Jan
16-J
an -
22-
Jan
23-J
an -
29-
Jan
30-J
an -
05-
Feb
06-F
eb -
12-
Feb
13-F
eb -
19-
Feb
20-F
eb -
26-
Feb
27-F
eb -
05-
Mar
06-M
ar -
12-
Mar
13-M
ar -
19-
Mar
20-M
ar -
26-
Mar
27-M
ar -
02-
Apr
03-A
pr -
09-
Apr
10-A
pr -
16-
Apr
17-A
pr -
23-
Apr
24-A
pr -
30-
Apr
01-M
ay -
07-
May
08-M
ay -
14-
May
15-M
ay -
21-
May
22-M
ay -
28-
May
29-M
ay -
04-
Jun
05-J
un -
11-
Jun
12-J
un -
18-
Jun
19-J
un -
25-
Jun
26-J
un -
02-
Jul
03-J
ul -
09-
Jul
10-J
ul -
16-
Jul
17-J
ul -
23-
Jul
24-J
ul -
30-
Jul
31-J
ul -
06-
Aug
07-A
ug -
13-
Aug
14-A
ug -
20-
Aug
21-A
ug -
27-
Aug
28-A
ug -
03-
Sep
04-S
ep -
10-
Sep
11-S
ep -
17-
Sep
18-S
ep -
24-
Sep
25-S
ep -
01-
Oct
02-O
ct -
08-
Oct
09-O
ct -
15-
Oct
16-O
ct -
22-
Oct
23-O
ct -
29-
Oct
30-O
ct -
05-
Nov
06-N
ov -
12-
Nov
13-N
ov -
19-
Nov
20-N
ov -
26-
Nov
27-N
ov -
03-
Dec
04-D
ec -
10-
Dec
11-D
ec -
17-
Dec
18-D
ec -
24-
Dec
25-D
ec -
31-
Dec
100
105
110
115
120
125
130
% A
AD
T
100
105
110
115
120
125
130
% A
AD
T
Weekly Averages
JanuaryM T W T F S S
1 2 3 4 5
6 7 8 9 10 11 12
13 14 15 16 17 18 19
20 21 22 23 24 25 26
27 28 29 30 31
FebruaryM T W T F S S
1 2
3 4 5 6 7 8 9
10 11 12 13 14 15 16
17 18 19 20 21 22 23
24 25 26 27 28
MarchM T W T F S S
1 2
3 4 5 6 7 8 9
10 11 12 13 14 15 16
17 18 19 20 21 22 23
24 25 26 27 28 29 30
31
AprilM T W T F S S
1 2 3 4 5 6
7 8 9 10 11 12 13
14 15 16 17 18 19 20
21 22 23 24 25 26 27
28 29 30
MayM T W T F S S
1 2 3 4
5 6 7 8 9 10 11
12 13 14 15 16 17 18
19 20 21 22 23 24 25
26 27 28 29 30 31
JuneM T W T F S S
1
2 3 4 5 6 7 8
9 10 11 12 13 14 15
16 17 18 19 20 21 22
23 24 25 26 27 28 29
30
JulyM T W T F S S
1 2 3 4 5 6
7 8 9 10 11 12 13
14 15 16 17 18 19 20
21 22 23 24 25 26 27
28 29 30 31
AugustM T W T F S S
1 2 3
4 5 6 7 8 9 10
11 12 13 14 15 16 17
18 19 20 21 22 23 24
25 26 27 28 29 30 31
SeptemberM T W T F S S
1 2 3 4 5 6 7
8 9 10 11 12 13 14
15 16 17 18 19 20 21
22 23 24 25 26 27 28
29 30
OctoberM T W T F S S
1 2 3 4 5
6 7 8 9 10 11 12
13 14 15 16 17 18 19
20 21 22 23 24 25 26
27 28 29 30 31
NovemberM T W T F S S
1 2
3 4 5 6 7 8 9
10 11 12 13 14 15 16
17 18 19 20 21 22 23
24 25 26 27 28 29 30
DecemberM T W T F S S
1 2 3 4 5 6 7
8 9 10 11 12 13 14
15 16 17 18 19 20 21
22 23 24 25 26 27 28
29 30 31
2014 Calendar
Days on which traffic data was collected.
Page 3 of 3 (6 of 8)
TARSTraffic Analysis and Reporting SystemReport Notes for Annual Volume Report
04-Feb-2016 11:44
Annual Volume ReportDisplays AADT history with hourly, daily and weeklypatterns by Stream in addition to annual data for AADTfigures with 1 year, 5 year and 10 year growth rates.
Annual Average Daily Traffic (AADT)Annual Average Daily Traffic (AADT) is the number of vehicles passinga point on a road in a 24 hour period, averaged over a calendar year.
AADT HistoryDisplays the years when traffic data was collected at this count site.
Avg Week DayAverage daily traffic volume during the week days, Monday to Friday.
Avg Weekend DayAverage daily traffic volume duringthe weekend, Saturday and Sunday.
CalendarDays on which traffic data was collected are highlighted in green.
Gazettal DirectionThe Gazettal Direction is the direction of the traffic flow.It can be easily recognised by referring to the name of theroad eg. Road Section: 10A Brisbane - Gympie denotesthat the gazettal direction is from Brisbane to Gympie.
G Traffic flowing in Gazettal DirectionA Traffic flowing against Gazettal DirectionB The combined traffic flow in both Directions
Growth PercentageRepresents the increase or decrease in AADT, using aexponential fit over the previous 1, 5 or 10 year period.
Hour, Day & Week AveragesThe amount of traffic on the road network will vary dependingon the time of day, the day of the week and the week of theyear. The ebb and flow of traffic travelling through a site overa period of time forms a pattern. The Hour, Day and WeekAverages are then used in the calculation of AADT.
RegionFor administration purposes from 1 February 2015 theDepartment of Transport and Main Roads has dividedQueensland into 12 Districts. The Region field inTSDM reports displays the District Name and Number.
Central West District 401Darling Downs District 402Far North District 403Fitzroy District 404Mackay/Whitsunday District 405Metropolitian District 406North Coast District 407North West District 409Northern District 408South Coast District 410South West District 411Wide Bay/Burnett District 412
Road SectionIs the Gazetted road from which the traffic data is collected. EachRoad Section is given a code, allocated sequentially in GazettalDirection. Larger roads are broken down into sections andidentified by an ID code with a suffix for easier data collection andreporting (eg. 10A, 10B, 10C). Road Sections are then brokeninto AADT Segments which are determined by traffic volume.
SiteThe unique identifier and description of the physicallocation of a traffic counting device. Sites arelocated at a Through Distance along a Road Section.
StreamThe lane in which the traffic is travelling in. This reportprovides data for the combined flow of traffic in both directions.
Thru Dist or TDistThe distance from the beginning of the Road Section, in kilometres.
TypeThere are two types of traffic counting sites, Permanentand Coverage. Permanent means the traffic countingdevice is in place 24/7. Coverage means the trafficcounting device is in place for a specified period of time.
YearIs the current year for the report. Where an AADT Year recordis missing a traffic count has not been conducted, for that year.
CopyrightCopyright The State of Queensland (Department of Transport and Main Roads) 2013
Licencehttp://creativecommons.org/licences/by-nd/3.0/au
Page 1 of 2 (7 of 8)