Embed Size (px)
Citation preview
PROPOSED WAAIHOEK WIND ENERGY FACILITY, UTRECHT, KWAZULU-NATAL, SOUTH AFRICA
VISUAL IMPACT ASSESSMENT
Prepared for:
South Africa Mainstream Renewable Power Developments
(Pty) Ltd. 4th Floor, Mariendahl House
Newlands on Main Corner Main and Campground Roads
Claremont, 7708 Cape Town
021 657 4045 www.mainstreamrp.com
Prepared by:
EOH Coastal & Environmental Services
EAST LONDON 16 Tyrell Road, Berea East London, 5201
043 742 3302 Also in Grahamstown, Port Elizabeth, Cape Town, Johannesburg
and Maputo
www.cesnet.co.za
November 2014

COPYRIGHT INFORMATION This document contains intellectual property and propriety information that is protected
by copyright in favour of Coastal & Environmental Services and the specialist consultants. The document may therefore not be reproduced, used or distributed to
any third party without the prior written consent of Coastal & Environmental Services. This document is prepared exclusively for submission to South Africa Mainstream
Renewable Power Developments (Pty) Ltd., and is subject to all confidentiality, copyright and trade secrets, rules intellectual property law and practices of South
Africa.
Waaihoek Wind Energy Facility, Visual Impact Assessment – November 2014
EOH Coastal & Environmental Services Waaihoek Visual Impact Assessment i
This Report should be cited as follows: Coastal & Environmental Services, November 2014: Waaihoek Wind Energy Facility, Visual Impact Assessment, CES, East London.
REVISIONS TRACKING TABLE
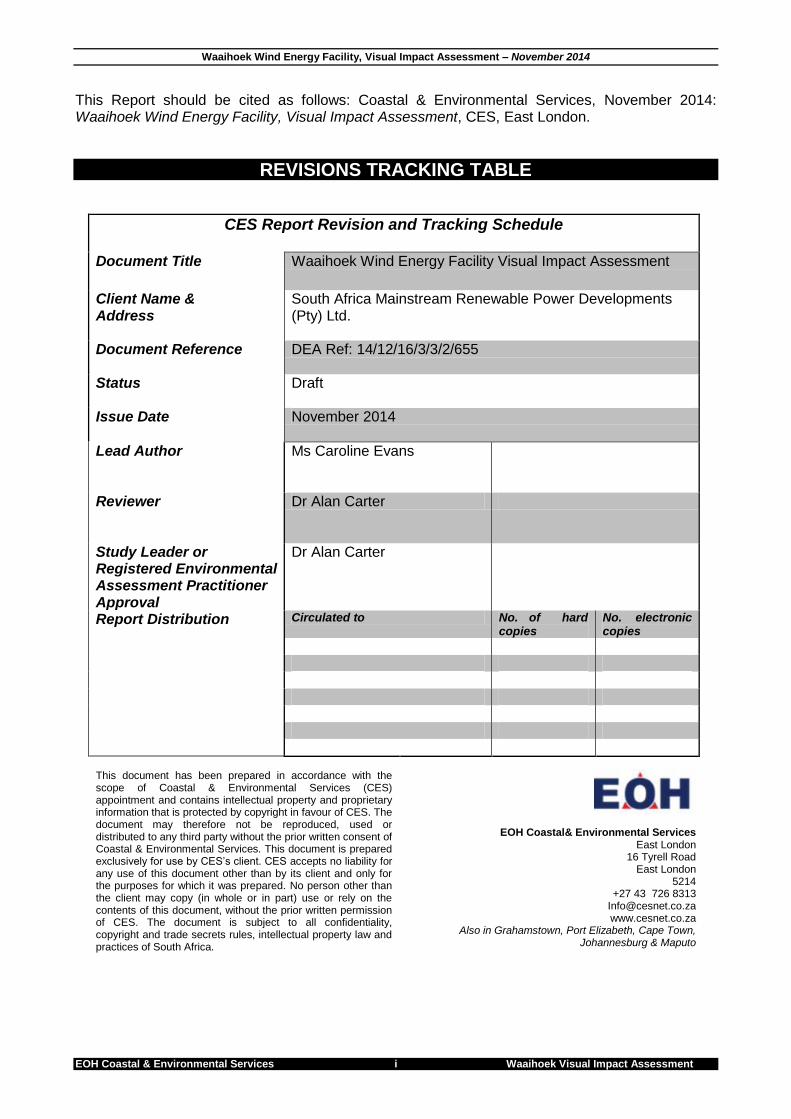
CES Report Revision and Tracking Schedule Document Title
Waaihoek Wind Energy Facility Visual Impact Assessment
Client Name & Address
South Africa Mainstream Renewable Power Developments (Pty) Ltd.
Document Reference
DEA Ref: 14/12/16/3/3/2/655
Status
Draft
Issue Date
November 2014
Lead Author
Ms Caroline Evans
Reviewer
Dr Alan Carter
Study Leader or Registered Environmental Assessment Practitioner Approval
Dr Alan Carter
Report Distribution Circulated to No. of hard copies
No. electronic copies
This document has been prepared in accordance with the scope of Coastal & Environmental Services (CES) appointment and contains intellectual property and proprietary information that is protected by copyright in favour of CES. The document may therefore not be reproduced, used or distributed to any third party without the prior written consent of Coastal & Environmental Services. This document is prepared exclusively for use by CES‟s client. CES accepts no liability for any use of this document other than by its client and only for the purposes for which it was prepared. No person other than the client may copy (in whole or in part) use or rely on the contents of this document, without the prior written permission of CES. The document is subject to all confidentiality, copyright and trade secrets rules, intellectual property law and practices of South Africa.
EOH Coastal& Environmental Services East London
16 Tyrell Road East London
5214 +27 43 726 8313
[email protected] www.cesnet.co.za
Also in Grahamstown, Port Elizabeth, Cape Town, Johannesburg & Maputo
Waaihoek Wind Energy Facility, Visual Impact Assessment – November 2014
EOH Coastal & Environmental Services Waaihoek Visual Impact Assessment ii
TABLE OF CONTENTS 1 INTRODUCTION ..................................................................................................................... 1 2 TRIGGERS FOR SPECIALIST VISUAL INPUT ...................................................................... 2 2.1 Selecting appropriate approach for the visual and aesthetic assessment ........................ 2 2.2 Glossary of terms relevant to the VIA .............................................................................. 4
3 VISUAL ASSESSMENT INFORMATION ................................................................................ 4 3.1 Relevant project information ............................................................................................ 4 3.1.1 Details and nature of structures ................................................................................... 4 3.1.2 Other structures and activities ..................................................................................... 4
3.2 Description of the affected physical environment (as described in the Scoping Report) ... 7 3.2.1 Current land use activities ............................................................................................ 7 3.2.2 Climate ........................................................................................................................ 7 3.2.3 Topography ................................................................................................................. 7 3.2.4 Geology ....................................................................................................................... 7 3.2.5 Vegetation and Floristics.............................................................................................. 8 3.2.6 Fauna (excluding birds and bats) ................................................................................. 9 3.2.7 Waaihoek WEF wetlands ............................................................................................. 9 3.2.8 Avifaunal .................................................................................................................... 10 3.2.9 Chiroptera (Bats) ....................................................................................................... 11
3.3 Description of the affected socio-economic environment (as described in the Scoping Report) ...................................................................................................................................... 11 3.3.1 Emadlangeni Local Municipality and Amajuba District Municipality ............................ 11 3.3.2 Demographics ........................................................................................................... 12 3.3.3 Employment ............................................................................................................... 12 3.3.4 Heritage: Culture, History and Archaeology ............................................................... 12 3.3.5 Tourism ..................................................................................................................... 13
4 ASSESSMENT OF IMPACTS ............................................................................................... 14 4.1 Potential visual impacts ................................................................................................. 14 4.2 Visual impact assessment criteria .................................................................................. 14 4.2.1 Visibility of the project ................................................................................................ 15 4.2.2 Visual Sensitivity and Visual Intrusion ........................................................................ 15 4.2.3 Visual exposure and sensitivity of receptors .............................................................. 16
4.3 Assessment of visual impacts from selected observer points. ........................................ 19 4.3.1 Viewshed 1 ................................................................................................................ 20 4.3.2 Viewshed 2 ................................................................................................................ 21 4.3.3 Viewshed 3 ................................................................................................................ 22 4.3.4 Viewshed 4 ................................................................................................................ 23 4.3.5 Viewshed 5 ................................................................................................................ 24 4.3.6 Viewshed 6 ................................................................................................................ 25 4.3.7 Viewshed 7 ................................................................................................................ 26 4.3.8 Viewshed 8 ................................................................................................................ 27 4.3.9 Viewshed 9 ................................................................................................................ 28 4.3.10 Viewshed 10 .......................................................................................................... 29
4.4 Distance: Diminishing Impact......................................................................................... 30 5 ASSESSMENT OF SIGNIFICANCE ..................................................................................... 31 5.1 Consideration of alternatives ......................................................................................... 31 5.2 Approach to assessment of significance ........................................................................ 31 5.2.1 Establishing thresholds of significance ....................................................................... 32
5.3 Direct, indirect and cumulative effects ........................................................................... 32 5.4 Assessment ................................................................................................................... 33 5.4.1 Planning and Design Phase: Direct Visual Impacts.................................................... 33 5.4.2 Indirect impacts (all phases) ...................................................................................... 35
5.5 Mitigation Measures ...................................................................................................... 35 5.5.1 Mitigation against lighting ........................................................................................... 35 5.5.2 Mitigation against visual intrusion in the landscape .................................................... 35
5.6 Beneficiaries and losers in regard to impacts ................................................................. 35 6 CONCLUSIONS AND RECOMMENDED MANAGEMENT ACTIONS .................................. 35

Waaihoek Wind Energy Facility, Visual Impact Assessment – July 2014
Coastal & Environmental Services Waaihoek Visual Impact Assessment iii
LIST OF FIGURES Figure 1: Example of wind turbines - Darling Wind Farm, Western Cape, South Africa. .................................... 5 Figure 2: Aerial view of the Waaihoek Wind Energy Facility illustrated using 3D models generated on
SketchUp. ......................................................................................................................................................... 6 Figure 3: Visibility of the Waaihoek WEF within 10km of the proposed development ...................................... 18
LIST OF TABLES Table 1: Key to categories of Development ........................................................................................................... 2 Table 2: Categorization of issues to be addressed by the visual assessment (DEA&DP Guidelines) .............. 2 Table 3: Description of the key categories of visual impact expected. ................................................................. 3
Waaihoek Wind Energy Facility, Visual Impact Assessment – November 2014
EOH Coastal & Environmental Services Waaihoek Visual Impact Assessment 1
1 INTRODUCTION One of the issues identified during the scoping phase of the proposed Waaihoek Wind Energy Facility (WEF) Environmental Assessment process was the visual impact of the proposed development on the landscape. A Visual Impact Assessment (VIA) is therefore included as part of the Environmental Impact Assessment (EIA) process. This report provides specialist visual assessment input into the EIA process relating to the proposed Waaihoek WEF project. The proposed project will include up to 93 wind turbines, with a potential power output of 140 megawatts (MW). Visual, scenic and cultural components of the environment can be seen as a resource, much like any other resource, which has a value to individuals, to society and to the economy of the region. In addition, this resource may have a scarcity value, be easily degraded, and is usually not replaceable. For the purposes of conducting the Visual Assessment, guidance has been taken from the Provincial Government of the Western Cape, Department of Environmental Affairs and Development Planning (DEA&DP) Guideline for Involving Visual and Aesthetic Specialists in the EIA Process (Oberholzer, 2005). The Terms of reference for the Visual Impact Assessment are as follows: 1. Conduct a site reconnaissance visit and photographic survey of the proposed project site. 2. Conduct a desk top mapping exercise to establish visual sensitivity:
• Describe and rate the scenic character and sense of place of the area and site. • Establish extent of visibility by mapping the view-sheds and zones of visual influence • Establish visual exposure to viewpoints • Establish the inherent visual sensitivity of the site by mapping slope grades, landforms,
vegetation, special features and land use and overlaying all relevant above map layers to assimilate a visual sensitivity map.
3. Review relevant legislation, policies, guidelines and standards. 4. Preparation of a draft Visual Baseline/Sensitivity report:
• Assessing visual sensitivity criteria such as extent of visibility, the sites inherent sensitivity, visual sensitivity of the receptor‟s, visual absorption capacity of the area and visual intrusion on the character of the area
• Assess the proposed project against the visual impact criteria (visibility, visual exposure, sensitivity of site and receptor, visual absorption capacity and visual intrusion) for the site.
• Assess impacts based on a synthesis of criteria for each site (criteria = nature of impact, extent, duration, intensity, probability and significance)
• Establish mitigation measures/recommendations with regards to minimizing visual risk areas.
The visual impact assessment follows the guidelines set out by Oberholzer (2005): Guidelines for Involving Visual Specialists in EIA processes. These guidelines where issued by the Provincial Government of the Western Cape: DEAD&P.
Waaihoek Wind Energy Facility, Visual Impact Assessment – July 2014
Coastal & Environmental Services Waaihoek Visual Impact Assessment 2
2 TRIGGERS FOR SPECIALIST VISUAL INPUT The DEA&DP guideline suggests various triggers for conducting a VIA. With respect to the proposed Waaihoek WEF, a number of aspects of the development may trigger the need for a VIA. These include: • Areas lying outside a defined urban edge line; • Areas with important vistas or scenic corridors; • Areas with visually prominent ridgelines or skylines; and • Possible visual intrusion in the landscape. The purpose of conducting a visual and aesthetic assessment is to determine: • The visibility of the proposed project; • The potential visual impact on visual/scenic resources; • The nature, extent, duration, magnitude, probability and significance of impacts, as well as
measures to mitigate negative impacts and enhance benefits; and • The character and visual absorption capacity of the landscape.
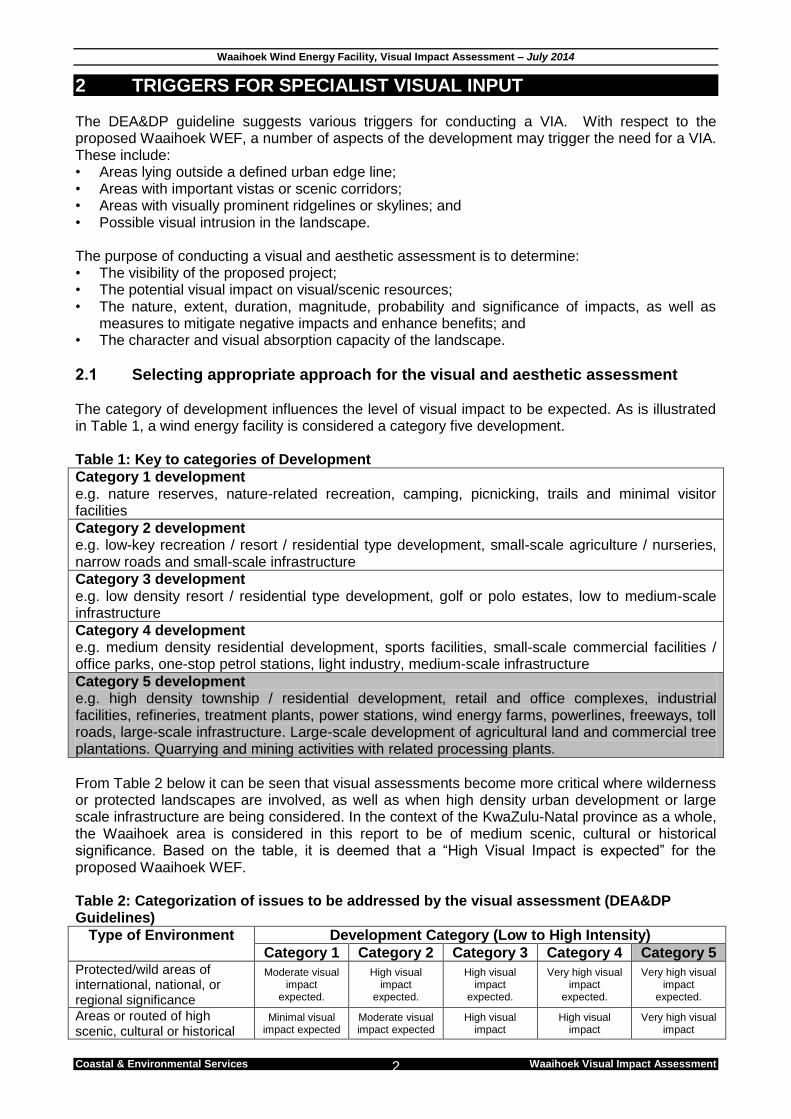
2.1 Selecting appropriate approach for the visual and aesthetic assessment The category of development influences the level of visual impact to be expected. As is illustrated in Table 1, a wind energy facility is considered a category five development. Table 1: Key to categories of Development
Category 1 development e.g. nature reserves, nature-related recreation, camping, picnicking, trails and minimal visitor facilities
Category 2 development e.g. low-key recreation / resort / residential type development, small-scale agriculture / nurseries, narrow roads and small-scale infrastructure
Category 3 development e.g. low density resort / residential type development, golf or polo estates, low to medium-scale infrastructure
Category 4 development e.g. medium density residential development, sports facilities, small-scale commercial facilities / office parks, one-stop petrol stations, light industry, medium-scale infrastructure
Category 5 development e.g. high density township / residential development, retail and office complexes, industrial facilities, refineries, treatment plants, power stations, wind energy farms, powerlines, freeways, toll roads, large-scale infrastructure. Large-scale development of agricultural land and commercial tree plantations. Quarrying and mining activities with related processing plants.
From Table 2 below it can be seen that visual assessments become more critical where wilderness or protected landscapes are involved, as well as when high density urban development or large scale infrastructure are being considered. In the context of the KwaZulu-Natal province as a whole, the Waaihoek area is considered in this report to be of medium scenic, cultural or historical significance. Based on the table, it is deemed that a “High Visual Impact is expected” for the proposed Waaihoek WEF. Table 2: Categorization of issues to be addressed by the visual assessment (DEA&DP Guidelines)
Type of Environment Development Category (Low to High Intensity)
Category 1 Category 2 Category 3 Category 4 Category 5 Protected/wild areas of international, national, or regional significance
Moderate visual impact
expected.
High visual impact
expected.
High visual impact
expected.
Very high visual impact
expected.
Very high visual impact
expected.
Areas or routed of high scenic, cultural or historical
Minimal visual impact expected
Moderate visual impact expected
High visual impact
High visual impact
Very high visual impact
Waaihoek Wind Energy Facility, Visual Impact Assessment – July 2014
Coastal & Environmental Services Waaihoek Visual Impact Assessment 3
significance expected. expected. expected.
Areas or routed of medium scenic, cultural or historical significance.
Little or no visual impact
expected.
Minimal visual impact
expected.
Moderate visual impact
expected.
High visual impact
expected.
High visual impact
expected.
Areas or routes of low scenic, cultural or historical significance / areas which have been disturbed
Little or no visual impact
expected. Possible benefits.
Little or no visual impact
expected.
Minimal visual impact
expected.
Moderate visual impact
expected.
High visual impact
expected.
Disturbed or degraded sites / run-down urban areas / wasteland
Little or no visual impact
expected. Possible benefits.
Little or no visual impact
expected. Possible benefits.
Little or no visual impact
expected.
Minimal visual impact
expected.
Moderate visual impact
expected.
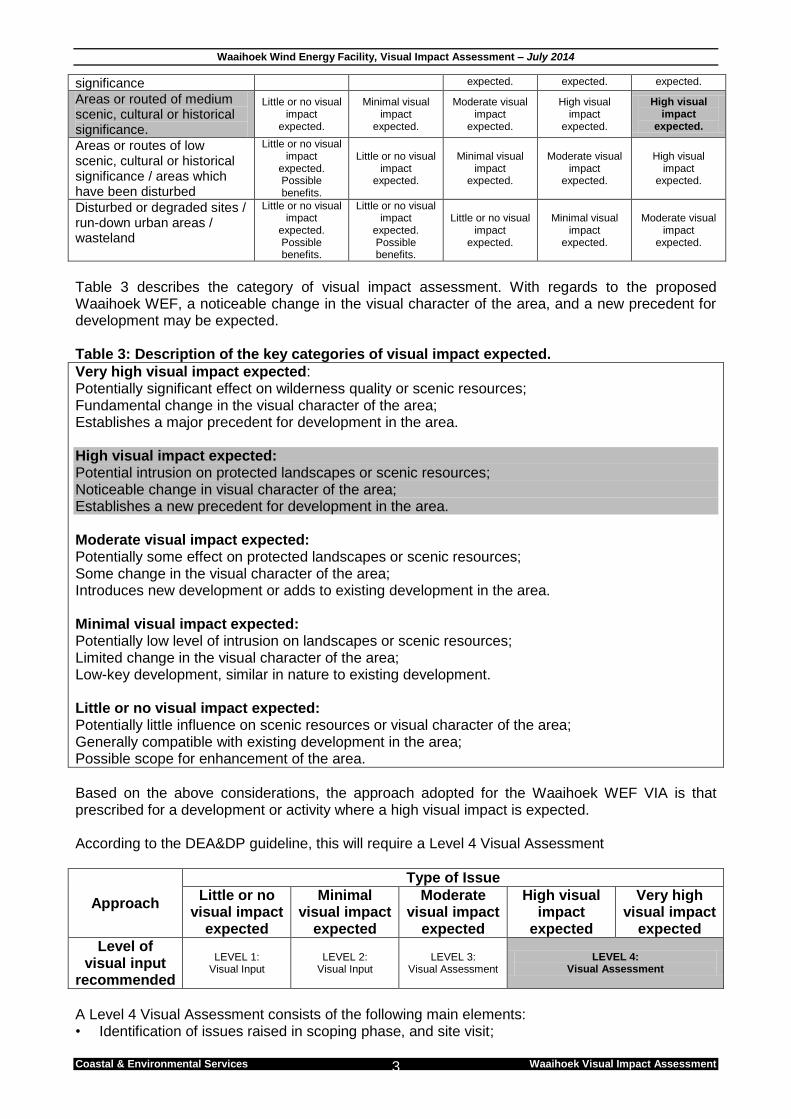
Table 3 describes the category of visual impact assessment. With regards to the proposed Waaihoek WEF, a noticeable change in the visual character of the area, and a new precedent for development may be expected. Table 3: Description of the key categories of visual impact expected.
Very high visual impact expected: Potentially significant effect on wilderness quality or scenic resources; Fundamental change in the visual character of the area; Establishes a major precedent for development in the area. High visual impact expected: Potential intrusion on protected landscapes or scenic resources; Noticeable change in visual character of the area; Establishes a new precedent for development in the area. Moderate visual impact expected: Potentially some effect on protected landscapes or scenic resources; Some change in the visual character of the area; Introduces new development or adds to existing development in the area. Minimal visual impact expected: Potentially low level of intrusion on landscapes or scenic resources; Limited change in the visual character of the area; Low-key development, similar in nature to existing development. Little or no visual impact expected: Potentially little influence on scenic resources or visual character of the area; Generally compatible with existing development in the area; Possible scope for enhancement of the area.
Based on the above considerations, the approach adopted for the Waaihoek WEF VIA is that prescribed for a development or activity where a high visual impact is expected. According to the DEA&DP guideline, this will require a Level 4 Visual Assessment
Approach
Type of Issue
Little or no visual impact
expected
Minimal visual impact
expected
Moderate visual impact
expected
High visual impact
expected
Very high visual impact
expected
Level of visual input
recommended
LEVEL 1: Visual Input
LEVEL 2: Visual Input
LEVEL 3: Visual Assessment
LEVEL 4: Visual Assessment
A Level 4 Visual Assessment consists of the following main elements: • Identification of issues raised in scoping phase, and site visit;
Waaihoek Wind Energy Facility, Visual Impact Assessment – July 2014
Coastal & Environmental Services Waaihoek Visual Impact Assessment 4
• Description of the receiving environment and the proposed project; • Establishment of view catchment area, view corridors, viewpoints and receptors; • Indication of potential visual impacts using established criteria; • Description of alternatives, mitigation measures and monitoring programmes; • 3D modelling and simulations;
2.2 Glossary of terms relevant to the VIA View shed The outer boundary defining a view catchment area, usually along crests and ridgelines. Viewpoint A selected point in the landscape from which views of a particular project or other feature can be obtained. View corridor A linear geographic area, usually along movement routes, that is visible to users of the route. View catchment area A geographic area, usually defined by the topography, within which a particular project or other feature would generally be visible. Sometimes called the visual envelope. Sense of place The unique quality or character of a place, whether natural, rural or urban. Relates to uniqueness, distinctiveness or strong identity. Sometimes referred to as genius loci meaning 'spirit of the place'. Visual absorption capacity The ability of an area to visually absorb development as a result of screening topography, vegetation or structures in the landscape.
3 VISUAL ASSESSMENT INFORMATION
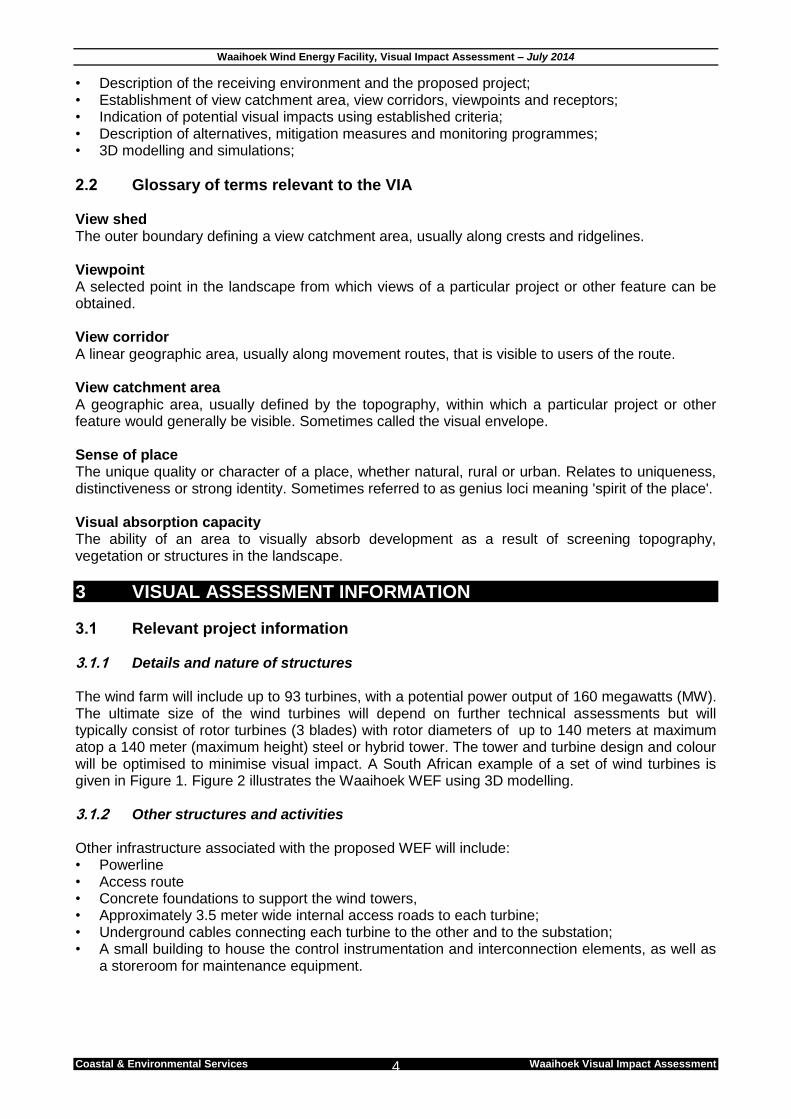
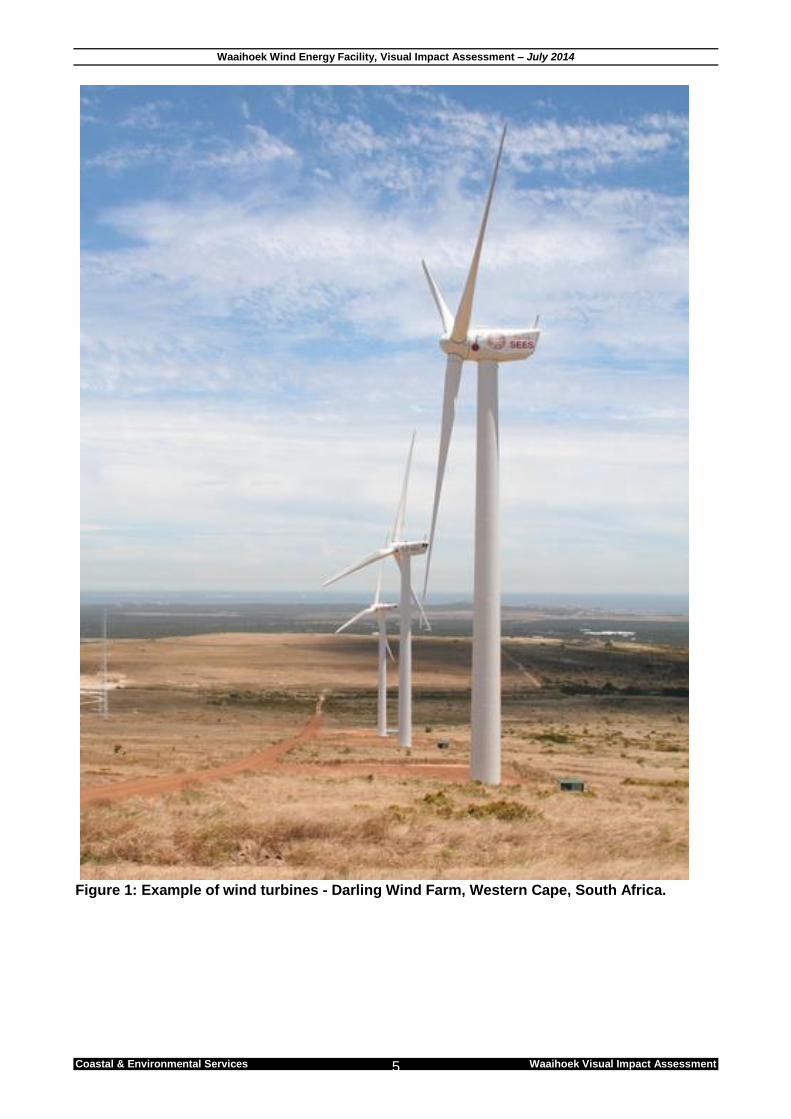
3.1 Relevant project information 3.1.1 Details and nature of structures The wind farm will include up to 93 turbines, with a potential power output of 160 megawatts (MW). The ultimate size of the wind turbines will depend on further technical assessments but will typically consist of rotor turbines (3 blades) with rotor diameters of up to 140 meters at maximum atop a 140 meter (maximum height) steel or hybrid tower. The tower and turbine design and colour will be optimised to minimise visual impact. A South African example of a set of wind turbines is given in Figure 1. Figure 2 illustrates the Waaihoek WEF using 3D modelling. 3.1.2 Other structures and activities Other infrastructure associated with the proposed WEF will include: • Powerline • Access route • Concrete foundations to support the wind towers, • Approximately 3.5 meter wide internal access roads to each turbine; • Underground cables connecting each turbine to the other and to the substation; • A small building to house the control instrumentation and interconnection elements, as well as
a storeroom for maintenance equipment.
Waaihoek Wind Energy Facility, Visual Impact Assessment – July 2014
Coastal & Environmental Services Waaihoek Visual Impact Assessment 5
Figure 1: Example of wind turbines - Darling Wind Farm, Western Cape, South Africa.
Waaihoek Wind Energy Facility, Visual Impact Assessment – November 2014
EOH Coastal & Environmental Services Waaihoek Visual Impact Assessment 6
Figure 2: Aerial view of the Waaihoek Wind Energy Facility illustrated using 3D models generated on SketchUp.
Waaihoek Wind Energy Facility, Utrecht, KwaZulu-Natal
Waaihoek Wind Energy Facility, Visual Impact Assessment – November 2014
EOH Coastal & Environmental Services Waaihoek Visual Impact Assessment 7
3.2 Description of the affected physical environment (as described in the Scoping Report)
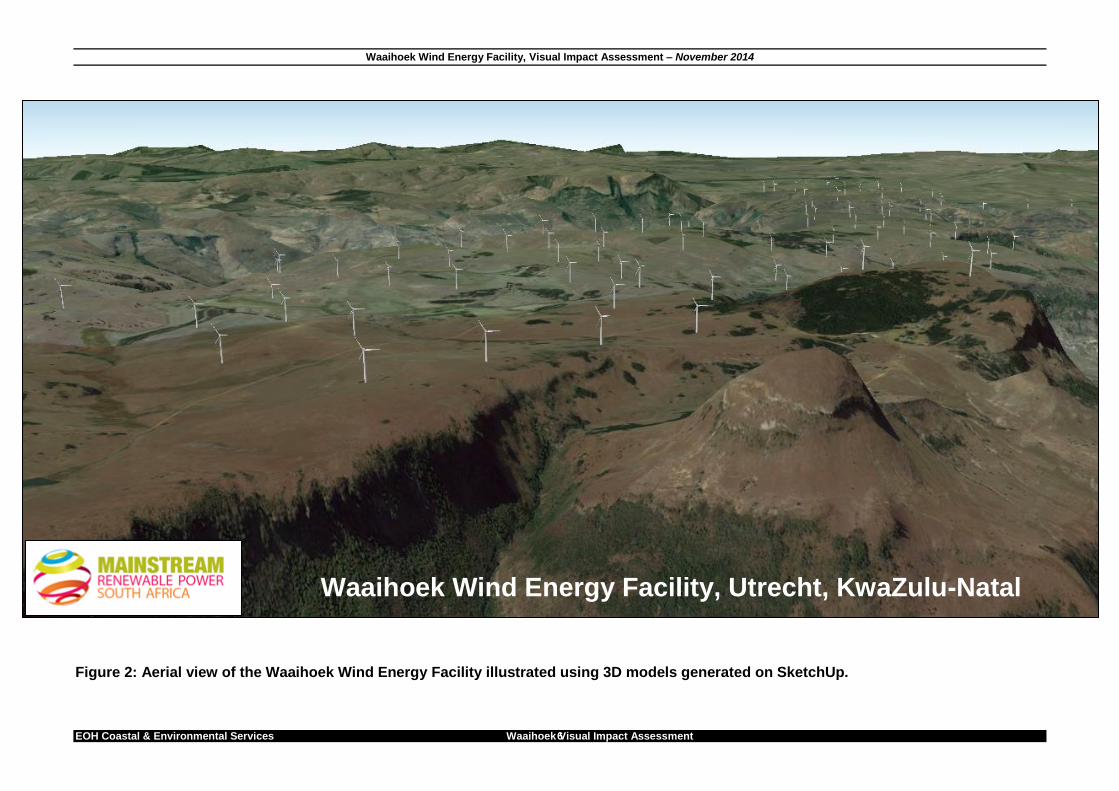
3.2.1 Current land use activities Emadlangeni Local Municipality (ELM) covers an area of approximately 353 931ha, with 85.2% of the area remaining in a natural state and 14.8% of the area having no natural habitat remaining. The ELM is an administrative area in the Amajuba District Municipality of KwaZulu-Natal and is located 52km east of Newcastle and 68km west of Vryheid on the R34. The region concerned with the Waaihoek WEF is mountainous with open grassland and sparse vegetation. A large proportion of the project area is used for agriculture as a mixture of subsistence, commercial livestock and game farming. Along the length of the proposed powerline alternatives and surrounding the Bloedrivier Substation, the land-use can be described as cultivation agriculture, supported by the Brakwater Irrigation Dam. A number of homesteads and a rural school are located within the project area. Land-uses in the landscape adjacent to the proposed Waaihoek WEF include: • A provincial road (R34) to the south of the project area. • Protected area currently operated as a conservancy to the west (Utrecht Balele Community
Game Park). • Eskom powerline servitude to the south of the project area and south of the R34. The closest section of the proposed Waaihoek WEF is approximately 27km west of the Vryheid airport. 3.2.2 Climate Utrecht usually receives about 615mm of rain per year, with most rainfall occurring during mid-summer. Utrecht receives the lowest rainfall (3 mm) in July and the highest (114mm) in January. Average midday temperatures range from 18.7 ºC in June to 26.1 ºC in January. The region is the coldest during July with average temperatures of 2.9 ºC during the night. 3.2.3 Topography The Waaihoek WEF extends from approximately 1700 metres above sea level (masl) to 1265masl and 1220masl. The relief of the properties in this area are mainly upland high lying areas. These upland areas are part of a plateau forming the upper catchment for the Bloedrivier. The powerline alternatives for the proposed Waaihoek WEF occur on lower, gently sloped terrain. 3.2.4 Geology About two thirds of South Africa is covered by sedimentary and volcanic rocks of the Karoo Supergroup which is made up of Volcanics (basalt and rhyolite); Sediments (sandstone, shale, siltstone); and dolerite. According to Figure 6-3 the geology underlaying the proposed Waaihoek WEF consists of the Dwyka Group, Karoo Dolerite, Pietermaritzburg Formation, Volksrust Formation and Vryheid Formation. The latter three Formations form a part of the Ecca Group with Volksrust consisting of shale, Vryheid of sandstone and Pietermaritsburg of shale. Karoo Dolerite is apparent in the form of dykes and sills intruding into the surrounding rock. The Dwyka Group forms the base of the sequence and consists of diamictite. Sandstone and shales are common sedimentary rocks. Sandstones are generally medium-grained clastic rocks composed of rounded or angular fragments of quartz in a cementing matix. Shales consist of clay minerals and tiny fragments of quartz and/or other rock forming minerals. Dwyka tillite is compacted boulder clay of glacial origin.
Waaihoek Wind Energy Facility, Visual Impact Assessment – July 2014
Coastal & Environmental Services Waaihoek Visual Impact Assessment 8
3.2.5 Vegetation and Floristics South African National Biodiversity Institute (SANBI) (Mucina and Rutherford, 2006) The proposed Waaihoek is located in three vegetation types of the grassland biome, namely, Wakkerstroom Montane Grassland (Gm14), Kwazulu-Natal Highland Thornveld (Gs 6) and Income Sandy grassland (Gs 7). A significant portion of the proposed Waaihoek WEF will be located within Wakkerstroom Montane Grassland (Gm14), which is located along the top of the plateau in the project area. This vegetation unit is associated with the Escarpment that links the southern and northern Drakensburg escarpments. The vegetation comprises of short montane grasslands on the relatively flat plateaus, with short forest and Leucosidea thickets occurring along steep, east-facing slopes and drainage areas. L. sericea is the dominant woody pioneer species that invades areas as a result of grazing mismanagement. Wakkerstroom Montane Grassland (Gm14) is classified as LEAST THREATENED by Mucina and Rutherford (2006). Kwazulu-Natal Highland Thornveld (Gs 6), which is located on the lower slopes around the higher-lying plateau, consists of hilly, undulating landscapes and broad valleys supporting tall tussock grassland usually dominated by Hyparrhenia hirta, with occasional savannoid woodlands with scattered Acacia sieberiana var. woodii and in small pockets also with A. karroo and A. nilotica. Kwazulu-Natal Highland Thornveld is classified by Mucina and Rutherford (2006) as LEAST THREATENED. Income Sandy grassland (Gs 7), through which the proposed powerline is routed, is described as very flat extensive areas with generally shallow, poorly drained, sandy soils supporting low, tussock-dominated sourveld forming a mosaic with wooded grasslands (with Acacia sieberiana var. woodii) and on well-drained sites with the A. karroo, A. nilotica, A. caffra and Diospyros lyciodes. On disturbed sites A. sieberiana var. woodii can form sparse woodlands. Aristida congesta, Cynodon dactylon and Microchloa caffra are common on shallow soils. This vegetation type is classified as VULNERABLE according to Mucina and Rutherford (2006). In addition, wetland areas within the project area have also been mapped and classified as Eastern Temperate Freshwater Wetlands (Azf 3). These wetlands usually occur in flat landscapes or shallow depressions filled with temporary water bodies supporting zoned systems of aquatic and hygrophilous vegetation of temporary flooded grasslands and ephemeral herblands. This vegetation type is sensitive. The potential impact of the WEF and associated infrastructure on these and other wetlands in the project area will be assessed. Kwazulu-Natal Systematic Conservation Plan Systematic conservation assessment is the technical, often computer-based, identification of priority areas for conservation. This assessment informs conservation planning and decision-making. Two fundamental inputs for the KZNSCP are landcover and vegetation type. The KwaZulu-Natal Systematic Conservation Plan (KZNSCP) addresses: • Land cover. • The need to identify and map Critical Biodiversity Areas (CBA). • Priorities for conservation in KwaZulu-Natal. The KZNSCP identifies Critical Biodiversity Areas (CBAs) according to irreplaceability criteria and describes three area classifications: • CBA 1 has an irreplaceability index of 1, which means that there are no other locations
identified as alternatives for achieving the conservation targets for one or more biodiversity feature. Special mitigation measures would need to be considered to safeguard this feature. Once these measures are implemented then development could be permitted in the area.
Waaihoek Wind Energy Facility, Visual Impact Assessment – July 2014
Coastal & Environmental Services Waaihoek Visual Impact Assessment 9
• CBA 2 are areas that support high biodiversity, with irreplaceability values between 0.1 - 0.8 which means that there are other locations identified as alternatives for achieving the conservation targets for one or more biodiversity feature, but not many.
• CBA3 is indicative of one or more feature(s) with a high irreplaceability index of 2. This means
that there are more alternative sites within which the targets of conservation can be met. Areas that have not been classified according the analysis, called Biodiversity Areas, are not open for wholesale development as important species are still located within them and should be accounted for in the EIA process. The proposed Waaihoek WEF is located in predominantly in CBA 3 and Biodiversity areas (EKZNW, 2010). Areas of CBA 1 are located in the south-western portion of the project area which may be affected the powerline routes only. 3.2.6 Fauna (excluding birds and bats) Although the Waaihoek WEF project area is currently used for commercial agriculture and is devoid of the large game species, the nature of the agricultural activities is such that ecosystems that support faunal assemblages are still functional. The project area is largely natural grassland, which could support natural populations of various faunal groups. Faunal movement is not restricted, except where farm owners have erected game fences. It is likely that hunting is practiced by local communities, which may have depleted population numbers. Expanding populations of fauna from the Utrecht Balele Community Game Park may move and repopulate depleted areas within the project area. Mammals Although historically present, large mammals (e.g. elephants) are now locally extinct. Small antelope still occur naturally, while some farms have been restocked with game e.g. Waterloo Farm and Paardepoort. Antelope that are currently present in the area include: Eland, Blesbuck, Springbok, Wildebeest, Common Duiker and Grey Rhebok. Reptiles Three main orders of Reptile are present in southern African namely: Crocodylia, Chelonia (tortoises, terrapins and turtles) and Squamata (snakes, lizards, worm lizards). No Chelonia are reported within the project area by Branch (2001). Most reptiles have limited mobility and have specific habitat requirements. Lizards are commonly habitat specific (small ranges), while snakes are food-specific (wider ranges). Amphibians Wetlands within the project area are likely to support a number of amphibian species. No species has been classified as a Red Data List species (Carruthers and du Preez, 2011). 3.2.7 Waaihoek WEF wetlands There are 28 natural wetlands identified in the WEF project area by analysis of the Wetland National Freshwater Ecosystem Priority Areas (NFEPA). The NFEPA has classified the wetlands by using a combination of the wetland vegetation group and level 4 of the National Wetland Classification System (NWCS), which describes the wetland landform, to produce a wetland type. These wetlands may be grouped into clusters considering that they could belong to the same wetland system. In this regard there are 6 wetland systems with 4 smaller individual wetlands. Based on the NWCS the main NFEPA wetland types identified in the proposed Waaihoek WEF are: • Mesic Highveld Grassland Group 8_Flat (10) • Mesic Highveld Grassland Group 8_Seep (7)
Waaihoek Wind Energy Facility, Visual Impact Assessment – July 2014
Coastal & Environmental Services Waaihoek Visual Impact Assessment 10
• Mesic Highveld Grassland Group 8_Depression (3) • Sub-Escarpment Grassland Group 2_Depression (1) • Sub-Escarpment Grassland Group 2_Flat (1) • Sub-Escarpment Grassland Group 2_Seep (1) • Sub-Escarpment Grassland Group 4_Channelled valley-bottom wetland (4) • Sub-Escarpment Grassland Group 4_Flat (2) Mesic Highveld Grasslands are considered to be „sour‟ grasslands and are dominated primarily by andropogonoid grasses. The different grassland units are distinguished on the basis of geology and substrate, as well as elevation, topography and rainfall. The wetland types that are a part of this grassland type occur on high elevations in the study area. • The particular landscape units that are defined in the study area are bench, slope and valley
floor: Bench is defined as an area of mostly level high ground. • Valley floor is considered to be the gently sloping lowest part of a valley. • Slope is defined as an inclined stretch of ground that is not part of a valley floor, typically
located on the side of a mountain, hill or valley. Wetlands defined in the study area are flat, depression, seep and channel valley-bottom wetland: • A Flat is defined as a near level wetland with little or no gradient. The primary source of water
is precipitation with water exiting via evaporation and infiltration. • A depression is a landform with closed elevation contours that increases in depth from the
perimeter to the central area of the greatest depth, where water accumulates. Water sources are precipitation, ground water discharge, interflow and overland flow.
• A hillslope seep is a wetland area located on gently sloping land dominated by the gravity-driven movement of material down-slope. Water input is primarily groundwater or precipitation.
3.2.8 Avifaunal Important Bird Areas (IBA’s) – Birdlife International The selection of Important Bird Areas (IBAs) is achieved through the application of quantitative ornithological criteria, grounded in up-to-date knowledge of the sizes and trends of bird populations. The criteria ensure that the sites selected as IBAs have true significance for the international conservation of bird populations, and provide a common currency that all IBAs adhere to, thus creating consistency among, and enabling comparability between, sites at national, continental and global levels. It is crucial to understand why a site is important, and to do this it is necessary to examine its international significance in terms of the presence and abundance of species that occur there, year round or seasonally. At the global level, a set of four categories and criteria are used to assess the significance of the site. Three IBA‟s occur within the Waaihoek WEF region 1. Grassland Biosphere Reserve The Grassland Biosphere Reserve covers a vast area which is centred on the towns of Volksrust and Wakkerstroom. The proposed Waaihoek WEF project area falls within the southern portions of the reserve. The Grassland Biosphere Reserve comprises some 800 private farms, several municipalities and conservancies and a considerable amount of state-owned land. The area covers several catchments and holds many perennial rivers and wetlands. 2. Chelmsford Nature Reserve Located approximately 45km southwest of the Waaihoek WEF project area, Chelmsford Nature Reserve features a gently undulating landscape with lightly wooded hills and flat-bottomed valleys. The Chelmsford Dam, a large, man-made impoundment, and the Ngagane River, are the dominant features in the area.
Waaihoek Wind Energy Facility, Visual Impact Assessment – July 2014
Coastal & Environmental Services Waaihoek Visual Impact Assessment 11
3. Itala Game Reserve Itala Game Reserve is located approximately 70km east of the Waaihoek WEF project area in the rolling hills south of the Pongola River. Drainage lines and deep valleys, extending predominantly north–south, and opening mostly into the Pongola river basin, cleave the area. This results in an extremely varied topography and rugged terrain, with steep rocky cliff-faces and deep gorges dissected by numerous streams with a network of pools. 3.2.9 Chiroptera (Bats) Bats form part of the Order Chiroptera and are the second largest group of mammals after rodents. Most South African bats are insectivorous and are capable of consuming vast quantities of insects on a nightly basis (Taylor 2000, Tuttle and Hensley 2001) however, they have also been found to feed on amphibians, fruit, nectar and other invertebrates. As a result, insectivorous bats are the predominant predators of nocturnal flying insects in South Africa and contribute greatly to the suppression of these numbers. Their prey also includes agricultural pests such as moths and vectors for diseases such as mosquitoes (Rautenbach 1982, Taylor 2000). Urban development and agricultural practices have contributed to the deterioration of bat populations on a global scale. A mostly negative public perception of bats has detracted from the acknowledgement of their importance as an essential component of ecological systems and their value as natural pest control agents, which actually serves as an advantage to humans. Many bat species roost in large communities and congregate in small areas. Therefore, any major disturbances within and around the roosting areas may adversely impact individuals of different communities, within the same population, concurrently (Hester and Grenier 2005). In addition, nativity rates of bats are much lower than those of most other small mammals. Therefore, bat populations are not able to recover rapidly after mass mortalities and major roost disturbances.
3.3 Description of the affected socio-economic environment (as described in the Scoping Report)
3.3.1 Emadlangeni Local Municipality and Amajuba District Municipality Waaihoek WEF project area falls within the ambit of Emadlangeni Local Municipality (ELM) within the Amajuba District Municipality (ADM). ADM is considered one of the most fertile regions in KZN. The local agricultural sector plays a critical role in the district's and province's economies, especially in terms of production value and employment. Agricultural activities include subsistence farming, forestry, game, cattle, sheep, wheat, soya and, maize. The district is the most important wool producing area in KwaZulu-Natal. ADM offers significant opportunities for tourism investment, including several joint ventures with surrounding districts. The region is close to the majestic Drakensberg Mountains and is an integral part of the internationally renowned Battlefields Route, which focuses on the battles that have sculptured the history of South Africa. ELM, previously known as Utrecht Local Municipality, is located some 52 km east of Newcastle and 68 km west of Vryheid on the R34. The Local Municipality has through demarcation inherited a large rural area, 3 235km2 in extent. It is however the smallest in terms of people in the ADM, with just 6% of the population. Only 10% of people live in urban areas. Established in 1854, Utrecht is one of the oldest towns in KwaZulu-Natal. The land was bought from the Zulu chief, Panda. At the foot of the northern end of the Drakensberg, known as the Balele Mountains, this small valley, with the Encuba River (Schoonstroom), running through it, was chosen by the then settlers for its beauty, peace and tranquillity. There is a dire need for economic development in the ELM. Limited mining occurs while sectors making a notable contribution to the economy of the area include trade, finance and government services, while agriculture is considered to be the most important economic sector. The ADM as a whole has been well developed, with emphasis on commercial stock farming and the region is the most important wool producing area in KwaZulu-Natal. Dry land crop production occurs on a small
Waaihoek Wind Energy Facility, Visual Impact Assessment – July 2014
Coastal & Environmental Services Waaihoek Visual Impact Assessment 12
scale, and just 1 000ha is under irrigation. 3.3.2 Demographics According to StatsSA 2011 census ELM has a total population of approximately 34 442 people with 6 252 households and a population growth rate of 0.65% per year. The average household size is 5.2 people and 38.8% of households are female headed. There has been a population growth of 6% (2 165 people) over the last ten years. This low growth could be attributed to a high mortality rate as well as work migration as the area does not offer much in terms of employment and economic activity. Within the proposed Waaihoek WEF project area the population is characterised by a low density, rural farming community consisting of private farmers and farm managers and the Waaihoek Community Trust. The Waaihoek Community Trust occupies the land through a Regional land Claims Commission that was registered in 1998. In total, 261households and 400 beneficiaries are currently associated with the Waaihoek Community Trust. 3.3.3 Employment According to StatsSA, only 29% of the labour force is employed in the ELM. This represents a 24% decrease in employment from 2001 which was 53%. Of those who are employed, over 99% earn less than R1600. This indicates that almost the entire population falls within the indigent bracket and there is a dire need for economic and infrastructure development which have the capacity to create jobs and enrich the area economically. Currently, the largest industry where males are employed is the agriculture sector followed by manufacturing, and wholesale and retail. Females are mainly employed in community sectors followed by transport, storage and communication; and wholesale and retail. 3.3.4 Heritage: Culture, History and Archaeology History and Culture A desktop assessment of potential historical and cultural sites in the general area has been conducted based on a number of considerations, which are listed below. Cultural heritage sites are categorised as: • Sites within the last 60 years.
o Settlements that are currently inhabited and may or may not have human graves. o Settlements that are recently abandoned and may or may not have human graves. o Older human settlements (between 10 and 60 years) that are abandoned and probably all
have human graves. • Historical.
o Human settlements with graves (older than 60 years). o Colonial farm buildings and their rubbish middens. o Colonial farm walling and cattle byres. o Battle Fields relating to the Anglo-Boer wars or Anglo-Zulu War. o Towns and their buildings. o Features related to the Groot Trek, in this area. o Farm boundaries. o Cemeteries: farm and battlefields.
• Cultural landscape: How people have modified the landscape and/or have special meaning to specific places on the landscape. This will include historical farm walls that occur in the study area, gardens of old houses.
• Oral History: Sites that have significance to local people but have not been recorded. These are normally associated with historical events. No known sites occur in the data base.
• Living Heritage sites are those areas that have (historical) meaning and reference to an individual and/or group of people. These can be tangible and non-tangible areas. No known sites have been recorded.
Waaihoek Wind Energy Facility, Visual Impact Assessment – July 2014
Coastal & Environmental Services Waaihoek Visual Impact Assessment 13
Archaeology Archaeological studies typically include the historical sites in the general area (as described above) and can be further divided into the various time categories: • Historical Period (1820 – 1900) mainly related to non-written/recorded history. • Late Iron Age: Human settlements dating from 1100 ACE – 1820 ACE characterised by circular
stone wall features in the settlements. Engravings can be associated with these settlements. • Late Iron Age and Historical Period sites can occur in overhangs and shelters. • Early Iron Age: 200 ACE – 1100 ACE does not exist in this area. • Late Stone Age: Dating from c. 30 000 – 1100 years ago (in this area. Includes rock art sites,
and people associated with San gatherer-hunters. The sites will occur in overhangs and open fields.
• Middle Stone Age: 250 000 – 30 000 years ago. The sites are mostly found in open fields and consist of stone tools.
• Early Stone Age: 1 million – 250 000 years ago – no sites so far recorded in the area. Sites of importance identified from desktop assessment A number of sites of interest in terms of historical or archaeological interest have been identified in and surrounding the proposed Waaihoek WEF project area. These include: • The Battle of Bloed Rivier Poort is a Provincial Monument with human graves – September
1901. Need to consider the visual impact. • Historical farms such as Paardepoort, Waaihoek, Goedehoop, Slagveld all have original
buildings in various stages of preservation. All built structures over 60 years are automatically protected as are their rubbish middens. Farm buildings will need a permit for any damage and destruction, and this will unlikely be given. Paardepoort is a sensitive area.
• Rock art sites: Four known rock art sites have been recorded. • Monuments: The grave site at Bloed Rivier Poort is a monument. 3.3.5 Tourism The Waaihoek WEF project area forms part of the internationally renowned KwaZulu-Natal Battlefields area of South Africa. The area is rich in history, with names such as Shaka, Winston Churchill, Mahatma Gandhi and General Louis Botha associated with historical records and museums. The legacy of the Zulu Kingdom‟s critical, blood-soaked conflicts is reconciled in this fascinating region's myriad Battlefield sites, historic towns, national monuments and museums. The area is also rich in natural biodiversity areas, including activities such as white- water rafting down the rapids of the Thukela River, sailing on the Chelmsford Dam, and hunting in the designated hunting reserves. The town of Utrecht lies within the confines of the Balele Game Park and the Utrecht Community Game Farm, with a total Game Park area of 2500 ha. All the mountains that surround the town are part of the Game Park and have been stocked with no fewer than 11 species of game including Impala, Blesbuck, Bushbuck, Waterbuck, Nyala, Red Hartebeest, Blue Wildebeest, Kudu, Burchell's Zebra, Warthog and Giraffe. Utrecht‟s game reserve association has, in the last 5 years, brought about a greater awareness of the natural surroundings of the town and has shifted the focus of the town from industry to tourism. The Utrecht Community Game Farm is seen as the core of tourism development in the area. It creates many opportunities for rural tourism and for the manufacturing of arts and crafts in the more remote areas. The conservancy and district offers a variety of experiences that include hiking and horse trails, trout fishing in dams of the pristine Bivane River, birding as well as water sport at the recreation resort. The Chelmsford Nature Reserve has white rhino, wildebeest, zebra, blesbok, springbok and numerous bird species. Within the reserve, Ntshingwayo Dam, the third largest dam in KwaZulu-Natal is an excellent venue for a variety of water sports. The dam is renowned for carp and bass fishing.
Waaihoek Wind Energy Facility, Visual Impact Assessment – July 2014
Coastal & Environmental Services Waaihoek Visual Impact Assessment 14
4 ASSESSMENT OF IMPACTS
4.1 Potential visual impacts The main issues relating to visual and aesthetic impacts can be summarised as follows: • Impacts of design and built-form (e.g. use of building materials, height of structures,
incongruence with surrounding buildings) on aesthetic character of the area: The establishment of wind turbines introduces very large structures of unprecedented height and form;
• Impacts of the overall development on sense of place and sense of privacy of the area; • Impacts of lighting: The proposed facility may be a (cumulative) source of light pollution.
Sources include security lighting at substations and other important infrastructural elements, after hour operational lighting, and aircraft warning lights mounted on the hub of the turbines.
4.2 Visual impact assessment criteria Oberholzer (2005) recommends that the following specific visual impact assessment criteria should be considered. The proposed project should be considered against these criteria before attempting to assess the significance of the visual impacts.
Criteria High Moderate Low
Visibility of the project – the geographic area from which the project will be visible, or view catchment area. (The actual zone of visual influence of the project may be smaller because of screening by existing trees and buildings). This also relates to the number of receptors affected.
High visibility – visible from a large area (e.g. several square kilometres).
Moderate visibility – visible from an intermediate area (e.g. several hectares).
Low visibility – visible from a small area around the project site.
Visual exposure – based on distance from the project to selected viewpoints. Exposure or visual impact tends to diminish exponentially with distance.
High exposure – dominant or clearly noticeable;
Moderate exposure – recognisable to the viewer;
Low exposure – not particularly noticeable to the viewer;
Visual sensitivity of the area – the inherent visibility of the landscape, usually determined by a combination of topography, landform, vegetation cover and settlement pattern. This translates into visual sensitivity.
High visual sensitivity – highly visible and potentially sensitive areas in the landscape.
Moderate visual sensitivity – moderately visible areas in the landscape.
Low visual sensitivity – minimally visible areas in the landscape.
Visual sensitivity of Receptors – The level of visual impact considered acceptable is dependent on the type of receptors.
High sensitivity – e.g. residential areas, nature reserves and scenic routes or trails; road users (distraction risk)
Moderate sensitivity – e.g. sporting or recreational areas, or places of work;
Low sensitivity – e.g. industrial, mining or degraded areas.
Visual absorption capacity (VAC) - the potential of the landscape to conceal the proposed project, i.e.
Low VAC - e.g. little screening by topography or vegetation.
Moderate VAC - e.g. partial screening by topography and vegetation;
High VAC – e.g. effective screening by topography and vegetation;
Visual intrusion – the level of compatibility or congruence of the
High visual intrusion – results
Moderate visual intrusion –
Low visual intrusion –
Waaihoek Wind Energy Facility, Visual Impact Assessment – July 2014
Coastal & Environmental Services Waaihoek Visual Impact Assessment 15
project with the particular qualities of the area, or its 'sense of place'. This is related to the idea of context and maintaining the integrity of the landscape or townscape.
in a noticeable change or is discordant with the surroundings;
partially fits into the surroundings, but clearly noticeable;
minimal change or blends in well with the surroundings.
4.2.1 Visibility of the project As noted above, the visibility of the project refers to the geographic area from which the project will be visible, or view catchment area. (The actual zone of visual influence of the project may be smaller because of screening by landscape features). This also relates to the number of receptors affected. Categories of visibility are given below.
• High visibility – visible from a large area (e.g. several square kilometres). • Moderate visibility – visible from an intermediate area (e.g. several hectares). • Low visibility – visible from a small area around the project site.
Visibility of the Waaihoek WEF: MODERATE Due to the undulating nature of the mountain on which the WEF is proposed
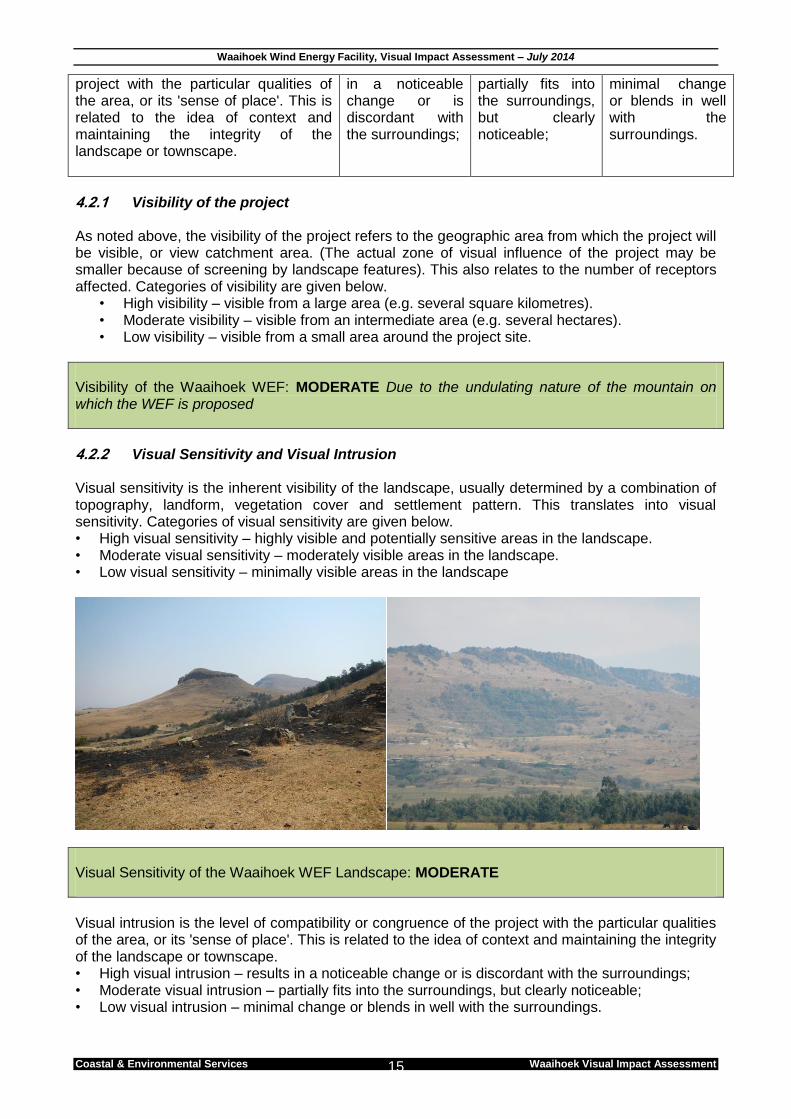
4.2.2 Visual Sensitivity and Visual Intrusion Visual sensitivity is the inherent visibility of the landscape, usually determined by a combination of topography, landform, vegetation cover and settlement pattern. This translates into visual sensitivity. Categories of visual sensitivity are given below. • High visual sensitivity – highly visible and potentially sensitive areas in the landscape. • Moderate visual sensitivity – moderately visible areas in the landscape. • Low visual sensitivity – minimally visible areas in the landscape
Visual Sensitivity of the Waaihoek WEF Landscape: MODERATE
Visual intrusion is the level of compatibility or congruence of the project with the particular qualities of the area, or its 'sense of place'. This is related to the idea of context and maintaining the integrity of the landscape or townscape. • High visual intrusion – results in a noticeable change or is discordant with the surroundings; • Moderate visual intrusion – partially fits into the surroundings, but clearly noticeable; • Low visual intrusion – minimal change or blends in well with the surroundings.
Waaihoek Wind Energy Facility, Visual Impact Assessment – July 2014
Coastal & Environmental Services Waaihoek Visual Impact Assessment 16
Visual Intrusion of the Waaihoek WEF: HIGH
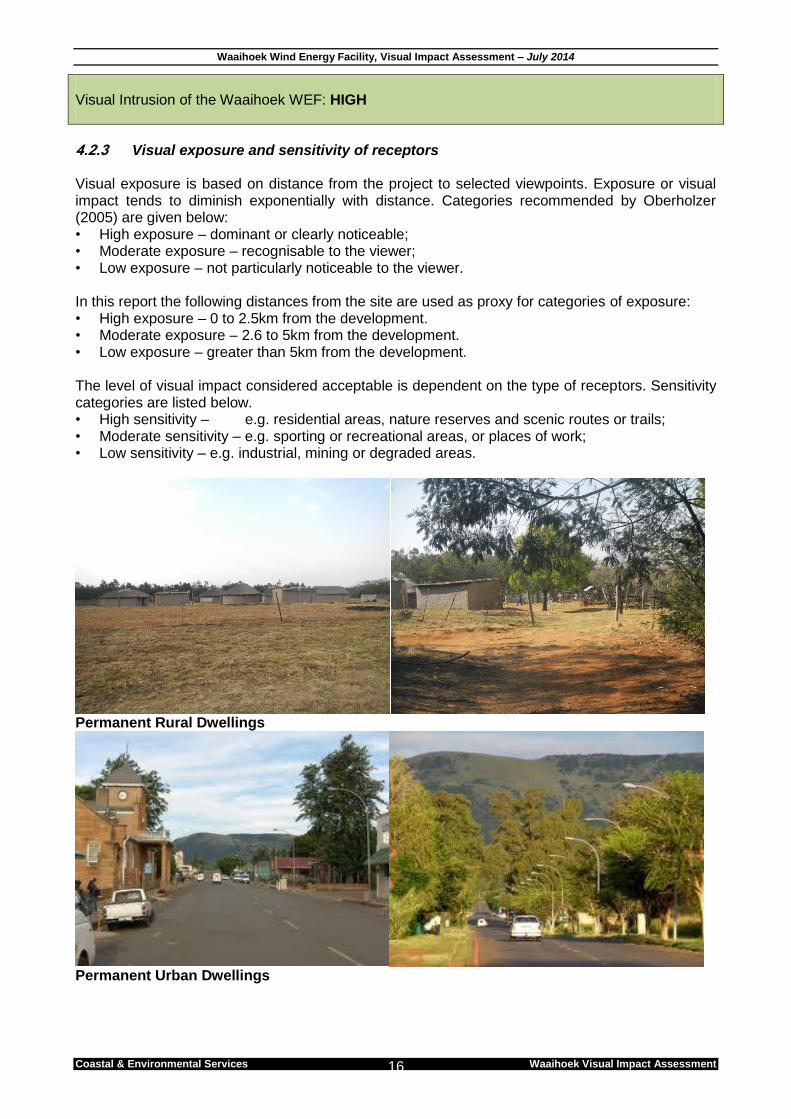
4.2.3 Visual exposure and sensitivity of receptors Visual exposure is based on distance from the project to selected viewpoints. Exposure or visual impact tends to diminish exponentially with distance. Categories recommended by Oberholzer (2005) are given below: • High exposure – dominant or clearly noticeable; • Moderate exposure – recognisable to the viewer; • Low exposure – not particularly noticeable to the viewer. In this report the following distances from the site are used as proxy for categories of exposure: • High exposure – 0 to 2.5km from the development. • Moderate exposure – 2.6 to 5km from the development. • Low exposure – greater than 5km from the development. The level of visual impact considered acceptable is dependent on the type of receptors. Sensitivity categories are listed below. • High sensitivity – e.g. residential areas, nature reserves and scenic routes or trails; • Moderate sensitivity – e.g. sporting or recreational areas, or places of work; • Low sensitivity – e.g. industrial, mining or degraded areas.
Permanent Rural Dwellings
Permanent Urban Dwellings
Waaihoek Wind Energy Facility, Visual Impact Assessment – July 2014
Coastal & Environmental Services Waaihoek Visual Impact Assessment 17
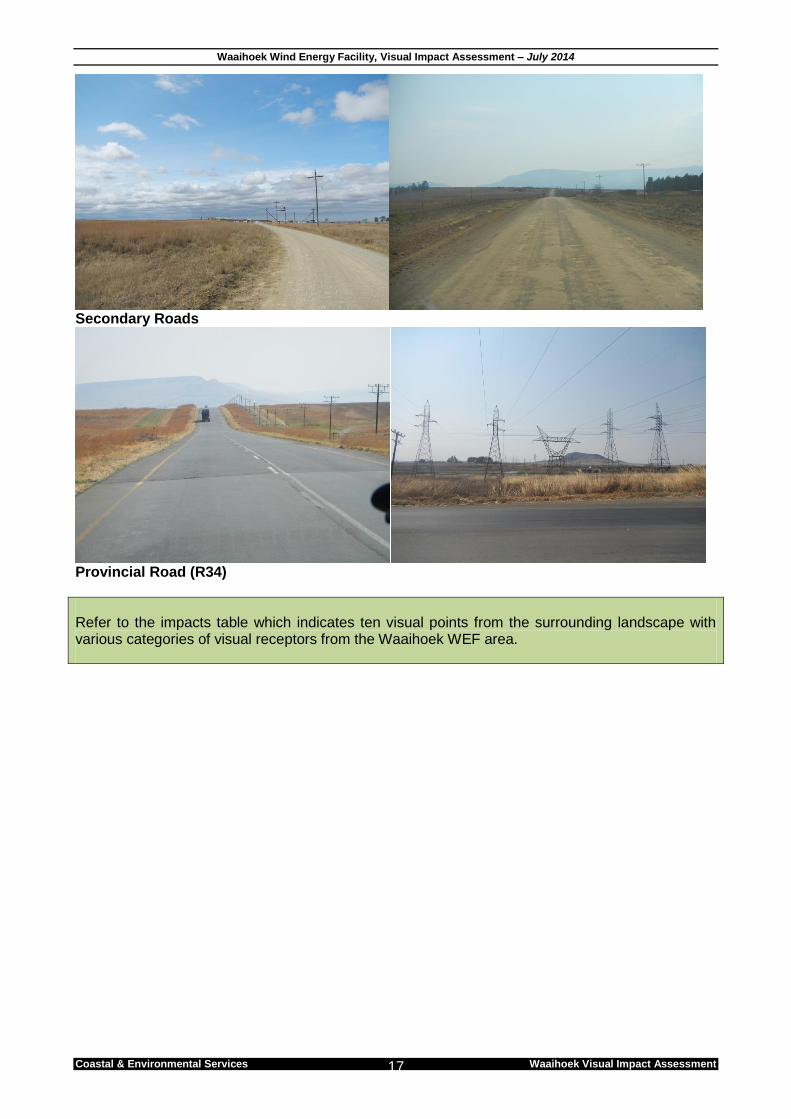
Secondary Roads
Provincial Road (R34)
Refer to the impacts table which indicates ten visual points from the surrounding landscape with various categories of visual receptors from the Waaihoek WEF area.
Waaihoek Wind Energy Facility, Visual Impact Assessment – November 2014
EOH Coastal & Environmental Services Waaihoek Visual Impact Assessment 18
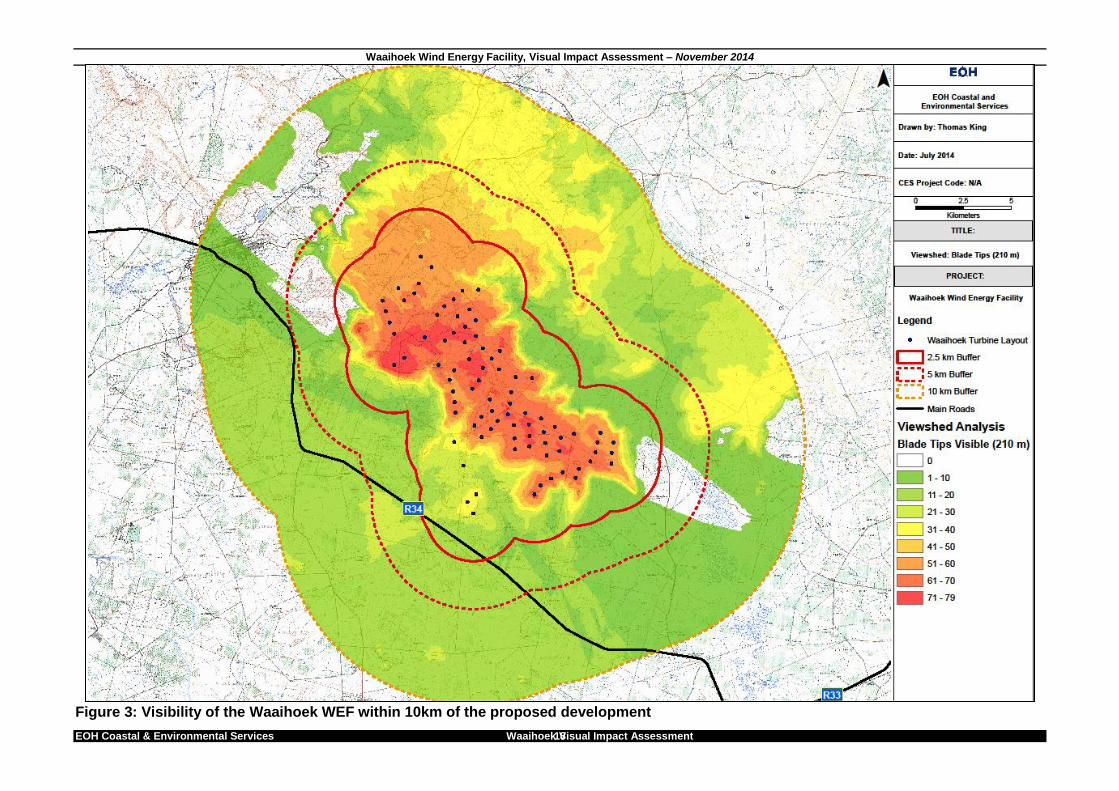
Figure 3: Visibility of the Waaihoek WEF within 10km of the proposed development
Waaihoek Wind Energy Facility, Visual Impact Assessment – November 2014
EOH Coastal & Environmental Services Waaihoek Visual Impact Assessment 19
4.3 Assessment of visual impacts from selected observer points. Ten viewpoints were selected surrounding the Waaihoek WEF site to illustrate the visual impact of the WEF. Figure 3 indicates the full viewshed analysis of the turbine layout from within 10km of the site. This analysis has been refined into ten examples within the area to indicate the difference in visual impact depending on the area, receptors, etc. The ten points were selected to ensure that various points, with different visual receptors, surrounding the entire WEF site were included in the assessment of the overall visual impact of the Waaihoek WEF.
Waaihoek Wind Energy Facility, Visual Impact Assessment – November 2014
EOH Coastal & Environmental Services Waaihoek Visual Impact Assessment 20
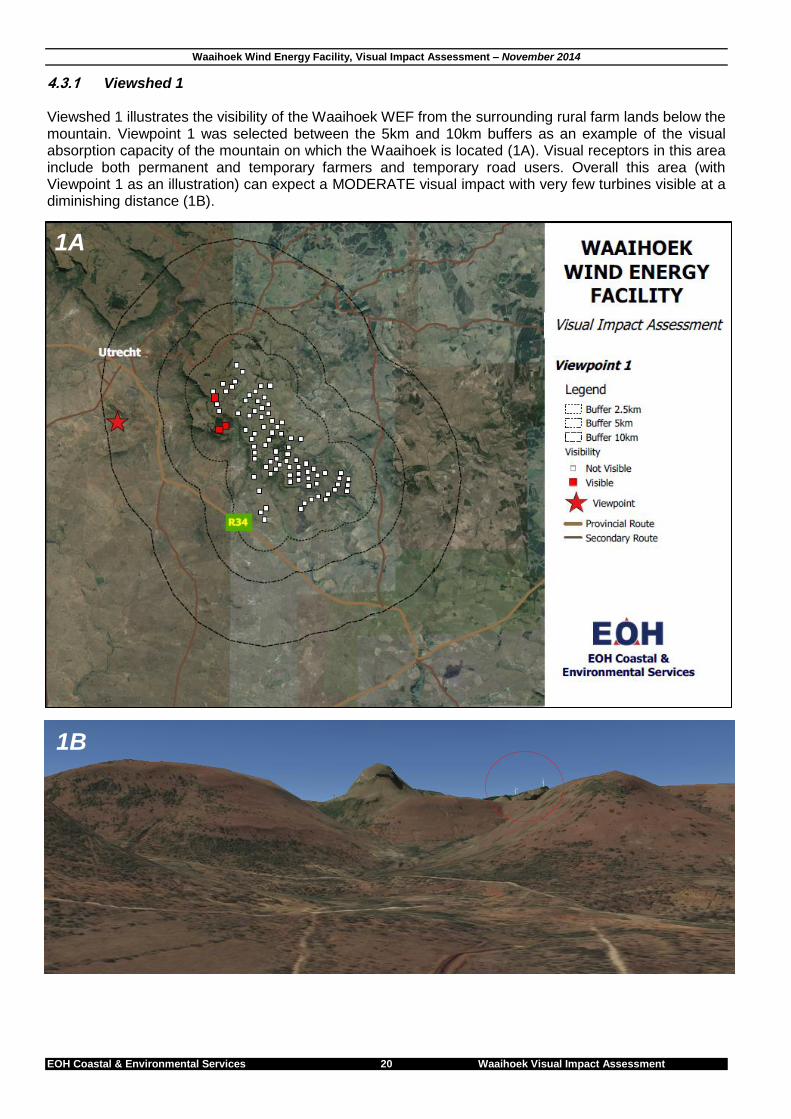
4.3.1 Viewshed 1 Viewshed 1 illustrates the visibility of the Waaihoek WEF from the surrounding rural farm lands below the mountain. Viewpoint 1 was selected between the 5km and 10km buffers as an example of the visual absorption capacity of the mountain on which the Waaihoek is located (1A). Visual receptors in this area include both permanent and temporary farmers and temporary road users. Overall this area (with Viewpoint 1 as an illustration) can expect a MODERATE visual impact with very few turbines visible at a diminishing distance (1B).
1A
1B
Waaihoek Wind Energy Facility, Visual Impact Assessment – July 2014
Coastal & Environmental Services Waaihoek Visual Impact Assessment 21
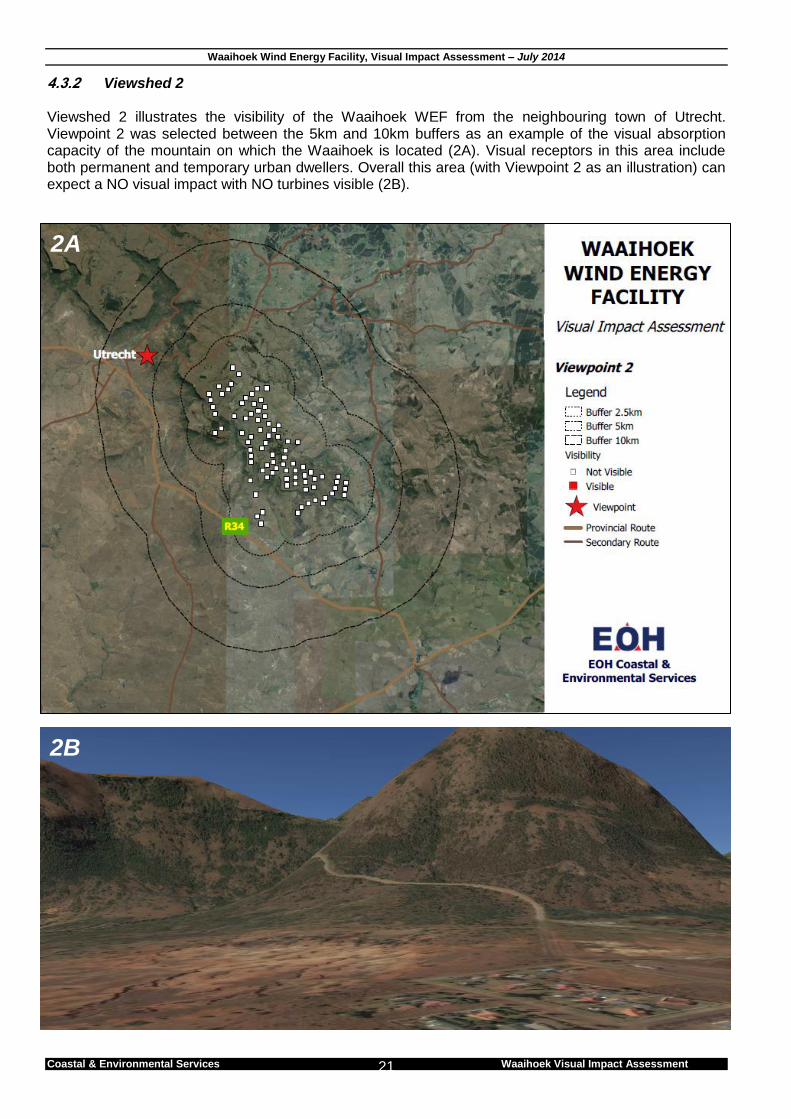
4.3.2 Viewshed 2 Viewshed 2 illustrates the visibility of the Waaihoek WEF from the neighbouring town of Utrecht. Viewpoint 2 was selected between the 5km and 10km buffers as an example of the visual absorption capacity of the mountain on which the Waaihoek is located (2A). Visual receptors in this area include both permanent and temporary urban dwellers. Overall this area (with Viewpoint 2 as an illustration) can expect a NO visual impact with NO turbines visible (2B).
2A
2B
Waaihoek Wind Energy Facility, Visual Impact Assessment – July 2014
Coastal & Environmental Services Waaihoek Visual Impact Assessment 22
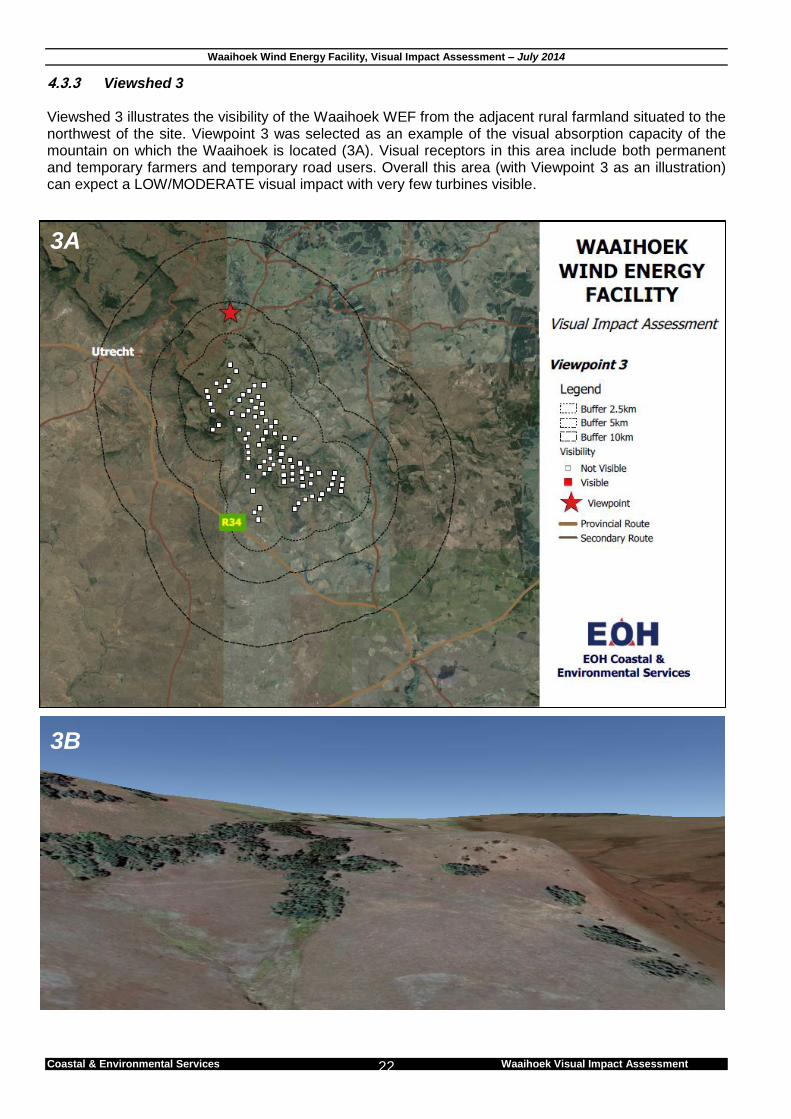
4.3.3 Viewshed 3 Viewshed 3 illustrates the visibility of the Waaihoek WEF from the adjacent rural farmland situated to the northwest of the site. Viewpoint 3 was selected as an example of the visual absorption capacity of the mountain on which the Waaihoek is located (3A). Visual receptors in this area include both permanent and temporary farmers and temporary road users. Overall this area (with Viewpoint 3 as an illustration) can expect a LOW/MODERATE visual impact with very few turbines visible.
3B
3A
Waaihoek Wind Energy Facility, Visual Impact Assessment – July 2014
Coastal & Environmental Services Waaihoek Visual Impact Assessment 23
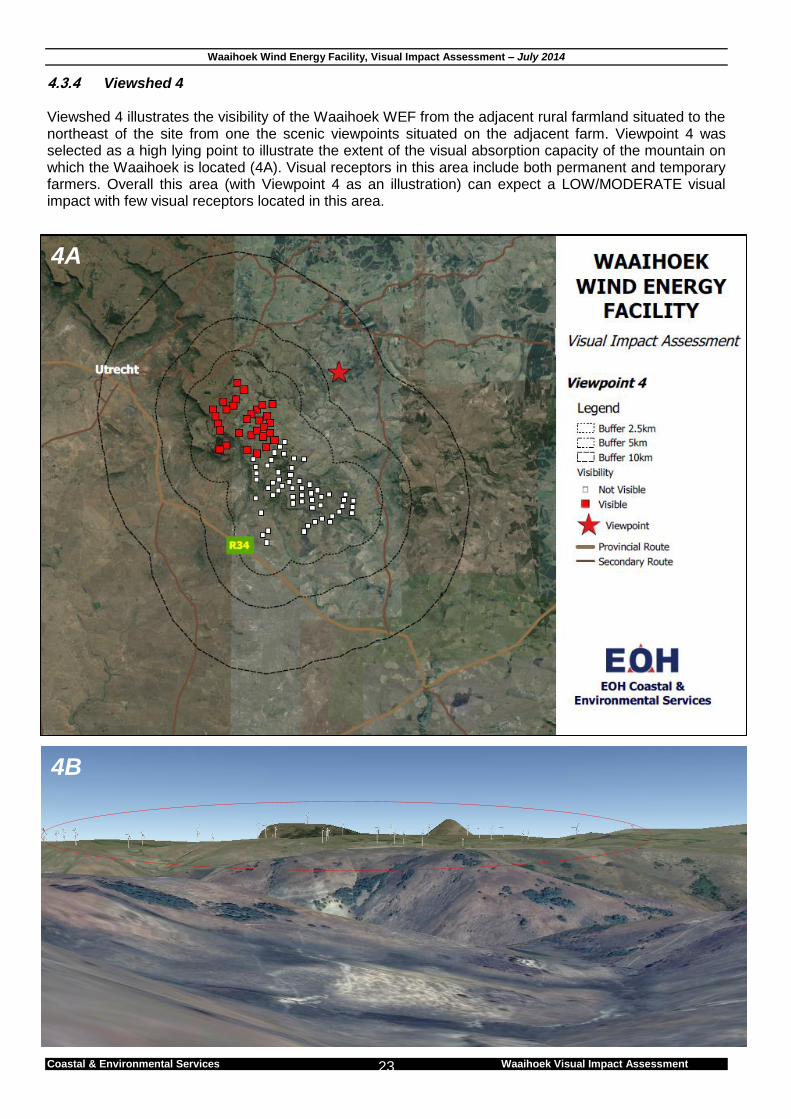
4.3.4 Viewshed 4 Viewshed 4 illustrates the visibility of the Waaihoek WEF from the adjacent rural farmland situated to the northeast of the site from one the scenic viewpoints situated on the adjacent farm. Viewpoint 4 was selected as a high lying point to illustrate the extent of the visual absorption capacity of the mountain on which the Waaihoek is located (4A). Visual receptors in this area include both permanent and temporary farmers. Overall this area (with Viewpoint 4 as an illustration) can expect a LOW/MODERATE visual impact with few visual receptors located in this area.
4B
4A
Waaihoek Wind Energy Facility, Visual Impact Assessment – July 2014
Coastal & Environmental Services Waaihoek Visual Impact Assessment 24
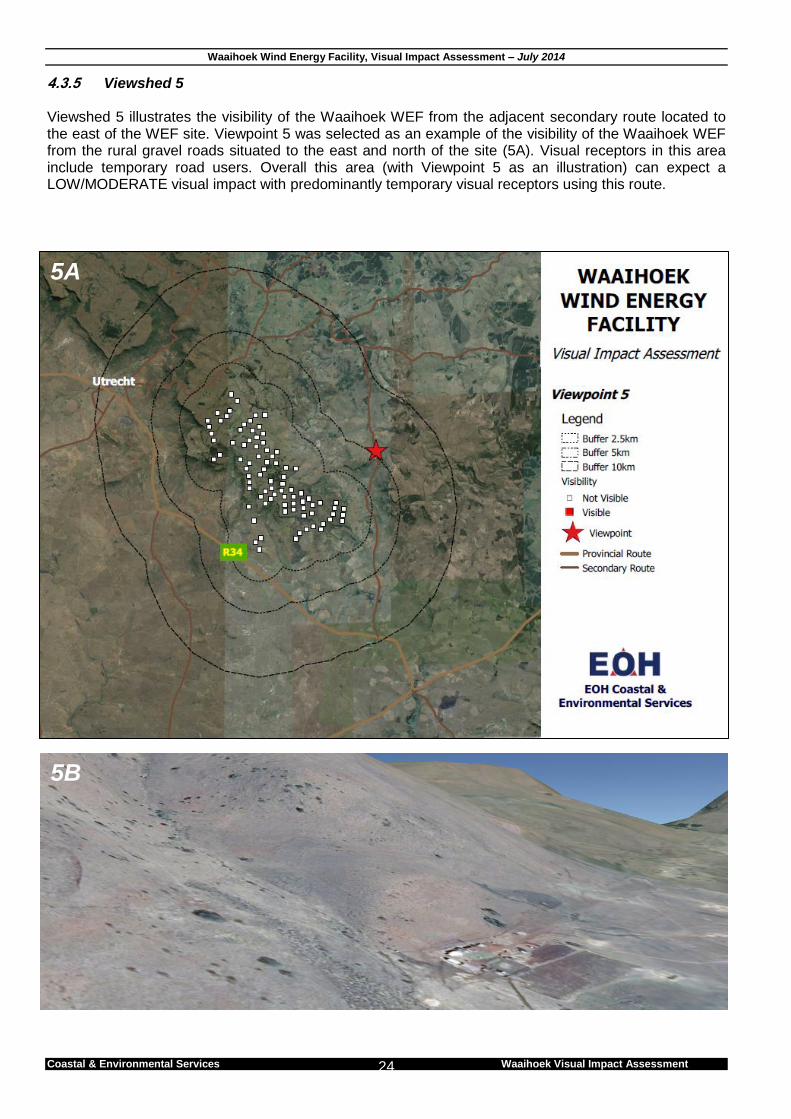
4.3.5 Viewshed 5 Viewshed 5 illustrates the visibility of the Waaihoek WEF from the adjacent secondary route located to the east of the WEF site. Viewpoint 5 was selected as an example of the visibility of the Waaihoek WEF from the rural gravel roads situated to the east and north of the site (5A). Visual receptors in this area include temporary road users. Overall this area (with Viewpoint 5 as an illustration) can expect a LOW/MODERATE visual impact with predominantly temporary visual receptors using this route.
5B
5A
Waaihoek Wind Energy Facility, Visual Impact Assessment – July 2014
Coastal & Environmental Services Waaihoek Visual Impact Assessment 25
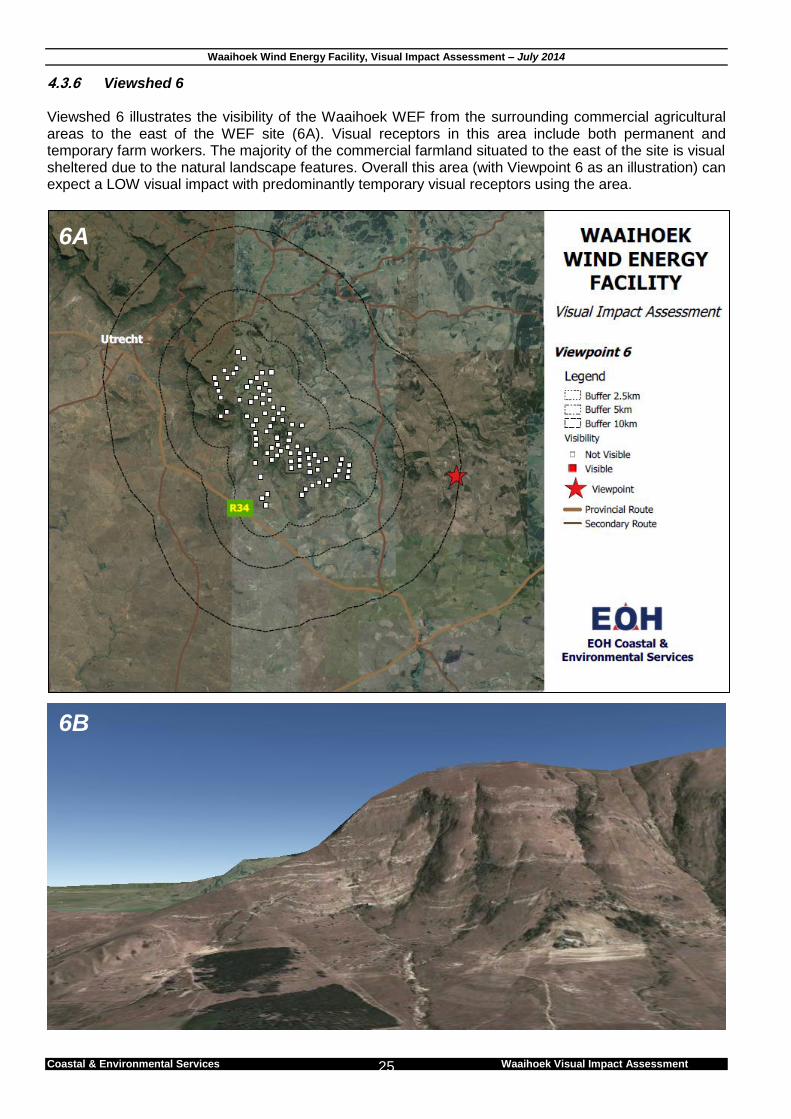
4.3.6 Viewshed 6 Viewshed 6 illustrates the visibility of the Waaihoek WEF from the surrounding commercial agricultural areas to the east of the WEF site (6A). Visual receptors in this area include both permanent and temporary farm workers. The majority of the commercial farmland situated to the east of the site is visual sheltered due to the natural landscape features. Overall this area (with Viewpoint 6 as an illustration) can expect a LOW visual impact with predominantly temporary visual receptors using the area.
6B
6A
Waaihoek Wind Energy Facility, Visual Impact Assessment – July 2014
Coastal & Environmental Services Waaihoek Visual Impact Assessment 26
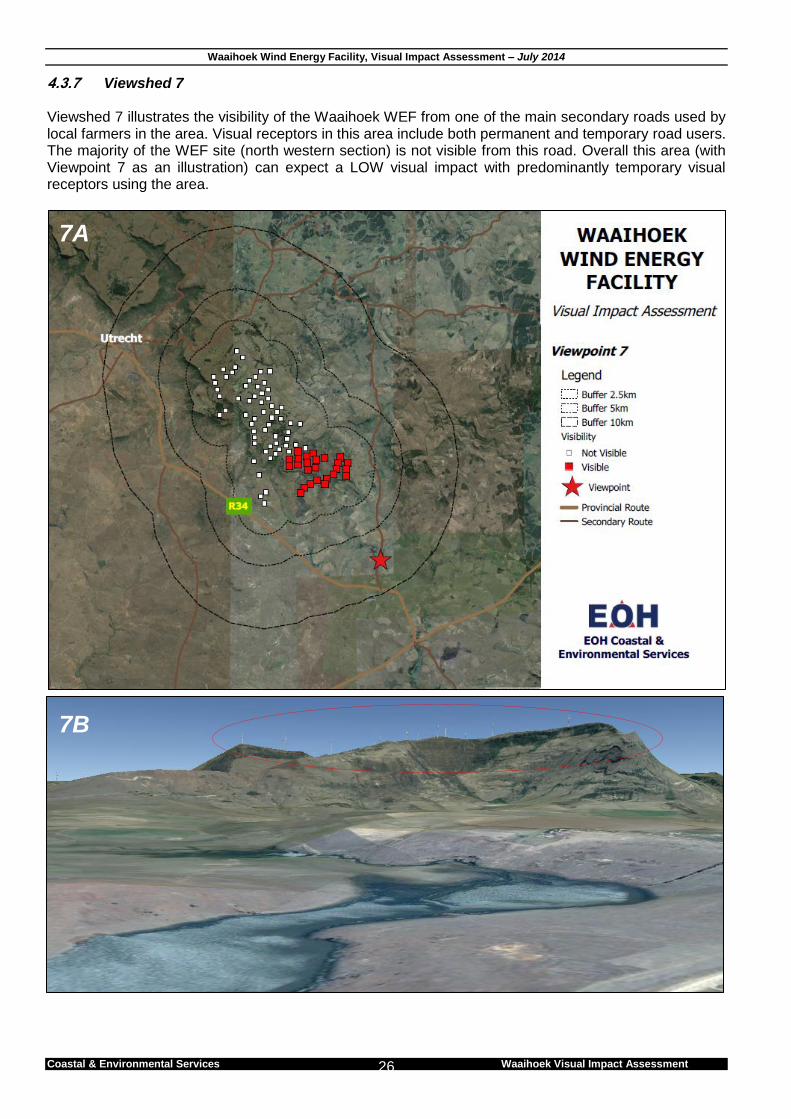
4.3.7 Viewshed 7 Viewshed 7 illustrates the visibility of the Waaihoek WEF from one of the main secondary roads used by local farmers in the area. Visual receptors in this area include both permanent and temporary road users. The majority of the WEF site (north western section) is not visible from this road. Overall this area (with Viewpoint 7 as an illustration) can expect a LOW visual impact with predominantly temporary visual receptors using the area.
7B
7A
Waaihoek Wind Energy Facility, Visual Impact Assessment – July 2014
Coastal & Environmental Services Waaihoek Visual Impact Assessment 27
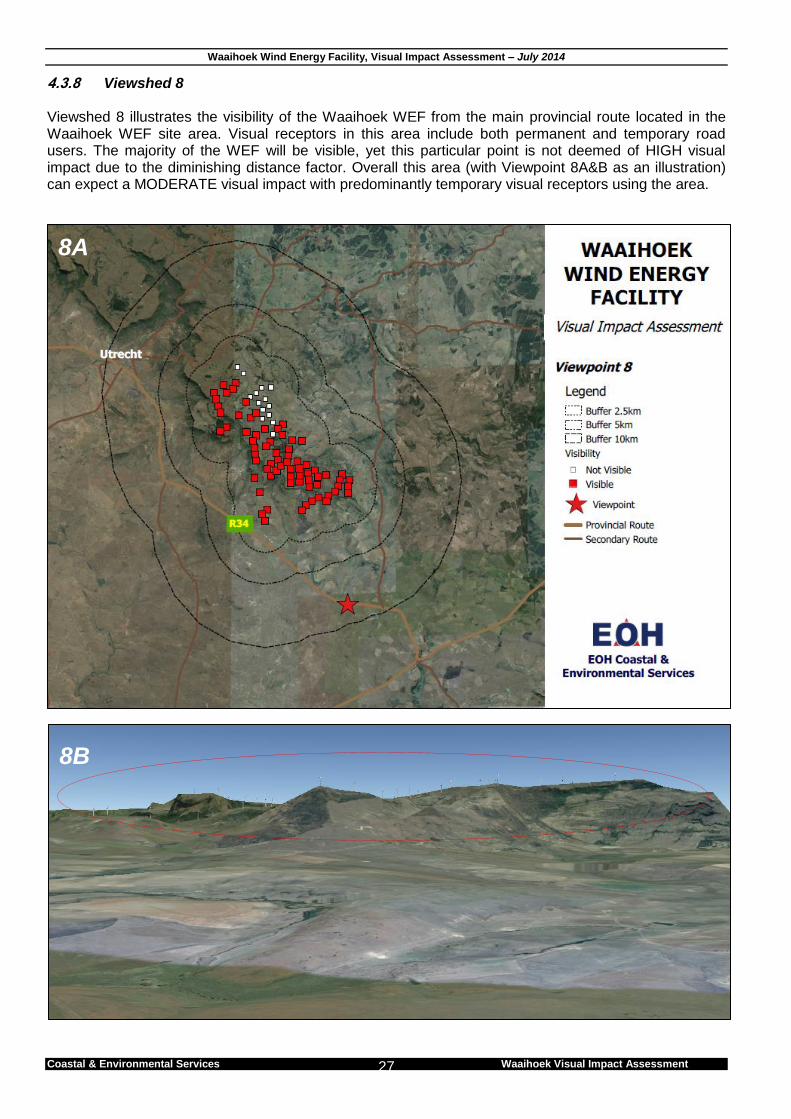
4.3.8 Viewshed 8 Viewshed 8 illustrates the visibility of the Waaihoek WEF from the main provincial route located in the Waaihoek WEF site area. Visual receptors in this area include both permanent and temporary road users. The majority of the WEF will be visible, yet this particular point is not deemed of HIGH visual impact due to the diminishing distance factor. Overall this area (with Viewpoint 8A&B as an illustration) can expect a MODERATE visual impact with predominantly temporary visual receptors using the area.
8B
8A
Waaihoek Wind Energy Facility, Visual Impact Assessment – July 2014
Coastal & Environmental Services Waaihoek Visual Impact Assessment 28
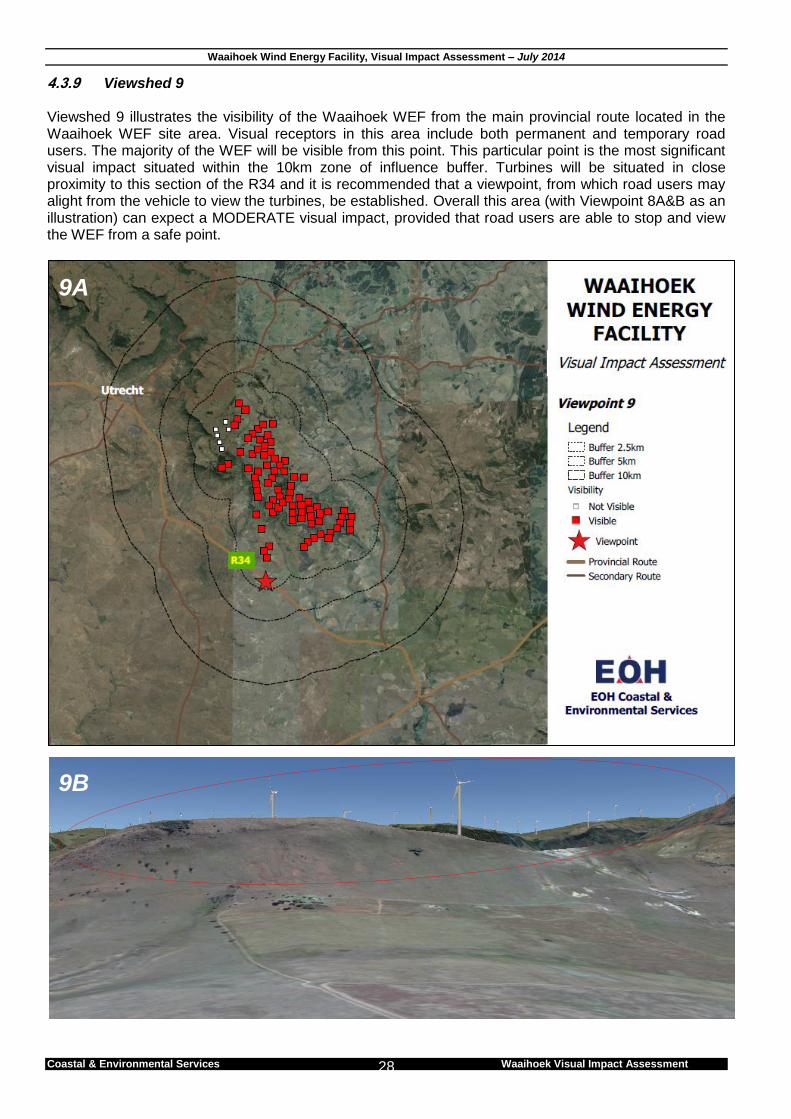
4.3.9 Viewshed 9 Viewshed 9 illustrates the visibility of the Waaihoek WEF from the main provincial route located in the Waaihoek WEF site area. Visual receptors in this area include both permanent and temporary road users. The majority of the WEF will be visible from this point. This particular point is the most significant visual impact situated within the 10km zone of influence buffer. Turbines will be situated in close proximity to this section of the R34 and it is recommended that a viewpoint, from which road users may alight from the vehicle to view the turbines, be established. Overall this area (with Viewpoint 8A&B as an illustration) can expect a MODERATE visual impact, provided that road users are able to stop and view the WEF from a safe point.
9A
9B
Waaihoek Wind Energy Facility, Visual Impact Assessment – July 2014
Coastal & Environmental Services Waaihoek Visual Impact Assessment 29
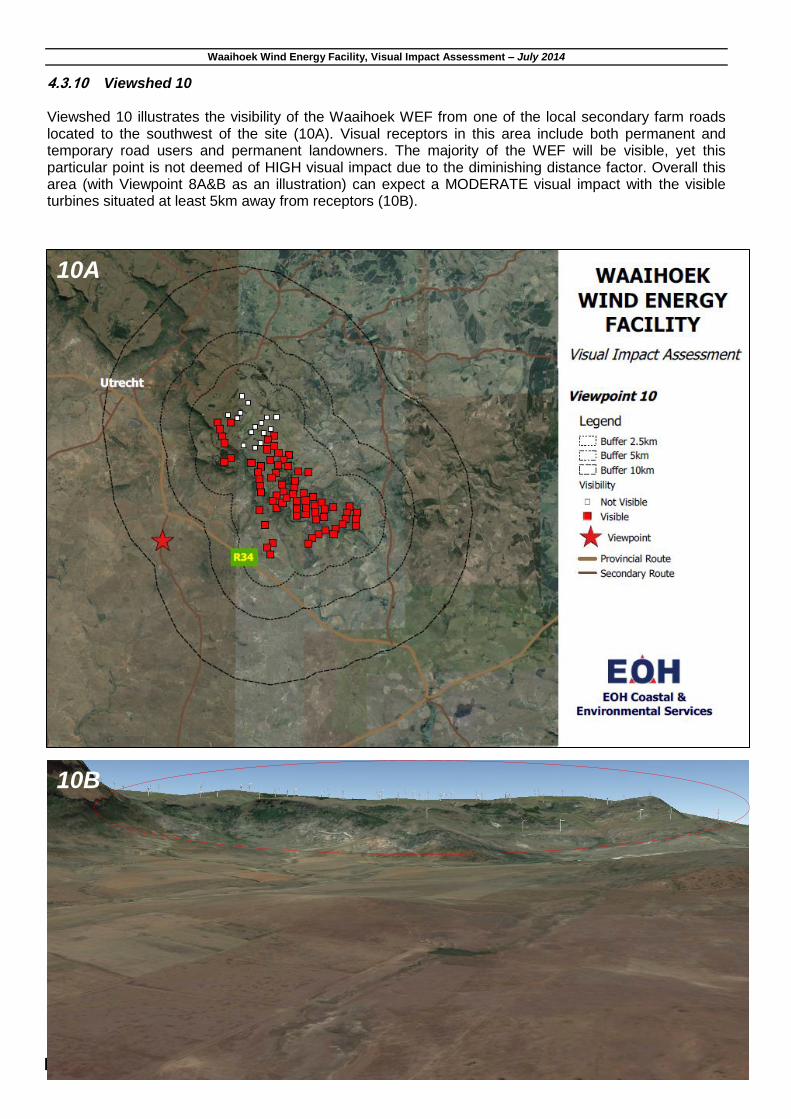
4.3.10 Viewshed 10 Viewshed 10 illustrates the visibility of the Waaihoek WEF from one of the local secondary farm roads located to the southwest of the site (10A). Visual receptors in this area include both permanent and temporary road users and permanent landowners. The majority of the WEF will be visible, yet this particular point is not deemed of HIGH visual impact due to the diminishing distance factor. Overall this area (with Viewpoint 8A&B as an illustration) can expect a MODERATE visual impact with the visible turbines situated at least 5km away from receptors (10B).
10B
10A
Waaihoek Wind Energy Facility, Visual Impact Assessment – November 2014
EOH Coastal & Environmental Services Waaihoek Visual Impact Assessment 30
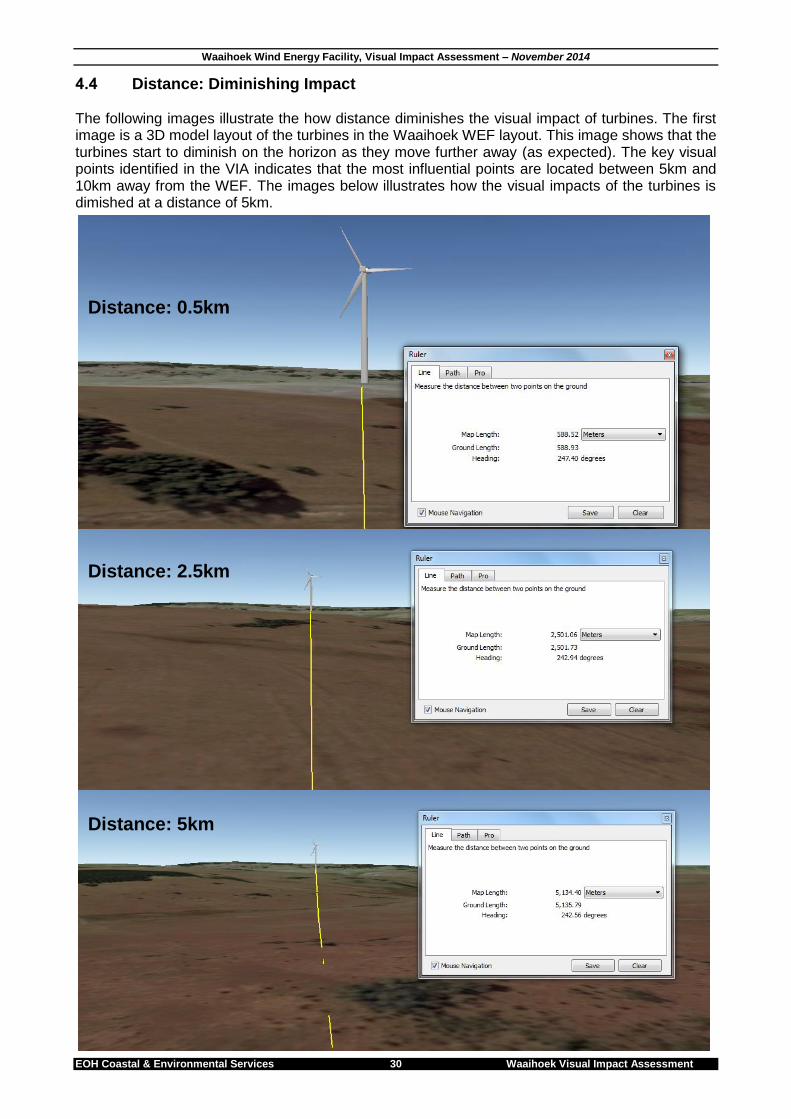
4.4 Distance: Diminishing Impact The following images illustrate the how distance diminishes the visual impact of turbines. The first image is a 3D model layout of the turbines in the Waaihoek WEF layout. This image shows that the turbines start to diminish on the horizon as they move further away (as expected). The key visual points identified in the VIA indicates that the most influential points are located between 5km and 10km away from the WEF. The images below illustrates how the visual impacts of the turbines is dimished at a distance of 5km.
Distance: 0.5km
Distance: 2.5km
Distance: 5km
Waaihoek Wind Energy Facility, Visual Impact Assessment – July 2014
Coastal & Environmental Services Waaihoek Visual Impact Assessment 31
5 ASSESSMENT OF SIGNIFICANCE This section analyses the specific issues associated with the proposed Waaihoek WEF and assesses the significance of impacts pre- and post-mitigation.
5.1 Consideration of alternatives Integral to the EIA process is the consideration and evaluation of alternatives to the proposed development plan. This is also applicable when conducting specialist studies including visual impact assessments. In the case of the proposed Waaihoek WEF, the following “alternatives” are relevant: • No development The “no-development” option should always be considered as an alternative. This is not automatically the optimal environmental option, as a site may not have intrinsic conservation value. In addition, from a socio-economic perspective a development of the site may contribute to some extent to socio-economic upliftment through, for example local investment in the area. In the case of the Waaihoek WEF, the development can have local job-creation benefits, while at the same time adding to the energy security of the region.
5.2 Approach to assessment of significance Criteria used for the assessment of visual significance are detailed below: Criteria used for the assessment of impacts Nature of the impact - an appraisal of the visual effect the activity would have on the receiving environment. This description should include visual and scenic resources that are affected, and the manner in which they are affected, (both positive and negative effects). Extent – the spatial or geographic area of influence of the visual impact, i.e.:
- site-related: extending only as far as the activity;
- local: limited to the immediate surroundings;
- regional: affecting a larger metropolitan or regional area;
- national: affecting large parts of the country;
- international: affecting areas across international boundaries. Duration - the predicted life-span of the visual impact:
- short term, (e.g. duration of the construction phase);
- medium term, (e.g. duration for screening vegetation to mature);
- long term, (e.g. lifespan of the project);
- permanent, where time will not mitigate the visual impact. Intensity – the magnitude of the impact on views, scenic or cultural resources.
- low, where visual and scenic resources are not affected;
- medium, where visual and scenic resources are affected to a limited extent;
- high, where scenic and cultural resources are significantly affected. Probability – the degree of possibility of the visual impact occurring:
- improbable, where the possibility of the impact occurring is very low;
- probable, where there is a distinct possibility that the impact will occur;
- highly probable, where it is most likely that the impact will occur; or
- definite, where the impact will occur regardless of any prevention measures. Significance – The significance of impacts can be determined through a synthesis of the aspects produced in terms of their nature, duration, intensity, extent and probability, and be described as:
Waaihoek Wind Energy Facility, Visual Impact Assessment – July 2014
Coastal & Environmental Services Waaihoek Visual Impact Assessment 32
- low, where it will not have an influence on the decision;
- medium, where it should have an influence on the decision unless it is mitigated; or
- high, where it would influence the decision regardless of any possible mitigation. 5.2.1 Establishing thresholds of significance Oberholzer (2005) notes that thresholds of significance define the level or limit at which point an impact changes from low to medium significance, or medium to high significance. These thresholds are often determined by current societal values which define what would be acceptable or unacceptable to society and may be expressed in the form of legislated standards, guidelines or objectives. However, unlike water quality or air quality, thresholds for visual or scenic quality cannot be easily quantified, as they tend to be abstract, and often relate to cultural values or perceptions. A second difficulty is that natural, rural and urban landscapes are constantly changing, and the assessment will therefore need to consider this in determining the significance of impacts. A third difficulty may be the divergence of opinion on what constitutes 'acceptable' change, by the individual, the community or society in general. The visual assessment should recognise that some change to the landscape over time is inevitable with the expansion of urban areas and introduction of new technologies, such as communication masts. This will have a bearing on significance ratings, particularly in identified growth areas.
5.3 Direct, indirect and cumulative effects The visual impact assessment must also consider potentially significant direct, indirect and cumulative impacts of a proposed activity. Definitions and components of direct, indirect and cumulative effects are given below: • Direct (or primary) effects occur at the same time and in the same space as the activity - for
example, the loss of views through construction of buildings. • Indirect (or secondary) effects occur later in time, or at a different place, from the causal
activity. For example, the construction of power lines leading to a subsequent drop in property values in the surrounding area.
• Cumulative effects can be:
o Additive: the simple sum of all the effects, (e.g. sprawl effect of houses along a scenic route);
o Synergistic: effects interact to produce a total effect greater than the sum of individual effects, (e.g. incremental urban development eventually results in total loss of rural or wilderness character of an area);
o Time crowding: frequent, repetitive impacts on a visual resource at the same time (e.g. constant movement of heavy vehicles through an area).
o Space crowding: high spatial density of impacts on a rural environment (e.g. rapid informal settlement).
Waaihoek Wind Energy Facility, Visual Impact Assessment – November 2014
EOH Coastal & Environmental Services Waaihoek Visual Impact Assessment 33
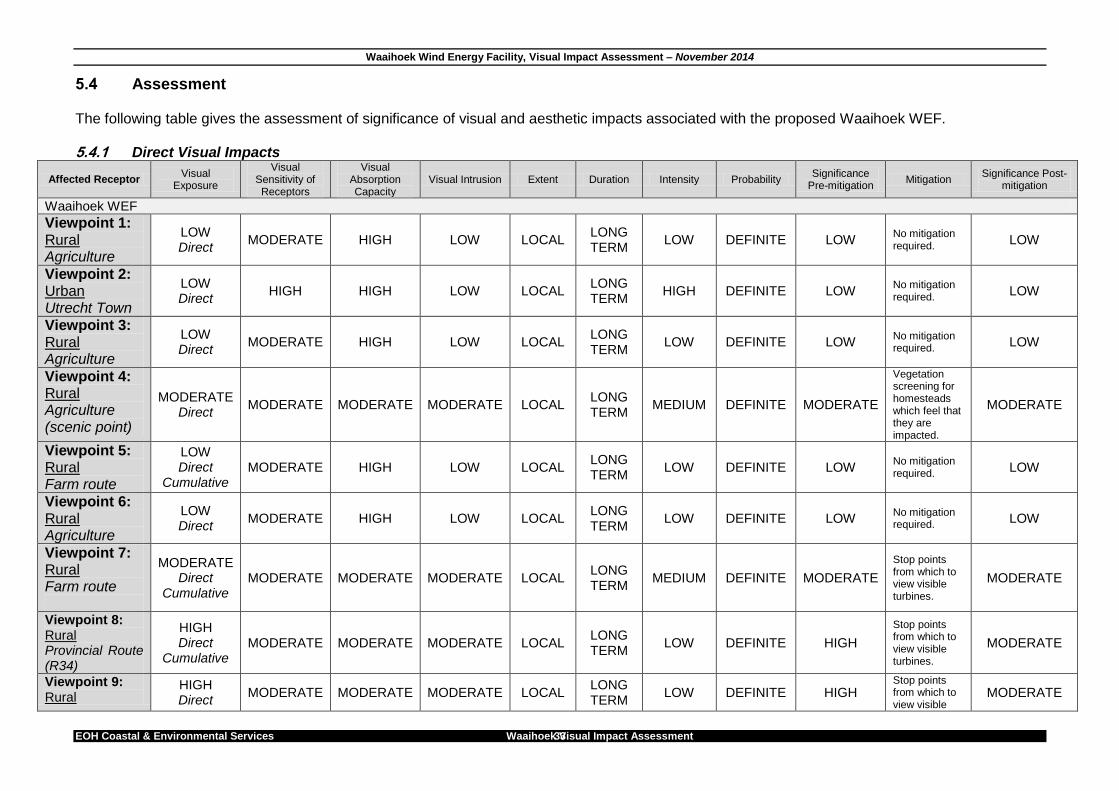
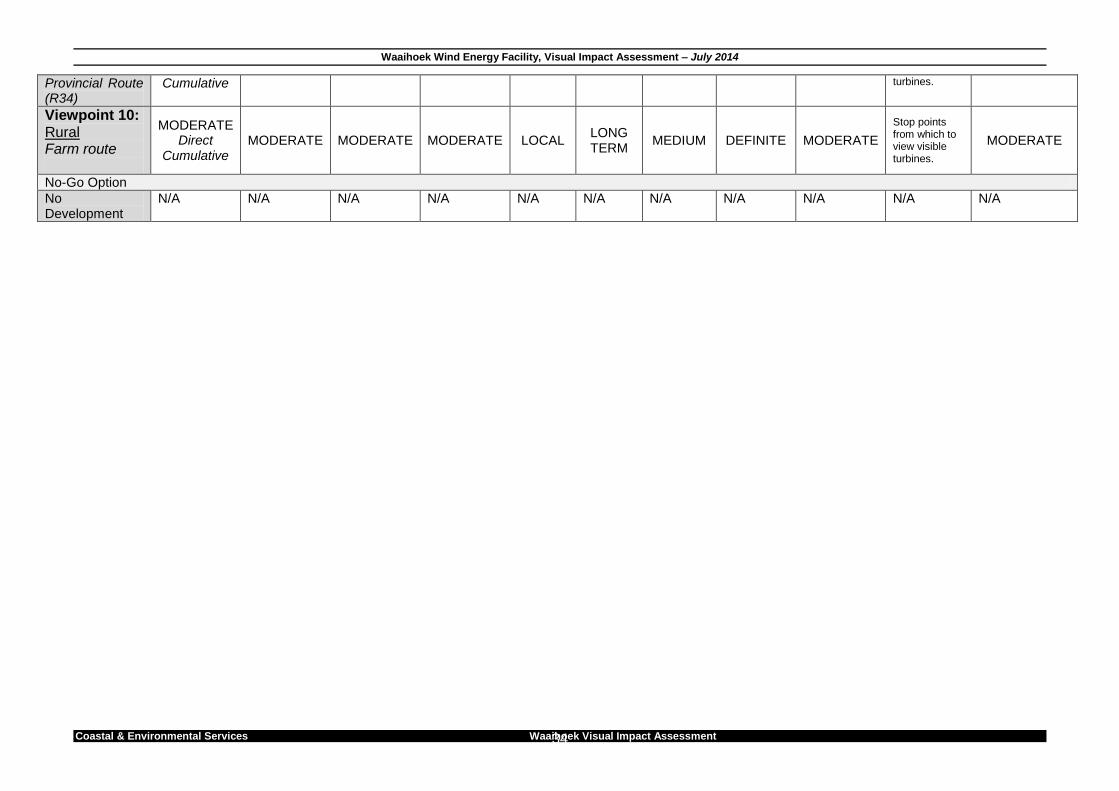
5.4 Assessment The following table gives the assessment of significance of visual and aesthetic impacts associated with the proposed Waaihoek WEF. 5.4.1 Direct Visual Impacts
Affected Receptor Visual
Exposure
Visual Sensitivity of Receptors
Visual Absorption Capacity
Visual Intrusion Extent Duration Intensity Probability Significance
Pre-mitigation Mitigation
Significance Post-mitigation
Waaihoek WEF
Viewpoint 1: Rural Agriculture
LOW Direct
MODERATE HIGH LOW LOCAL LONG TERM
LOW DEFINITE LOW No mitigation required.
LOW
Viewpoint 2: Urban Utrecht Town
LOW Direct
HIGH HIGH LOW LOCAL LONG TERM
HIGH DEFINITE LOW No mitigation required. LOW
Viewpoint 3: Rural Agriculture
LOW Direct
MODERATE HIGH LOW LOCAL LONG TERM
LOW DEFINITE LOW No mitigation required. LOW
Viewpoint 4: Rural Agriculture (scenic point)
MODERATE Direct
MODERATE MODERATE MODERATE LOCAL LONG TERM
MEDIUM DEFINITE MODERATE
Vegetation screening for homesteads which feel that they are impacted.
MODERATE
Viewpoint 5: Rural Farm route
LOW Direct
Cumulative MODERATE HIGH LOW LOCAL
LONG TERM
LOW DEFINITE LOW No mitigation required. LOW
Viewpoint 6: Rural Agriculture
LOW Direct
MODERATE HIGH LOW LOCAL LONG TERM
LOW DEFINITE LOW No mitigation required. LOW
Viewpoint 7: Rural Farm route
MODERATE Direct
Cumulative MODERATE MODERATE MODERATE LOCAL
LONG TERM
MEDIUM DEFINITE MODERATE
Stop points from which to view visible turbines.
MODERATE
Viewpoint 8: Rural Provincial Route (R34)
HIGH Direct
Cumulative MODERATE MODERATE MODERATE LOCAL
LONG TERM
LOW DEFINITE HIGH
Stop points from which to view visible turbines.
MODERATE
Viewpoint 9: Rural
HIGH Direct
MODERATE MODERATE MODERATE LOCAL LONG TERM
LOW DEFINITE HIGH Stop points from which to view visible
MODERATE
Waaihoek Wind Energy Facility, Visual Impact Assessment – July 2014
Coastal & Environmental Services Waaihoek Visual Impact Assessment 34
Provincial Route (R34)
Cumulative turbines.
Viewpoint 10: Rural Farm route
MODERATE Direct
Cumulative MODERATE MODERATE MODERATE LOCAL
LONG TERM
MEDIUM DEFINITE MODERATE
Stop points from which to view visible turbines.
MODERATE
No-Go Option
No Development
N/A N/A N/A N/A N/A N/A N/A N/A N/A N/A N/A
Waaihoek Wind Energy Facility, Visual Impact Assessment – November 2014
EOH Coastal & Environmental Services Waaihoek Visual Impact Assessment 35
5.4.2 Indirect impacts (all phases) The R34 (Provincial Road) runs adjacent to the WEF layout. The turbines may have an indirect impact on motorists who are distracted by the turbine structures.
5.5 Mitigation Measures 5.5.1 Mitigation against lighting Security and operational lighting • Sub-stations and other facilities, where practical, should be situated off the ridgelines so as to
minimise the view catchment of associated lighting. • All lighting should be fitted with deflectors to avoid light spillage and minimise visual impact of
lights at night. The developer should specifically plan the type, placement and direction of lighting to ensure that light pollution is minimised.
5.5.2 Mitigation against visual intrusion in the landscape The proposed facility is large and will ultimately dominate the landscape for those in the immediate vicinity of the development. Considering the size and extent of the facility, the options for “concealing” the development are limited. Recommended mitigation measures may include: • Increase the visual absorption capacity of the landscape around villages in closest proximity to
the development by supporting tree-planting programmes, where practical.
5.6 Beneficiaries and losers in regard to impacts In assessing the significance of impacts, Oberholzer (2005) recommends that beneficiaries and losers be specifically identified. In the case of the Waaihoek WEF, the benefits are likely to be both local and regional in character. Local benefits accrue in terms of job creation and local economic development, including short term and permanent direct jobs (e.g. construction, maintenance and security), and indirect jobs associated with supporting services. Regional and National benefits accrue in regard to energy security (particularly in the context of national energy shortages) and national obligations for the reduction of greenhouse gas emissions.
6 CONCLUSIONS AND RECOMMENDED MANAGEMENT ACTIONS The Waaihoek WEF covers a large area of land which is visible up to 10km away. The development has been positioned in such a way that the structures are sheltered by natural vegetation of the topography of the landscape. The overall visual sensitivity of the site (depending on the visual receptor and the location of the point) varies from LOW to HIGH. However, overall, it is concluded that for all view points, the impact is: • MODERATE, where the impact should have an influence on the decision unless it is mitigated. The assessment of these impacts was undertaken in terms of the following visual assessment criteria: • Visibility of the project; • Visual exposure; • Visual sensitivity of the area; • Visual sensitivity of receptors; • Visual absorption capacity; and • Visual intrusion. The following receptors were identified:
Waaihoek Wind Energy Facility, Visual Impact Assessment – July 2014
Coastal & Environmental Services Waaihoek Visual Impact Assessment 36
• Permanent: o Local landowners o Urban dwellers
• Temporary: o Provincial and secondary road users
In assessing the direct impacts to visual resources, it has been recognised that, although the lifespan of the project is likely to extend for a number of decades, the undulating nature of the mountain plateau on which the Waaihoek WEF, the visual impact will be limited to only a few temporary (R34) and permanent (households on site) individuals. According to the details in this report it can be concluded that the overall visual impact will be MODERATE. The following mitigation measures are recommended: • Lighting:
o Sub-stations and other facilities should, where practical, be situated off the ridgelines so as to minimise the view catchment of the lighting;
o All lighting should be fitted with deflectors to avoid light spillage and minimise visual impact of lights at night. The developer should specifically plan the type, placement and direction of lighting to ensure that light pollution is minimised.
• Visual Intrusion in the Landscape o Increase the visual absorption capacity of the landscape around villages in closest
proximity to the development by supporting tree-planting programmes. o Stop bay from which road users can view the WEF may be constructed to reduce the
risk of distraction while driving. Concluding Statement The development will dominate the visual landscape for those in its immediate proximity. However, • Based on the assessment of significance in this report; • Given that the superstructures are technically removable on decommissioning; • Given certain mitigation recommendations in this report; • Given an understanding that although there are local losses, there are also other local, regional
and national environmental, social and economic gains; and • Given authentic efforts to ensure certain benefits accrue to those in close proximity to the
development;
It is concluded that potential losses of scenic resources are not sufficiently significant to present a fatal flaw to the proposed project.