Embed Size (px)
Citation preview
NEW YORK CITY DEPARTMENT OF TRANSPORTATION 1
Protected Bicycle Lanes in NYC
New York City Department of Transportation – Polly Trottenberg, Commissioner September 2014
NEW YORK CITY DEPARTMENT OF TRANSPORTATION 2 After
Safety
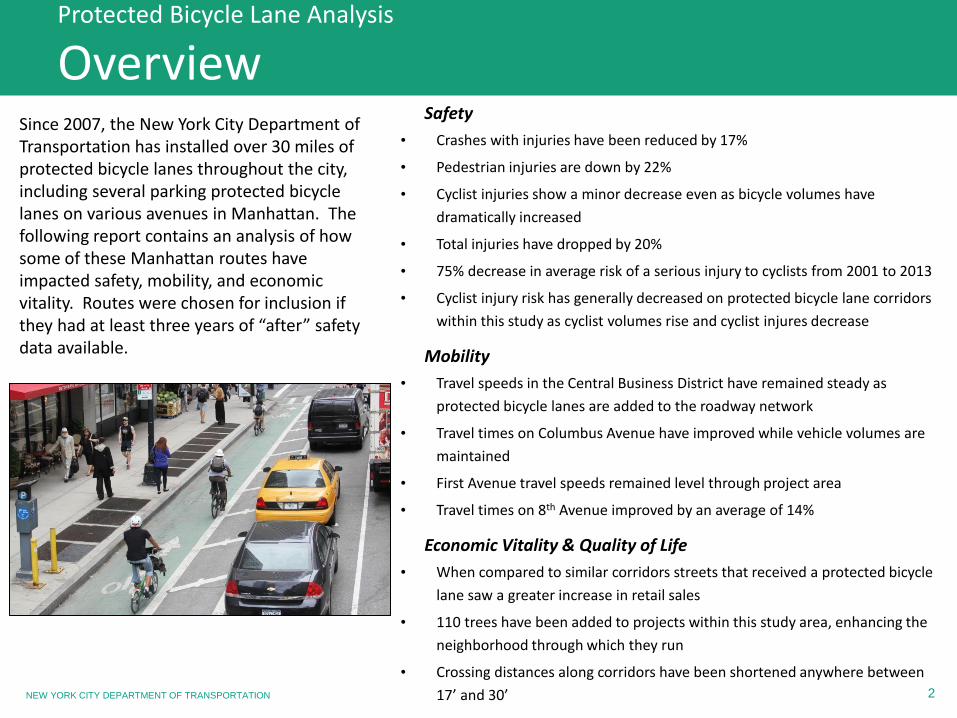
• Crashes with injuries have been reduced by 17%
• Pedestrian injuries are down by 22%
• Cyclist injuries show a minor decrease even as bicycle volumes have
dramatically increased
• Total injuries have dropped by 20%
• 75% decrease in average risk of a serious injury to cyclists from 2001 to 2013
• Cyclist injury risk has generally decreased on protected bicycle lane corridors
within this study as cyclist volumes rise and cyclist injures decrease
Mobility
• Travel speeds in the Central Business District have remained steady as
protected bicycle lanes are added to the roadway network
• Travel times on Columbus Avenue have improved while vehicle volumes are
maintained
• First Avenue travel speeds remained level through project area
• Travel times on 8th Avenue improved by an average of 14%
Economic Vitality & Quality of Life
• When compared to similar corridors streets that received a protected bicycle
lane saw a greater increase in retail sales
• 110 trees have been added to projects within this study area, enhancing the
neighborhood through which they run
• Crossing distances along corridors have been shortened anywhere between
17’ and 30’
Protected Bicycle Lane Analysis
Overview Since 2007, the New York City Department of Transportation has installed over 30 miles of protected bicycle lanes throughout the city, including several parking protected bicycle lanes on various avenues in Manhattan. The following report contains an analysis of how some of these Manhattan routes have impacted safety, mobility, and economic vitality. Routes were chosen for inclusion if they had at least three years of “after” safety data available.
NEW YORK CITY DEPARTMENT OF TRANSPORTATION 3 After
Protected Bicycle Lane Analysis
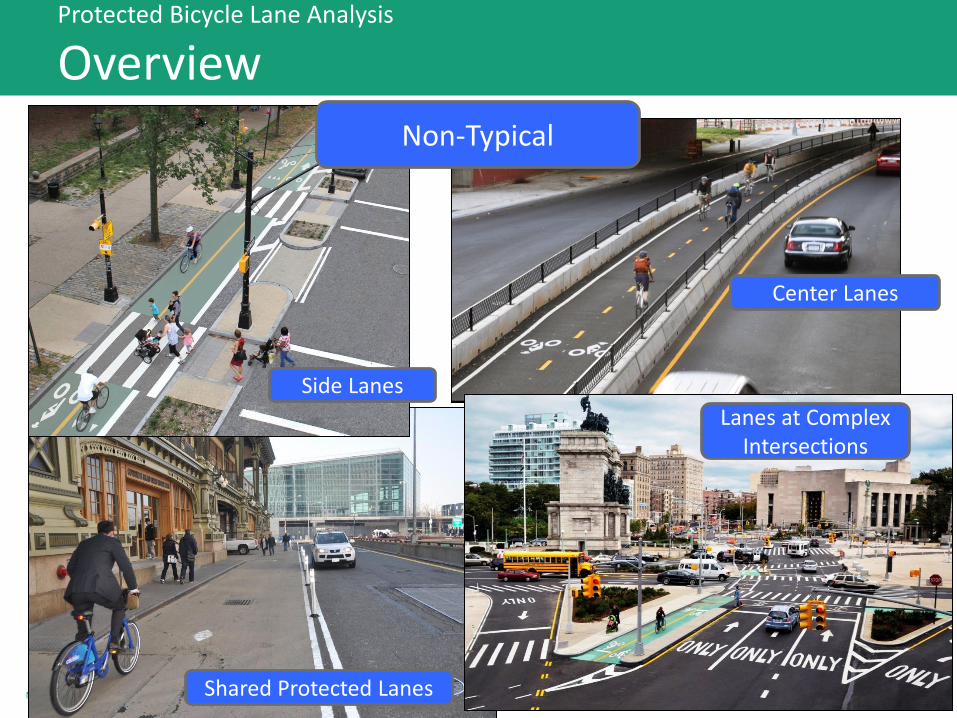
Overview Non-Typical
Center Lanes
Side Lanes
Shared Protected Lanes
Lanes at Complex Intersections
NEW YORK CITY DEPARTMENT OF TRANSPORTATION 4
After
Protected Bicycle Lane Analysis
Overview
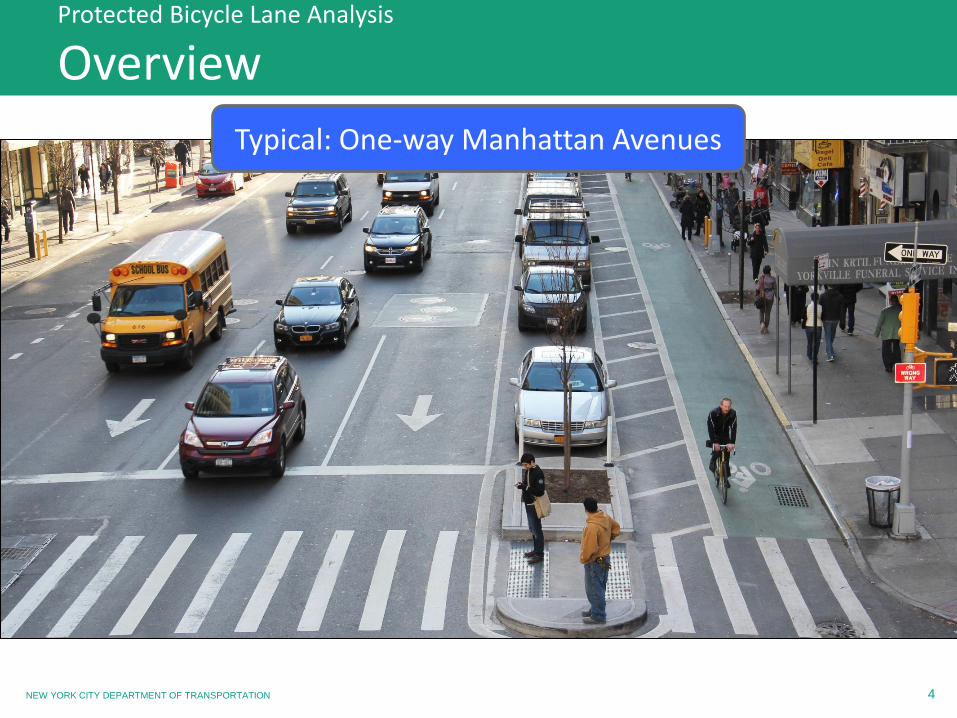
Typical: One-way Manhattan Avenues
NEW YORK CITY DEPARTMENT OF TRANSPORTATION 5
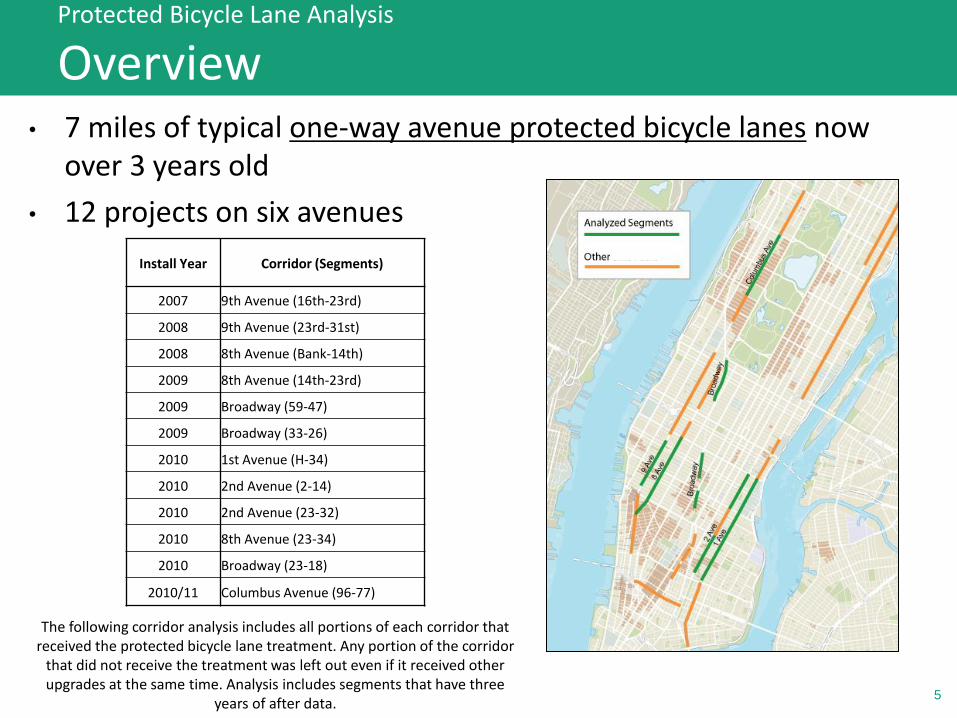
The following corridor analysis includes all portions of each corridor that received the protected bicycle lane treatment. Any portion of the corridor
that did not receive the treatment was left out even if it received other upgrades at the same time. Analysis includes segments that have three
years of after data.
Install Year Corridor (Segments)
2007 9th Avenue (16th-23rd)
2008 9th Avenue (23rd-31st)
2008 8th Avenue (Bank-14th)
2009 8th Avenue (14th-23rd)
2009 Broadway (59-47)
2009 Broadway (33-26)
2010 1st Avenue (H-34)
2010 2nd Avenue (2-14)
2010 2nd Avenue (23-32)
2010 8th Avenue (23-34)
2010 Broadway (23-18)
2010/11 Columbus Avenue (96-77)
• 7 miles of typical one-way avenue protected bicycle lanes now over 3 years old
• 12 projects on six avenues
Protected Bicycle Lane Analysis
Overview
NEW YORK CITY DEPARTMENT OF TRANSPORTATION 6 After
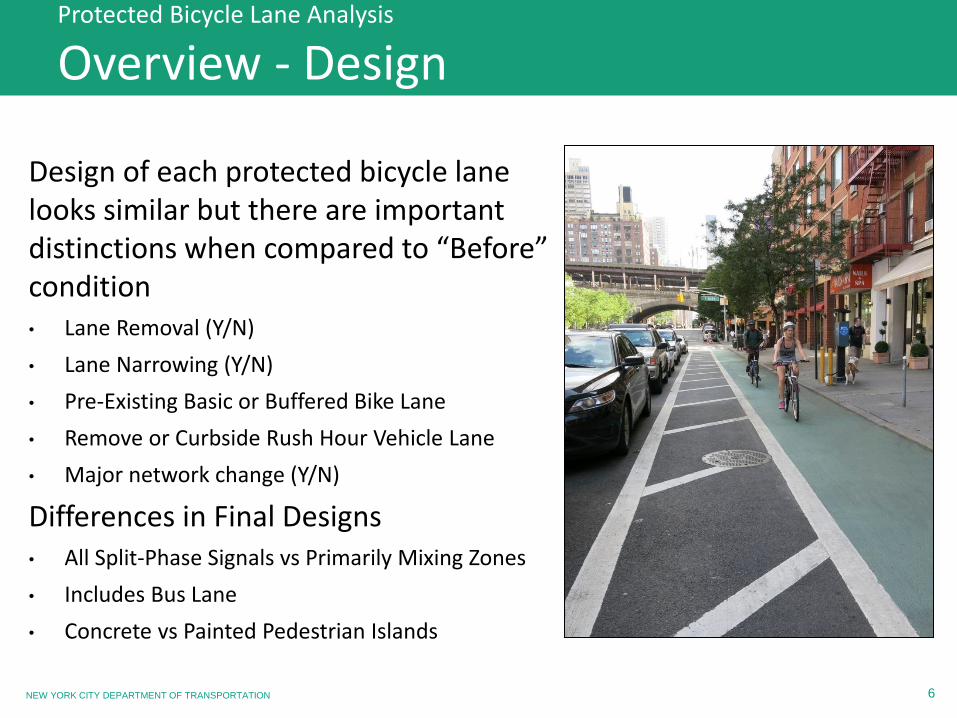
Design of each protected bicycle lane looks similar but there are important distinctions when compared to “Before” condition • Lane Removal (Y/N)
• Lane Narrowing (Y/N)
• Pre-Existing Basic or Buffered Bike Lane
• Remove or Curbside Rush Hour Vehicle Lane
• Major network change (Y/N)
Differences in Final Designs • All Split-Phase Signals vs Primarily Mixing Zones
• Includes Bus Lane
• Concrete vs Painted Pedestrian Islands
Protected Bicycle Lane Analysis
Overview - Design
NEW YORK CITY DEPARTMENT OF TRANSPORTATION 7
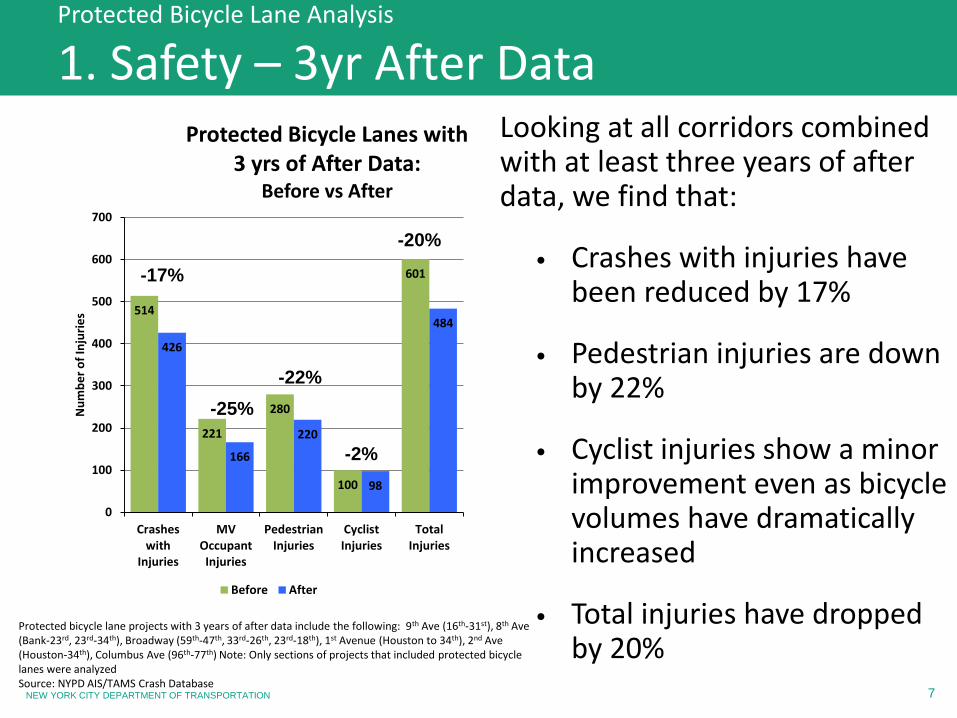
Looking at all corridors combined with at least three years of after data, we find that:
• Crashes with injuries have been reduced by 17%
• Pedestrian injuries are down by 22%
• Cyclist injuries show a minor improvement even as bicycle volumes have dramatically increased
• Total injuries have dropped by 20%
8th Avenue
Protected Bicycle Lane Analysis
1. Safety – 3yr After Data
514
221
280
100
601
426
166
220
98
484
0
100
200
300
400
500
600
700
Crasheswith
Injuries
MVOccupantInjuries
PedestrianInjuries
CyclistInjuries
TotalInjuries
Nu
mb
er
of
Inju
rie
s
Protected Bicycle Lanes with 3 yrs of After Data:
Before vs After
Before After
-17%
-20%
Protected bicycle lane projects with 3 years of after data include the following: 9th Ave (16th-31st), 8th Ave (Bank-23rd, 23rd-34th), Broadway (59th-47th, 33rd-26th, 23rd-18th), 1st Avenue (Houston to 34th), 2nd Ave (Houston-34th), Columbus Ave (96th-77th) Note: Only sections of projects that included protected bicycle lanes were analyzed Source: NYPD AIS/TAMS Crash Database
-25%
-22%
-2%
NEW YORK CITY DEPARTMENT OF TRANSPORTATION 8
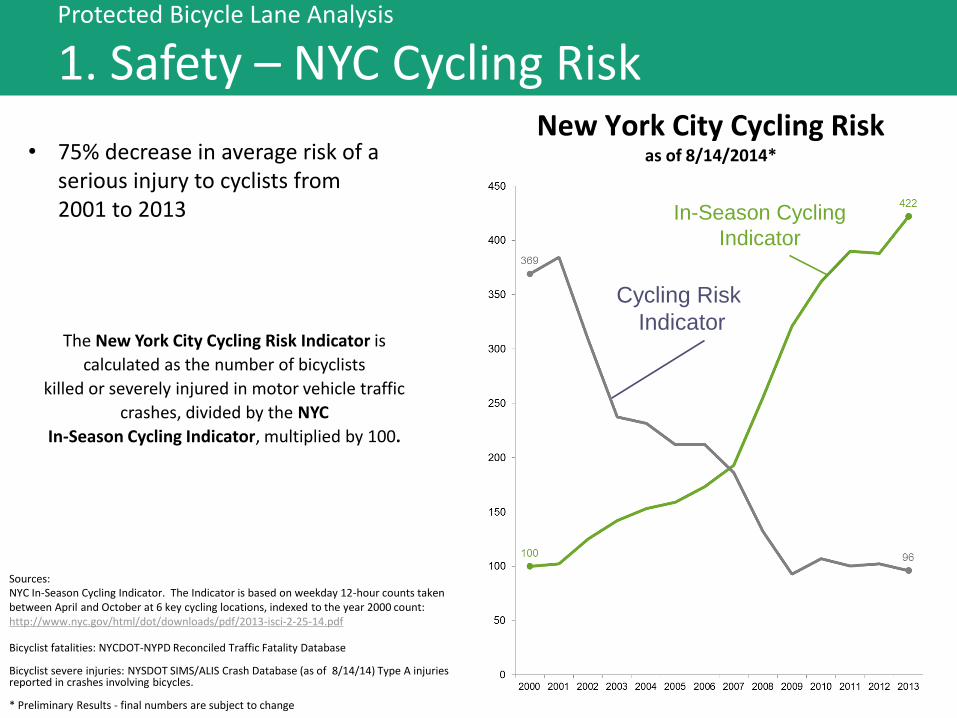
The New York City Cycling Risk Indicator is
calculated as the number of bicyclists
killed or severely injured in motor vehicle traffic
crashes, divided by the NYC
In-Season Cycling Indicator, multiplied by 100.
New York City Cycling Risk as of 8/14/2014* • 75% decrease in average risk of a
serious injury to cyclists from 2001 to 2013
Sources: NYC In-Season Cycling Indicator. The Indicator is based on weekday 12-hour counts taken between April and October at 6 key cycling locations, indexed to the year 2000 count: http://www.nyc.gov/html/dot/downloads/pdf/2013-isci-2-25-14.pdf Bicyclist fatalities: NYCDOT-NYPD Reconciled Traffic Fatality Database Bicyclist severe injuries: NYSDOT SIMS/ALIS Crash Database (as of 8/14/14) Type A injuries reported in crashes involving bicycles. * Preliminary Results - final numbers are subject to change
Protected Bicycle Lane Analysis
1. Safety – NYC Cycling Risk
Cycling Risk
Indicator
In-Season Cycling
Indicator
NEW YORK CITY DEPARTMENT OF TRANSPORTATION 9
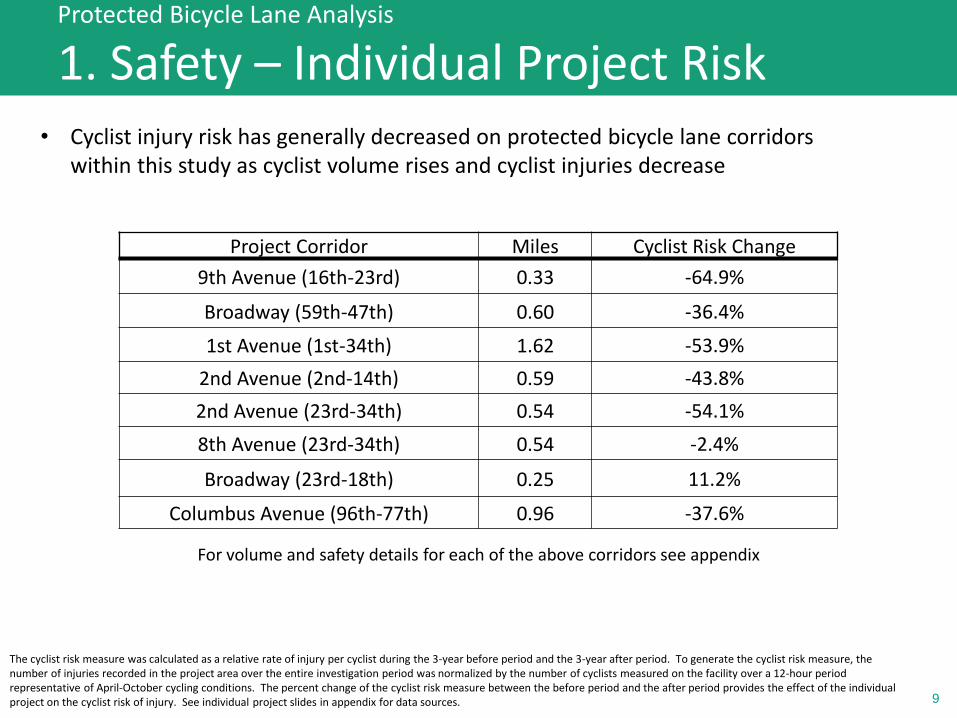
Project Corridor Miles Cyclist Risk Change
9th Avenue (16th-23rd) 0.33 -64.9%
Broadway (59th-47th) 0.60 -36.4%
1st Avenue (1st-34th) 1.62 -53.9%
2nd Avenue (2nd-14th) 0.59 -43.8%
2nd Avenue (23rd-34th) 0.54 -54.1%
8th Avenue (23rd-34th) 0.54 -2.4%
Broadway (23rd-18th) 0.25 11.2%
Columbus Avenue (96th-77th) 0.96 -37.6%
• Cyclist injury risk has generally decreased on protected bicycle lane corridors within this study as cyclist volume rises and cyclist injuries decrease
Protected Bicycle Lane Analysis
1. Safety – Individual Project Risk
The cyclist risk measure was calculated as a relative rate of injury per cyclist during the 3-year before period and the 3-year after period. To generate the cyclist risk measure, the number of injuries recorded in the project area over the entire investigation period was normalized by the number of cyclists measured on the facility over a 12-hour period representative of April-October cycling conditions. The percent change of the cyclist risk measure between the before period and the after period provides the effect of the individual project on the cyclist risk of injury. See individual project slides in appendix for data sources.
For volume and safety details for each of the above corridors see appendix
9
NEW YORK CITY DEPARTMENT OF TRANSPORTATION 10
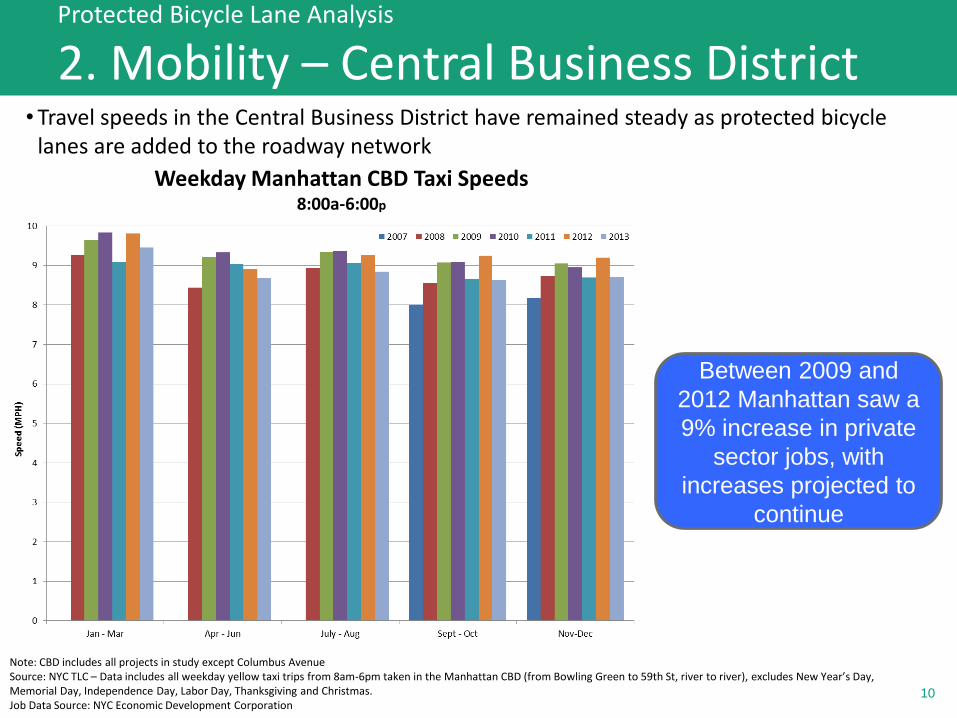
• Travel speeds in the Central Business District have remained steady as protected bicycle lanes are added to the roadway network
Protected Bicycle Lane Analysis
2. Mobility – Central Business District
Weekday Manhattan CBD Taxi Speeds 8:00a-6:00p
Note: CBD includes all projects in study except Columbus Avenue Source: NYC TLC – Data includes all weekday yellow taxi trips from 8am-6pm taken in the Manhattan CBD (from Bowling Green to 59th St, river to river), excludes New Year’s Day, Memorial Day, Independence Day, Labor Day, Thanksgiving and Christmas. Job Data Source: NYC Economic Development Corporation
Between 2009 and
2012 Manhattan saw a
9% increase in private
sector jobs, with
increases projected to
continue
NEW YORK CITY DEPARTMENT OF TRANSPORTATION
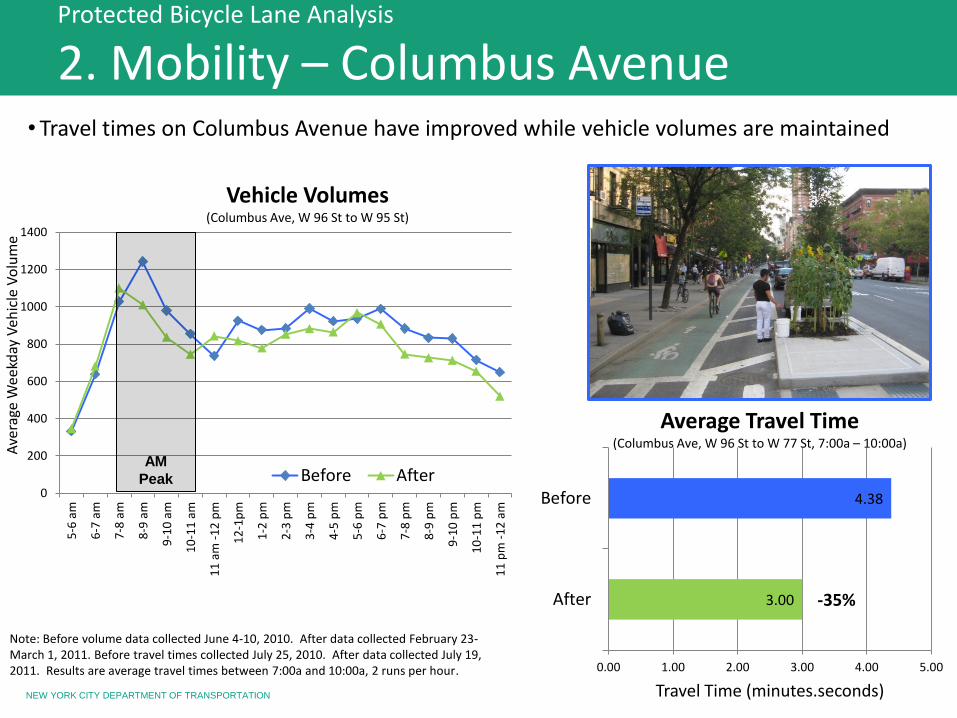
• Travel times on Columbus Avenue have improved while vehicle volumes are maintained
11
0
200
400
600
800
1000
1200
1400
5-6
am
6-7
am
7-8
am
8-9
am
9-1
0 a
m
10
-11
am
11
am
-1
2 p
m
12
-1p
m
1-2
pm
2-3
pm
3-4
pm
4-5
pm
5-6
pm
6-7
pm
7-8
pm
8-9
pm
9-1
0 p
m
10
-11
pm
11
pm
-1
2 a
m
Ave
rage
Wee
kday
Veh
icle
Vo
lum
e
Before AfterAM
Peak
Note: Before volume data collected June 4-10, 2010. After data collected February 23-March 1, 2011. Before travel times collected July 25, 2010. After data collected July 19, 2011. Results are average travel times between 7:00a and 10:00a, 2 runs per hour.
Vehicle Volumes (Columbus Ave, W 96 St to W 95 St)
3.00
4.38
0.00 1.00 2.00 3.00 4.00 5.00
After
Before
Travel Time (minutes.seconds)
-35%
Average Travel Time (Columbus Ave, W 96 St to W 77 St, 7:00a – 10:00a)
Protected Bicycle Lane Analysis
2. Mobility – Columbus Avenue
NEW YORK CITY DEPARTMENT OF TRANSPORTATION 12
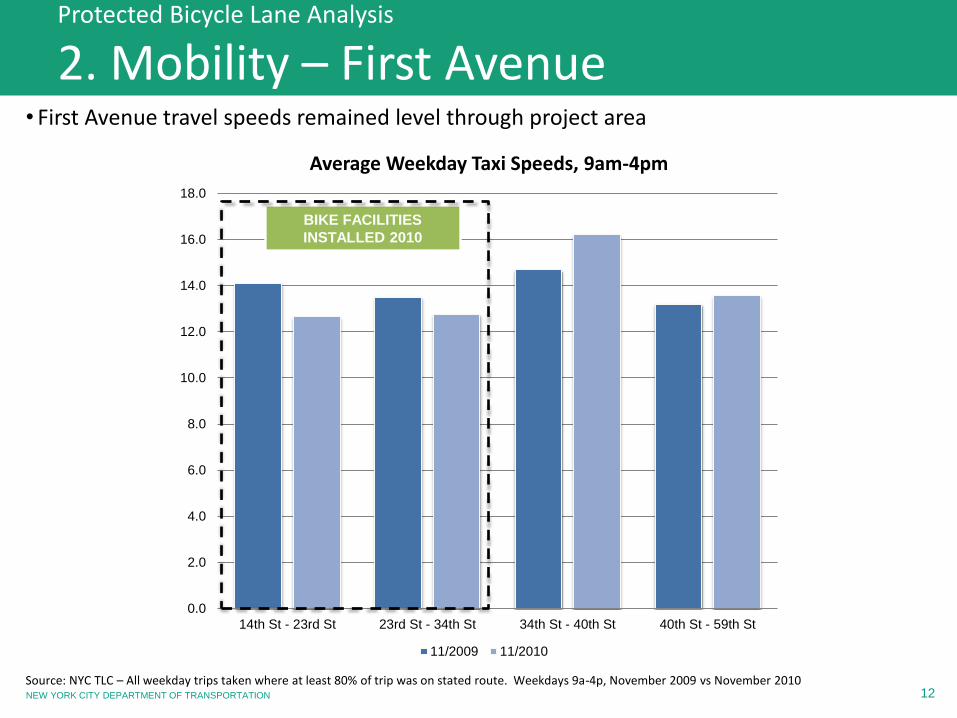
• First Avenue travel speeds remained level through project area
Average Weekday Taxi Speeds, 9am-4pm
0.0
2.0
4.0
6.0
8.0
10.0
12.0
14.0
16.0
18.0
14th St - 23rd St 23rd St - 34th St 34th St - 40th St 40th St - 59th St
11/2009 11/2010
BIKE FACILITIES
INSTALLED 2010
Protected Bicycle Lane Analysis
2. Mobility – First Avenue
Source: NYC TLC – All weekday trips taken where at least 80% of trip was on stated route. Weekdays 9a-4p, November 2009 vs November 2010
NEW YORK CITY DEPARTMENT OF TRANSPORTATION
2:47
6:01
3:38
4:20
2:25
4:44
3:10
3:43
0:00
1:12
2:24
3:36
4:48
6:00
7:12
AM Peak Average (7am - 10am) Mid-day Average (10am - 2pm) PM Peak Average (4pm - 7pm) Daily Average (7am - 8pm)
Trav
el T
ime
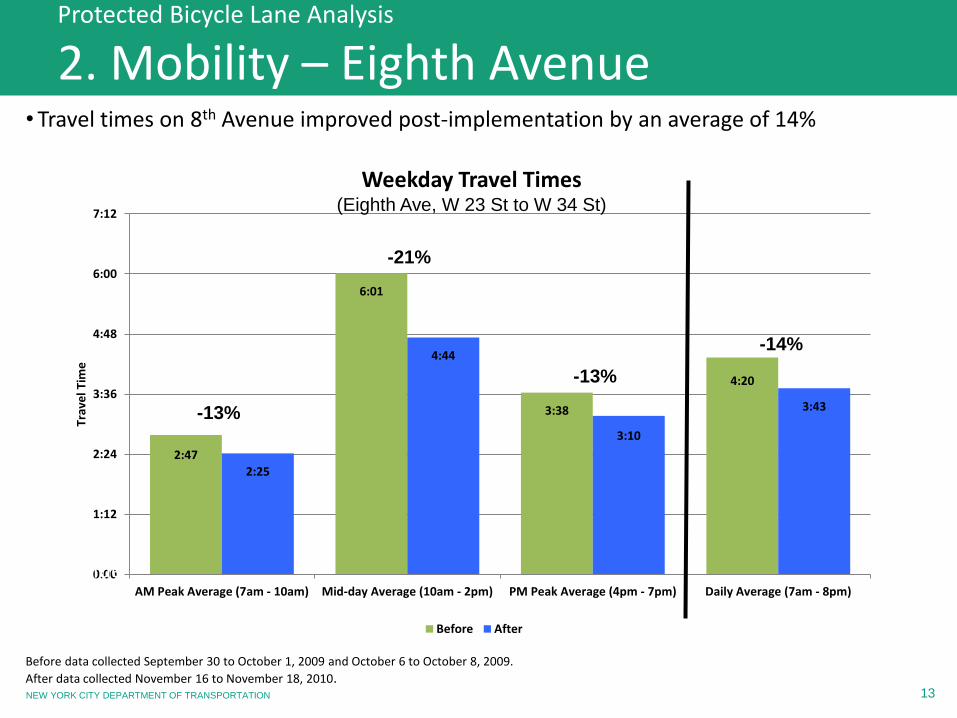
Weekday Travel Times (Eighth Ave, W 23 St to W 34 St)
Before After
13
8th Avenue
Protected Bicycle Lane Analysis
2. Mobility – Eighth Avenue
Before data collected September 30 to October 1, 2009 and October 6 to October 8, 2009.
After data collected November 16 to November 18, 2010.
-13%
-21%
-13%
-14%
• Travel times on 8th Avenue improved post-implementation by an average of 14%
NEW YORK CITY DEPARTMENT OF TRANSPORTATION 14
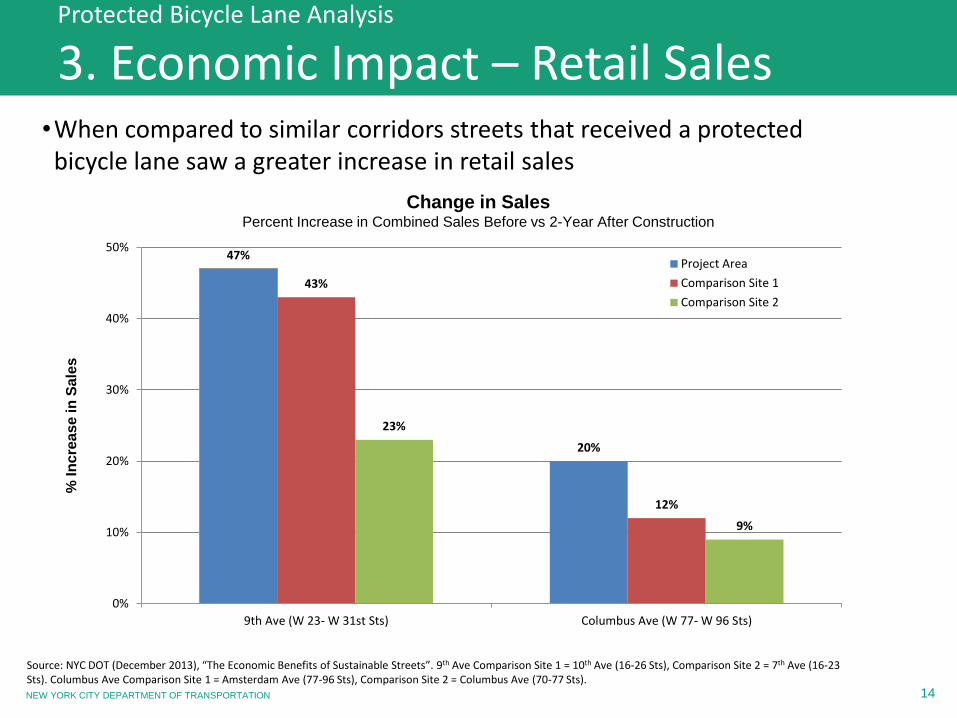
•When compared to similar corridors streets that received a protected bicycle lane saw a greater increase in retail sales
Change in Sales Percent Increase in Combined Sales Before vs 2-Year After Construction
% In
cre
ase in
Sale
s
Source: NYC DOT (December 2013), “The Economic Benefits of Sustainable Streets”. 9th Ave Comparison Site 1 = 10th Ave (16-26 Sts), Comparison Site 2 = 7th Ave (16-23 Sts). Columbus Ave Comparison Site 1 = Amsterdam Ave (77-96 Sts), Comparison Site 2 = Columbus Ave (70-77 Sts).
Protected Bicycle Lane Analysis
3. Economic Impact – Retail Sales
47%
20%
43%
12%
23%
9%
0%
10%
20%
30%
40%
50%
9th Ave (W 23- W 31st Sts) Columbus Ave (W 77- W 96 Sts)
Project Area
Comparison Site 1
Comparison Site 2
NEW YORK CITY DEPARTMENT OF TRANSPORTATION 15
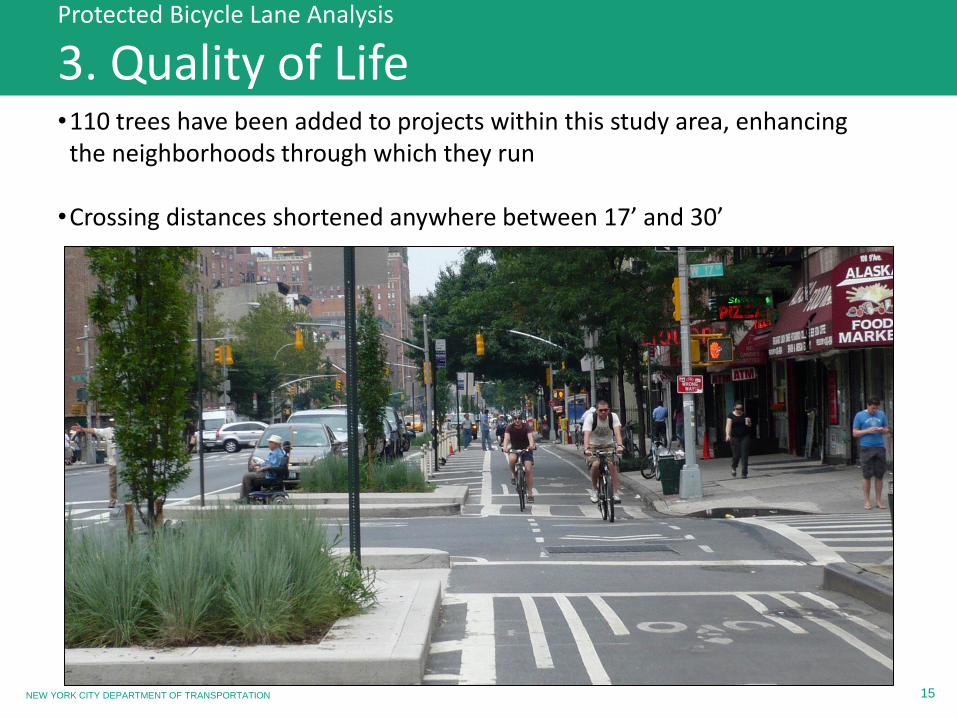
•110 trees have been added to projects within this study area, enhancing the neighborhoods through which they run •Crossing distances shortened anywhere between 17’ and 30’
Protected Bicycle Lane Analysis
3. Quality of Life
NEW YORK CITY DEPARTMENT OF TRANSPORTATION
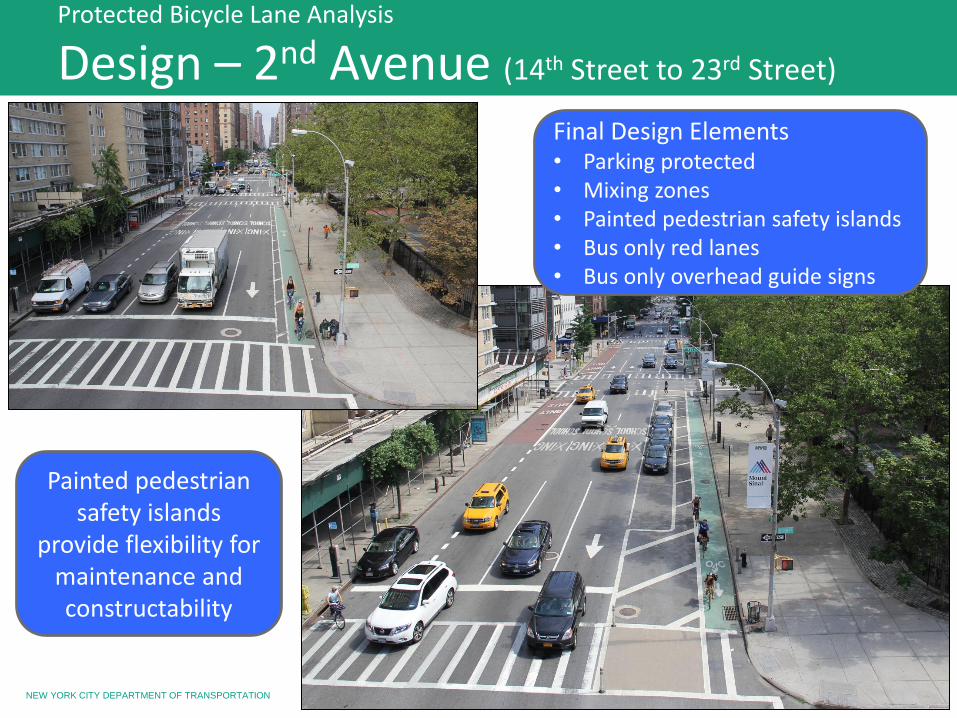
Protected Bicycle Lane Analysis
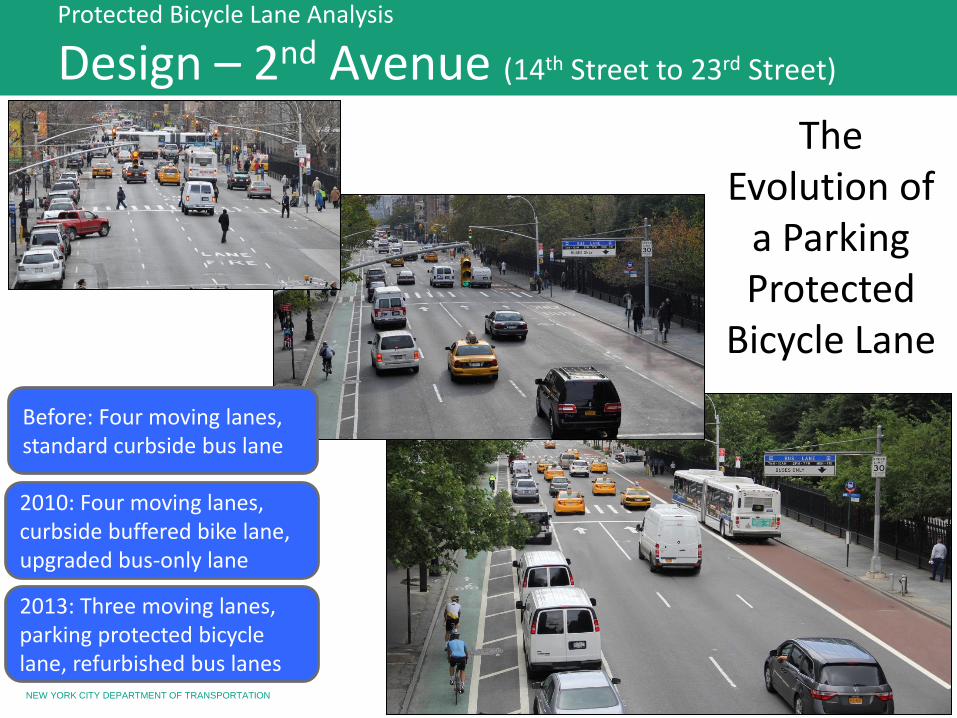
Design – 2nd Avenue (14th Street to 23rd Street)
The Evolution of
a Parking Protected
Bicycle Lane
Before: Four moving lanes, standard curbside bus lane
2010: Four moving lanes, curbside buffered bike lane, upgraded bus-only lane
2013: Three moving lanes, parking protected bicycle lane, refurbished bus lanes
NEW YORK CITY DEPARTMENT OF TRANSPORTATION
Protected Bicycle Lane Analysis
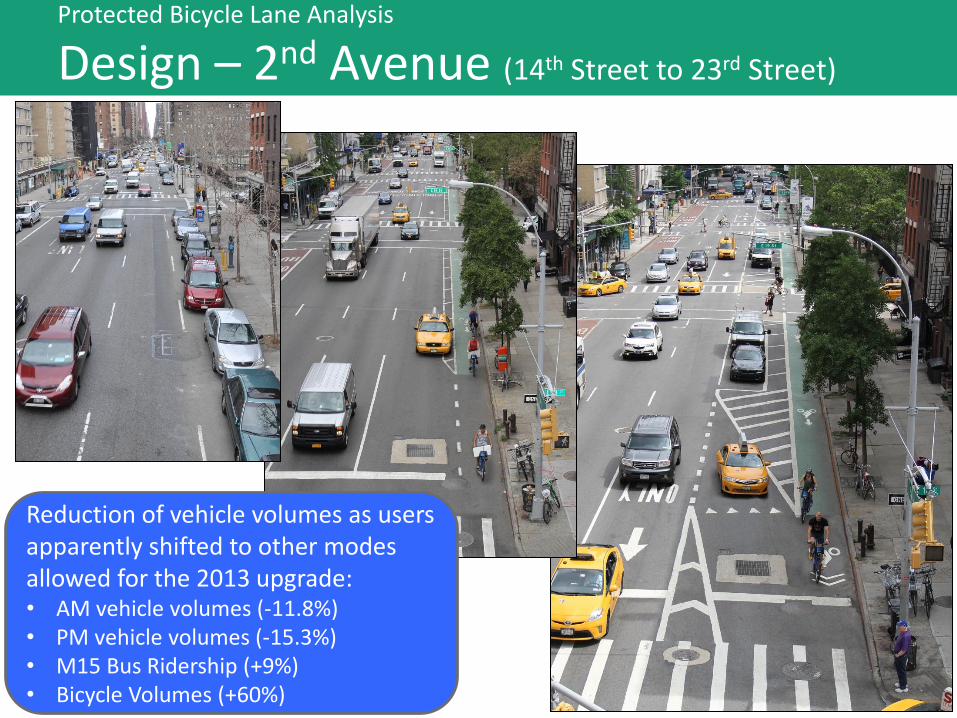
Design – 2nd Avenue (14th Street to 23rd Street)
Reduction of vehicle volumes as users apparently shifted to other modes allowed for the 2013 upgrade: • AM vehicle volumes (-11.8%) • PM vehicle volumes (-15.3%) • M15 Bus Ridership (+9%) • Bicycle Volumes (+60%)
NEW YORK CITY DEPARTMENT OF TRANSPORTATION
Protected Bicycle Lane Analysis
Design – 2nd Avenue (14th Street to 23rd Street)
Painted pedestrian safety islands
provide flexibility for maintenance and constructability
Final Design Elements • Parking protected • Mixing zones • Painted pedestrian safety islands • Bus only red lanes • Bus only overhead guide signs
NEW YORK CITY DEPARTMENT OF TRANSPORTATION 19
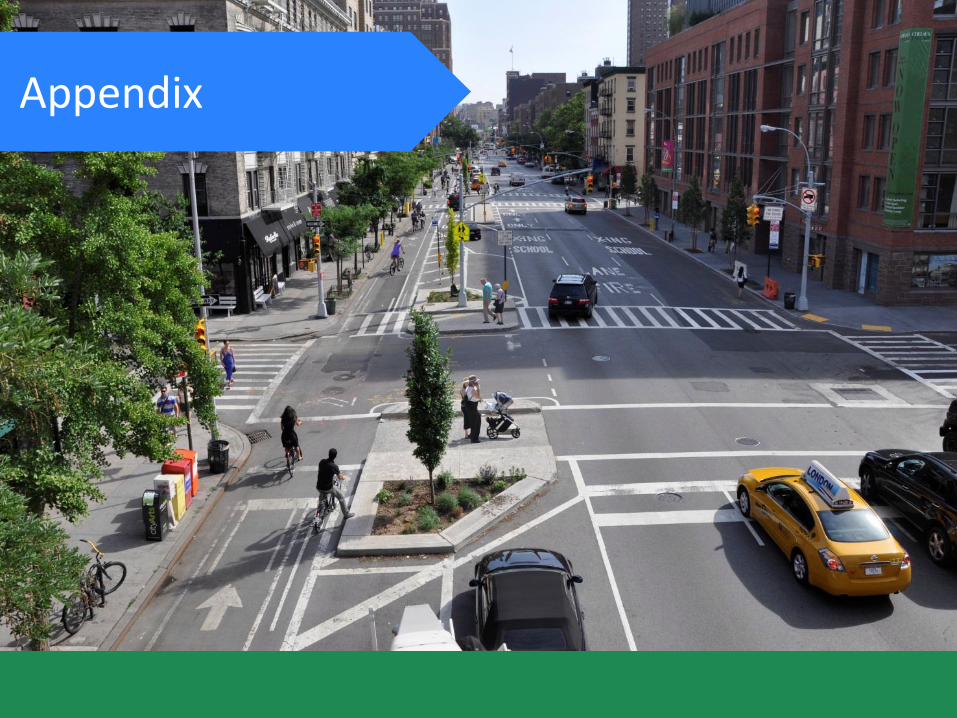
Appendix
NEW YORK CITY DEPARTMENT OF TRANSPORTATION 20 After
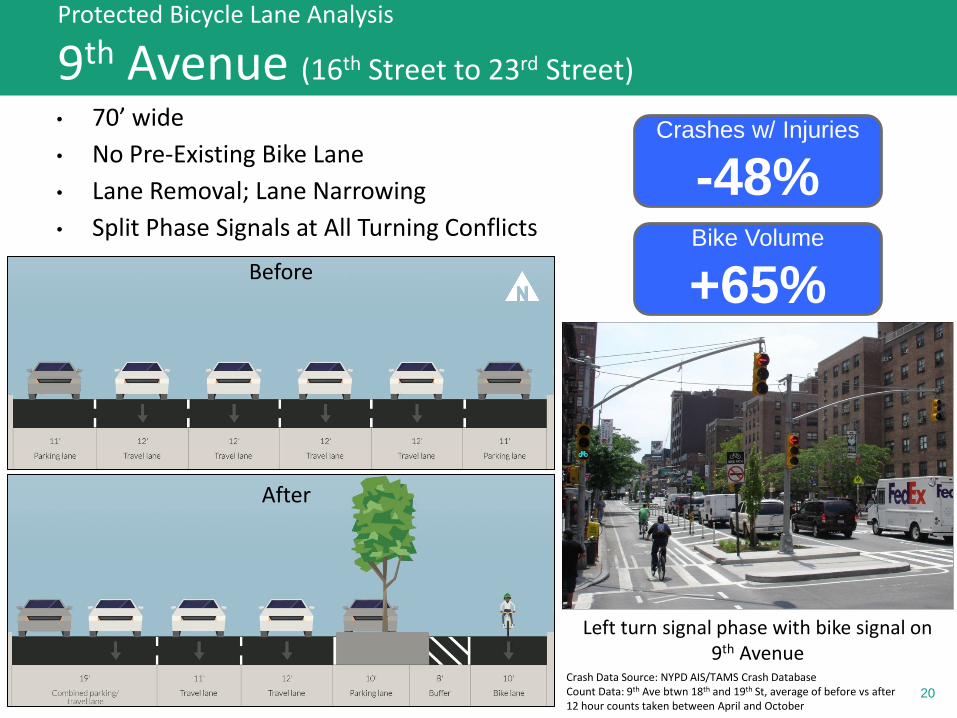
• 70’ wide
• No Pre-Existing Bike Lane
• Lane Removal; Lane Narrowing
• Split Phase Signals at All Turning Conflicts
Protected Bicycle Lane Analysis
9th Avenue (16th Street to 23rd Street)
Before
After
Left turn signal phase with bike signal on 9th Avenue
Crashes w/ Injuries
-48% Bike Volume
+65%
Crash Data Source: NYPD AIS/TAMS Crash Database Count Data: 9th Ave btwn 18th and 19th St, average of before vs after 12 hour counts taken between April and October
NEW YORK CITY DEPARTMENT OF TRANSPORTATION 21 After
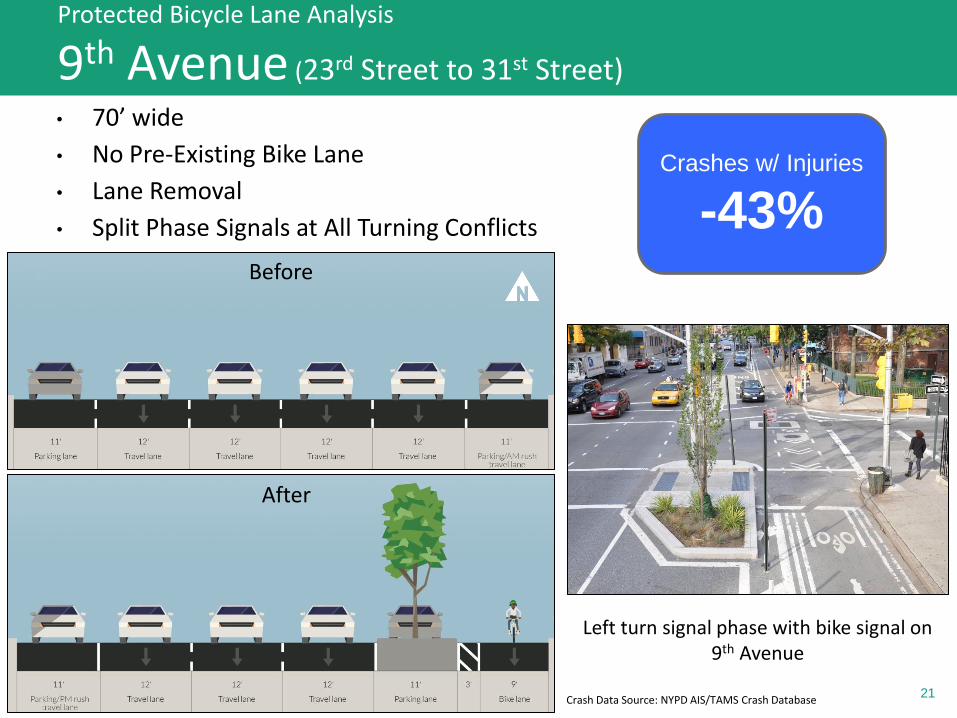
• 70’ wide
• No Pre-Existing Bike Lane
• Lane Removal
• Split Phase Signals at All Turning Conflicts
Protected Bicycle Lane Analysis
9th Avenue (23rd Street to 31st Street)
Before
After
Left turn signal phase with bike signal on 9th Avenue
Crashes w/ Injuries
-43%
Crash Data Source: NYPD AIS/TAMS Crash Database
NEW YORK CITY DEPARTMENT OF TRANSPORTATION 22
Before
After
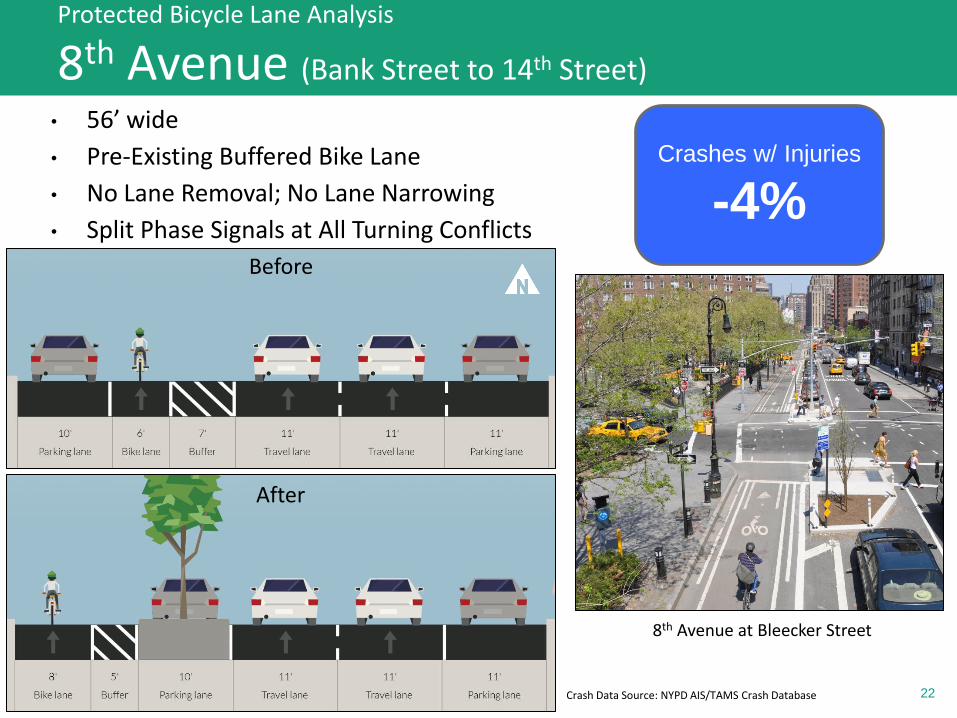
8th Avenue at Bleecker Street
Protected Bicycle Lane Analysis
8th Avenue (Bank Street to 14th Street)
• 56’ wide
• Pre-Existing Buffered Bike Lane
• No Lane Removal; No Lane Narrowing
• Split Phase Signals at All Turning Conflicts
Crashes w/ Injuries
-4%
Crash Data Source: NYPD AIS/TAMS Crash Database
NEW YORK CITY DEPARTMENT OF TRANSPORTATION 23
Before
After
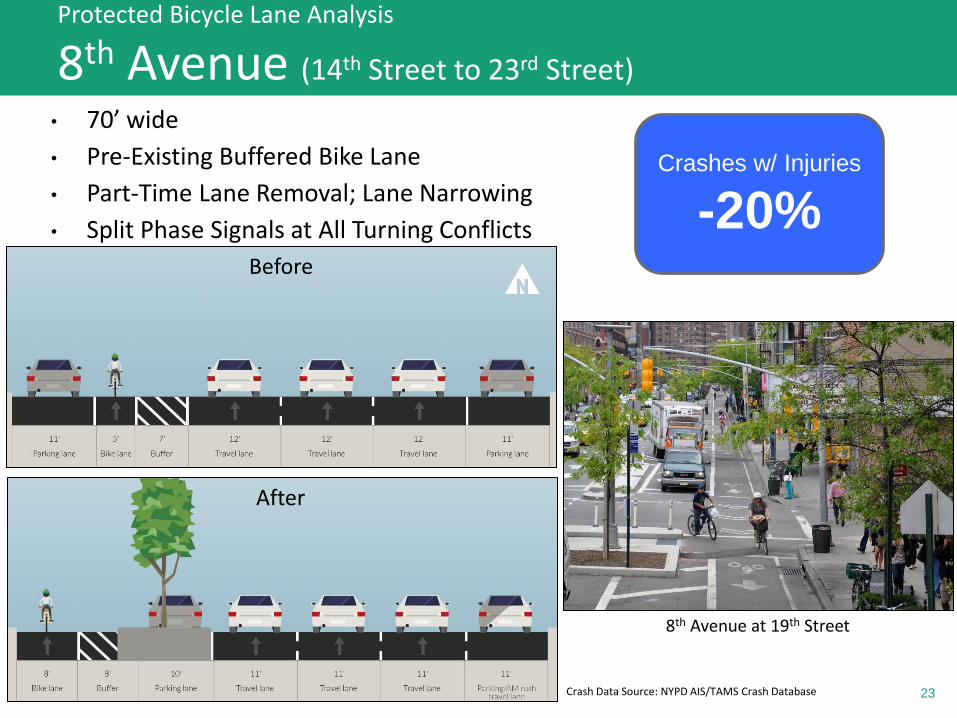
8th Avenue at 19th Street
Protected Bicycle Lane Analysis
8th Avenue (14th Street to 23rd Street)
• 70’ wide
• Pre-Existing Buffered Bike Lane
• Part-Time Lane Removal; Lane Narrowing
• Split Phase Signals at All Turning Conflicts
Crashes w/ Injuries
-20%
Crash Data Source: NYPD AIS/TAMS Crash Database
NEW YORK CITY DEPARTMENT OF TRANSPORTATION 24
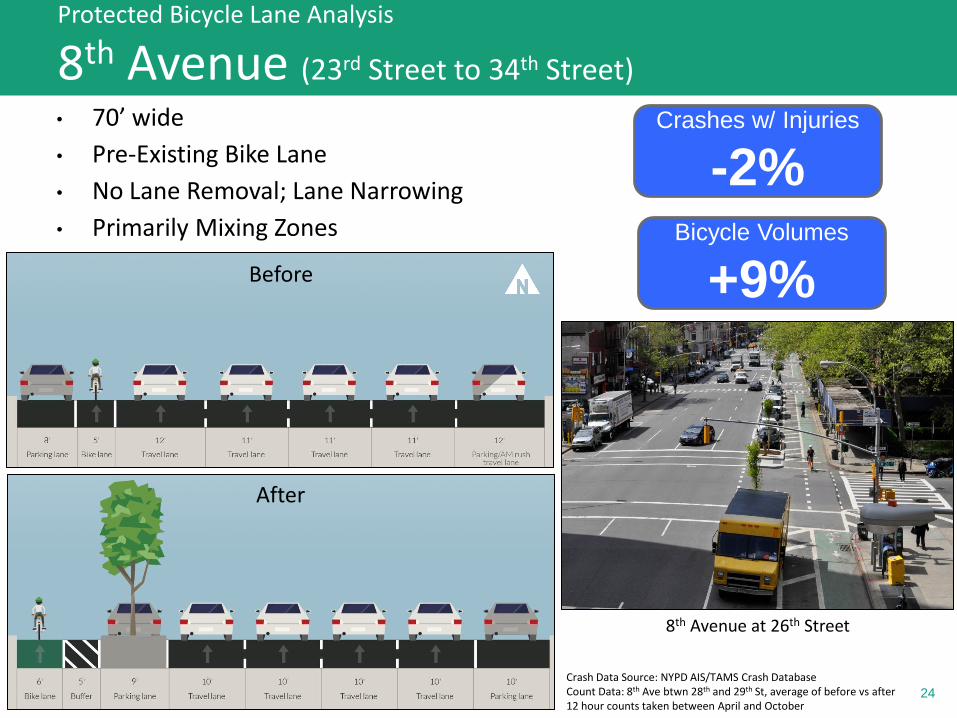
Protected Bicycle Lane Analysis
8th Avenue (23rd Street to 34th Street)
Before
After
8th Avenue at 26th Street
• 70’ wide
• Pre-Existing Bike Lane
• No Lane Removal; Lane Narrowing
• Primarily Mixing Zones
Crashes w/ Injuries
-2% Bicycle Volumes
+9%
Crash Data Source: NYPD AIS/TAMS Crash Database Count Data: 8th Ave btwn 28th and 29th St, average of before vs after 12 hour counts taken between April and October
NEW YORK CITY DEPARTMENT OF TRANSPORTATION 25
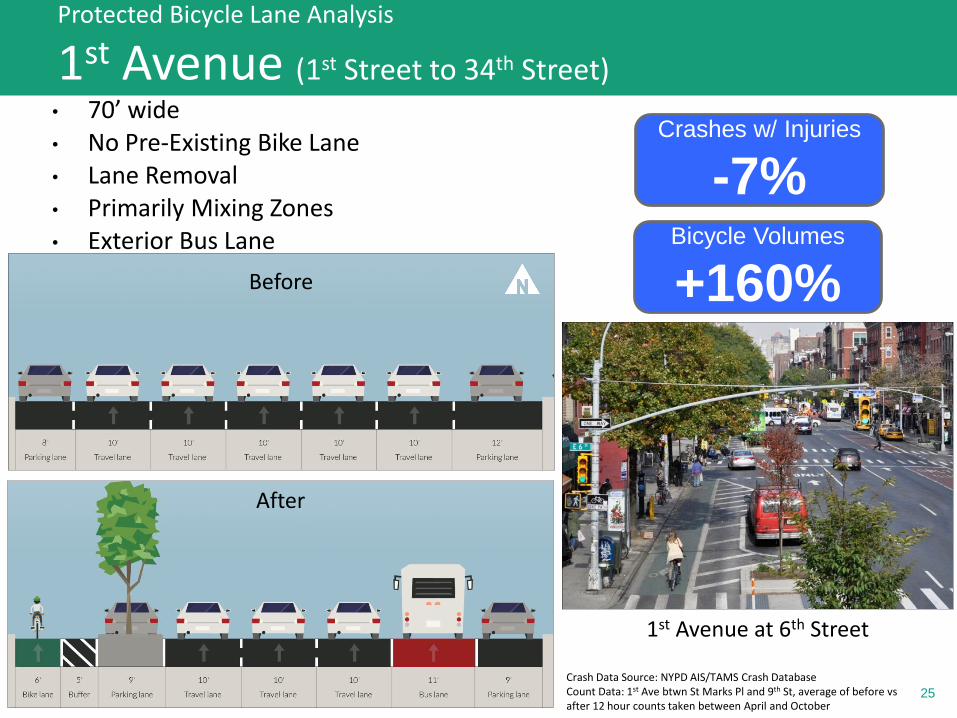
• 70’ wide • No Pre-Existing Bike Lane • Lane Removal • Primarily Mixing Zones • Exterior Bus Lane
Protected Bicycle Lane Analysis
1st Avenue (1st Street to 34th Street)
Before
After
1st Avenue at 6th Street
Crashes w/ Injuries
-7% Bicycle Volumes
+160%
Crash Data Source: NYPD AIS/TAMS Crash Database Count Data: 1st Ave btwn St Marks Pl and 9th St, average of before vs after 12 hour counts taken between April and October
NEW YORK CITY DEPARTMENT OF TRANSPORTATION 26
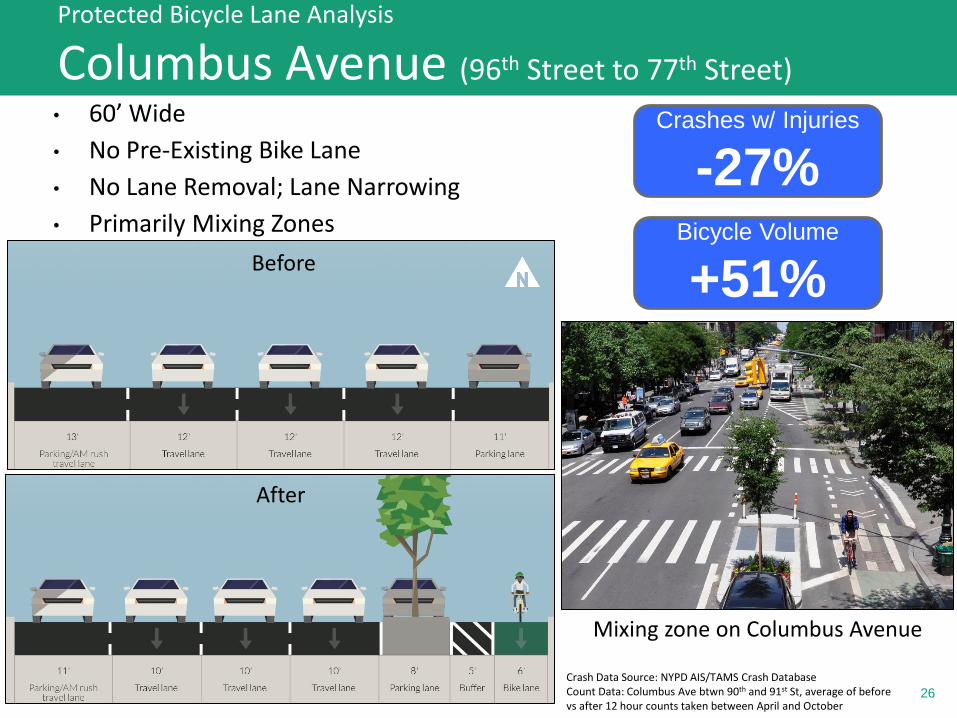
Protected Bicycle Lane Analysis
Columbus Avenue (96th Street to 77th Street)
Before
After
Mixing zone on Columbus Avenue
• 60’ Wide
• No Pre-Existing Bike Lane
• No Lane Removal; Lane Narrowing
• Primarily Mixing Zones
Crashes w/ Injuries
-27% Bicycle Volume
+51%
Crash Data Source: NYPD AIS/TAMS Crash Database Count Data: Columbus Ave btwn 90th and 91st St, average of before vs after 12 hour counts taken between April and October
NEW YORK CITY DEPARTMENT OF TRANSPORTATION 27
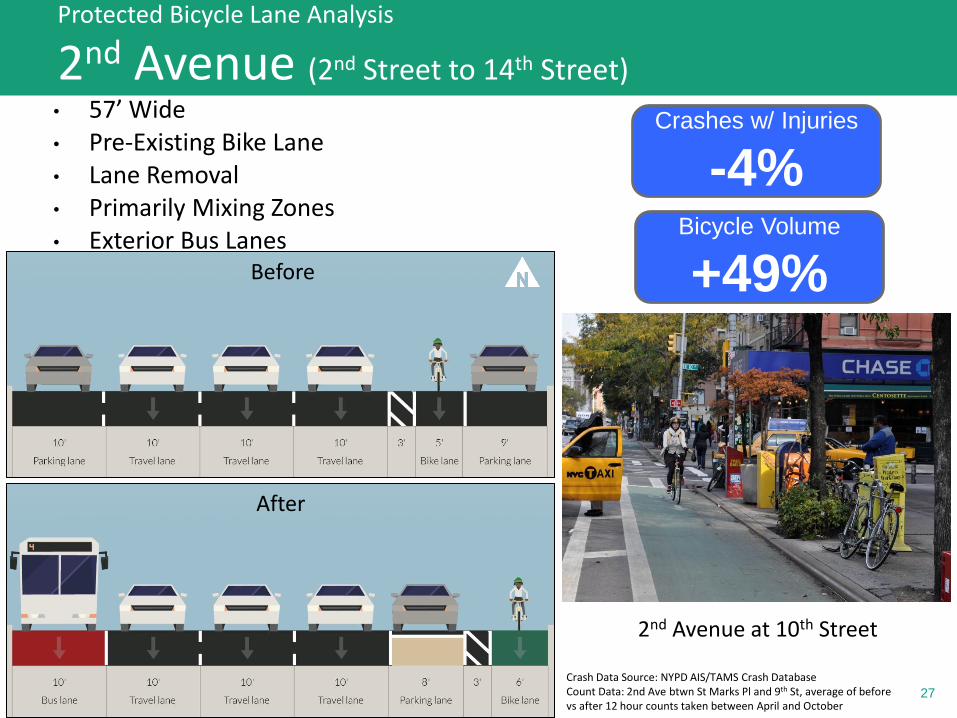
Protected Bicycle Lane Analysis
2nd Avenue (2nd Street to 14th Street)
Before
After
2nd Avenue at 10th Street
• 57’ Wide • Pre-Existing Bike Lane • Lane Removal • Primarily Mixing Zones • Exterior Bus Lanes
Crashes w/ Injuries
-4% Bicycle Volume
+49%
Crash Data Source: NYPD AIS/TAMS Crash Database Count Data: 2nd Ave btwn St Marks Pl and 9th St, average of before vs after 12 hour counts taken between April and October
NEW YORK CITY DEPARTMENT OF TRANSPORTATION 28
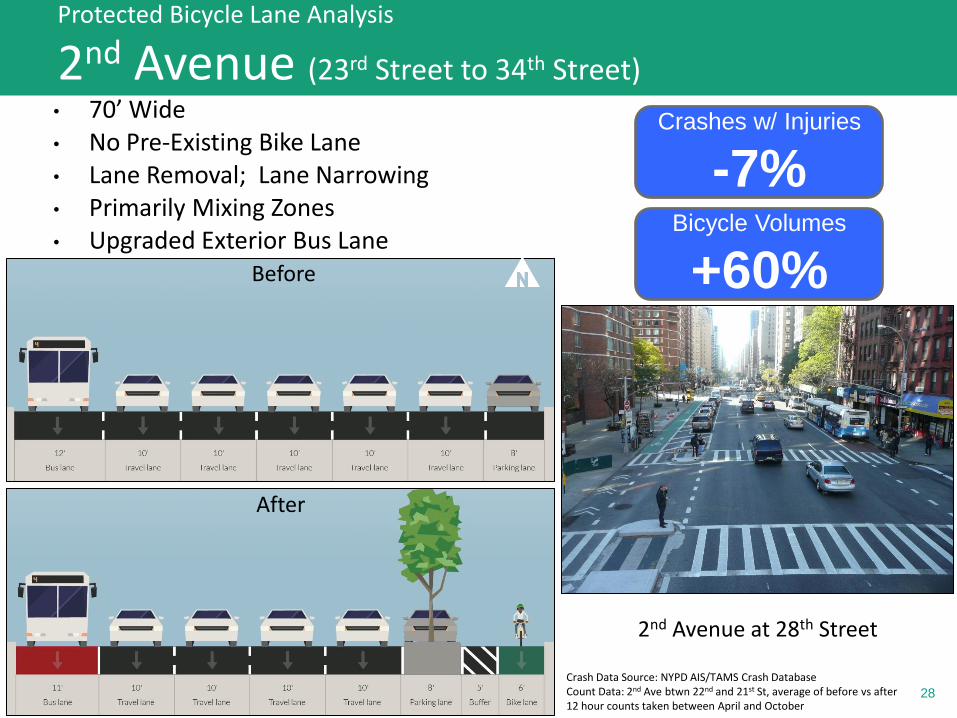
Protected Bicycle Lane Analysis
2nd Avenue (23rd Street to 34th Street)
Before
After
2nd Avenue at 28th Street
• 70’ Wide • No Pre-Existing Bike Lane • Lane Removal; Lane Narrowing • Primarily Mixing Zones • Upgraded Exterior Bus Lane
Crashes w/ Injuries
-7% Bicycle Volumes
+60%
Crash Data Source: NYPD AIS/TAMS Crash Database Count Data: 2nd Ave btwn 22nd and 21st St, average of before vs after 12 hour counts taken between April and October
NEW YORK CITY DEPARTMENT OF TRANSPORTATION 29
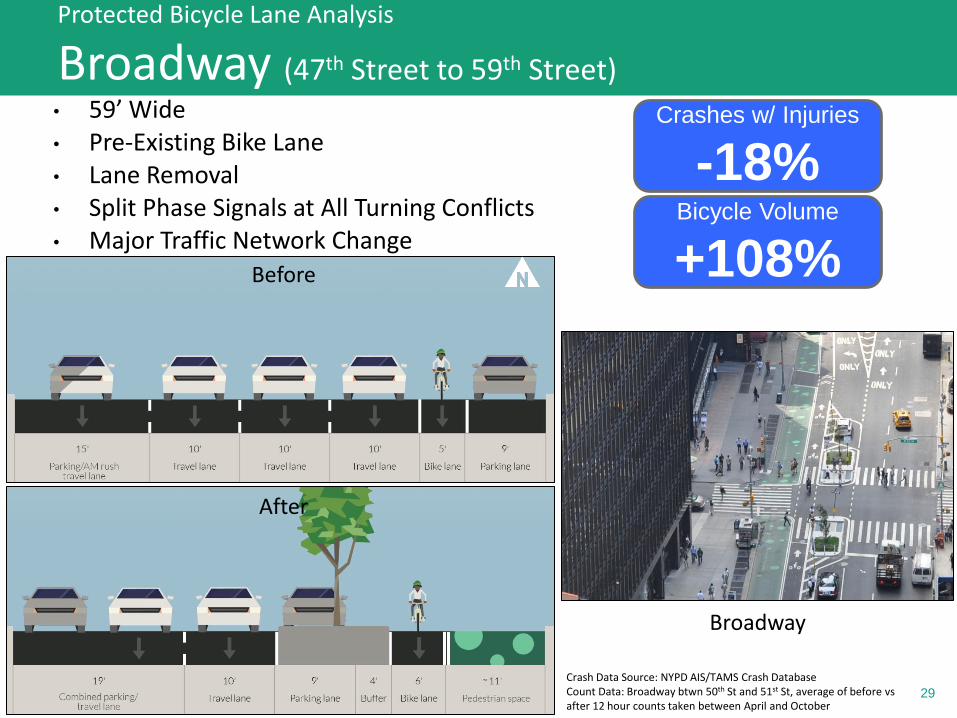
Protected Bicycle Lane Analysis
Broadway (47th Street to 59th Street)
Before
After
Broadway
• 59’ Wide • Pre-Existing Bike Lane • Lane Removal • Split Phase Signals at All Turning Conflicts • Major Traffic Network Change
Crashes w/ Injuries
-18% Bicycle Volume
+108%
Crash Data Source: NYPD AIS/TAMS Crash Database Count Data: Broadway btwn 50th St and 51st St, average of before vs after 12 hour counts taken between April and October
NEW YORK CITY DEPARTMENT OF TRANSPORTATION 30
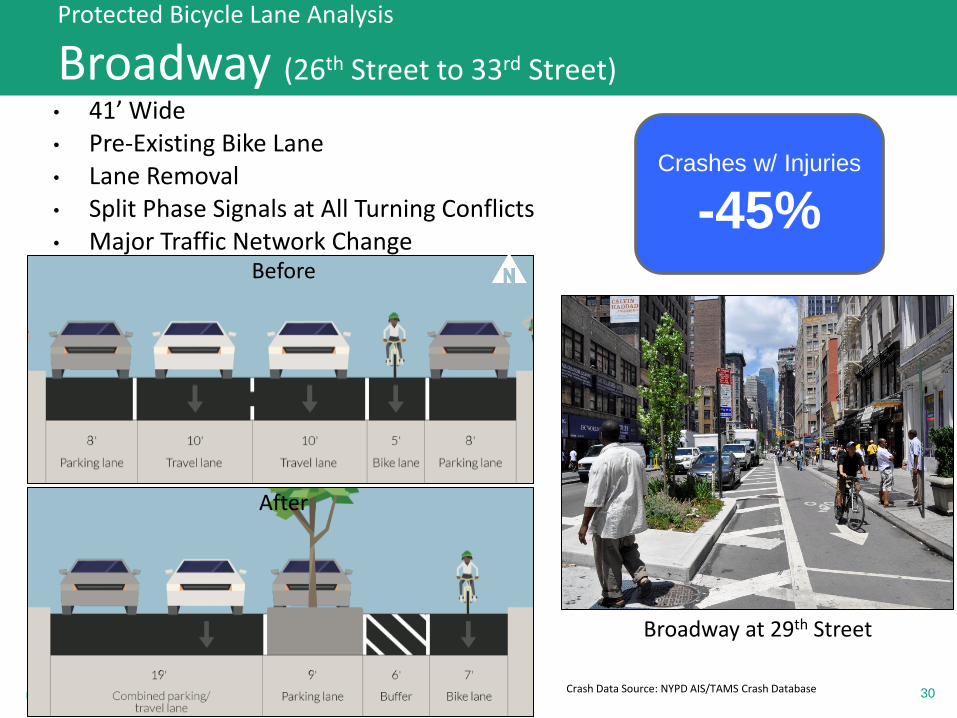
Protected Bicycle Lane Analysis
Broadway (26th Street to 33rd Street)
Before
After
Broadway at 29th Street
• 41’ Wide • Pre-Existing Bike Lane • Lane Removal • Split Phase Signals at All Turning Conflicts • Major Traffic Network Change
Crashes w/ Injuries
-45%
Crash Data Source: NYPD AIS/TAMS Crash Database
NEW YORK CITY DEPARTMENT OF TRANSPORTATION 31
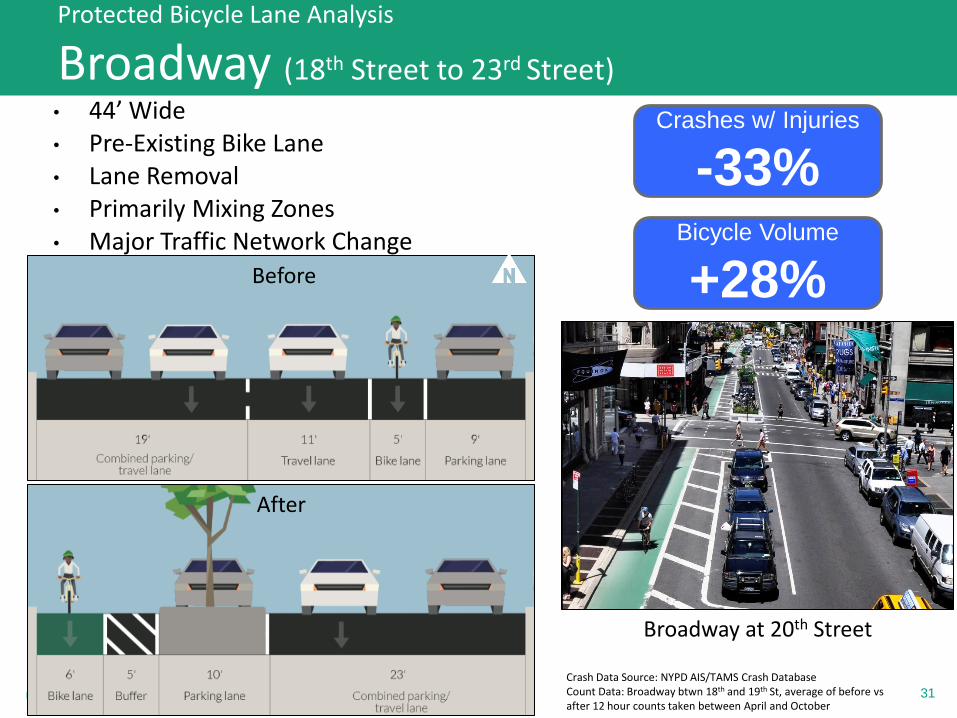
Protected Bicycle Lane Analysis
Broadway (18th Street to 23rd Street)
Before
After
Broadway at 20th Street
• 44’ Wide • Pre-Existing Bike Lane • Lane Removal • Primarily Mixing Zones • Major Traffic Network Change
Crashes w/ Injuries
-33% Bicycle Volume
+28%
Crash Data Source: NYPD AIS/TAMS Crash Database Count Data: Broadway btwn 18th and 19th St, average of before vs after 12 hour counts taken between April and October