Embed Size (px)
Citation preview
PSA testing in general practice
8th July 2014
Testing vs screening
• NZ GPs do 350,000 PSA tests per year • MJ Sneyd estimated 80% of testing could be considered as
screening ‐ the select Committee report called it “disorganised screening”
• Most NZ GPs think screening is worthwhile (Durham) ‐(while UK GPs for instance do very little screening)
Testing vs screening
• Testing – in those with symptoms, those with a previous raised PSA and those who have already been diagnosed with prostate cancer
• Screening – testing of men with no signs or symptoms of disease.• Population based screening has not been recommended because it is
believed that the harms outweigh any potential benefit.
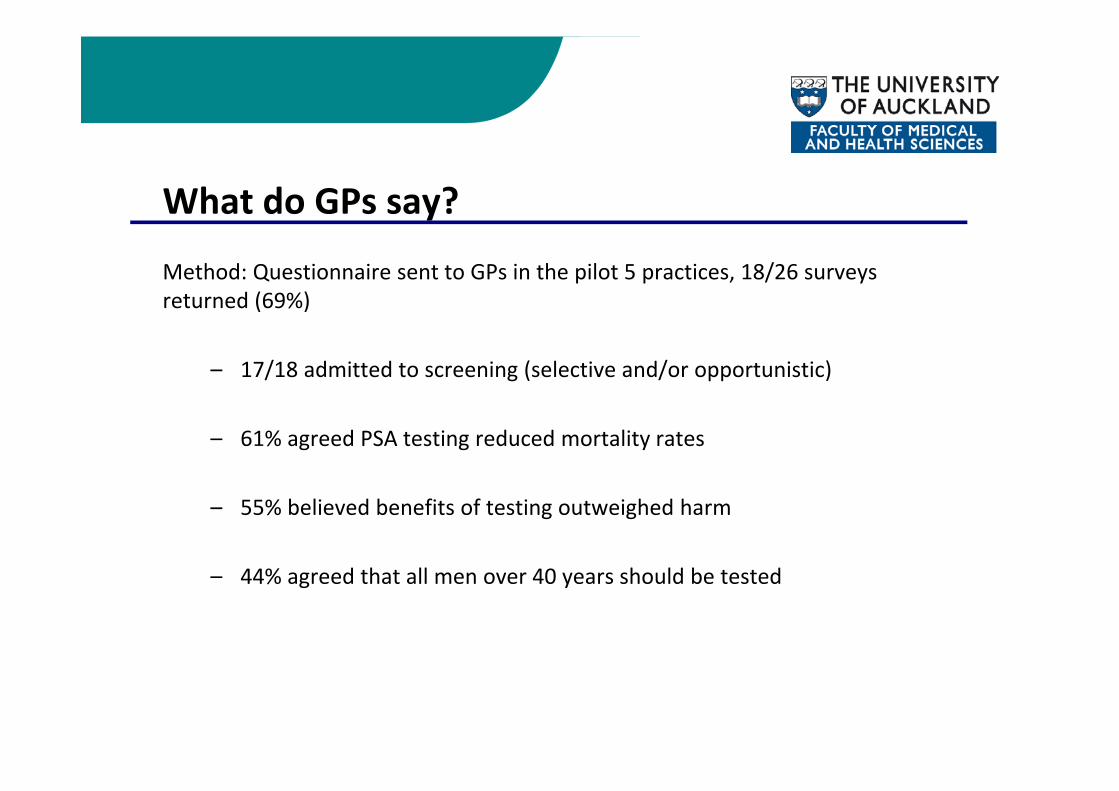
What do GPs say?
Method: Questionnaire sent to GPs in the pilot 5 practices, 18/26 surveys returned (69%)
– 17/18 admitted to screening (selective and/or opportunistic)
– 61% agreed PSA testing reduced mortality rates
– 55% believed benefits of testing outweighed harm
– 44% agreed that all men over 40 years should be tested
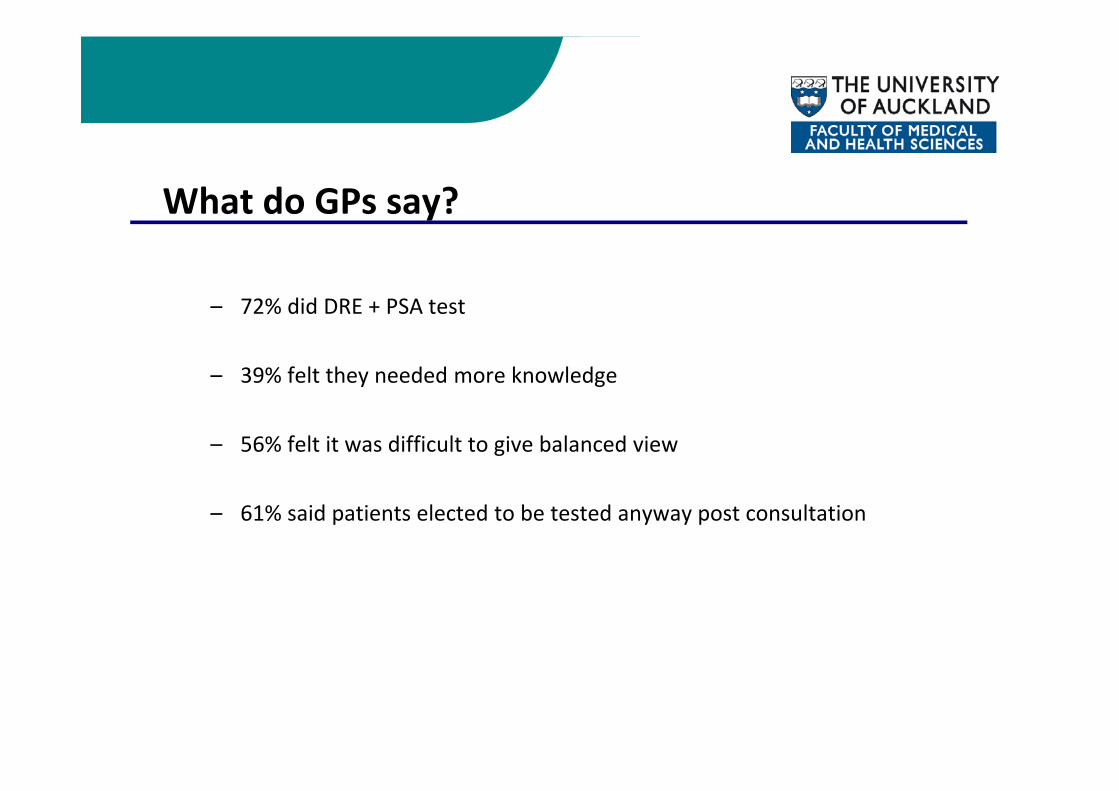
What do GPs say?
– 72% did DRE + PSA test
– 39% felt they needed more knowledge
– 56% felt it was difficult to give balanced view
– 61% said patients elected to be tested anyway post consultation
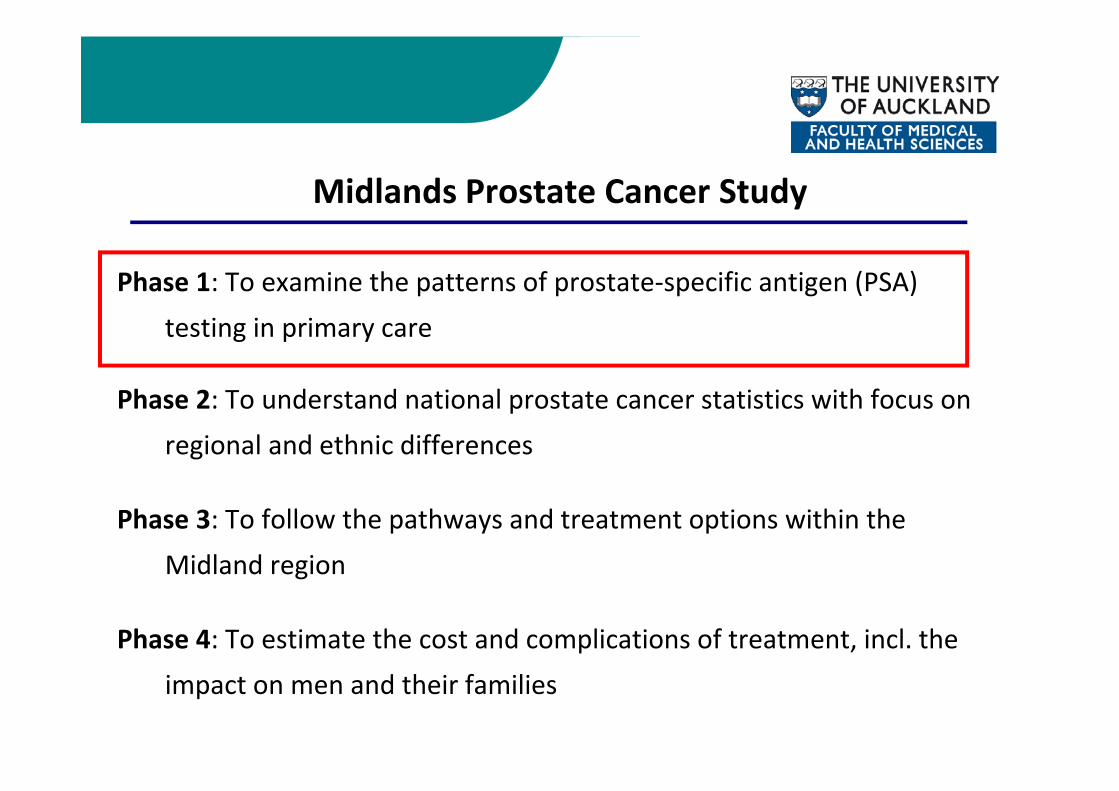
Midlands Prostate Cancer Study
Phase 1: To examine the patterns of prostate‐specific antigen (PSA) testing in primary care
Phase 2: To understand national prostate cancer statistics with focus on regional and ethnic differences
Phase 3: To follow the pathways and treatment options within the Midland region
Phase 4: To estimate the cost and complications of treatment, incl. the impact on men and their families
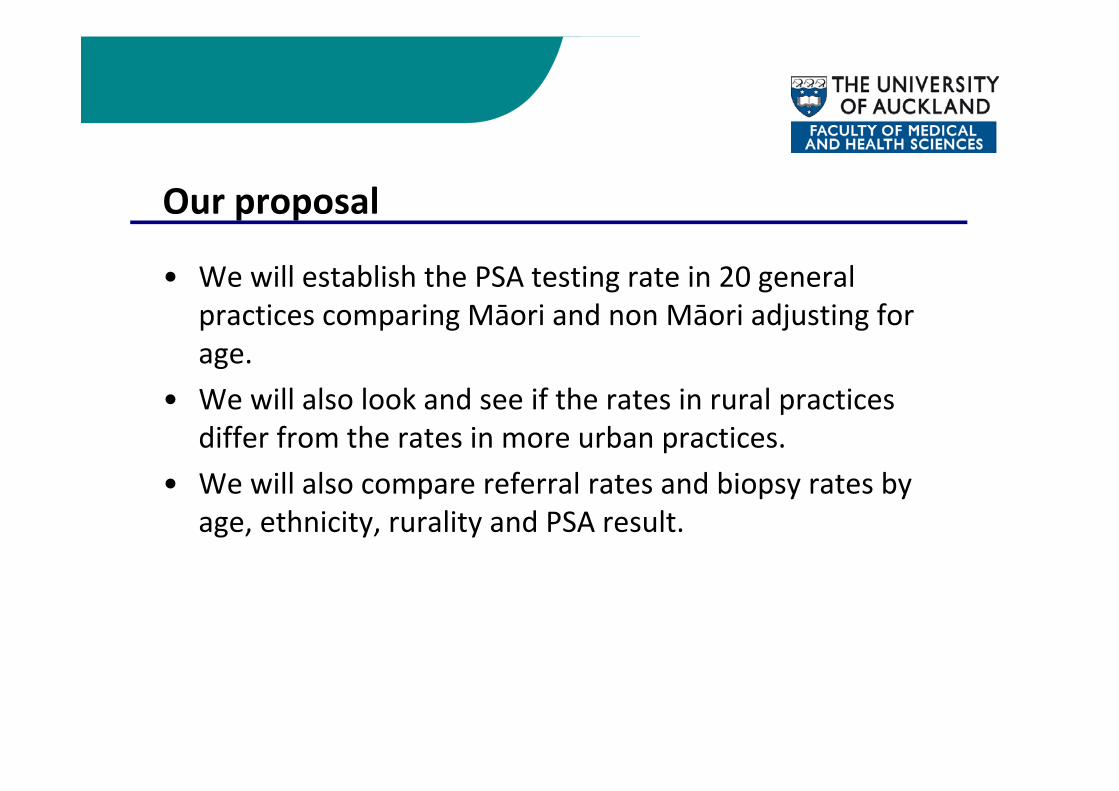
Our proposal
• We will establish the PSA testing rate in 20 general practices comparing Māori and non Māori adjusting for age.
• We will also look and see if the rates in rural practices differ from the rates in more urban practices.
• We will also compare referral rates and biopsy rates by age, ethnicity, rurality and PSA result.
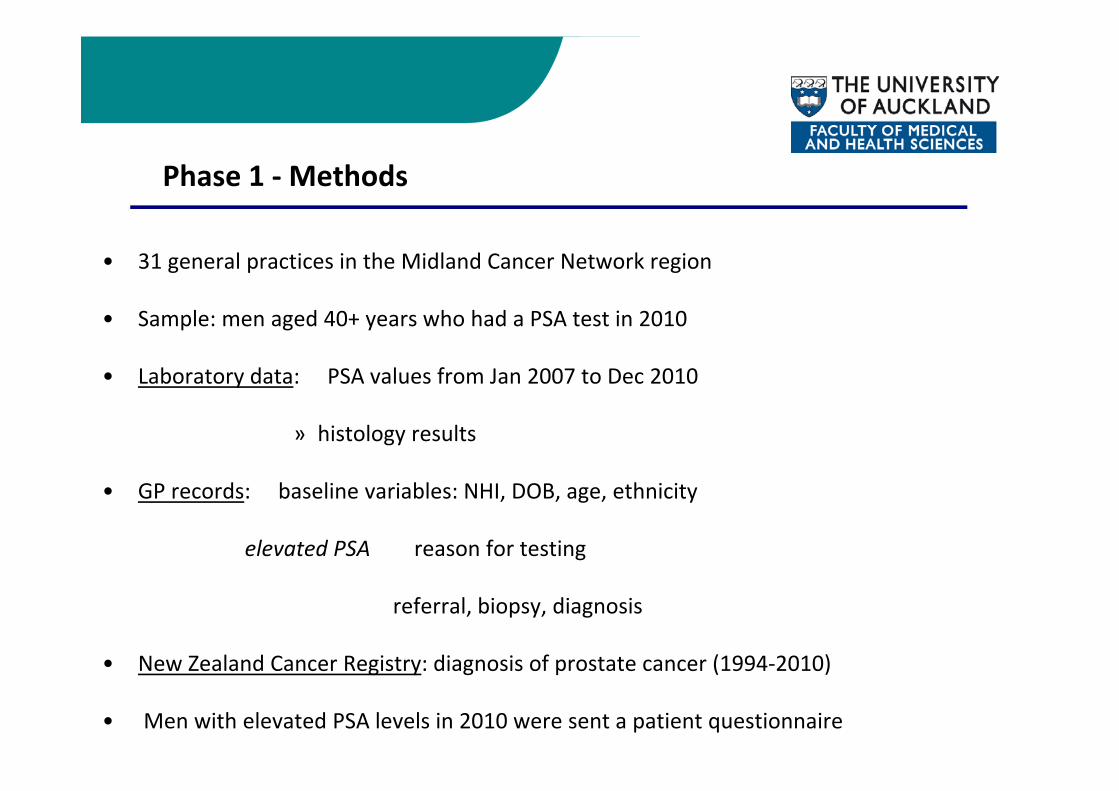
Phase 1 ‐Methods
• 31 general practices in the Midland Cancer Network region
• Sample: men aged 40+ years who had a PSA test in 2010
• Laboratory data: PSA values from Jan 2007 to Dec 2010
» histology results
• GP records: baseline variables: NHI, DOB, age, ethnicity
elevated PSA reason for testing
referral, biopsy, diagnosis
• New Zealand Cancer Registry: diagnosis of prostate cancer (1994‐2010)
• Men with elevated PSA levels in 2010 were sent a patient questionnaire
Methods
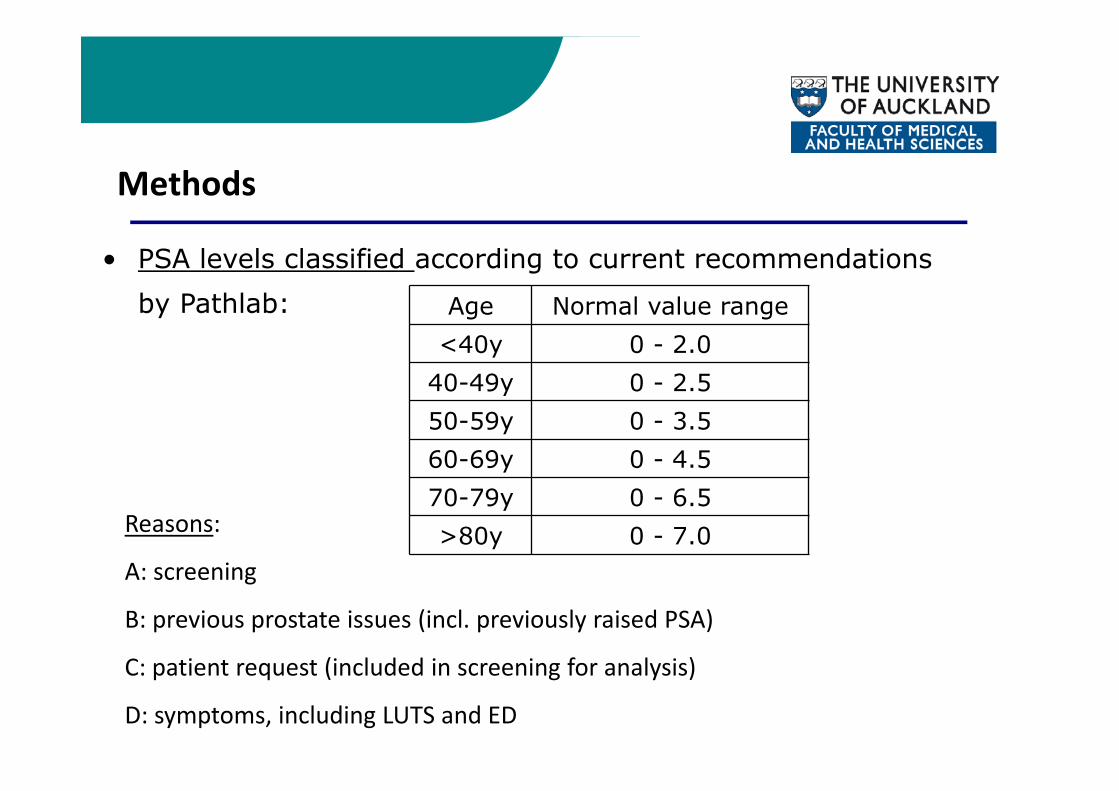
• PSA levels classified according to current recommendations by Pathlab: Age Normal value range
<40y 0 - 2.040-49y 0 - 2.550-59y 0 - 3.560-69y 0 - 4.570-79y 0 - 6.5>80y 0 - 7.0Reasons:
A: screening
B: previous prostate issues (incl. previously raised PSA)
C: patient request (included in screening for analysis)
D: symptoms, including LUTS and ED
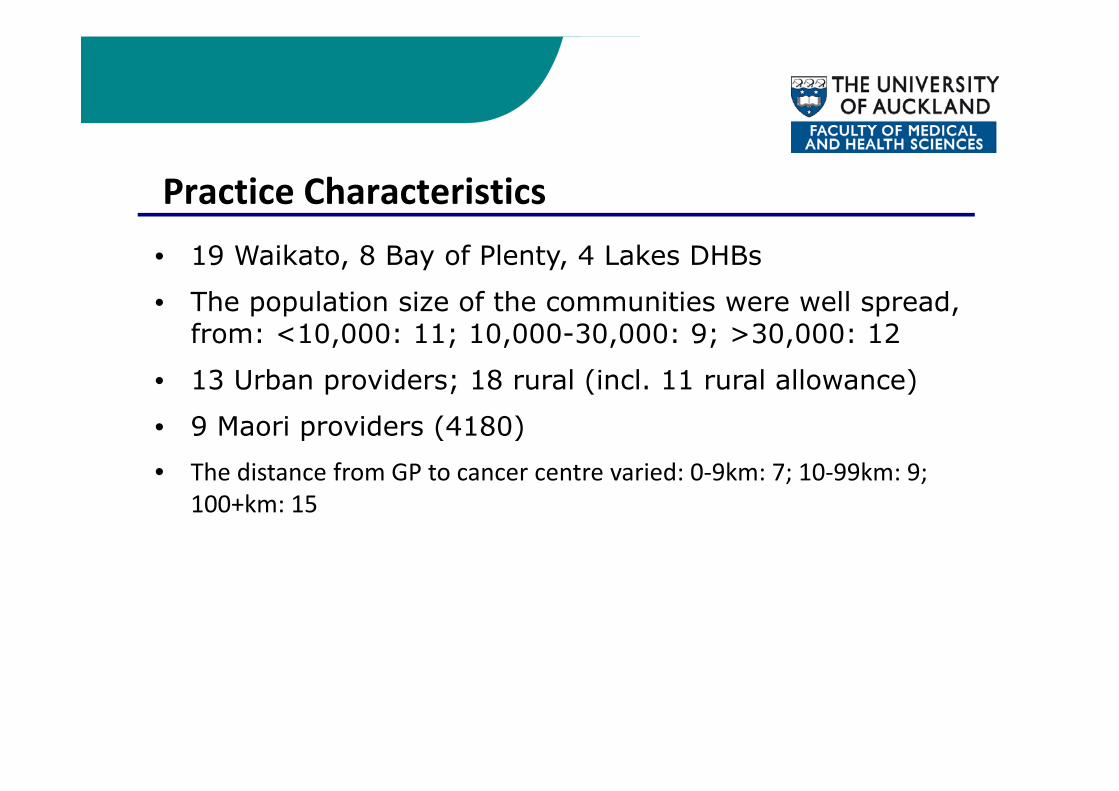
Practice Characteristics• 19 Waikato, 8 Bay of Plenty, 4 Lakes DHBs
• The population size of the communities were well spread, from: <10,000: 11; 10,000-30,000: 9; >30,000: 12
• 13 Urban providers; 18 rural (incl. 11 rural allowance)
• 9 Maori providers (4180)• The distance from GP to cancer centre varied: 0‐9km: 7; 10‐99km: 9;
100+km: 15
Sample
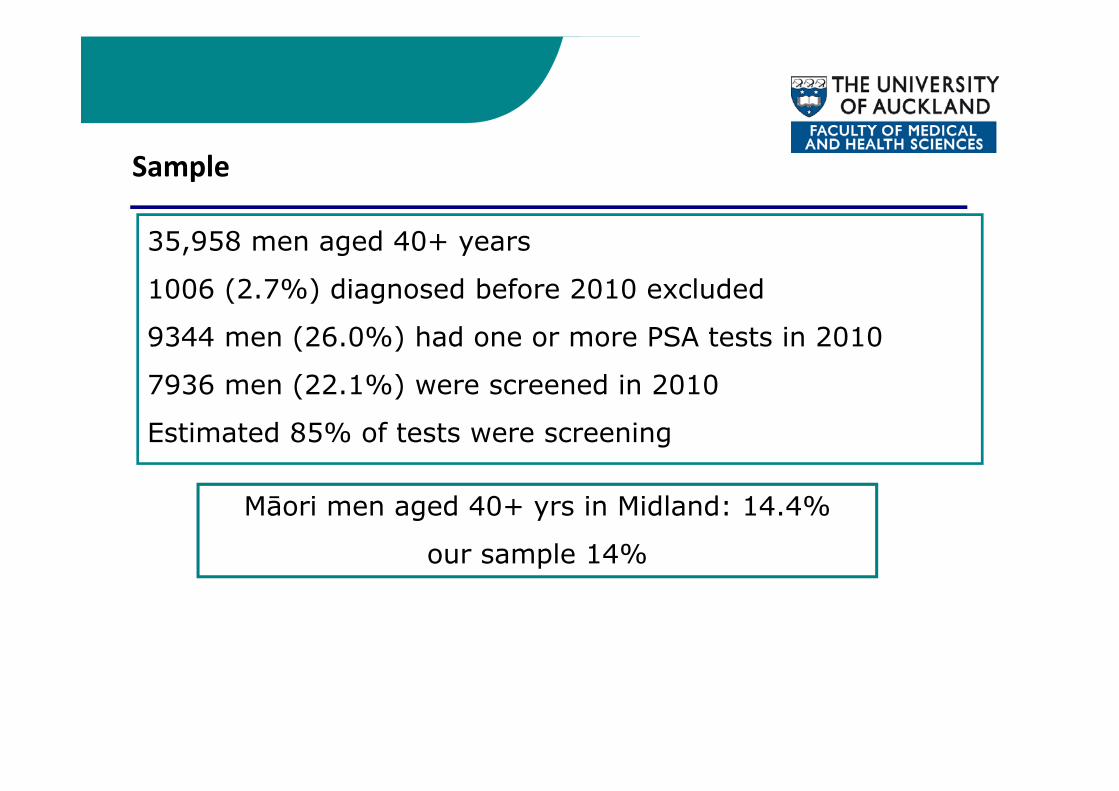
35,958 men aged 40+ years
1006 (2.7%) diagnosed before 2010 excluded
9344 men (26.0%) had one or more PSA tests in 2010
7936 men (22.1%) were screened in 2010
Estimated 85% of tests were screening
Māori men aged 40+ yrs in Midland: 14.4%
our sample 14%
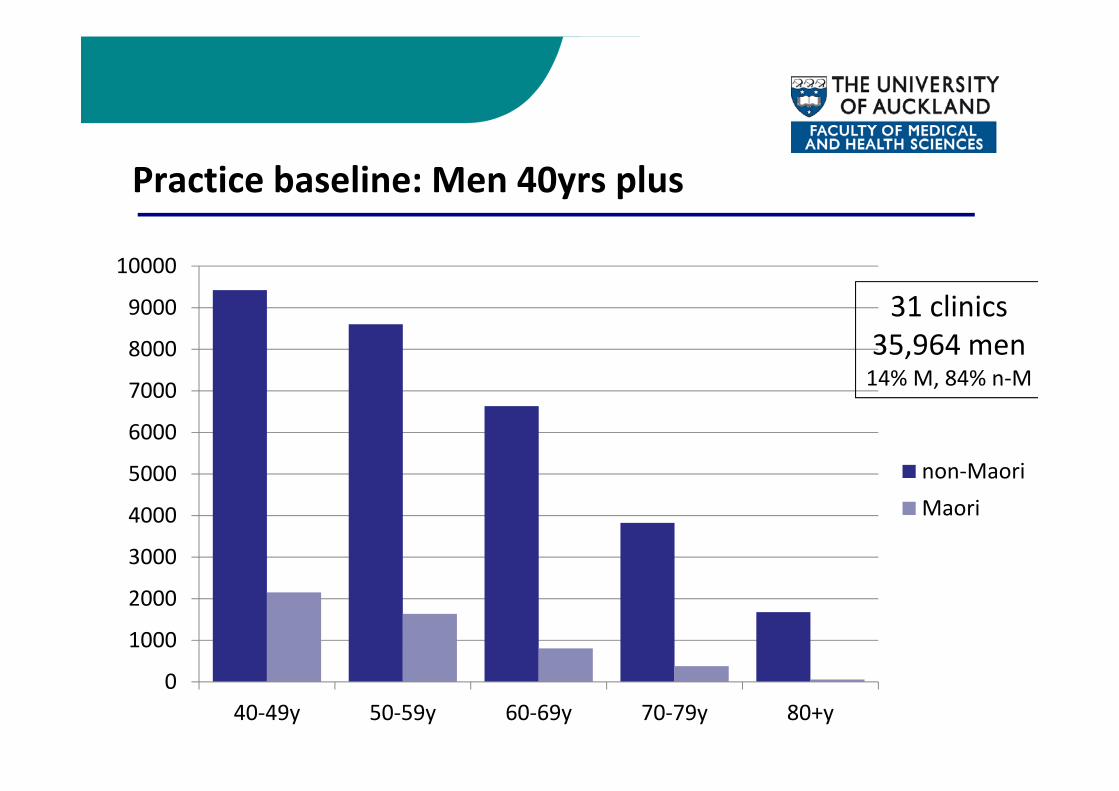
Practice baseline: Men 40yrs plus
0
1000
2000
3000
4000
5000
6000
7000
8000
9000
10000
40‐49y 50‐59y 60‐69y 70‐79y 80+y
non‐MaoriMaori
31 clinics35,964 men14% M, 84% n‐M
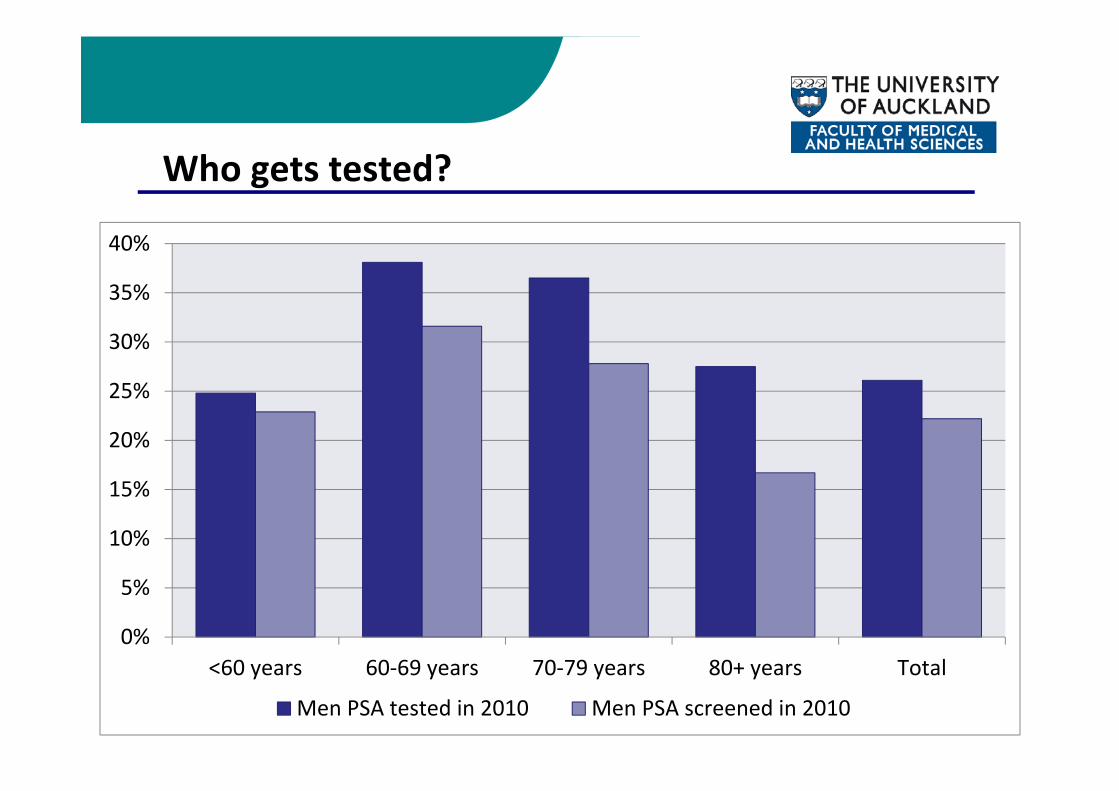
Who gets tested?
0%
5%
10%
15%
20%
25%
30%
35%
40%
<60 years 60‐69 years 70‐79 years 80+ years Total
Men PSA tested in 2010 Men PSA screened in 2010
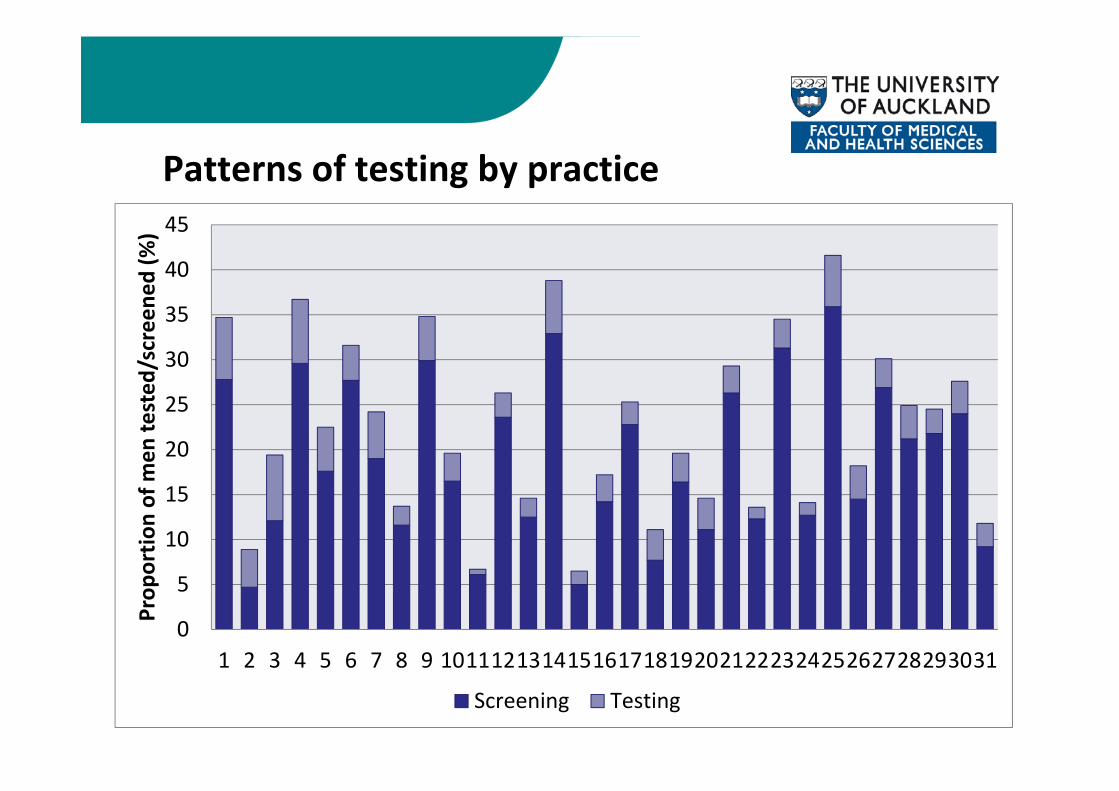
Patterns of testing by practice
0
5
10
15
20
25
30
35
40
45
1 2 3 4 5 6 7 8 9 10111213141516171819202122232425262728293031
Prop
ortio
n of m
en te
sted
/screene
d (%
)
Screening Testing
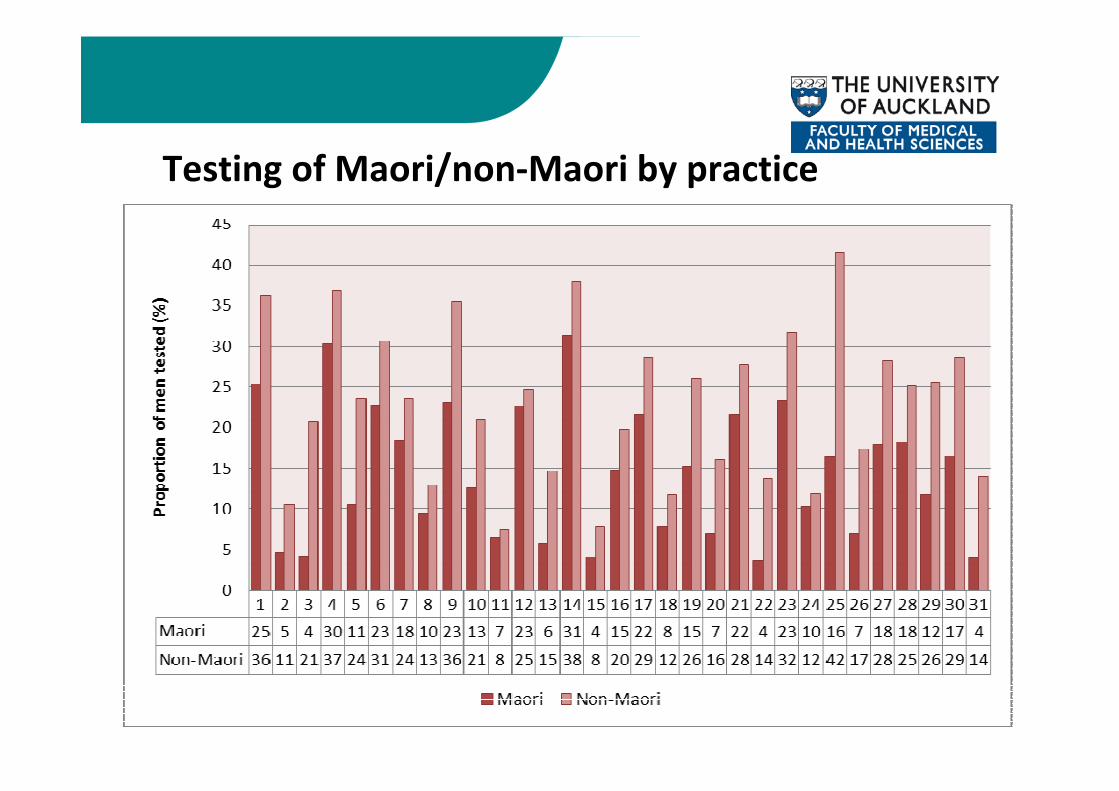
Testing of Maori/non‐Maori by practice
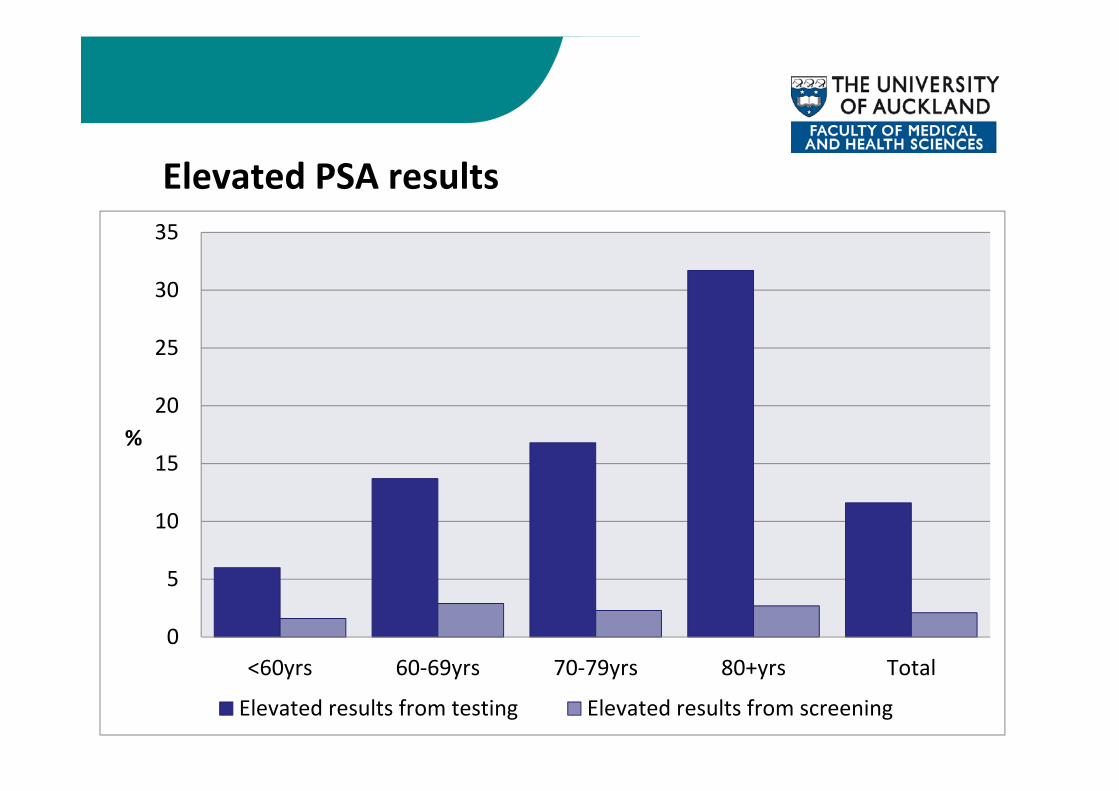
Elevated PSA results
0
5
10
15
20
25
30
35
<60yrs 60‐69yrs 70‐79yrs 80+yrs Total
%
Elevated results from testing Elevated results from screening
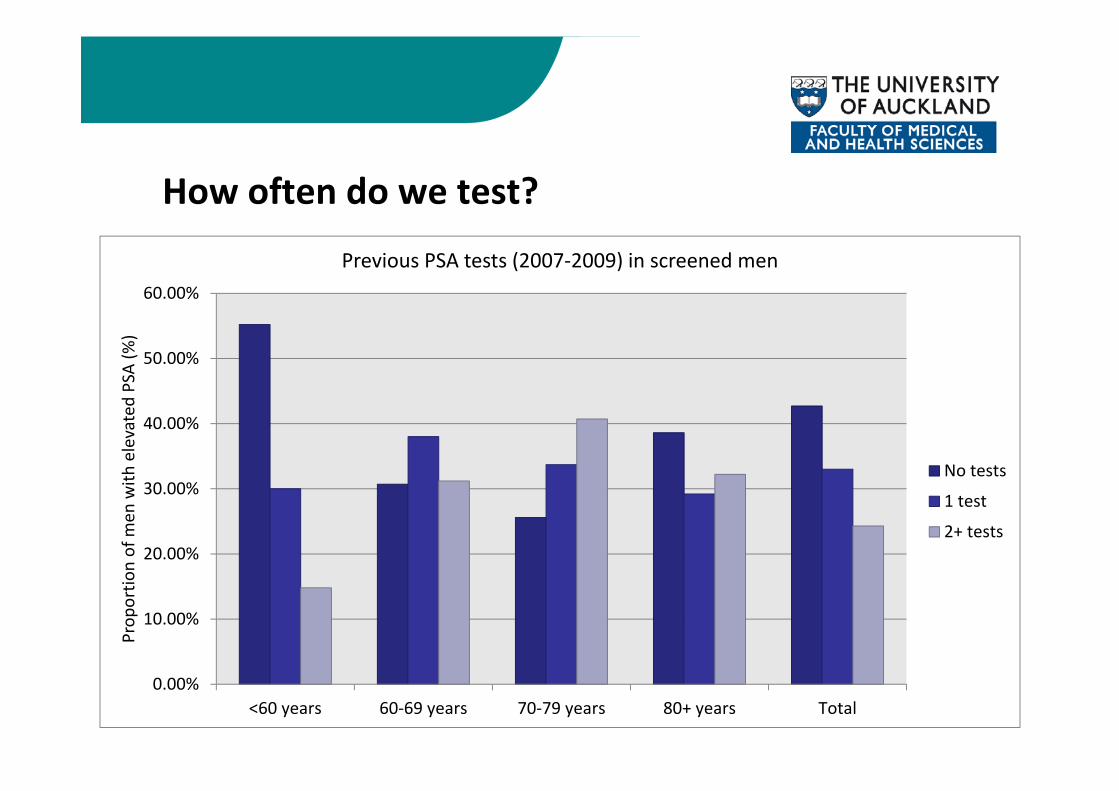
How often do we test?
0.00%
10.00%
20.00%
30.00%
40.00%
50.00%
60.00%
<60 years 60‐69 years 70‐79 years 80+ years Total
Prop
ortio
n of m
en with
elevated PSA (%
)
Previous PSA tests (2007‐2009) in screened men
No tests
1 test
2+ tests
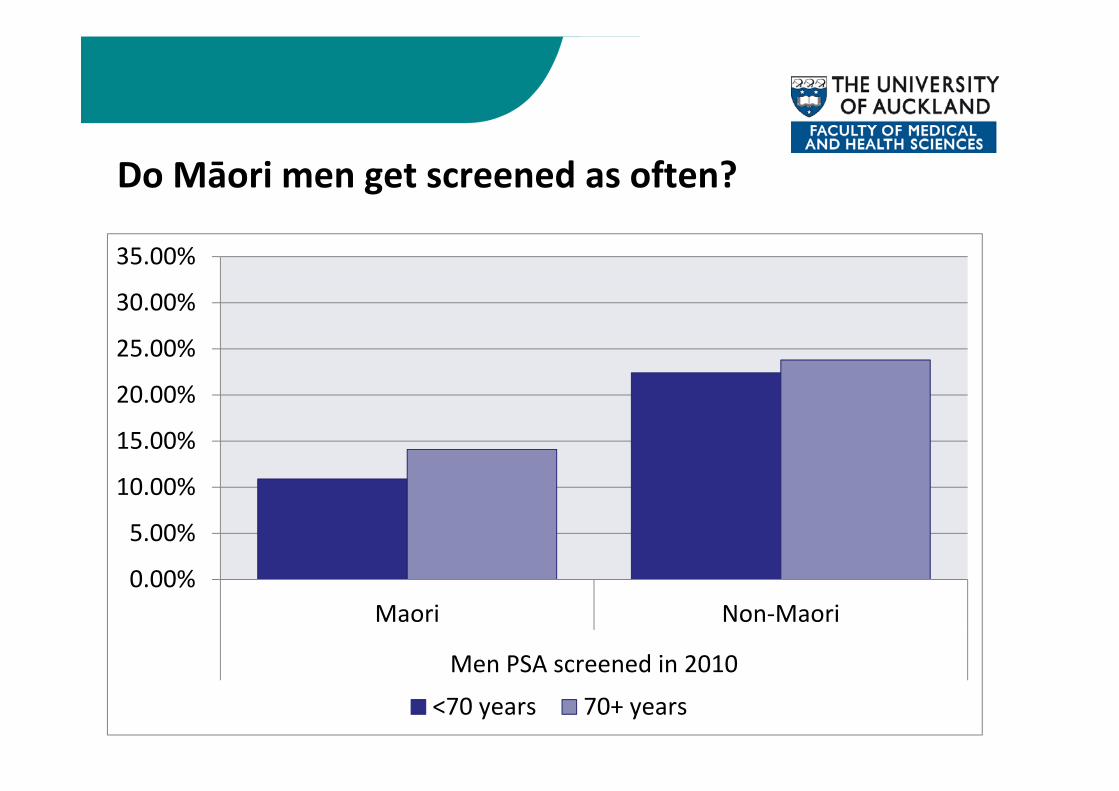
Do Māori men get screened as often?
0.00%
5.00%
10.00%
15.00%
20.00%
25.00%
30.00%
35.00%
Maori Non‐Maori
Men PSA screened in 2010
<70 years 70+ years
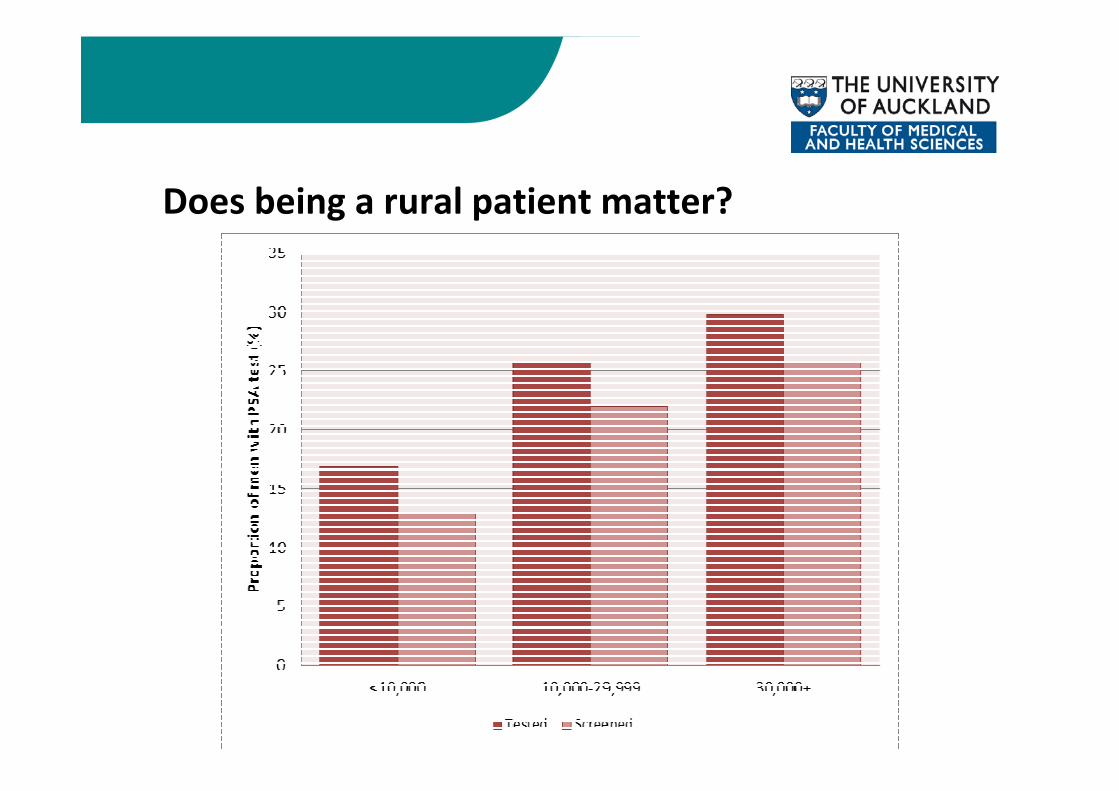
Does being a rural patient matter?
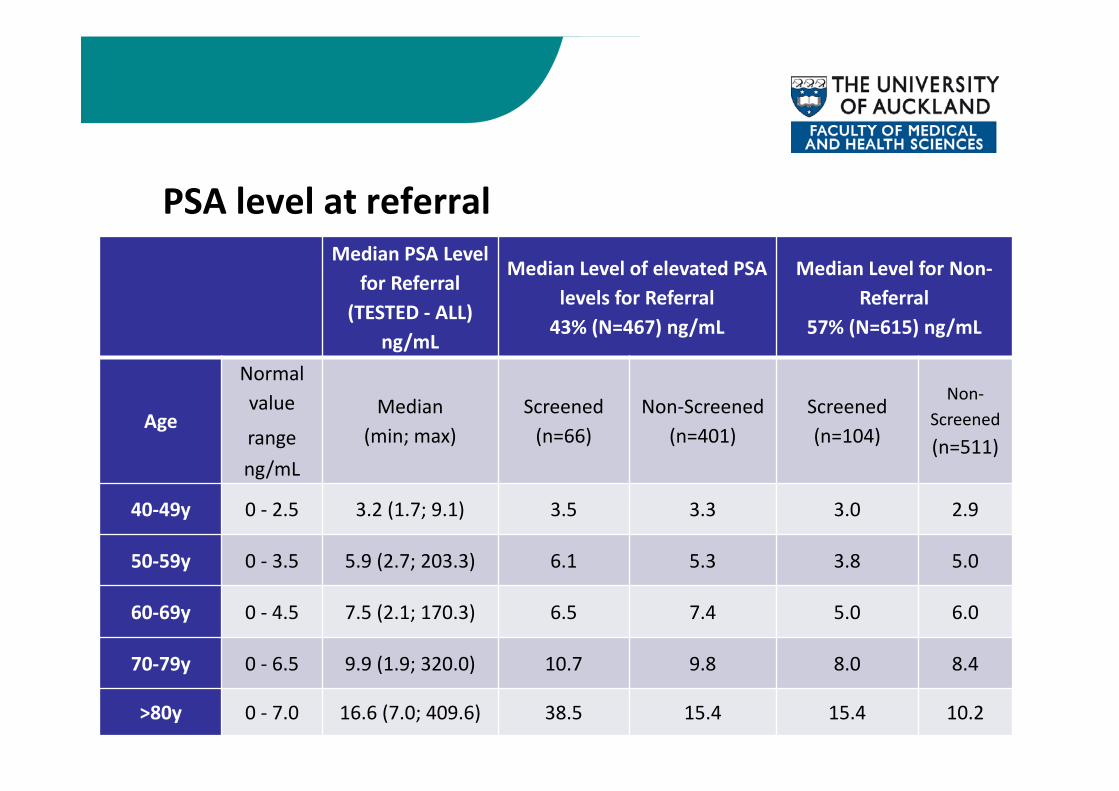
PSA level at referralMedian PSA Level
for Referral (TESTED ‐ ALL)
ng/mL
Median Level of elevated PSA levels for Referral43% (N=467) ng/mL
Median Level for Non‐Referral
57% (N=615) ng/mL
Age
Normal value
range ng/mL
Median(min; max)
Screened (n=66)
Non‐Screened (n=401)
Screened (n=104)
Non‐Screened (n=511)
40‐49y 0 ‐ 2.5 3.2 (1.7; 9.1) 3.5 3.3 3.0 2.9
50‐59y 0 ‐ 3.5 5.9 (2.7; 203.3) 6.1 5.3 3.8 5.0
60‐69y 0 ‐ 4.5 7.5 (2.1; 170.3) 6.5 7.4 5.0 6.0
70‐79y 0 ‐ 6.5 9.9 (1.9; 320.0) 10.7 9.8 8.0 8.4
>80y 0 ‐ 7.0 16.6 (7.0; 409.6) 38.5 15.4 15.4 10.2
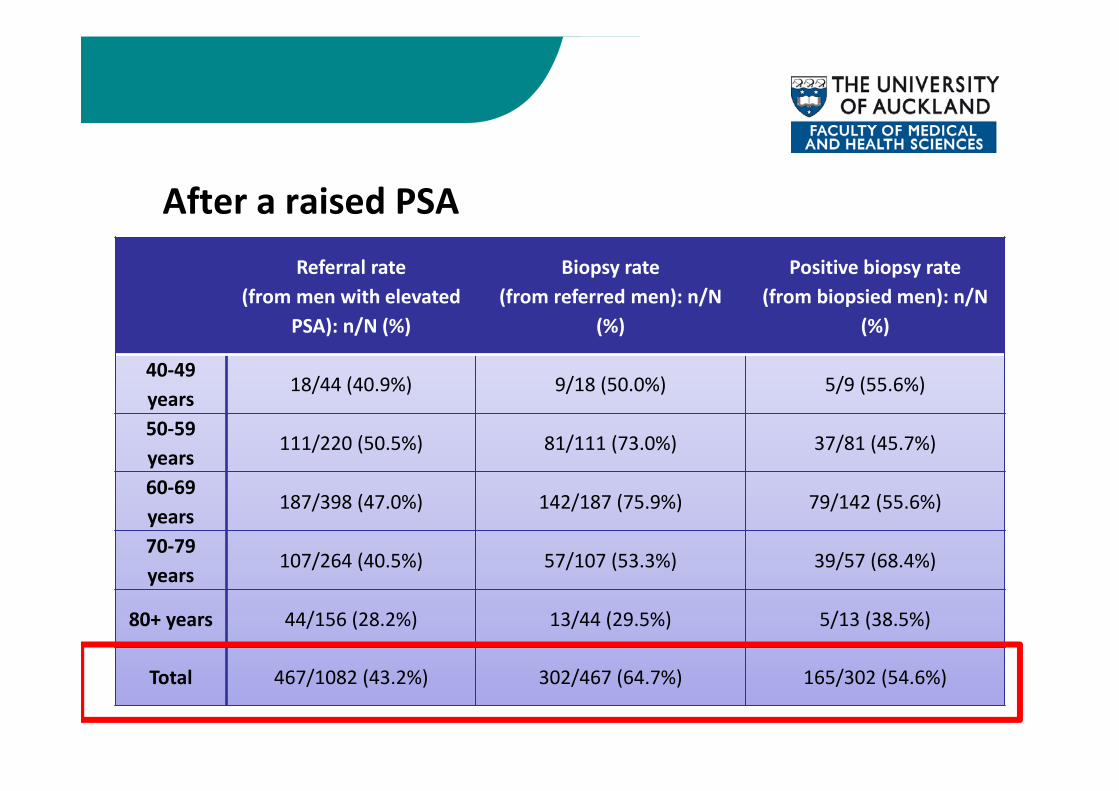
After a raised PSAReferral rate
(from men with elevated PSA): n/N (%)
Biopsy rate(from referred men): n/N
(%)
Positive biopsy rate(from biopsied men): n/N
(%)
40‐49 years
18/44 (40.9%) 9/18 (50.0%) 5/9 (55.6%)
50‐59 years
111/220 (50.5%) 81/111 (73.0%) 37/81 (45.7%)
60‐69 years
187/398 (47.0%) 142/187 (75.9%) 79/142 (55.6%)
70‐79 years
107/264 (40.5%) 57/107 (53.3%) 39/57 (68.4%)
80+ years 44/156 (28.2%) 13/44 (29.5%) 5/13 (38.5%)
Total 467/1082 (43.2%) 302/467 (64.7%) 165/302 (54.6%)
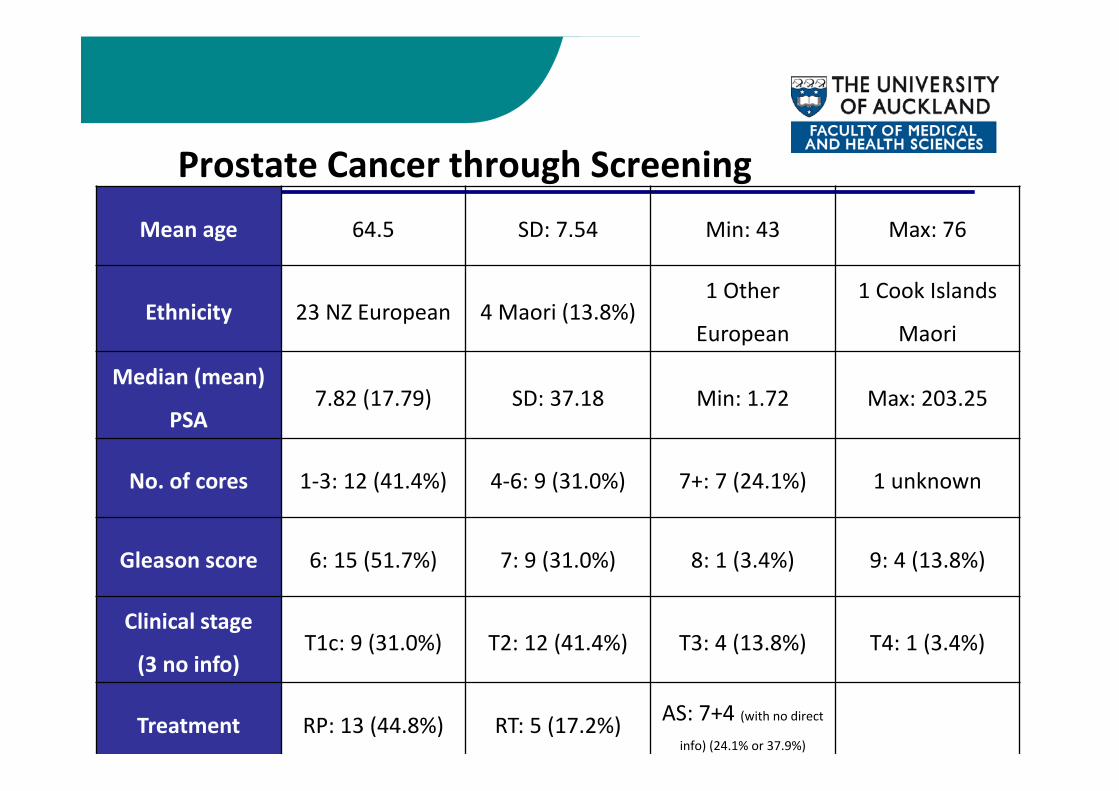
Prostate Cancer through Screening Mean age 64.5 SD: 7.54 Min: 43 Max: 76
Ethnicity 23 NZ European 4 Maori (13.8%)1 Other
European
1 Cook Islands
Maori
Median (mean)
PSA7.82 (17.79) SD: 37.18 Min: 1.72 Max: 203.25
No. of cores 1‐3: 12 (41.4%) 4‐6: 9 (31.0%) 7+: 7 (24.1%) 1 unknown
Gleason score 6: 15 (51.7%) 7: 9 (31.0%) 8: 1 (3.4%) 9: 4 (13.8%)
Clinical stage
(3 no info)T1c: 9 (31.0%) T2: 12 (41.4%) T3: 4 (13.8%) T4: 1 (3.4%)
Treatment RP: 13 (44.8%) RT: 5 (17.2%) AS: 7+4 (with no direct info) (24.1% or 37.9%)
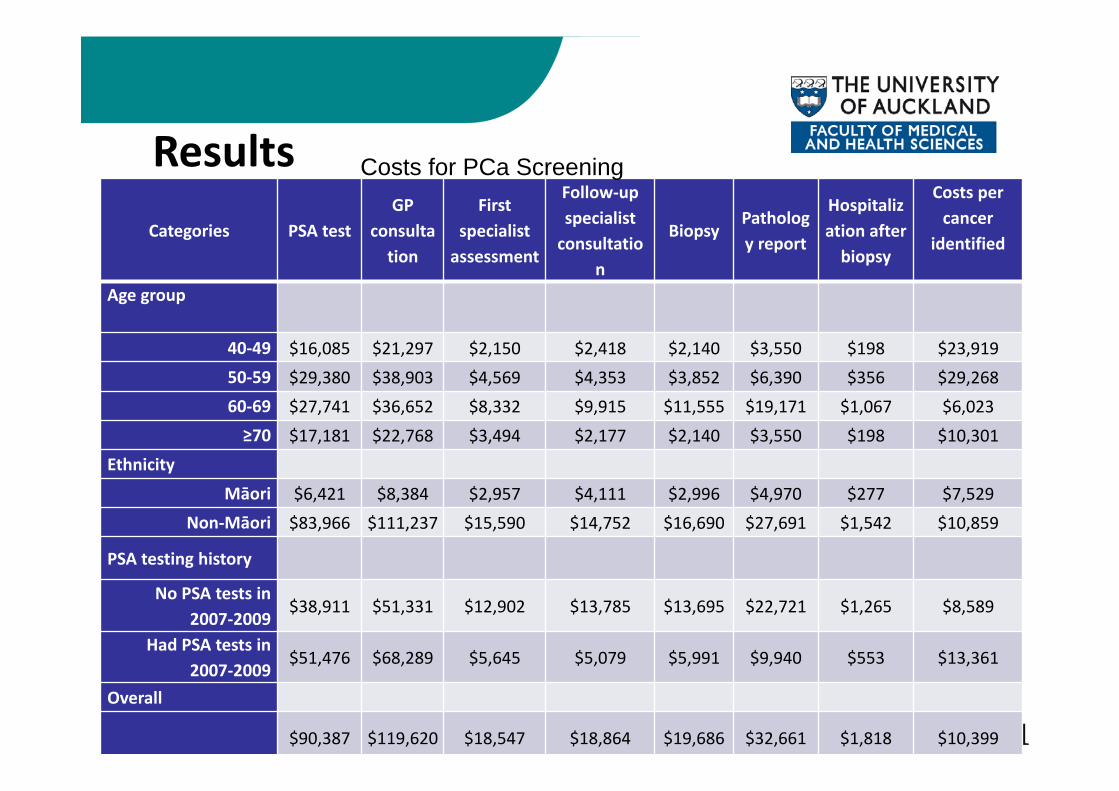
Costs of identifying a new case of prostate cancer through screening
• Using data from the GP study we wanted to estimate the costs of identifying a new case of prostate cancer taking into account age, ethnicity and previous screening history.
5
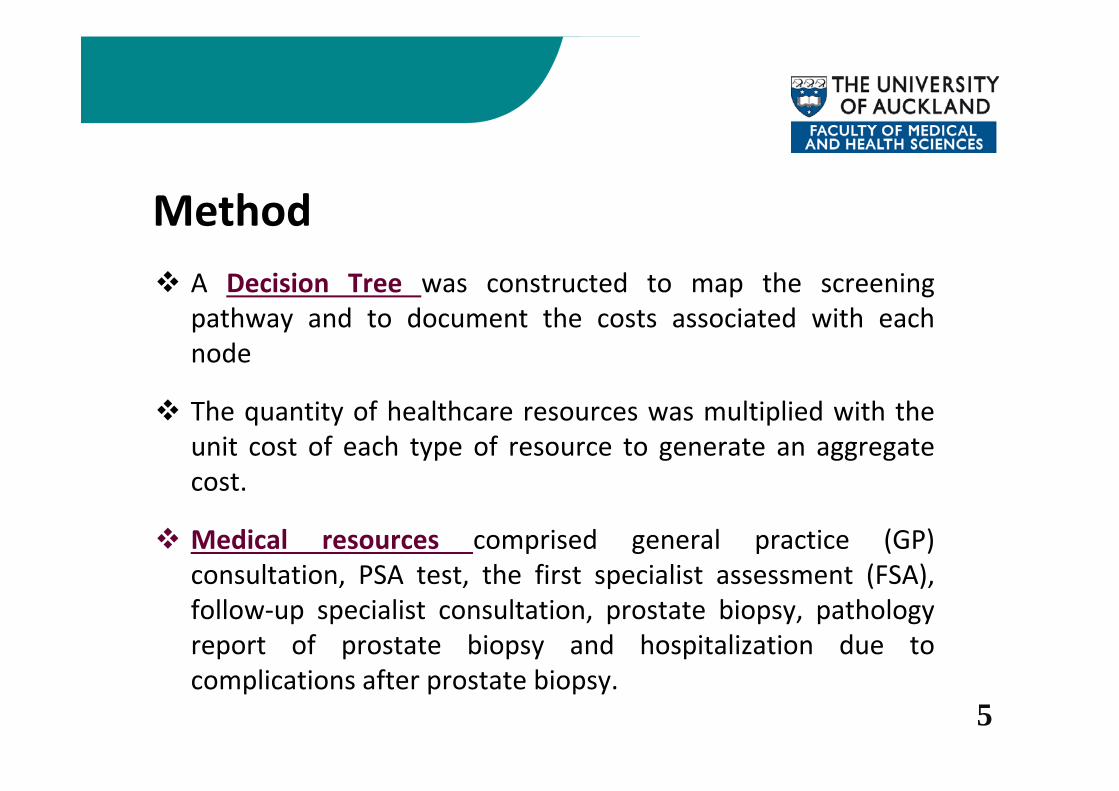
A Decision Tree was constructed to map the screeningpathway and to document the costs associated with eachnode
The quantity of healthcare resources was multiplied with theunit cost of each type of resource to generate an aggregatecost.
Medical resources comprised general practice (GP)consultation, PSA test, the first specialist assessment (FSA),follow‐up specialist consultation, prostate biopsy, pathologyreport of prostate biopsy and hospitalization due tocomplications after prostate biopsy.
Method
7
Methods
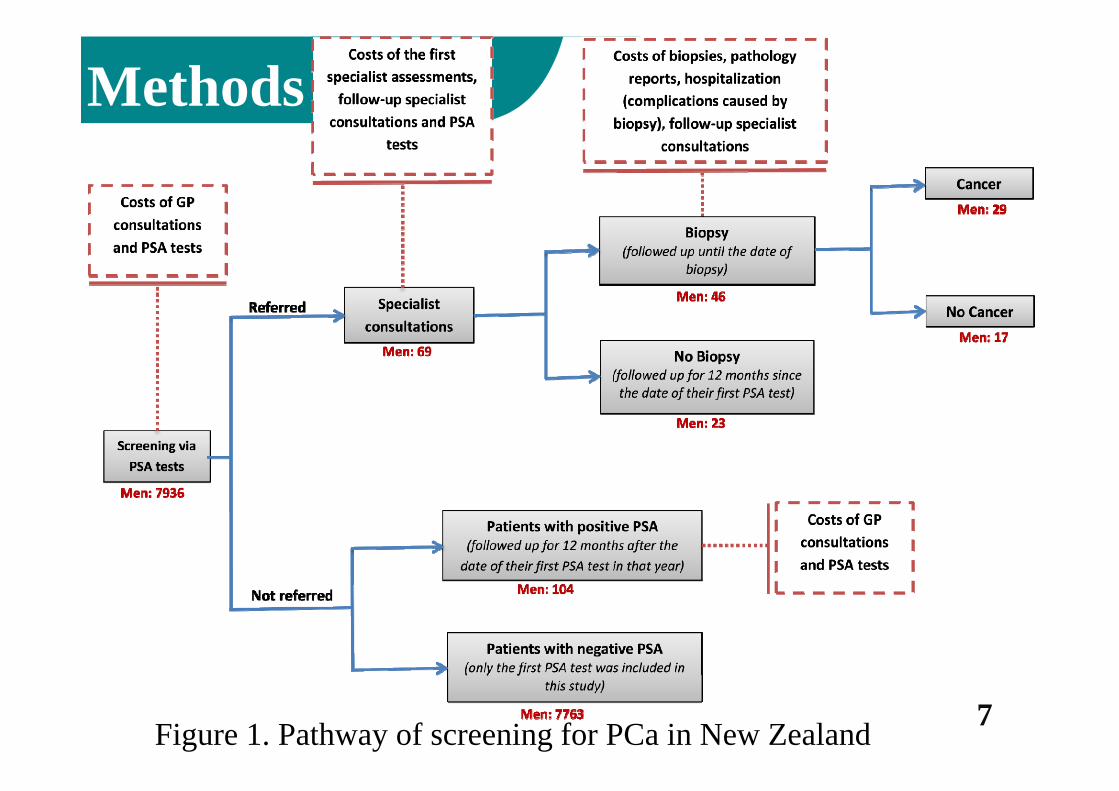
Figure 1. Pathway of screening for PCa in New Zealand
8
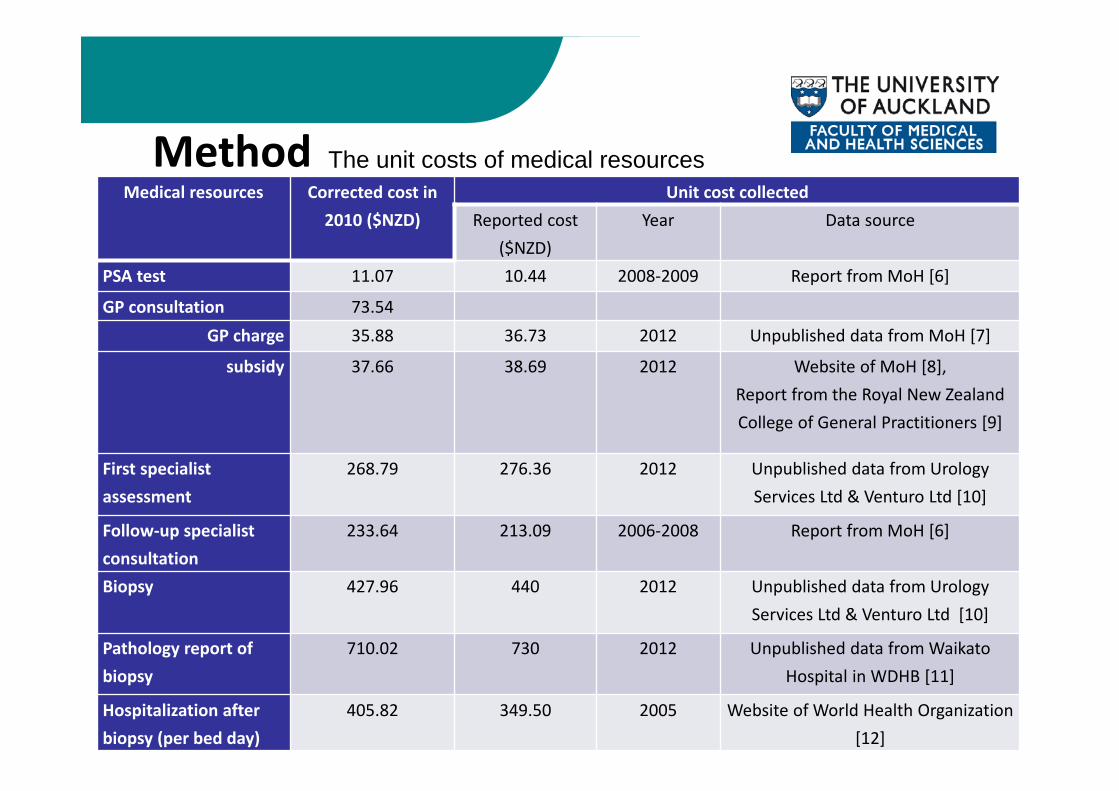
Medical resources Corrected cost in 2010 ($NZD)
Unit cost collectedReported cost
($NZD)Year Data source
PSA test 11.07 10.44 2008‐2009 Report from MoH [6]
GP consultation 73.54 GP charge 35.88 36.73 2012 Unpublished data from MoH [7]
subsidy 37.66 38.69 2012 Website of MoH [8],Report from the Royal New Zealand College of General Practitioners [9]
First specialist assessment
268.79 276.36 2012 Unpublished data from Urology Services Ltd & Venturo Ltd [10]
Follow‐up specialist consultation
233.64 213.09 2006‐2008 Report from MoH [6]
Biopsy 427.96 440 2012 Unpublished data from Urology Services Ltd & Venturo Ltd [10]
Pathology report of biopsy
710.02 730 2012 Unpublished data from Waikato Hospital in WDHB [11]
Hospitalization after biopsy (per bed day)
405.82 349.50 2005 Website of World Health Organization [12]
The unit costs of medical resourcesMethod
9
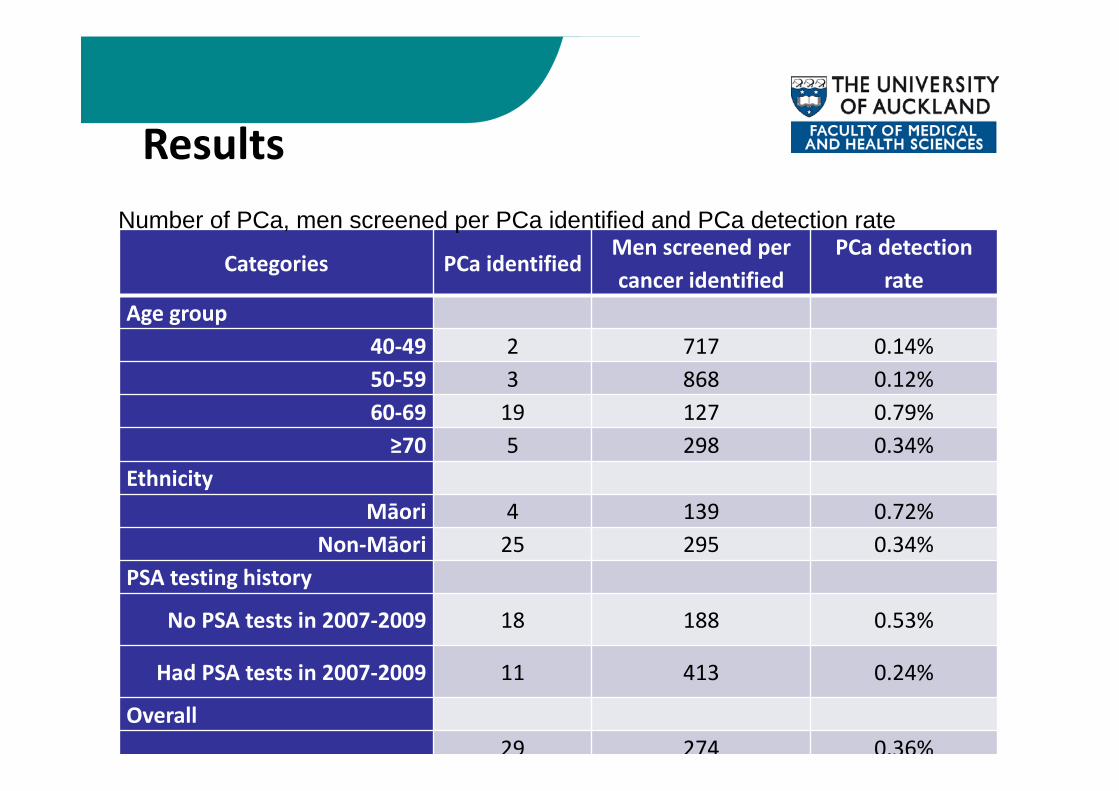
Categories PCa identifiedMen screened per cancer identified
PCa detection rate
Age group40‐49 2 717 0.14%50‐59 3 868 0.12%60‐69 19 127 0.79%≥70 5 298 0.34%
EthnicityMāori 4 139 0.72%
Non‐Māori 25 295 0.34%PSA testing history
No PSA tests in 2007‐2009 18 188 0.53%
Had PSA tests in 2007‐2009 11 413 0.24%
Overall29 274 0.36%
Number of PCa, men screened per PCa identified and PCa detection rate
Results
11
Categories PSA testGP
consultation
First specialist assessment
Follow‐up specialist consultatio
n
BiopsyPathology report
Hospitalization after biopsy
Costs per cancer
identified
Age group
40‐49 $16,085 $21,297 $2,150 $2,418 $2,140 $3,550 $198 $23,91950‐59 $29,380 $38,903 $4,569 $4,353 $3,852 $6,390 $356 $29,26860‐69 $27,741 $36,652 $8,332 $9,915 $11,555 $19,171 $1,067 $6,023≥70 $17,181 $22,768 $3,494 $2,177 $2,140 $3,550 $198 $10,301
Ethnicity
Māori $6,421 $8,384 $2,957 $4,111 $2,996 $4,970 $277 $7,529Non‐Māori $83,966 $111,237 $15,590 $14,752 $16,690 $27,691 $1,542 $10,859
PSA testing history
No PSA tests in 2007‐2009
$38,911 $51,331 $12,902 $13,785 $13,695 $22,721 $1,265 $8,589
Had PSA tests in 2007‐2009
$51,476 $68,289 $5,645 $5,079 $5,991 $9,940 $553 $13,361
Overall
$90,387 $119,620 $18,547 $18,864 $19,686 $32,661 $1,818 $10,399
Costs for PCa ScreeningResults
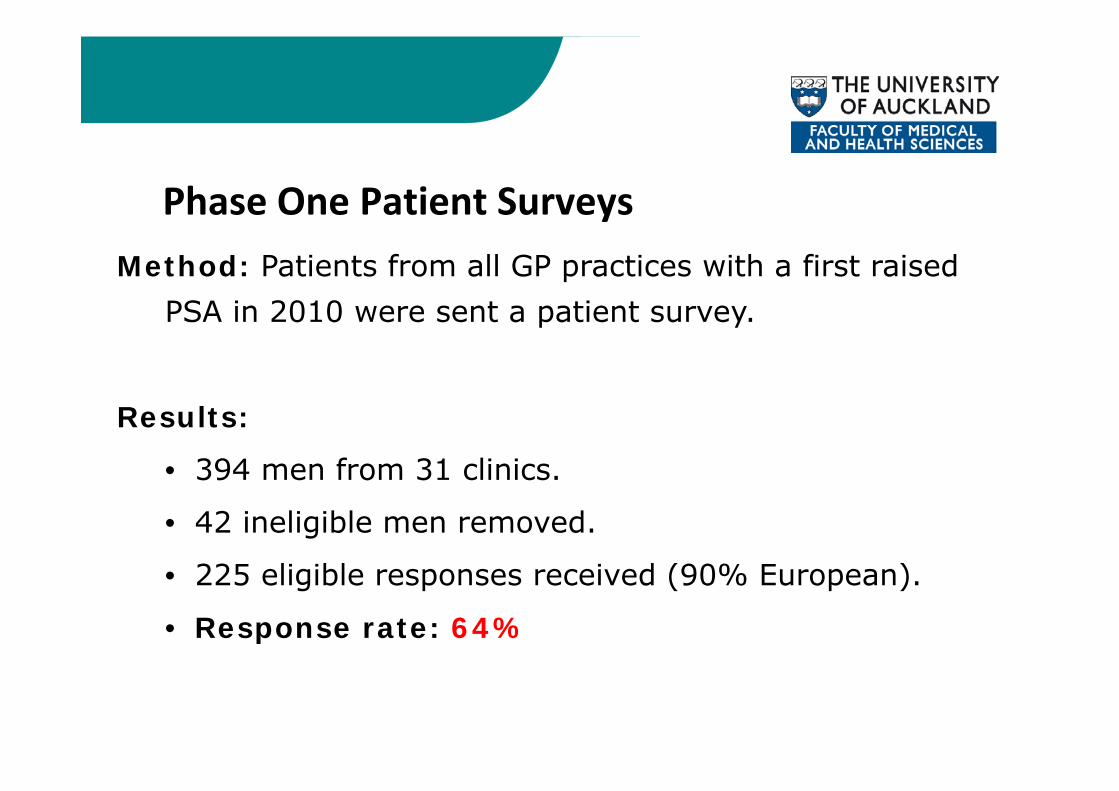
Phase One Patient SurveysMethod: Patients from all GP practices with a first raised
PSA in 2010 were sent a patient survey.
Results:
• 394 men from 31 clinics.
• 42 ineligible men removed.
• 225 eligible responses received (90% European).
• Response rate: 64%
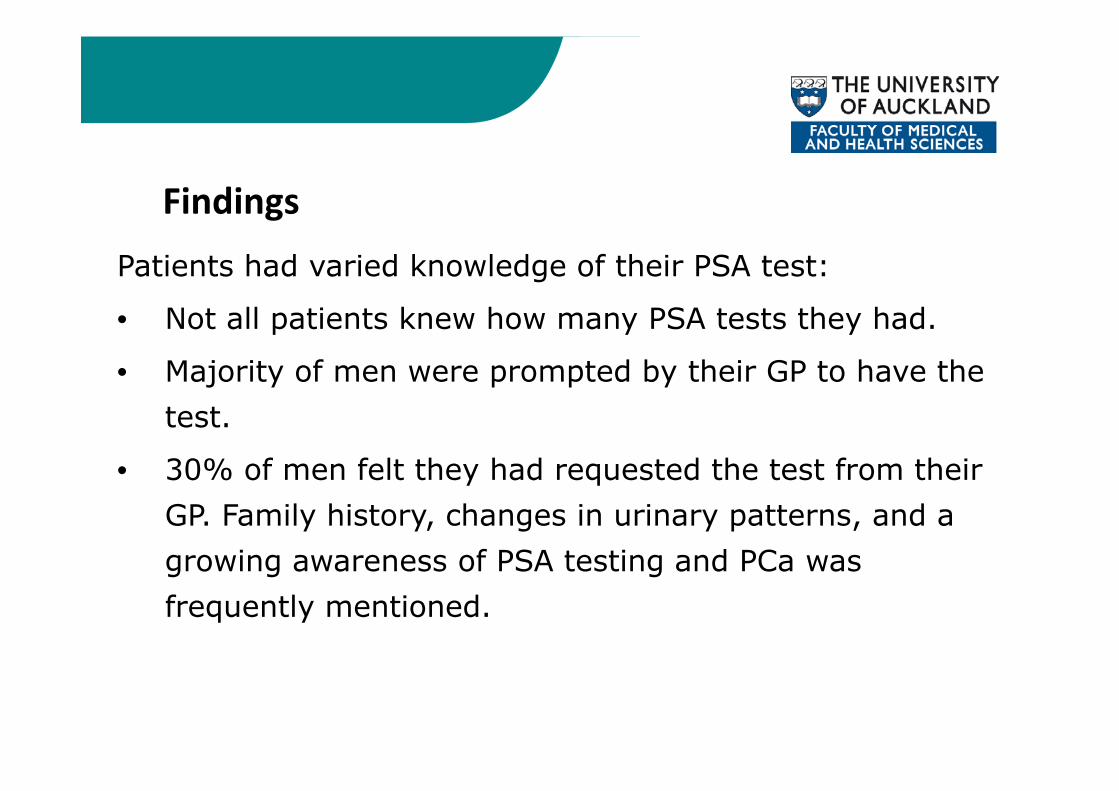
Findings
Patients had varied knowledge of their PSA test:
• Not all patients knew how many PSA tests they had.
• Majority of men were prompted by their GP to have the test.
• 30% of men felt they had requested the test from their GP. Family history, changes in urinary patterns, and a growing awareness of PSA testing and PCa was frequently mentioned.
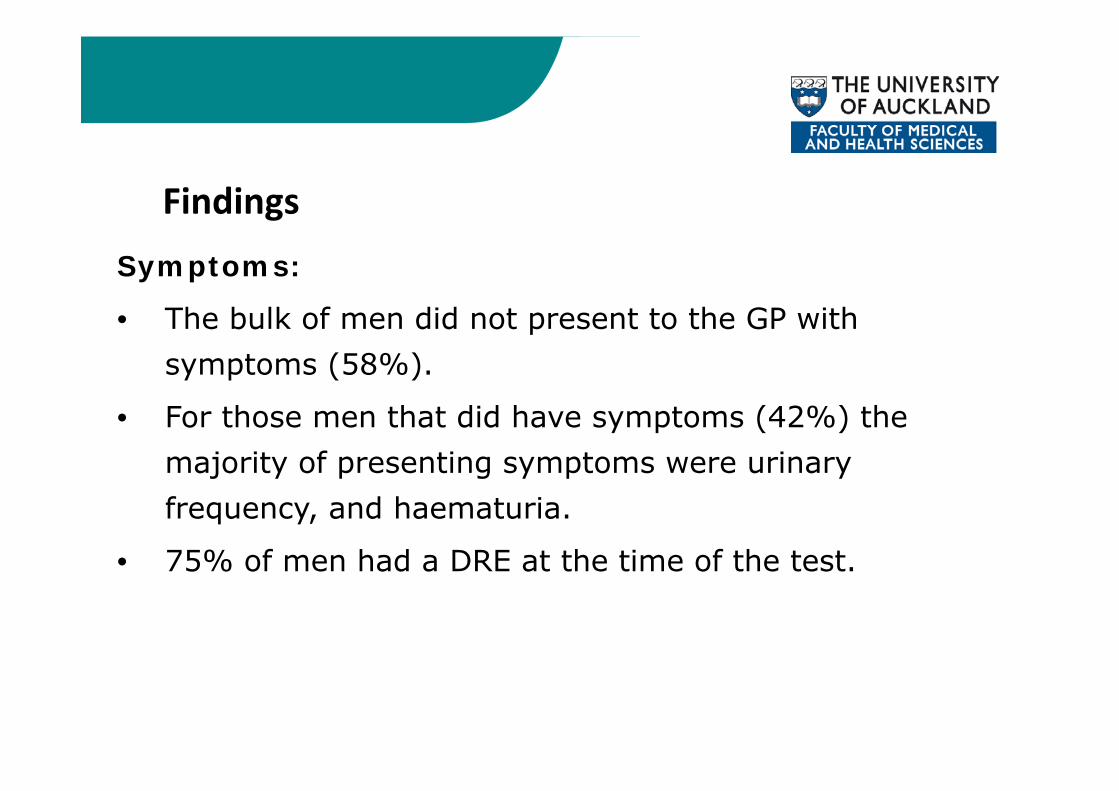
Findings
Symptoms:
• The bulk of men did not present to the GP with symptoms (58%).
• For those men that did have symptoms (42%) the majority of presenting symptoms were urinary frequency, and haematuria.
• 75% of men had a DRE at the time of the test.
Findings
Referrals:
• 58% of men were referred to a specialist.
• Most men who were referred went to see a specialist in private.
• The specialist was identified as having organised a biopsy by 67% of men.
• 26 men had a positive biopsy result.
Summary
• High rates of screening• Mainly initiated by GPs• Lower rates in Maori• Conservative referral rates• Screening considerable number of men aged over 70• Uncertain what to do if PSA negative