Embed Size (px)
Citation preview
3569071.1
PPuubblliicc DDooccuummeenntt –– TTrraaddee SSeeccrreett DDaattaa HHaass BBeeeenn EExxcciisseedd
MPUC Docket No. E-6472-/M-05-1993
OAH Docket No. 12-2500-17260-2
BEFORE THE MINNESOTA OFFICE OF ADMINISTRATIVE HEARINGS
100 Washington Square, Suite 1700 Minneapolis, Minnesota 55401-2138
FOR THE
MINNESOTA PUBLIC UTILITIES COMMISSION 127 7th Place East, Suite 350
St. Paul, Minnesota 55101-2147
In the Matter of the Petition of Excelsior Energy Inc.
and Its Wholly-Owned Subsidiary MEP-I, LLC For Approval of Terms and Conditions For The Sale of Power From Its Innovative Energy Project Using
Clean Energy Technology Under Minn. Stat. § 216B.1694 and a Determination That the Clean Energy Technology Is Or Is Likely To Be a
Least-Cost Alternative Under Minn. Stat. § 216B.1693
REBUTTAL TESTIMONY AND EXHIBITS OF
EXCELSIOR ENERGY INC. AND MEP-I LLC
EDWARD C. BODMER
OCTOBER 10, 2006
PPuubblliicc DDooccuummeenntt –– TTrraaddee SSeeccrreett DDaattaa HHaass BBeeeenn EExxcciisseedd
3569071.1
1
EXCELSIOR ENERGY, INC. 1
BEFORE THE MINNESOTA PUBLIC UTILITIES COMMISSION 2
PREPARED REBUTTAL TESTIMONY OF 3
EDWARD C. BODMER 4
I. INTRODUCTION AND QUALIFICATIONS 5
Q Please state your name and business address. 6
A My name is Edward C. Bodmer. My business address is 5951 Oakwood 7
Dr. Lisle, Illinois, 60532. 8
Q On whose behalf are you testifying? 9
A I am testifying on behalf of MEP-I LLC and Excelsior Energy Inc. 10
(collectively “Excelsior”), the developers of the Mesaba Energy Project 11
(“Mesaba” or the “Project”). 12
Q What is your present occupation? 13
A I am a consultant specializing in utility regulation and energy economic 14
analysis among other activities. 15
Q Who has employed you for in this assignment? 16
A I am working for the consulting firm Pace Global Energy Services, LLC. 17
who in turn has been retained by Excelsior. 18
Q Please summarize your educational background and professional experience. 19
A I received a B.S. degree in Finance with highest honors from the 20
University of Illinois in 1979 and an MBA degree with honors from the 21
University of Chicago in 1986. My regulatory experience began with my 22
employment on the Accounting and Finance Staff of the Illinois Commerce 23
PPuubblliicc DDooccuummeenntt –– TTrraaddee SSeeccrreett DDaattaa HHaass BBeeeenn EExxcciisseedd
3569071.1
2
Commission and has encompassed numerous assignments on regulatory issues as 1
a consultant. In a past position as a Vice President at the First National Bank of 2
Chicago, I managed the credit analysis of energy loans, which included evaluation 3
of electric and gas utility company transactions and project finance deals. In that 4
position I also directed a number of energy-related financial advice projects for 5
bank clients. 6
Since 1989, I have developed a consulting practice in the electric utility 7
industry, which has involved assignments for financial institutions, utility 8
companies, and government agencies. My projects have addressed a variety of 9
topics, including industry re-structuring, valuation, forecasting, pricing, resource 10
planning, and performance evaluation. As part of my consulting business, I have 11
presented testimony before regulatory commissions in California, Illinois, 12
Indiana, Kansas, Michigan, Massachusetts, Maine, Minnesota, Vermont and 13
Connecticut on a wide range of subjects. I have presented testimony on behalf of 14
utility companies, State Commissions, municipalities, consumer groups, and 15
taxing districts. 16
Another component of my practice is teaching professional development 17
courses on valuation, project finance, credit analysis, financial modeling, and 18
corporate finance. I have developed outlines, materials and case studies and 19
taught courses in South America, Asia, Australia, Western Europe, Eastern 20
Europe, the Middle East, and Africa as well as in the U.S. My work has included 21
workshops open to the public, which I prepared for firms that arrange courses 22
including Infocast, Euromoney, Terrapin, the Amsterdam Institute of Finance, the 23
PPuubblliicc DDooccuummeenntt –– TTrraaddee SSeeccrreett DDaattaa HHaass BBeeeenn EExxcciisseedd
3569071.1
3
Financial Training Company and the New York Institute of Finance. In addition, I 1
have taught many customized in-house courses tailored to specific institutions. 2
These companies have included HSBC (Hong Kong), ABN Amaro (Sao Palo), 3
and Citibank (Tokyo), Development Bank Singapore, CIMB (Malaysia), 4
Lindlakers (London), Saudi Aramco, the Korean Power Exchange, Indonesia 5
Power, UAE Offsets Group, Singapore Monetary Authority and others. My 6
resume is attached as Exhibit ECB-1 to this testimony. 7
Q Describe your experience with respect to resource planning and project 8
finance? 9
A Much of my work over the past twenty-five years has involved economic 10
analysis of alternative resource plans for electricity generation investments. I have 11
evaluated the financial viability of a variety of different new capacity alternatives 12
from the perspective of consumers, bankers and investors. I have developed 13
techniques to measure the risk of energy investments using project finance 14
analysis, Monte Carlo simulation and option pricing. The prior testimony 15
referenced above includes valuation of power plants in regulatory proceedings 16
and in property tax cases. As part of the courses mentioned above, I regularly 17
include lectures on the valuation of capital intensive assets in a project finance 18
context. 19
II. PURPOSE OF TESTIMONY 20
Q What is the purpose of your testimony? 21
A The purpose of this testimony is to comment on the analysis in the 22
testimony of the Minnesota Department of Commerce presented by Dr. Eilon 23
PPuubblliicc DDooccuummeenntt –– TTrraaddee SSeeccrreett DDaattaa HHaass BBeeeenn EExxcciisseedd
3569071.1
4
Amit with respect to the costs and benefits of Excelsior’s Mesaba proposed 1
Integrated Natural Gas Combined Cycle (“IGCC”) power plant. I investigate the 2
basis of his conclusion that: 3
Based on my comparable plant analysis, the cost of Excelsior's 4 proposed IGCC plant is higher than the comparable projects and 5 does not meet the provisions of Minn. Stat. 216B.1693 as being 6 likely to be a least cost resource. This would mean that Xcel would 7 not be obligated under the Statute to supply at least two percent of 8 the electric energy provided to its retail customers from the IGCC 9 plant. (Amit Testimony at 38). 10
11 Dr. Amit’s conclusion is supported by an analysis in which Mesaba is 12
shown to have anywhere from [TRADE SECRET BEGINS 28% to 118% 13
[TRADE SECRET ENDS] higher ratepayer costs than alternative pulverized 14
coal plants. The alternative coal units used by Dr. Amit are the Big Stone II 15
supercritical coal plant (“SCPC”) that is being proposed by a number of utilities 16
as well as two coal plants analyzed by NSP in its resource planning. The two NSP 17
plants include the Comanche Peak 3 Unit that is being constructed by Public 18
Service Colorado and a hypothetical pulverized coal plant at NSP’s Sherco site 19
used as a generic addition in their modeling analysis. 20
Dr. Amit’s assumptions involving the cost of a coal plant are very 21
different than the analysis presented by the Fluor Corporation (“Fluor”) and 22
Excelsior earlier in this case. Fluor provided the costs of a new Greenfield plant 23
that would be built in Minnesota under utility ownership, and Excelsior evaluated 24
that plant against the Mesaba PPA (“Fluor Report” and “Excelsior Cost Analysis 25
and Comparison”). 26
PPuubblliicc DDooccuummeenntt –– TTrraaddee SSeeccrreett DDaattaa HHaass BBeeeenn EExxcciisseedd
3569071.1
5
While the Fluor Report and Excelsior Cost Analysis and Comparison 1
apply slightly different calculation methodologies (which I will comment on later 2
in my testimony), they both fundamentally are using discounted cash flows. 3
However, the Fluor Report and Excelsior analysis calculate total present value of 4
cash flows, while Dr. Amit creates an annuity payment to present a levelized 5
nominal cost. Both approaches are valid, but different, ways to present the data. In 6
addition, different discount rates applied in the Fluor/Excelsior calculation and 7
that of Dr. Amit. The former uses 7.95% as the discount rate, which was NSP’s 8
after tax weighted average cost of capital at the time of the analysis and Dr. Amit 9
uses a value of 9.75% and cites a Big Stone II document as its source. 10
The graph below summarizes Dr. Amit’s analysis as compared to the 11
Fluor analysis, all calibrated at the 9.75% interest rate used by Dr. Amit: 12
[TRADE SECRET BEGINS 13
14
15
16
17
18
19
20
21
22
23
PPuubblliicc DDooccuummeenntt –– TTrraaddee SSeeccrreett DDaattaa HHaass BBeeeenn EExxcciisseedd
3569071.1
6
1
2
3
4
5
6
7
8
9
10
11
TRADE SECRET ENDS] 12
My testimony explains why the estimated cost of a coal plant in the Fluor scenario 13
shown above is so different from the Big Stone II, Comanche Peak, and Sherco 14
estimates prepared by Dr. Amit. I also make a corrected apples-to-apples 15
comparison of the Mesaba PPA to a supercritical coal unit in which I evaluate 16
Mesaba and the Fluor analysis of the hypothetical Sherco unit against the Big 17
Stone II plant after adjustments for the other plants that put the numbers on an 18
equal footing from a risk, timing, accounting and economic basis. 19
Q What is your principal conclusion regarding the testimony of Dr. Amit? 20
A I conclude that Dr. Amit is correct to evaluate whether Mesaba’s IGCC 21
technology is currently a least cost resource by considering how the project 22
compares with other new coal plants. This analysis is relevant to the broader 23
PPuubblliicc DDooccuummeenntt –– TTrraaddee SSeeccrreett DDaattaa HHaass BBeeeenn EExxcciisseedd
3569071.1
7
statutory determination of whether the IGCC technology is, or is likely to be, a 1
least cost resource. If the Mesaba project is actually, from inception, least cost 2
compared to the most likely alternative this is one way of demonstrating this 3
requirement. However, while I commend Dr. Amit for attempting to evaluate the 4
cost of the plant on behalf of consumers in Minnesota, his results and conclusions 5
are incorrect—to a large degree because the data he uses from NSP and the Big 6
Stone II economic analysis is incorrect and fails to fully account for the actual 7
costs of those units. I note that Dr. Amit has made it clear that he is not testifying 8
to the assumptions about costs upon which he bases his analysis; he is merely 9
using those assumptions as the inputs that form the basis of his calculations. 10
The main problem with Dr. Amit’s analysis is that the data he uses from 11
Big Stone II and NSP contain different underlying analytical approaches to 12
allocated costs in a site without an existing plant, inflation, environmental 13
benefits, real options, first of kind costs, construction timing, and measurement of 14
consumer risk than the prices in the Purchased Power Agreement (“PPA”) used 15
by Excelsior. Once the allocated costs, environmental benefits, recent increases in 16
capital cost, options, first of kind costs, and risks are put on an equal footing, my 17
analysis demonstrates that the Mesaba plant and its IGCC technology is currently 18
a least cost resource for residents and businesses in the State of Minnesota. 19
The corrected analysis that I have developed is summarized on the graph 20
below. I have not included the comparison with the Comanche Peak costs 21
provided by NSP on this graph because the Comanche Peak numbers simply do 22
PPuubblliicc DDooccuummeenntt –– TTrraaddee SSeeccrreett DDaattaa HHaass BBeeeenn EExxcciisseedd
3569071.1
8
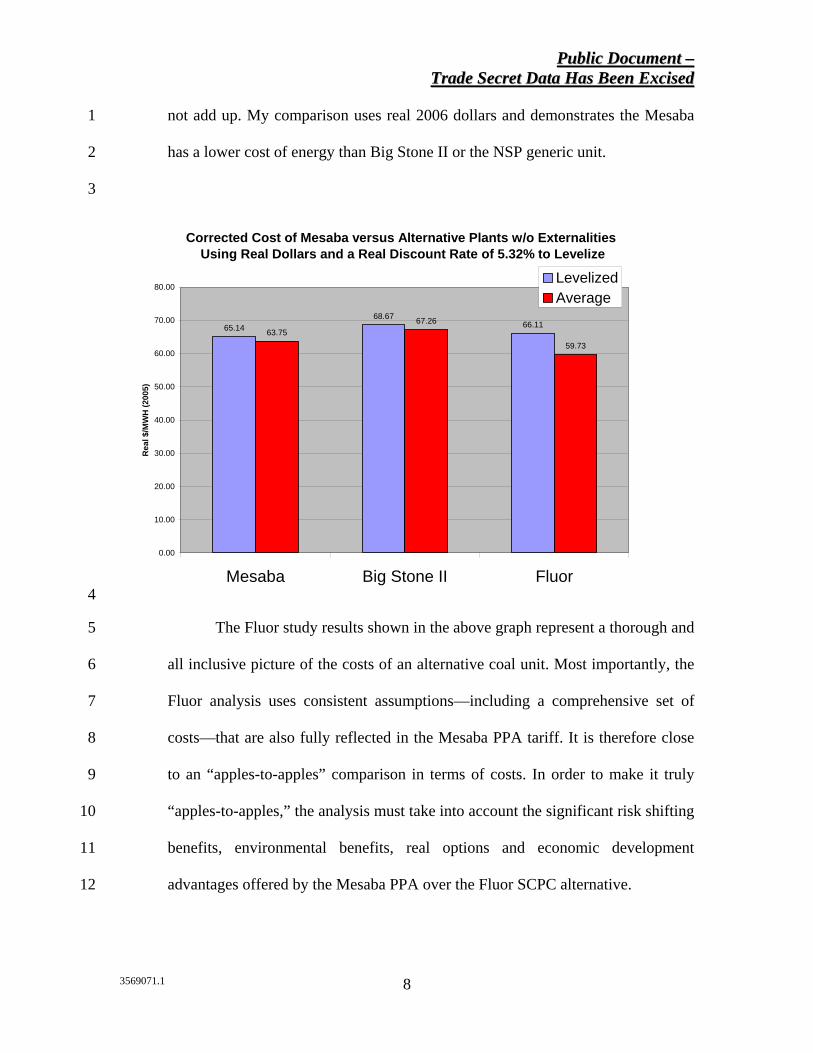
not add up. My comparison uses real 2006 dollars and demonstrates the Mesaba 1
has a lower cost of energy than Big Stone II or the NSP generic unit. 2
3
Corrected Cost of Mesaba versus Alternative Plants w/o Externalities Using Real Dollars and a Real Discount Rate of 5.32% to Levelize
65.1468.67
66.1163.75
67.26
59.73
0.00
10.00
20.00
30.00
40.00
50.00
60.00
70.00
80.00
Mesaba Big Stone II Fluor
Rea
l $/M
WH
(200
5)
LevelizedAverage
4
The Fluor study results shown in the above graph represent a thorough and 5
all inclusive picture of the costs of an alternative coal unit. Most importantly, the 6
Fluor analysis uses consistent assumptions—including a comprehensive set of 7
costs—that are also fully reflected in the Mesaba PPA tariff. It is therefore close 8
to an “apples-to-apples” comparison in terms of costs. In order to make it truly 9
“apples-to-apples,” the analysis must take into account the significant risk shifting 10
benefits, environmental benefits, real options and economic development 11
advantages offered by the Mesaba PPA over the Fluor SCPC alternative. 12
PPuubblliicc DDooccuummeenntt –– TTrraaddee SSeeccrreett DDaattaa HHaass BBeeeenn EExxcciisseedd
3569071.1
9
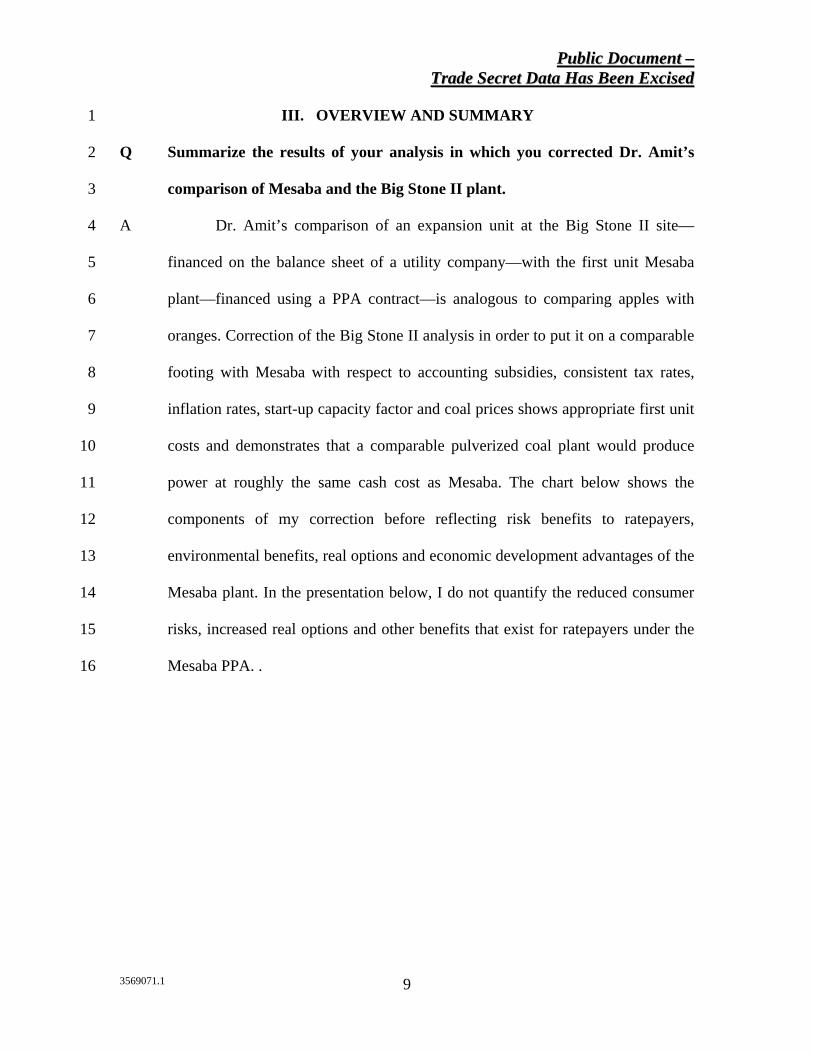
III. OVERVIEW AND SUMMARY 1
Q Summarize the results of your analysis in which you corrected Dr. Amit’s 2
comparison of Mesaba and the Big Stone II plant. 3
A Dr. Amit’s comparison of an expansion unit at the Big Stone II site—4
financed on the balance sheet of a utility company—with the first unit Mesaba 5
plant—financed using a PPA contract—is analogous to comparing apples with 6
oranges. Correction of the Big Stone II analysis in order to put it on a comparable 7
footing with Mesaba with respect to accounting subsidies, consistent tax rates, 8
inflation rates, start-up capacity factor and coal prices shows appropriate first unit 9
costs and demonstrates that a comparable pulverized coal plant would produce 10
power at roughly the same cash cost as Mesaba. The chart below shows the 11
components of my correction before reflecting risk benefits to ratepayers, 12
environmental benefits, real options and economic development advantages of the 13
Mesaba plant. In the presentation below, I do not quantify the reduced consumer 14
risks, increased real options and other benefits that exist for ratepayers under the 15
Mesaba PPA. . 16
PPuubblliicc DDooccuummeenntt –– TTrraaddee SSeeccrreett DDaattaa HHaass BBeeeenn EExxcciisseedd
3569071.1
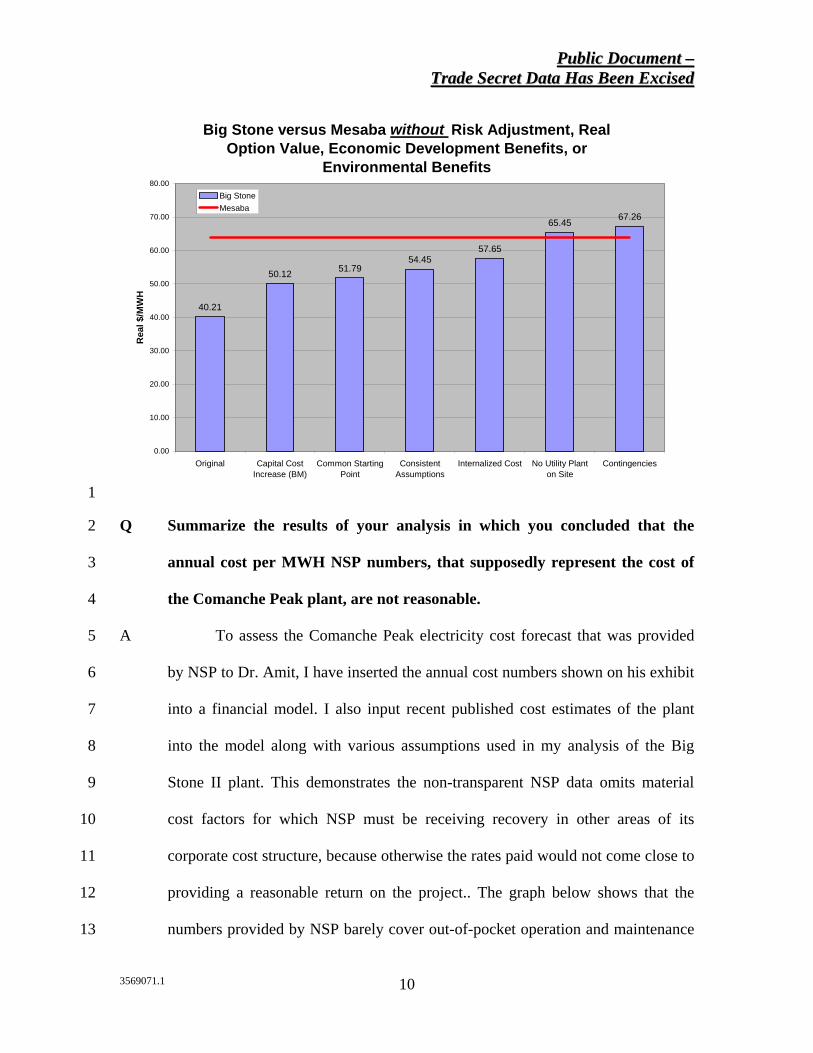
10
Big Stone versus Mesaba without Risk Adjustment, Real Option Value, Economic Development Benefits, or
Environmental Benefits
40.21
50.12 51.7954.45
57.65
65.45 67.26
0.00
10.00
20.00
30.00
40.00
50.00
60.00
70.00
80.00
Original Capital CostIncrease (BM)
Common StartingPoint
ConsistentAssumptions
Internalized Cost No Utility Planton Site
Contingencies
Rea
l $/M
WH
Big StoneMesaba
1
Q Summarize the results of your analysis in which you concluded that the 2
annual cost per MWH NSP numbers, that supposedly represent the cost of 3
the Comanche Peak plant, are not reasonable. 4
A To assess the Comanche Peak electricity cost forecast that was provided 5
by NSP to Dr. Amit, I have inserted the annual cost numbers shown on his exhibit 6
into a financial model. I also input recent published cost estimates of the plant 7
into the model along with various assumptions used in my analysis of the Big 8
Stone II plant. This demonstrates the non-transparent NSP data omits material 9
cost factors for which NSP must be receiving recovery in other areas of its 10
corporate cost structure, because otherwise the rates paid would not come close to 11
providing a reasonable return on the project.. The graph below shows that the 12
numbers provided by NSP barely cover out-of-pocket operation and maintenance 13
PPuubblliicc DDooccuummeenntt –– TTrraaddee SSeeccrreett DDaattaa HHaass BBeeeenn EExxcciisseedd
3569071.1
11
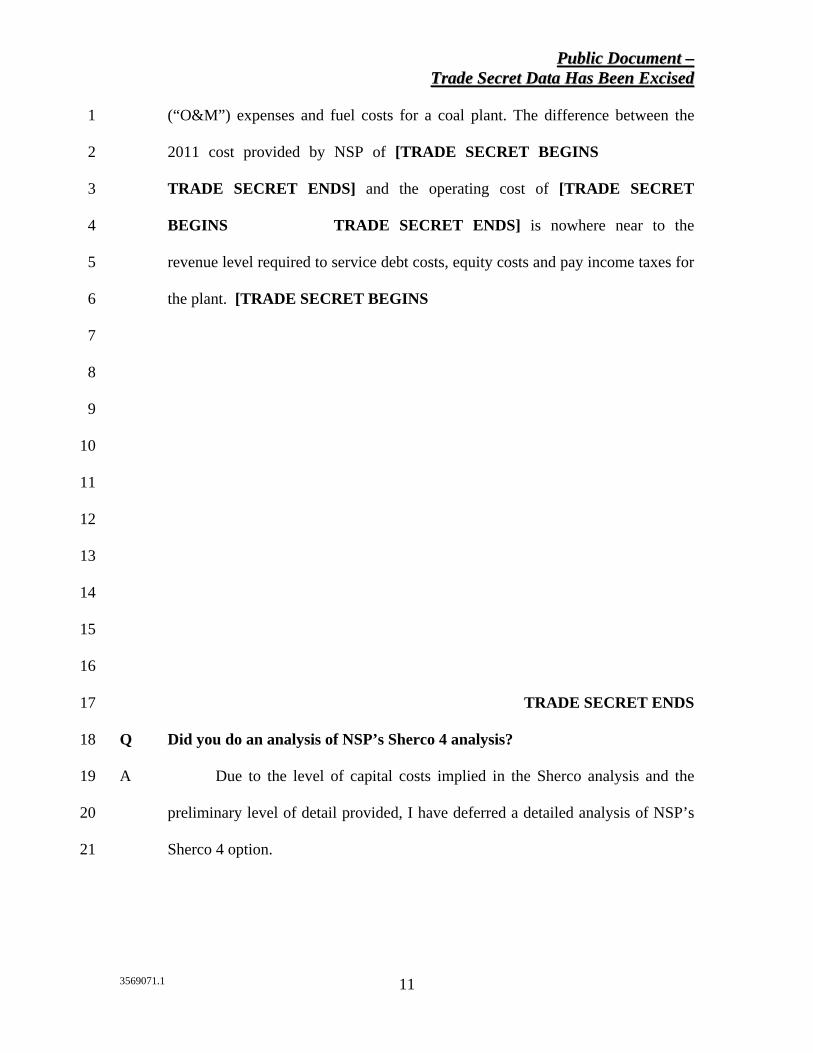
(“O&M”) expenses and fuel costs for a coal plant. The difference between the 1
2011 cost provided by NSP of [TRADE SECRET BEGINS $39.74/MWH 2
TRADE SECRET ENDS] and the operating cost of [TRADE SECRET 3
BEGINS $31.86/MWH TRADE SECRET ENDS] is nowhere near to the 4
revenue level required to service debt costs, equity costs and pay income taxes for 5
the plant. [TRADE SECRET BEGINS 6
7
8
9
10
11
12
13
14
15
16
TRADE SECRET ENDS 17
Q Did you do an analysis of NSP’s Sherco 4 analysis? 18
A Due to the level of capital costs implied in the Sherco analysis and the 19
preliminary level of detail provided, I have deferred a detailed analysis of NSP’s 20
Sherco 4 option. 21
PPuubblliicc DDooccuummeenntt –– TTrraaddee SSeeccrreett DDaattaa HHaass BBeeeenn EExxcciisseedd
3569071.1
12
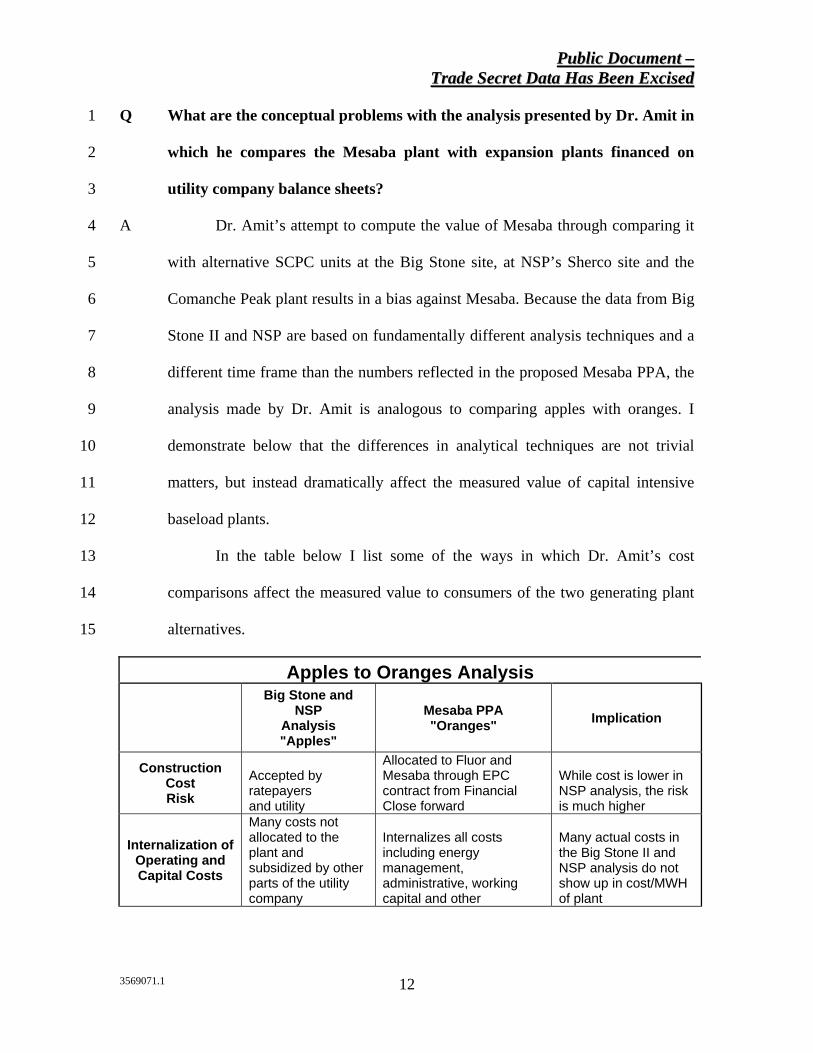
Q What are the conceptual problems with the analysis presented by Dr. Amit in 1
which he compares the Mesaba plant with expansion plants financed on 2
utility company balance sheets? 3
A Dr. Amit’s attempt to compute the value of Mesaba through comparing it 4
with alternative SCPC units at the Big Stone site, at NSP’s Sherco site and the 5
Comanche Peak plant results in a bias against Mesaba. Because the data from Big 6
Stone II and NSP are based on fundamentally different analysis techniques and a 7
different time frame than the numbers reflected in the proposed Mesaba PPA, the 8
analysis made by Dr. Amit is analogous to comparing apples with oranges. I 9
demonstrate below that the differences in analytical techniques are not trivial 10
matters, but instead dramatically affect the measured value of capital intensive 11
baseload plants. 12
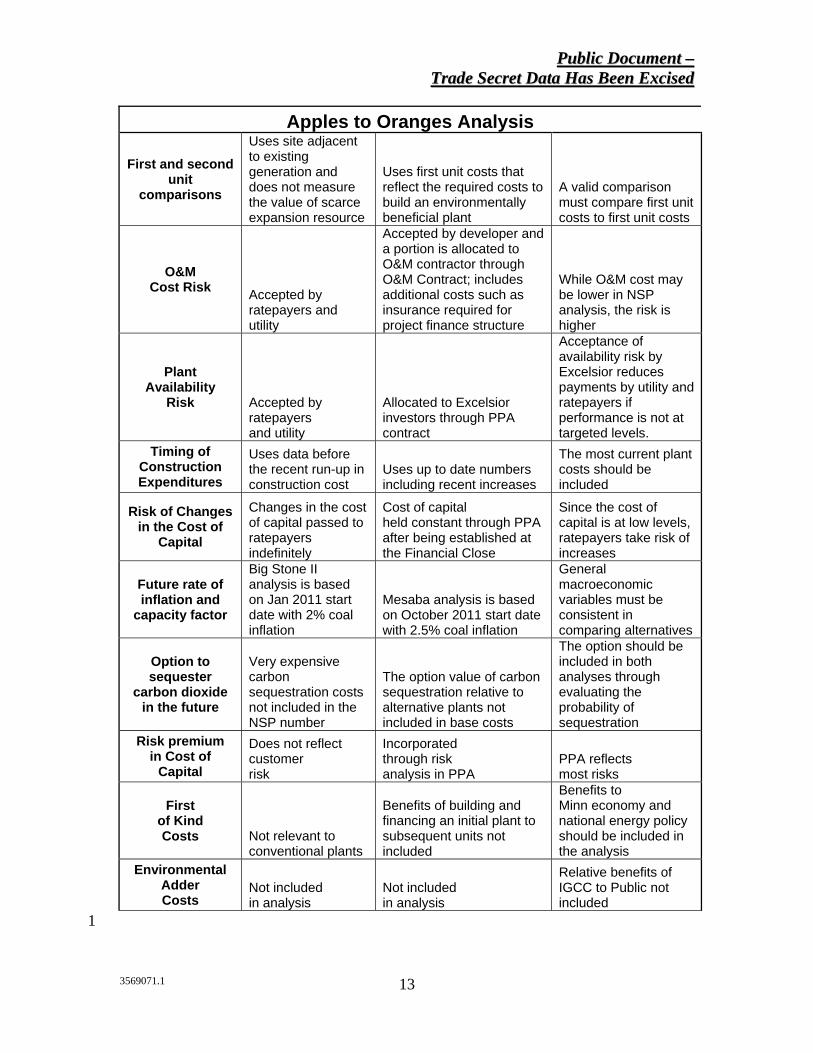
In the table below I list some of the ways in which Dr. Amit’s cost 13
comparisons affect the measured value to consumers of the two generating plant 14
alternatives. 15
Apples to Oranges Analysis
Big Stone and
NSP Analysis "Apples"
Mesaba PPA "Oranges" Implication
Construction Cost Risk
Accepted by ratepayers and utility
Allocated to Fluor and Mesaba through EPC contract from Financial Close forward
While cost is lower in NSP analysis, the risk is much higher
Internalization of Operating and Capital Costs
Many costs not allocated to the plant and subsidized by other parts of the utility company
Internalizes all costs including energy management, administrative, working capital and other
Many actual costs in the Big Stone II and NSP analysis do not show up in cost/MWH of plant
PPuubblliicc DDooccuummeenntt –– TTrraaddee SSeeccrreett DDaattaa HHaass BBeeeenn EExxcciisseedd
3569071.1
13
Apples to Oranges Analysis
First and second unit
comparisons
Uses site adjacent to existing generation and does not measure the value of scarce expansion resource
Uses first unit costs that reflect the required costs to build an environmentally beneficial plant
A valid comparison must compare first unit costs to first unit costs
O&M Cost Risk Accepted by
ratepayers and utility
Accepted by developer and a portion is allocated to O&M contractor through O&M Contract; includes additional costs such as insurance required for project finance structure
While O&M cost may be lower in NSP analysis, the risk is higher
Plant Availability
Risk Accepted by ratepayers and utility
Allocated to Excelsior investors through PPA contract
Acceptance of availability risk by Excelsior reduces payments by utility and ratepayers if performance is not at targeted levels.
Timing of Construction Expenditures
Uses data before the recent run-up in construction cost
Uses up to date numbers including recent increases
The most current plant costs should be included
Risk of Changes in the Cost of
Capital
Changes in the cost of capital passed to ratepayers indefinitely
Cost of capital held constant through PPA after being established at the Financial Close
Since the cost of capital is at low levels, ratepayers take risk of increases
Future rate of inflation and
capacity factor
Big Stone II analysis is based on Jan 2011 start date with 2% coal inflation
Mesaba analysis is based on October 2011 start date with 2.5% coal inflation
General macroeconomic variables must be consistent in comparing alternatives
Option to sequester
carbon dioxide in the future
Very expensive carbon sequestration costs not included in the NSP number
The option value of carbon sequestration relative to alternative plants not included in base costs
The option should be included in both analyses through evaluating the probability of sequestration
Risk premium in Cost of
Capital
Does not reflect customer risk
Incorporated through risk analysis in PPA
PPA reflects most risks
First of Kind Costs Not relevant to
conventional plants
Benefits of building and financing an initial plant to subsequent units not included
Benefits to Minn economy and national energy policy should be included in the analysis
Environmental Adder Costs
Not included in analysis
Not included in analysis
Relative benefits of IGCC to Public not included
1
PPuubblliicc DDooccuummeenntt –– TTrraaddee SSeeccrreett DDaattaa HHaass BBeeeenn EExxcciisseedd
3569071.1
14
Q In evaluating whether Mesaba is a least cost resource based on the factors 1
shown in the graphs above, does the analysis in the above table include all the 2
appropriate cost elements? 3
A No. When assessing whether Mesaba is a least cost alternative, additional 4
elements must be considered including the reduced risk profile, additional 5
environmental benefits, flexibility to meet new and tightening emission limits, 6
real options and economic development benefits. A summary of these benefits 7
includes: 8
1. The risk profile benefits to ratepayers of the energy supplied under the 9
PPA ratepayers is not reflected in the Big Stone II comparison. With a 10
PPA structure, rather than conventional ratemaking, consumers incur 11
lower risks of cost of capital changes, construction cost over-runs, 12
construction delays, O&M variation, and plant availability. 13
2. The Mesaba project includes a number of valuable real options that 14
benefit ratepayers and that are not available to other coal plants including: 15
(1) the option to sequester carbon; (2) the option to switch between 16
different coal sources including Petroleum Coke; and (3) the option to use 17
natural gas in providing backup capacity. 18
3. Additional environmental benefits accrue to citizens of Minnesota from 19
Mesaba relative to the SCPC alternatives. These benefits are described in 20
Section III of Excelsior’s December 27, 2005 Petition for Approval of a 21
Power Purchase Agreement, Determination that Clean Energy 22
Technology is Likely to be a Least Cost Resource and Establishment of 23
PPuubblliicc DDooccuummeenntt –– TTrraaddee SSeeccrreett DDaattaa HHaass BBeeeenn EExxcciisseedd
3569071.1
15
the Clean Energy Technology Minimum (the “Petition”), and include the 1
ability to meet tightening emission limits due to the inherently lower 2
emission profile of the IGCC technology and the flexibility of the 3
technology to cost-effectively retrofit to meet tighter emission limits in 4
the future. 5
4. Construction of Mesaba provides additional economic development 6
benefits to citizens of Minnesota that do not occur from building 7
conventional coal plant alternative. Construction of “first of kind” IGCC 8
plants will allow future plants to be built at a lower cost as construction 9
techniques become more standardized. Since IGCC plants allow coal 10
resources in the region to be used on a more environmentally friendly 11
basis, this first of a kind premium provides value over and above the bare 12
bones cost comparison. Second, the Mesaba plant includes employment 13
benefits to the State of Minnesota relative to plants such as Big Stone II 14
that are built out of state or even out of the country. Third, Mesaba is 15
being built in an economically depressed area. This contrasts to the 16
hypothetical Sherco unit which would be built in part of the extended 17
metro counties area. 18
Q Can you comment about the price stability offered by the Mesaba PPA? 19
A Many of the risk items outlined in the table above relate directly to the 20
cost of power for the ratepayers. As these risks are borne by Mesaba and not the 21
ratepayer, the actual cost of electricity for the ratepayer is much more easily 22
predicted. The tariff mechanism of a typical PPA offers the ability to forecast or 23
PPuubblliicc DDooccuummeenntt –– TTrraaddee SSeeccrreett DDaattaa HHaass BBeeeenn EExxcciisseedd
3569071.1
16
predict the price over the life of the contract. In the case of the Mesaba PPA, the 1
capacity component is fixed over the life of the contract; the fixed and variable 2
O&M tariffs are set, and subject only to any adjustment for inflation in the 3
economy. With a capital intensive plant, the capacity price will be a significant 4
portion of the price, and since it is set at the signing of the PPA, the price will be 5
very stable going forward. The only element of the tariff that is not fixed or linked 6
to an inflation index, is the price of fuel, although by design the choice of fuel for 7
the Mesaba plant, coal, is a relatively small component of the total cost. In fact, 8
since the capacity component of the revenue stream is negatively impacted when 9
the plant does not generate, it is not just the annual costs of the plant that are 10
stable, but also the average cost of electricity. Thus, if the plant does not perform 11
and produces less than forecasted quantities of energy in a particular year, the 12
ratepayer will only bear the capacity cost for those hours when the plant was 13
available to supply energy. Total payments to Mesaba will be lower, and the 14
average price per kWh of electricity generated will be similar to that price in a 15
year where it operated at full availability. 16
Q What is your opinion about stability of the price of the output from the 17
project? 18
A Once the capacity price is fixed at the start of construction, during the 4 19
years of construction and for the full 25 year term of the PPA, the price of 20
capacity under the contract will be extremely stable, particularly in contrast to a 21
natural gas fired facility or a utility self-build plant that does not lock in its pricing 22
over a similar time horizon. 23
PPuubblliicc DDooccuummeenntt –– TTrraaddee SSeeccrreett DDaattaa HHaass BBeeeenn EExxcciisseedd
3569071.1
17
III. TESTIMONY OUTLINE 1
Q How have you arranged the balance of your testimony? 2
A After describing the organization of my testimony and an overview of 3
contextual issues relevant to the case, the rest of my testimony describes details of 4
the corrected apples-to-apples analysis summarized above. 5
Q Describe the way you have divided your remaining testimony into various 6
sections. 7
A My testimony is organized as follows into seven additional sections: 8
1. Overview and context of risk issues associated with evaluation of 9
resource alternatives. 10
2. Dr. Amit’s analysis of the costs of the PPA associated with the 11
Mesaba plant. 12
3. Refinement of Dr. Amit’s comparison of the Big Stone II plant 13
with Mesaba. 14
5. Refinement of Dr. Amit’s comparison of Mesaba with Sherco 4 15
and Comanche Peak 3. 16
6. Inclusion of real options including the carbon sequestration option 17
in the ratepayer analysis. 18
7. PPA issues discussed by Dr. Amit. 19
IV. ANALYSIS OF PROJECT FINANCED PLANTS VERSUS UTILITY 20
FINANCED PLANTS—OVERVIEW AND CONTEXT 21
Q What issues do you discuss before you work through specific problems with 22
Dr. Amit’s analysis? 23
PPuubblliicc DDooccuummeenntt –– TTrraaddee SSeeccrreett DDaattaa HHaass BBeeeenn EExxcciisseedd
3569071.1
18
A In this section I begin by discussing general issues associated with 1
measuring risk in the context of evaluating alternative resource additions. I 2
include this because electricity supplied from a plant such as Big Stone II and 3
NSP contain very different consumer risks than the Mesaba PPA. In describing 4
how risks affect the quantification of relative value between resource alternative, I 5
discuss the history of capacity additions in the electric utility industry including 6
the fact the last time the large, capital intensive plants were built—coal and 7
nuclear plants in the 1970’s and 1980’s—there were massive cost overruns, 8
delays, prudence adjustments and utility company bankruptcies. 9
Q How can one define risks to ratepayers associated with different generation 10
resources? 11
A Ratepayer risk associated with new generation can be defined as the 12
variation in the cost of electricity experienced by ratepayers over the lifetime of a 13
resource. To illustrate how risks should be incorporated in an analysis of two 14
alternative resources, consider the following example of the evaluation of two 15
hypothetical resources—Resource A and Resource B. Assume that the base case 16
Busbar price of Resource A is expected to be $60/MWH and it has a distribution 17
of prices ranging from $50/MWH to $150/MWH. Resource A is more risky than a 18
second resource—Resource B—which has a base case Busbar price of $70/MWH 19
with a much smaller range of prices between $60/MWH and $80/MWH. The 20
difference in risk is driven by uncertainty associated with construction cost, O&M 21
cost, plant availability, heat rate, fuel prices and changes in emission limits. 22
PPuubblliicc DDooccuummeenntt –– TTrraaddee SSeeccrreett DDaattaa HHaass BBeeeenn EExxcciisseedd
3569071.1
19
To illustrate the analytical issues that arise with this problem, assume that 1
the risks associated with Resource A and Resource B result in probability 2
distributions shown in the graph below. I will demonstrate in my testimony below 3
that the Mesaba plant has a far lower distribution of ratepayer prices than the Big 4
Stone II and Sherco alternatives. 5
Error! Objects cannot be created from editing field codes. 6
The data in the above graph do not allow a decision maker to definitively 7
assess whether Resource A or Resource B is in fact least cost to ratepayers 8
because policymakers must assess the value ratepayers lose from being exposed 9
to the higher distribution of prices versus the benefit of lower expected rates in the 10
alternative case. This problem of explicitly accounting for different risks has been 11
a daunting problem for policymakers. In the instant case, the analysis is simplified 12
by the fact that IGCC need not be determined to be the single least-cost resource; 13
by statute, it suffices if it is likely to be among the most cost effective choices. 14
This approach, under Minnesota law, represents a more realistic, scenario-based 15
approach to resource planning, particularly given the significant uncertainties and 16
broad range of scenarios that must be taken into account in making resource 17
decisions that protect ratepayers over numerous decades. 18
Q How can one account for the uncertainty in ratepayer when evaluating 19
resource alternatives? 20
A The issue of how to quantify the ratepayer value of different risks of a 21
resource alternative has not been resolved by academics, financial practitioners or 22
policymakers. To address the problems associated with measuring ratepayer 23
PPuubblliicc DDooccuummeenntt –– TTrraaddee SSeeccrreett DDaattaa HHaass BBeeeenn EExxcciisseedd
3569071.1
20
uncertainty associated with different resource options that are illustrated in the 1
hypothetical example above, one must be able to solve two problems. First, the 2
probability distribution of Busbar prices must be established from mathematical 3
equations. Second, once the probability distribution is developed, decision makers 4
must quantify how different probability distributions affect the value of the 5
resource. 6
To tackle the first part of the problem and compute the distribution of 7
Busbar prices, one must construct mathematical equations to represent the 8
possibility that construction costs will be greater or less than expected; that 9
interest rates and inflation will change; that O&M costs may not conform to target 10
levels; that fuel costs of different plants have different volatility (i.e., natural gas 11
prices having demonstrated high volatility in the past as compared to coal plants), 12
that emission limits tighten, that carbon constraints are imposed and so forth. 13
Even if we had comprehensive databases that measure the historic statistical 14
properties of each of the risk elements, the future distributions may not be 15
representative of past data patterns. 16
If one could somehow create mathematical equations to represent the 17
distribution of Busbar prices and derive a distribution analogous to the graph 18
above, the risk quantification task would still not be solved. Indeed the second 19
issue—translating different probability distributions of prices into value for 20
ratepayers—is an even more complicated challenge. Sophisticated models have 21
been suggested that incorporate volatility statistics, option pricing theory, 22
portfolio diversification and arbitrage pricing to distributions of cash flow. While 23
PPuubblliicc DDooccuummeenntt –– TTrraaddee SSeeccrreett DDaattaa HHaass BBeeeenn EExxcciisseedd
3569071.1
21
these techniques are interesting from a theoretical perspective, attempts to apply 1
the models in practice have proven to be elusive. 2
Q Can project finance be used to work out risk and return tradeoffs in 3
evaluating different resource options? 4
A In part, yes. Contracts in project finance enable specific risks to be 5
quantified through allocation of the risks to various different parties. The value of 6
individual risk elements is established through a transparent negotiation process 7
and market based financing constraints that affect the debt raising capability of a 8
project. For example, in the negotiation of an engineering, procurement and 9
construction (“EPC”) contract to construct a plant, if the contactor agrees to 10
commit to a date certain fixed price contract with liquidated damages rather than a 11
cost plus arrangement, the contractor will generally charge premium to accept the 12
cost over-run and delay risk.1 The riskier the construction project—arising from 13
factors such as unconventional technology and a longer construction period—the 14
higher the risk premium. In this example where construction risk is quantified in 15
negotiating the EPC contract, the project finance process has established the value 16
for a particular risk element. There is no need to estimate the distribution of 17
construction cost over-run uncertainty and to translate the uncertainty into a value 18
number using the theoretical techniques discussed above. 19
The EPC example demonstrates mistakes that can be made in comparing 20
projects with different risk profiles. If the over-run and delay risk was not 21
accepted by the construction contractor, the project would have a different value 22
PPuubblliicc DDooccuummeenntt –– TTrraaddee SSeeccrreett DDaattaa HHaass BBeeeenn EExxcciisseedd
3569071.1
22
and reduced debt capacity. If cost overruns are passed through to consumers, but 1
instead borne by the project owners, the value of the project to them is reduced. 2
Similar objective quantification of risks occur in establishing a contract for 3
operating and maintenance expenses, establishing penalties in the PPA associated 4
with a minimum availability factor and other provisions through a transparent 5
negotiating process. As with the construction contract, negotiated contract terms 6
can be used to define the value of allocating risk from one party to another. 7
From a ratepayer perspective, the contract that defines risk allocation is 8
the PPA. If the PPA includes capacity payments tied to plant availability and a 9
link between the initiation of capacity payments to the date commercial operation 10
is achieved, it does not matter to ratepayers whether risks are subsequently 11
transferred to EPC contractors, such as Fluor, or whether the risks are allocated to 12
equity investors in the project. To fairly compare the costs of a plant with a PPA 13
(such as Mesaba) to a plant without a PPA (such as Big Stone II, Comanche Peak, 14
or Sherco 4) where the ratepayers bear all such risks, would require that the 15
higher value of the PPA be taken into account. 16
Q Are you suggesting the Mesaba plant is allocating all risks away from 17
ratepayers? 18
A No. Some risks, such as the final cost estimate of the plant before financial 19
closing and the base interest rate before financial close are carried by ratepayers 20
during the limited period between PPA approval and financial closing. Others 21
noted by Dr. Amit are allocated to ratepayers in the current PPA draft. My 22
1 Liquidate damages are specific and limited amounts that a contracting party is required to pay to another
PPuubblliicc DDooccuummeenntt –– TTrraaddee SSeeccrreett DDaattaa HHaass BBeeeenn EExxcciisseedd
3569071.1
23
comments do not suggest that the Mesaba PPA is risk free to ratepayers. Rather, 1
relative to a plant being constructed by a utility with development cost risk, cost 2
over-run risk, delay risk, O&M risk, availability risk, future inflation risk, and 3
future cost of capital risk, Mesaba does have a dramatically lower risk profile. 4
Q What has been the history of risks associated with capital cost in the utility 5
industry? 6
A Having been involved in regulatory proceedings for many years, I realize 7
that it is sometimes easier to confuse issues than to present an analysis that 8
constructively helps the Commissioners in making a decision. As such it may 9
seem that the issue of adjusting numbers presented by Big Stone II and NSP is 10
simply a minor skirmish between experts. To the contrary however, I demonstrate 11
that placing alternative risks on an equal footing is perhaps the most important 12
item in assessing the value of resources to ratepayers and that proper risk analysis 13
can dramatically affect the valuation of new generation capacity alternatives. 14
The history of the utility industry over the past quarter of a century 15
demonstrates the importance of appropriately addressing risk when considering 16
resource alternatives. Three seminal events which had dramatic negative 17
consequences for consumers include: (1) the cost escalation of nuclear plants in 18
the 1970’s and 1980’s; (2) the California power crisis in 2000–2001; and (3) the 19
recent escalation in natural gas and oil prices that has produced rate increases 20
greater than 50% for customers in many areas of the country. Each of these 21
events, which all had negative consequences to ratepayers, was driven in part by 22
contracting party in the event an agreed-upon area of performance or completion date is not achieved.
PPuubblliicc DDooccuummeenntt –– TTrraaddee SSeeccrreett DDaattaa HHaass BBeeeenn EExxcciisseedd
3569071.1
24
failure of investors, utility companies and policymakers to assess the risks 1
inherent in a resource strategy. 2
Q How did problems associated with constructing nuclear plants illustrate the 3
importance of risk allocation in construction contracts? 4
A Many nuclear plants, and to a lesser extent coal plants, experienced 5
dramatic cost over-runs in the 1970’s and 1980’s because the volatility of 6
construction expenditures was very high. While the reason for these cost 7
increases—regulatory changes, non-standard technology or management 8
imprudence—is still subject to debate, there is no doubt that the uncertainty in 9
construction costs and construction length was very high. In the 1970’s nuclear 10
plants were generally estimated to cost $1,000 per kW or less, while the actual 11
cost was often more than $4,000 per kW. The cost over-runs came in conjunction 12
with long delays in the construction of the plants. The dramatic cost over-runs 13
experienced by nuclear plants caused massive dislocation in the industry with 14
implications ranging from the bankruptcy of Public Service of New Hampshire to 15
movement to deregulate the industry. 16
Were the construction cost over-run risk associated with nuclear plants to 17
have been allocated to contractors and/or private developers who could not pass-18
on costs to ratepayers, I suggest the utility industry would look very different 19
today. If the parties constructing the nuclear plants had been allocated the risk of 20
cost-over-runs through a transparent negotiating process with construction 21
contractors and an EPC contract, the initial plant cost estimates would not have 22
been low balled and the decision making process would have been much better. In 23
PPuubblliicc DDooccuummeenntt –– TTrraaddee SSeeccrreett DDaattaa HHaass BBeeeenn EExxcciisseedd
3569071.1
25
the case of nuclear plants—long-lead time investments using unconventional 1
technology—the risk allocation of construction costs was a crucially important 2
issue. 3
Q With hindsight, would the allocation of operating risks away from ratepayers 4
to private developers have had similar implications as the construction issue? 5
A Yes. Had the utility industry objectively measured risks associated with 6
plant availability, heat rate variation and unexpected movements in O&M 7
expenses, investment decisions may have been different. Problems with nuclear 8
plant availability and with O&M expense increases caused severe financial 9
distress for some utility companies and resulted in rate uncertainty for consumers. 10
On the other hand, plants constructed by private developers have protected 11
customers from technical and O&M risk. 12
An example of the costs and benefits of risk allocation is the Alstrom 13
combined cycle plants, such as the Lake Road facility built in New England. 14
Technical problems with these plants resulted in a much worse heat rate and much 15
higher operating and maintenance expenses than had originally been anticipated. 16
Rather than these problems causing rates to go up, Alstrom was forced to 17
compensate the owners of the plant with large liquidated damage payments. Had a 18
contract with liquidated damages not been signed, the financing may not have 19
been arranged and the plant may not have been built. Here, the higher costs that 20
were incurred for liquidated damages quantified a particular risk element. Utility 21
owned plants do not pay premiums in contracts for liquidated damages, but they 22
also don’t mitigate risks. 23
PPuubblliicc DDooccuummeenntt –– TTrraaddee SSeeccrreett DDaattaa HHaass BBeeeenn EExxcciisseedd
3569071.1
26
Q Does the lack of risk quantification for utility owned plants cause a bias in 1
resource planning? 2
A Yes. I am old enough to remember the certificate of need cases for utility 3
plants that were build many years ago. In those cases as in the integrated planning 4
cases of today, utility companies had an incentive to low ball the cost of their 5
preferred resource. If the true costs of a utility plant including the risks of 6
construction cost over-runs and operating performance are internalized—by being 7
explicitly fixed and allocated to the utility in the regulatory proceeding, rather 8
than just being passed along to ratepayers as they are incurred after regulatory 9
approvals—all costs would be forced into the open, examined. The process would 10
then present a more meaningful basis to determine which resources are truly least 11
cost. 12
In the resource planning processes, utilities have an incentive to 13
underestimate the true costs of self-build plants. For example, NSP uses “generic” 14
capital costs estimates that do not include specific costs for real plants and Big 15
Stone II makes optimistic operating and maintenance projections. Utilities are not 16
held to the generic estimates made during resource planning as is the case for 17
independent developers. Furthermore, in many cases, rate based costs throughout 18
the company that are increased because of the construction of a new plant 19
(development costs, overhead, inventory carrying costs, engineering, etc.) are 20
never considered in the “evaluation” in an IRP setting. 21
PPuubblliicc DDooccuummeenntt –– TTrraaddee SSeeccrreett DDaattaa HHaass BBeeeenn EExxcciisseedd
3569071.1
27
In contrast, an independent developer must identify and fund all 1
development costs, capital costs, and all O&M costs and recover them through the 2
tariff. You cannot play a shell game in project financing. 3
Q Are the problems by the second seminal event—increases in wholesale prices 4
experienced in California—germane to the assessment of capacity expansion 5
alternatives in this case? 6
A Yes. People who have studied the issue have suggested many different 7
reasons for the dramatic increases in wholesale prices in California in 2000–2001 8
that resulted, among other things, in the bankruptcy of Pacific Gas and Electric 9
and cessation of the deregulation movement around the world. One often-cited 10
reason for the California crisis is the lack of long-term contracts signed by the 11
three large distribution companies. Before the crisis, it may have seemed that 12
long-term contracts that included capacity charges were too expensive and it was 13
better to not fix the cost of electricity for a portion of the electric energy 14
requirements. With hindsight however, the premiums that would have been 15
required to pay for contracts to provide price certainty would have been 16
enormously beneficial to the state. Reluctance to sign contracts that involve 17
capacity payments because they seem expensive is understandable, but the 18
California case clearly demonstrates that the added cost of fixed prices—when 19
compared to the risks averted by hedging—can be a very valuable proposition. 20
Q Are current experiences in the Northeast and elsewhere in the country with 21
respect to exposure to volatile natural gas prices problems pertinent to 22
analytical issues in this case? 23
PPuubblliicc DDooccuummeenntt –– TTrraaddee SSeeccrreett DDaattaa HHaass BBeeeenn EExxcciisseedd
3569071.1
28
A Yes. For most people working on resource planning in the past twenty 1
years it has seemed clear that the only type of resource that should be added was a 2
natural gas combined cycle plant or a natural gas combustion turbine facility. 3
However, in the past couple of years, dramatic and largely unforeseen increases in 4
natural gas prices have demonstrated that risks of a fuel cost-intensive plant must 5
be included in analysis of a coal versus gas plant. In the past, the capital costs of 6
coal plants appeared too expensive. However recent price increases have made it 7
clear that accepting and paying for capital costs that result in lower fuel price 8
would have been a good policy decision. In sum, capacity charges may seem high, 9
but they buy protection from fuel price fluctuations. It is important to bear in 10
mind that utility forecasts of natural gas prices are not, in fact, hedges of those 11
prices in reality. 12
IV. DR. AMIT’S QUANTIFICATION OF MESABA’S COST 13
Q Summarize the analytical approach used by Dr. Amit to quantify the 14
ratepayer costs from the Mesaba plant relative to an alternative coal unit. 15
A Dr. Amit uses data from various different sources to assess the costs to 16
consumers from the Mesaba plant as compared to an alternative coal plant. For 17
example, he states: 18
These prices [of Mesaba] must be compared to the prices of 19 alternative Baseload facilities of similar sizes. If the prices of the 20 PPA are lower or similar to the prices of energy and capacity of the 21 alternative Baseload facilities, we can conclude that the PPA's prices 22 are reasonable. (Amit Testimony at 28). 23
24 The idea of seeking cost data from different sources and comparing the 25
prices in the Mesaba PPA is commendable. Unfortunately, there is no objective 26
PPuubblliicc DDooccuummeenntt –– TTrraaddee SSeeccrreett DDaattaa HHaass BBeeeenn EExxcciisseedd
3569071.1
29
“check” on this data that can be performed, since the utilities are not bound by the 1
estimates they provide in the certificate of need forum. This makes the cost 2
estimate performed by Fluor, who is a national leader in the construction of coal 3
facilities, more useful to the Commission’s analysis than the utility estimates. 4
Fluor is in the marketplace offering a SCPC product, and has direct, real-time 5
access to the cost factors that influence construction costs and operating costs. 6
The analysis they provide is explicit and clear, and subject to ready scrutiny by 7
the other parties in this docket. Fluor’s interest in being selected to bid on coal 8
facilities throughout the country makes its cost estimating credible. In contrast, 9
the Big Stone II and NSP data is incomplete, and not supported by testimony or 10
witnesses in this docket. Further, the Big Stone II and NSP analyses are subject to 11
an inherent bias towards self-build proposals. After closely scrutinizing the 12
information supplied by Big Stone II and NSP to Dr. Amit, it is clear that the data 13
cannot be used to make a valid analysis of the ratepayer costs for the Mesaba 14
project as compared with an alternative SCPC unit. 15
The cost per MWH information for the various plants used by Dr. Amit 16
are illustrated in the graph below. The graph demonstrates the Mesaba PPA prices 17
are higher than the data supplied to the Department for the other alternative, and 18
that the Mesaba prices have a declining pattern in the initial few years. 19
[TRADE SECRET BEGINS 20
21
22
23
PPuubblliicc DDooccuummeenntt –– TTrraaddee SSeeccrreett DDaattaa HHaass BBeeeenn EExxcciisseedd
3569071.1
30
1
2
3
4
5
6
7
8
TRADE SECRET ENDS] 9
While the data appear to be consistent across time frames, the time period 10
for the Mesaba plant is in fact different than the other alternatives because 11
Mesaba begins operation October 2011 while the other alternatives are assumed 12
to begin operation at the beginning of 2011. The data provided to Dr. Amit by the 13
utilities for the comparable coal plants do not have underlying documentation as 14
to the level of capital and operating costs, the heat rate, the cost of capital and 15
other parameters. 16
Q After correcting the cost assumptions embedded in Dr. Amit’s analysis, what 17
happens to the nominal costs shown in the graph above? 18
A In analyzing the Big Stone II, Sherco and Comanche Peak data, I have 19
found that a fair comparison of the alternatives produces a very different pattern. 20
In the modified analysis, I have removed the Comanche Peak estimated cost 21
because the numbers do not add up and cannot under any methodology be 22
logically tied to the published cost estimates of the plant. I have also eliminated 23

PPuubblliicc DDooccuummeenntt –– TTrraaddee SSeeccrreett DDaattaa HHaass BBeeeenn EExxcciisseedd
3569071.1
31
the original Big Stone II numbers because they are irrelevant given the current 1
cost estimates. This leaves three lines—the Mesaba tariff, the corrected Big Stone 2
II analysis, and the Fluor SCPC analysis. 3
[TRADE SECRET BEGINS 4
5
6
7
8
9
10
11
12
13
14
15
16
17
18
19
20
21
22
23
PPuubblliicc DDooccuummeenntt –– TTrraaddee SSeeccrreett DDaattaa HHaass BBeeeenn EExxcciisseedd
3569071.1
32
TRADE SECRET ENDS] 1
Q Do you concur with Dr. Amit’s general approach to determining whether 2
Mesaba IGCC is a least cost alternative through comparing Mesaba’s cost to 3
other coal plants? 4
A Yes. I agree with his comparison methodology to evaluate the question of 5
whether IGCC is, at present, the least cost alternative, which is one way to 6
demonstrate that the statutory requirement has been met. The degree to which a 7
baseload alternative is a least cost resource should be evaluated through 8
comparing different baseload resources on an apples-to-apples basis. Much of the 9
cost of a baseload plant is comprised of the capital cost and the non-fuel O&M 10
cost. Further, the new baseload plants, being more efficient than existing plants, 11
are among the first plants to dispatch on a system. Through directly evaluating the 12
overall cost of alternative baseload resources, an analysis which directly compares 13
two plants appropriately focuses on the important cost elements—which are 14
readily understandable and susceptible to a real debate—rather than comparing 15
costs after two units with similar dispatch have been run through a system model 16
that cannot be understood and debated. Since a number of utilities (NSP, PS 17
Colorado and utilities participating in the Big Stone II plant) have proposed new 18
coal-fired plants to meet baseload needs, the comparison of the Mesaba to other 19
coal plants is appropriate. Further, as demonstrated by debates that are occurring 20
in this case, it is complex enough to assess the economics of a coal plant 21
compared to another coal plant without having to assess natural gas price risk, the 22
value of baseload versus non-baseload and other issues. 23
PPuubblliicc DDooccuummeenntt –– TTrraaddee SSeeccrreett DDaattaa HHaass BBeeeenn EExxcciisseedd
3569071.1
33
Q Describe the process of using the present value of revenue requirements 1
(“PVRR”) to compare resource alternatives? 2
A The present value of revenue requirement (“PVRR”) approach has long 3
been used in comparing resource alternatives in the utility industry. The method 4
should be significantly adjusted in comparing alternatives that have different 5
ratepayer risks. In looking at it from the ratepayers’ perspective, the approach is 6
the inverse of normal capital budgeting, so that a lower discount rate should be 7
applied to the riskier supply and a higher discount rate should be applied to the 8
more secure supply. 9
Such an adjustment to methodology would strongly favor the Mesaba PPA 10
over a utility rate-based alternative. I do not, however, make a risk adjustment in 11
the analysis below that would favor the Mesaba plant. Excelsior also has not 12
adjusted its PVRR calculations to reflect this risk adjustment. 13
Q What discount rate did you use in levelizing ratepayer costs? 14
A While I believe the many of the traditional approaches used by utility 15
companies are theoretically incorrect, I have used standard approaches in 16
measuring the levelized cost of Mesaba relative to alternative plants’ cost of 17
energy on a risk adjusted basis. From a ratepayer perspective, revenues are pre-tax 18
numbers that should be discounted at pre-tax discount rates. Further, as 19
demonstrated by my discussion above, risk premiums applied to ratepayer costs 20
should be subtracted instead of added to discount rates. For purposes of this 21
analysis, I have not attempted to reflect this reality, and for purposes of 22
simplifying the analysis, have used the utility company discount rate. I understand 23
PPuubblliicc DDooccuummeenntt –– TTrraaddee SSeeccrreett DDaattaa HHaass BBeeeenn EExxcciisseedd
3569071.1
34
that in Minnesota the typical method is to use the utility company after tax 1
weighted average cost of capital—which was 7.95%. To limit debate on this 2
issue, I have used 7.95% in my analysis. 3
In presenting alternative, Dr. Amit uses nominal cost/MWH numbers. 4
While this approach does not necessarily bias the relative cost of Mesaba and 5
alternative plants, it does distort the presentation. The computation of average 6
nominal cost means that a cost in 2011 is treated the same as a cost that occurs 25 7
years later. It also means that the costs cannot be put in context relative to current 8
costs. I therefore present costs in real 2005 dollars as well as in nominal dollars. 9
V. DR. AMIT’S ANALYSIS OF THE MESABA PPA COSTS VERSUS 10
INVESTOR OWNED FINANCING OF THE BIG STONE II PLANT 11
Q What source did Dr. Amit use as the basis for his comparison of the cost of 12
Mesaba with the second unit at the Big Stone site? 13
A Dr. Amit began with a series of numbers presented in Section 5 of the 14
report titled “Analysis of Baseload Generation Alternatives” which was published 15
in September 2005. The data was taken from a table titled: “Table 5-3: Annual 16
Busbar Costs ($/MWH).” The row of numbers from 2011 to 2030 titled “Investor 17
Owned Utility: Super PC” contains the same numbers that are titled “Supercritical 18
$/MWH” in Dr. Amit’s EA-4. For the years from 2031 though 2036, Dr. Amit 19
escalates the $/MWH cost by 1% per year. 20
Q How does Dr. Amit refer to the data taken from the 2005 Big Stone II 21
Analysis? 22
PPuubblliicc DDooccuummeenntt –– TTrraaddee SSeeccrreett DDaattaa HHaass BBeeeenn EExxcciisseedd
3569071.1
35
A Dr. Amit implies that the Big Stone II analysis is comparable to the 1
Mesaba PPA as demonstrated by the following statement in his testimony: 2
The price of the supercritical coal plant in the Big Stone 3 proceeding is based on the period 2011 through 2030. To compare 4 it to the price of Excelsior Energy over the same time period, I 5 used the average annual price increase of the supercritical plant 6 over the period 2011-2030 to estimate its annual prices for the 7 period 2031-2036. See Analysis of Baseload Generation 8 Alternatives at 3-3, Big Stone Unit II, South Dakota PUC Docket 9 No. EL05-022, attached as Exhibit ECB-2. 10
11 Q Do the Big Stone II costs used by Dr. Amit use similar financing assumptions 12
that underlie the Mesaba PPA? 13
A No. While a quick read of Dr. Amit’s testimony gave me the impression 14
that the Big Stone II analysis is comparable to the Mesaba plant with a PPA, the 15
financing approach is very different. The source report Dr. Amit used to derive 16
his number notes that: 17
Of the seven participating utilities, OTPCo and MDU are investor 18 owned utilities. CMMPA, GRE, MRES, HCPD and SMMPA are 19 public power utilities. Note that each of the seven participating 20 utilities will have its own financing plan, capital structure, rate of 21 return, tax rate, and depreciation schedule for its share of the BRIT 22 Project, and the specific cost of capital assumptions will vary. See 23 Analysis of Baseload Generation Alternatives at 5-5, attached as 24 Exhibit ECB-2. 25 26
There is nothing in the Big Stone II 2005 report that mentions a purchased 27
power agreement or project finance. This means Dr. Amit is comparing the 28
Mesaba first unit plant that has risk allocation, internalization of costs and other 29
items derived on pricing in a PPA with an expansion project in which costs are 30
measured with generic utility financing. 31
PPuubblliicc DDooccuummeenntt –– TTrraaddee SSeeccrreett DDaattaa HHaass BBeeeenn EExxcciisseedd
3569071.1
36
Q What are some cost and risk items that are not incorporated in the Big Stone 1
II analysis by virtue of not basing the analysis on a fully negotiated PPA? 2
A There are several elements that make the Big Stone II numbers not 3
comparable to the Mesaba PPA. These include: 4
- The starting point of the Big Stone II analysis is different than the Mesaba 5
PPA numbers and the cumulative inflation assumptions from 2006 to 2011 6
are not consistent. 7
- The Mesaba numbers use an assumption that the plant will not operate at 8
its maximum performance in initial years of operation; the same 9
assumption is not made for Big Stone II, although there is not significant 10
evidence to indicate that an SCPC coal plant will meet its target 11
performance in its first years of operation. 12
- General economic assumptions including the income tax rate, the coal 13
inflation rate and the base coal price are different between the Big Stone II 14
analysis and the Mesaba PPA projections. 15
- Various costs that are included in the Mesaba PPA are not internalized in 16
the Big Stone II study but are instead allocated to the utility balance sheet 17
of the utility administrative and general expenses—thereby understating 18
the true costs to ratepayers of the plant. 19
- The Mesaba PPA is derived from the costs it experiences in developing 20
the first unit on a site while the Big Stone II unit is derived from an 21
analysis that includes savings from being an expansion unit. 22
PPuubblliicc DDooccuummeenntt –– TTrraaddee SSeeccrreett DDaattaa HHaass BBeeeenn EExxcciisseedd
3569071.1
37
- The Big Stone II analysis does not incorporate assurance of operating and 1
maintenance expenses or availability guarantees that are part of the 2
Mesaba PPA. 3
Q What do you mean by the statement that many costs are not internalized in 4
the Big Stone II study? 5
A Many costs are allocated differently for a first unit plant such as Mesaba 6
that is financed with a PPA than an expansion plant that is built at an existing site 7
and financed on the balance sheet of an investor owned utility company. The fact 8
that costs are not included in a study does not mean that the costs do not exist; 9
they are simply accounted for in the general and administrative costs of the utility 10
and will ultimately be recovered from the ratepayers. A simple example is the 11
work that is submitted for this proceeding and the work that Big Stone II 12
presented. While Mesaba must include all of the development, engineering, legal 13
and consulting and other costs in the quoted tariff under the PPA, the utilities 14
constructing the Big Stone II plant will include the costs in general and 15
administrative expenses. Other similar costs that are not internalized include 16
working capital, energy management costs, general management costs, general 17
insurance, business interruption costs and other items. 18
Q Why is it not appropriate to compare the Mesaba plant’s first unit with an 19
expansion unit such as Big Stone II? 20
A Since the Big Stone II plant is an expansion unit, the plant benefits from 21
shared costs that are not available to the first unit on a site that will obviously bias 22
the analysis against the initial unit. The cost advantages of a second unit are cited 23
PPuubblliicc DDooccuummeenntt –– TTrraaddee SSeeccrreett DDaattaa HHaass BBeeeenn EExxcciisseedd
3569071.1
38
often in documents prepared by Big Stone II. For example, the 2005 Big Stone II 1
analysis noted: 2
The additional staffing required for the PC units was estimated and 3 added to the existing Big Stone Unit I staff. Half of the total staff 4 from both units was included in the O&M cost estimates for Big 5 Stone Unit II. This results in 52 staff members attributed to Unit II. 6 (Analysis of Alternatives at 3-3). 7
8 Q Why should Big Stone II savings that exist because it is an expansion plant be 9
removed from the Mesaba comparison? 10
A The appropriate comparison for Mesaba must be a first unit to first unit 11
analysis because: 12
- If expansion units were used as the standard against which all other 13
resources are measured, no new environmentally beneficial resources 14
would be added in Minnesota, or any other state. 15
- Expansion sites are a scarce resource with significant value. However, the 16
type of analysis prepared by Big Stone II and NSP attributes no transfer 17
costs for the use of the expansion site. Opportunity costs should be 18
included in any analysis. 19
- Taken to the extreme, the comparison of expansion sites to first units 20
would lead to every new plant being built at one site—ultimately there 21
could be twenty plants at Big Stone and fifteen plants at Sherco. Limits on 22
land availability and diseconomies of scale dictate that this of course will 23
not happen. 24
PPuubblliicc DDooccuummeenntt –– TTrraaddee SSeeccrreett DDaattaa HHaass BBeeeenn EExxcciisseedd
3569071.1
39
- The Mesaba site is planned to be large enough for two units. In theory, the 1
value of the real option to build a second unit should be attributed to 2
Mesaba. 3
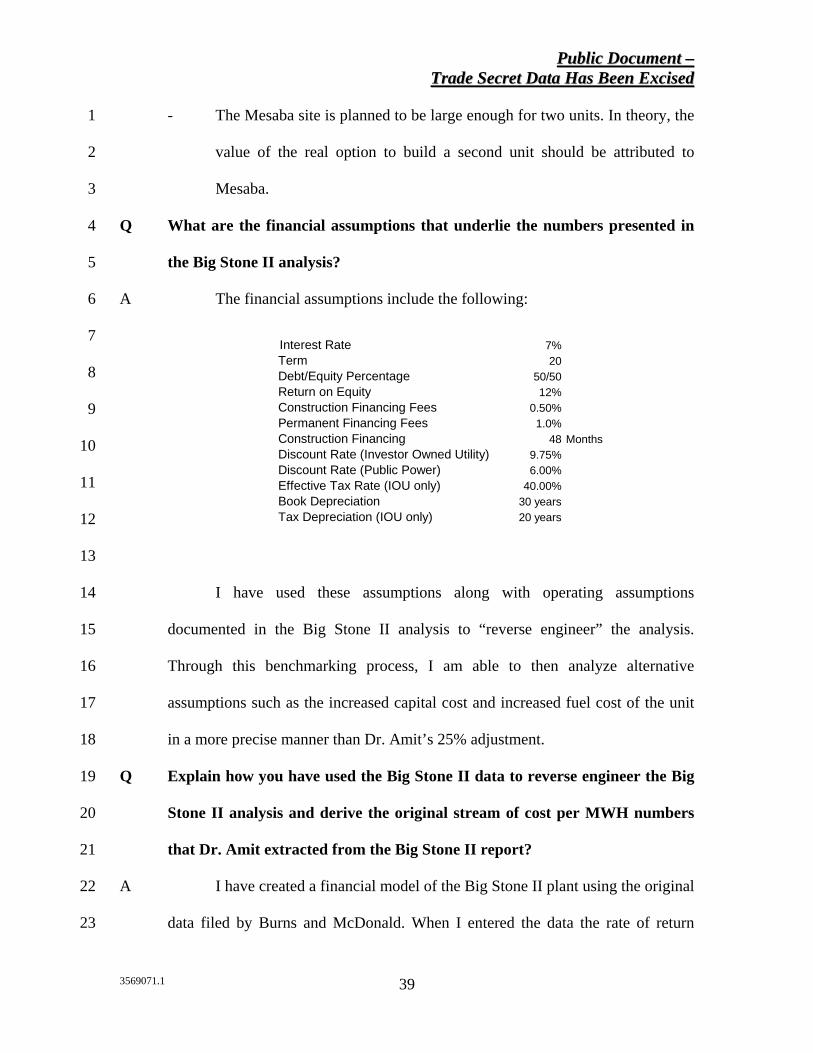
Q What are the financial assumptions that underlie the numbers presented in 4
the Big Stone II analysis? 5
A The financial assumptions include the following: 6
7
8
9
10
11
12
13
I have used these assumptions along with operating assumptions 14
documented in the Big Stone II analysis to “reverse engineer” the analysis. 15
Through this benchmarking process, I am able to then analyze alternative 16
assumptions such as the increased capital cost and increased fuel cost of the unit 17
in a more precise manner than Dr. Amit’s 25% adjustment. 18
Q Explain how you have used the Big Stone II data to reverse engineer the Big 19
Stone II analysis and derive the original stream of cost per MWH numbers 20
that Dr. Amit extracted from the Big Stone II report? 21
A I have created a financial model of the Big Stone II plant using the original 22
data filed by Burns and McDonald. When I entered the data the rate of return 23
Interest Rate 7%Term 20Debt/Equity Percentage 50/50Return on Equity 12%Construction Financing Fees 0.50%Permanent Financing Fees 1.0%Construction Financing 48 MonthsDiscount Rate (Investor Owned Utility) 9.75%Discount Rate (Public Power) 6.00%Effective Tax Rate (IOU only) 40.00%Book Depreciation 30 yearsTax Depreciation (IOU only) 20 years
PPuubblliicc DDooccuummeenntt –– TTrraaddee SSeeccrreett DDaattaa HHaass BBeeeenn EExxcciisseedd
3569071.1
40
earned on equity was 11.95%—very close to the 12% ROE assumed in the study. 1
The project finance model is included in my work papers with formulas intact. 2
This replication process is important because it allows me to evaluate changed 3
cost, economic and technical parameters on an incremental basis and assure that 4
the effects of the change are not influenced by a different starting point. 5
Q Once you replicated the Big Stone II model, what alternative scenarios did 6
you develop to model the costs of a project financed plant? 7
A The alternative cases include: 8
- A case that corrects for the updated plant cost and updated cost data based 9
on information recently filed by Big Stone II. 10
- A case that includes the above updated cost and corrects for inflation 11
through 2011 and corrects for the different beginning dates of operation. 12
- A case that includes the above and incorporates the same prospective coal 13
prices and coal price inflation. 14
- A case that includes the above and includes the following adjustments to 15
reflect internalized costs. 16
- A case that includes the above and incorporates Fluor O&M cost estimates 17
to reflect the cost of a first unit versus an expansion unit site. 18
- A case that includes the capital cost estimates used by Fluor to 19
demonstrate other contingencies. 20
Q Did you adjust the capital cost to reflect required costs contractors require to 21
build a plant with a fixed-price, date-certain contract rather than a cost plus 22
arrangement? 23
PPuubblliicc DDooccuummeenntt –– TTrraaddee SSeeccrreett DDaattaa HHaass BBeeeenn EExxcciisseedd
3569071.1
41
A No. While the transfer of construction cost risk in project financing adds 1
to the capital cost of a facility, I have not revised the Big Stone II numbers for this 2
factor in the adjusted scenarios. I did not make an adjustment for transfer of 3
construction cost over-run risk because the Big Stone II analysis mentions an EPC 4
contract. If the Big Stone II EPC contract does not have a fixed price and a 5
required completion date with liquidated damages that transfers risk away from 6
ratepayers, the Big Stone II capital cost should be increased to reflect that this risk 7
is borne by ratepayers. The Fluor analysis correctly accounts for utility financing 8
including constant capital structure, declining revenue requirements patterns and 9
AFUDC. I note a key benefit of the Mesaba plant is its highly efficient financing 10
from low interest rates, investment tax credits and high leverage. 11
Q Do you agree with the approach that Burns and McDonald used to convert 12
capital costs into required revenues in their analysis? 13
A No. By assuming that the Big Stone II plant pays off debt over 20 years, 14
Burns and McDonald are assuming changing proportions of debt and equity over 15
the life of the plant. The Burns and McDonald approach is a hybrid between an 16
IPP financing approach and a classic utility financing method that understates the 17
true costs to ratepayers. A traditional utility analysis would assume that debt and 18
equity are paid off in equal proportions over the life of the plant which maintains 19
a constant capital structure. 20
I have evaluated the effect of different financing approaches on the pre-tax 21
carrying charge rate paid by ratepayers. This analysis shows that the Burns and 22
McDonald approach results in a pre-tax carrying charge rate of 12.36% while the 23
PPuubblliicc DDooccuummeenntt –– TTrraaddee SSeeccrreett DDaattaa HHaass BBeeeenn EExxcciisseedd
3569071.1
42
traditional utility approach would result in a carrying charge rate of 13.04%. 1
Thus, the financing assumption made by Burns and McDonald understate the cost 2
of the Big Stone II plant to ratepayers. 3
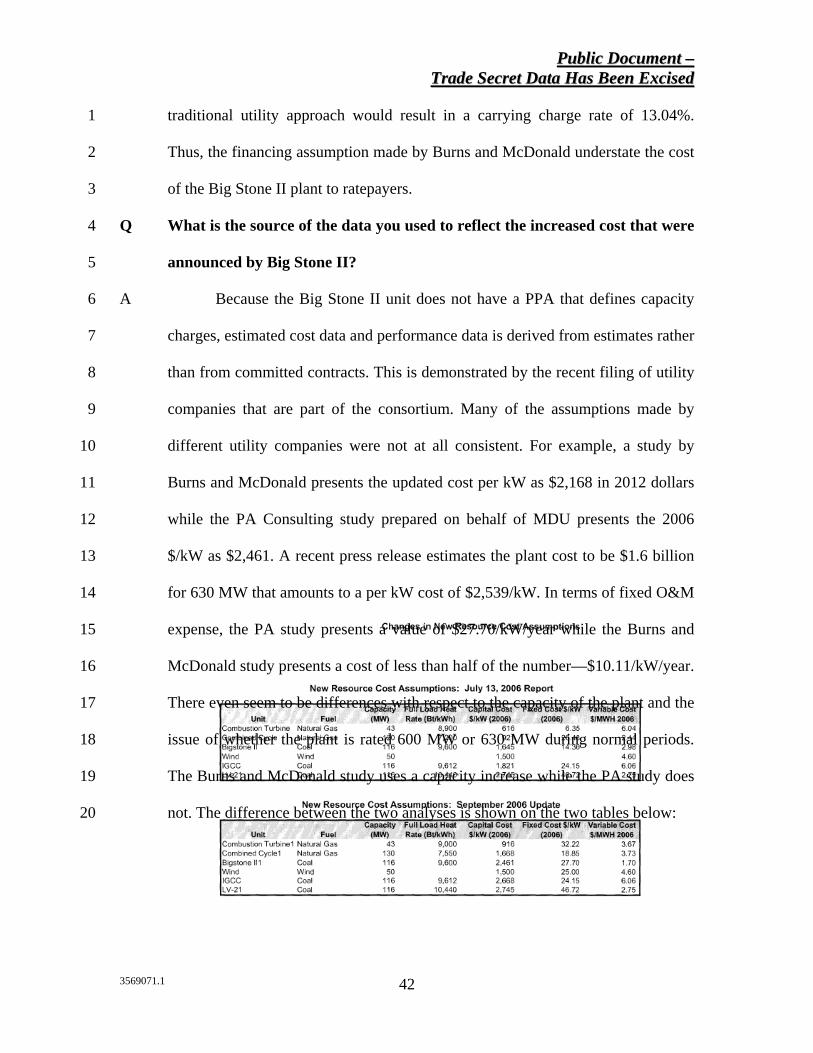
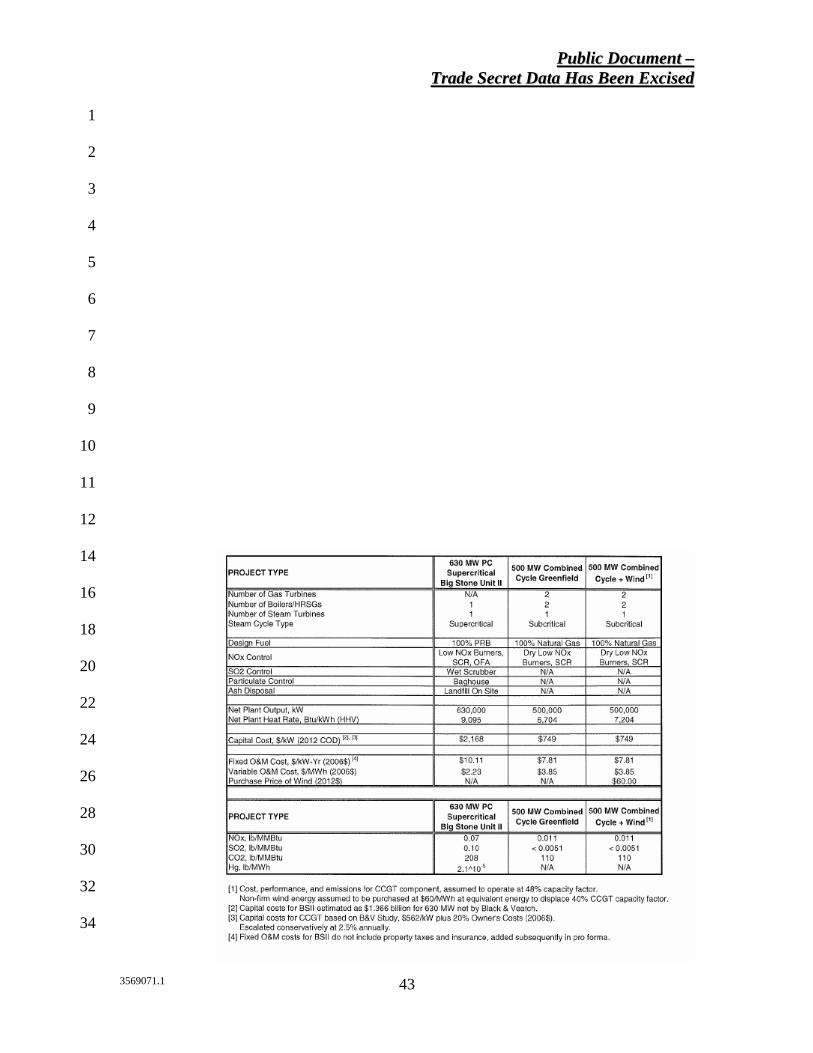
Q What is the source of the data you used to reflect the increased cost that were 4
announced by Big Stone II? 5
A Because the Big Stone II unit does not have a PPA that defines capacity 6
charges, estimated cost data and performance data is derived from estimates rather 7
than from committed contracts. This is demonstrated by the recent filing of utility 8
companies that are part of the consortium. Many of the assumptions made by 9
different utility companies were not at all consistent. For example, a study by 10
Burns and McDonald presents the updated cost per kW as $2,168 in 2012 dollars 11
while the PA Consulting study prepared on behalf of MDU presents the 2006 12
$/kW as $2,461. A recent press release estimates the plant cost to be $1.6 billion 13
for 630 MW that amounts to a per kW cost of $2,539/kW. In terms of fixed O&M 14
expense, the PA study presents a value of $27.70/kW/year while the Burns and 15
McDonald study presents a cost of less than half of the number—$10.11/kW/year. 16
There even seem to be differences with respect to the capacity of the plant and the 17
issue of whether the plant is rated 600 MW or 630 MW during normal periods. 18
The Burns and McDonald study uses a capacity increase while the PA study does 19
not. The difference between the two analyses is shown on the two tables below: 20
PPuubblliicc DDooccuummeenntt –– TTrraaddee SSeeccrreett DDaattaa HHaass BBeeeenn EExxcciisseedd
3569071.1
43
1
2
3
4
5
6
7
8
9
10
11
12
14
16
18
20
22
24
26
28
30
32
34
PPuubblliicc DDooccuummeenntt –– TTrraaddee SSeeccrreett DDaattaa HHaass BBeeeenn EExxcciisseedd
3569071.1
44
1
Q Why does the type of cost uncertainty shown in the above tables not exist for 2
the Mesaba plant? 3
A The capital and fixed O&M costs for the Mesaba plant are fixed in 4
advance through capacity charges in the PPA contract. Unlike the case of utility 5
financed plants, it is not possible to “bait and switch” or “low ball” the estimates 6
in order to justify a plant with incomplete costs and then ultimately recover more 7
than was forecasted from ratepayers. 8
Q How have you modeled the effect of the cost estimates presented by Burns 9
and McDonald and PA Consulting? 10
A In the case of the PA Consulting estimates, I have used data from their 11
table and escalated the 2006 dollars to 2011 dollars. In the case of the Burns and 12
McDonald numbers, I used their assumptions along with the cost of the plant 13
published in the press release. (I did not use the cost estimate in the table because 14
it does not include all interconnection costs). After entering the different costs, I 15
derived a first year price that generates the target rate of return of 12% used in the 16
original numbers extracted by Dr. Amit. When the PA numbers are applied in the 17
benchmarked model, the real cost/MWH of Big Stone II is $56.47/MWH—about 18
12% below the $63.75/MWH Mesaba PPA cost. On the other hand, the real 19
cost/MWH using the Burns and McDonald study is $50.22/MWH. 20
Q What numbers have you used to represent the recent announced cost 21
increases of Big Stone II? 22
PPuubblliicc DDooccuummeenntt –– TTrraaddee SSeeccrreett DDaattaa HHaass BBeeeenn EExxcciisseedd
3569071.1
45
A I have used the Burns and McDonald numbers as a simplifying and 1
conservative assumption to be used for purposes of this analysis. However, since 2
there is such large difference in the heat rate assumption between the analyses I 3
have used the Fluor Heat Rate of [TRADE SECRET BEGINS 9,450 TRADE 4
SECRET ENDS] BTU/kWh. 5
Q Describe the adjustment you made to use a comparable time frame in the 6
analysis. 7
A The commercial operation date for the Mesaba plant is October 2011 8
while the starting point for the Big Stone II plant is January 2011. Since nominal 9
dollars are being evaluated, the mixing of start dates creates a minor bias against 10
the Mesaba plant. To illustrate this, consider a much more extreme example 11
where a plant constructed in 1980 is compared to a plant that begins operation in 12
2011. If nominal dollar per MWH numbers are being used to compare the two 13
plants, the plant that starts in 2011 will of course look more expensive than the 14
plant that begins operation in 1980. 15
To correct the starting point problem, I have increased the Big Stone II 16
capital and operating cost by a factor that represents an annual inflation rate of 17
2.5% that over a nine month period. 18
Q How have you adjusted for initial lower capacity factor? 19
A In constructing the assumptions under which it analyzed the costs under 20
the PPA, Excelsior assumes that the IGCC plant will not immediately operate at 21
its full capacity factor and calculates its cost per MWH assuming 60% availability 22
in the first year. The benchmark of Big Stone II costs assumes that it can 23
PPuubblliicc DDooccuummeenntt –– TTrraaddee SSeeccrreett DDaattaa HHaass BBeeeenn EExxcciisseedd
3569071.1
46
immediately achieve an 88% capacity factor. I have modified the Big Stone II 1
scenarios to correct this inconsistency through assuming an 80% capacity factor 2
for the first two years of operation. 3
Q Describe the adjustment you made to use consistent inflation, fuel price and 4
income tax assumptions. 5
A It is important that a comparison between alternatives is not biased by 6
different macro economic assumptions. If one plant is evaluated with high 7
inflation and high fuel prices while another is evaluated with low inflation and 8
prices, the analyses will obviously not be comparable. 9
To correct the problem of consistent assumptions I have applied 10
assumptions that underlie the PPA price analysis to Big Stone II. The corrected 11
assumptions include the 43% income tax rate used in the Mesaba model, a 2.5% 12
coal price inflation rather than either the 2% coal price inflation used in the 13
original Burns and McDonald study. In addition, the initial coal price in 2011 14
must be consistent. The Mesaba energy charge is derived from an assumption of a 15
mix of petroleum coke and PRB coal while the Big Stone II plant uses only PRB 16
coal. The coal price for the PRB portion of the Mesaba coal use is $1.39/MMBTU 17
in 2011. 18
Once consistent assumptions are included, the average real cost for Big 19
Stone II is $54.56 relative to the Mesaba real cost of $63.75. 20
Q What adjustments have you made to reflect internalization of costs? 21
PPuubblliicc DDooccuummeenntt –– TTrraaddee SSeeccrreett DDaattaa HHaass BBeeeenn EExxcciisseedd
3569071.1
47
A In order to model the effects of the manner in which utility companies 1
record costs in accounts external to the plant, I have made the following 2
adjustments: 3
- The O&M cost is increased by 10% to reflect administrative costs that will 4
be incurred at the utility level; 5
- Working capital requirements are included in the model. 6
Q Describe the adjustment you made to remove the distortions created by 7
comparing a first unit site with an expansion site. 8
A To simulate Big Stone II costs exclusive of site synergies, I have made the 9
following adjustments. 10
- I have increased the capital cost by $203/kW in order to reflect the 11
common costs of items such as land and transportation discussed above. 12
This number is based on the analysis made by Fluor of OSBL (outside the 13
battery limits) costs. 14
- I have used the fixed O&M and the variable O&M per MWH in the Fluor 15
study of a new first unit. 16
Q How have you modeled additional capital cost contingencies that may arise 17
before the plant is completed? 18
A In testimony recently filed, owners and consultants to the Big Stone II 19
project acknowledged that there may be added cost changes to the plant. To 20
model these contingencies I have used the Fluor capital cost assumptions. The 21
table below summarizes all of the adjustments. 22
[TRADE SECRET BEGINS 23
PPuubblliicc DDooccuummeenntt –– TTrraaddee SSeeccrreett DDaattaa HHaass BBeeeenn EExxcciisseedd
3569071.1
48
1
2
3
4
5
6
7
TRADE SECRET ENDS] 8
Q How do modifications of the Big Stone II analysis to reflect comparable tax 9
and inflation assumptions, project financing, a first unit site and internalized 10
costs affect the comparison between Mesaba and Big Stone II? 11
A In comparing the adjusted Big Stone II to the Mesaba costs, I show the 12
average nominal price, the average real price and the levelized real price. Since 13
the cost is modeled to be representative of risks that would occur with a PPA, I 14
use the same discount rate for both alternatives in levelizing the ratepayer cost. I 15
compare the Big Stone II cost to the Mesaba cost that is adjusted to remove the 16
effect of natural gas energy. The corrected analysis is shown in the table below: 17
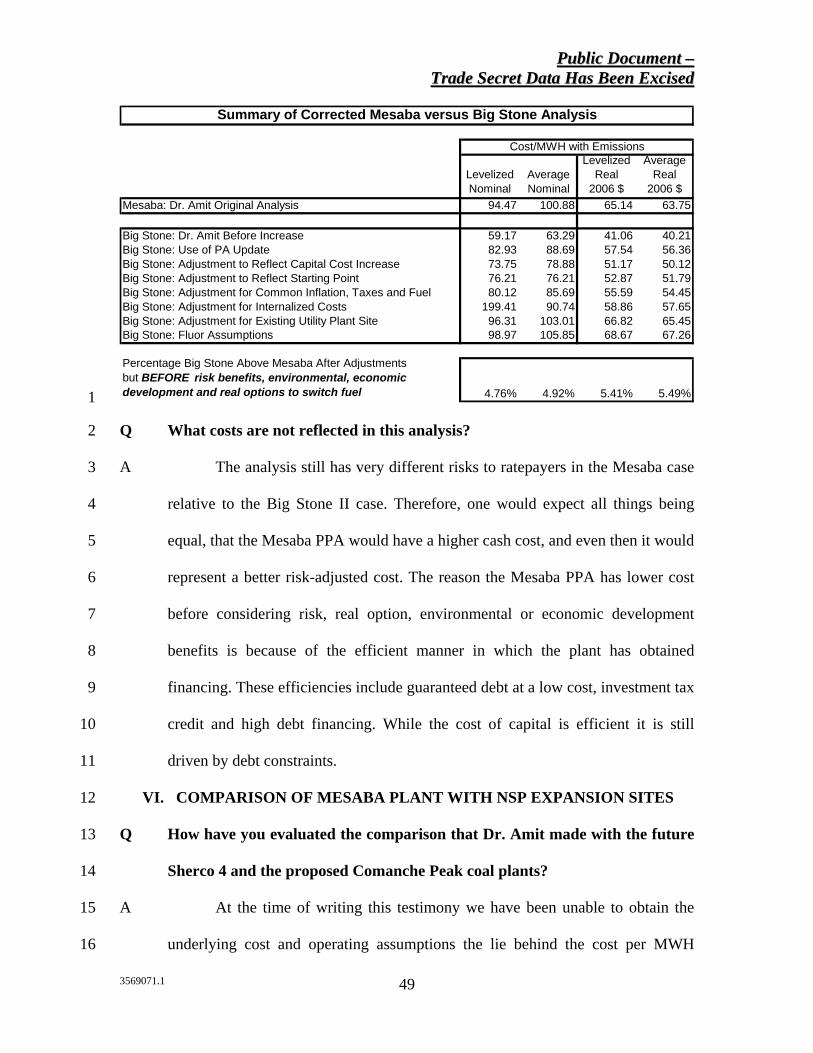
PPuubblliicc DDooccuummeenntt –– TTrraaddee SSeeccrreett DDaattaa HHaass BBeeeenn EExxcciisseedd
3569071.1
49
LevelizedNominal
AverageNominal
LevelizedReal
2006 $
AverageReal
2006 $Mesaba: Dr. Amit Original Analysis 94.47 100.88 65.14 63.75
Big Stone: Dr. Amit Before Increase 59.17 63.29 41.06 40.21Big Stone: Use of PA Update 82.93 88.69 57.54 56.36Big Stone: Adjustment to Reflect Capital Cost Increase 73.75 78.88 51.17 50.12Big Stone: Adjustment to Reflect Starting Point 76.21 76.21 52.87 51.79Big Stone: Adjustment for Common Inflation, Taxes and Fuel 80.12 85.69 55.59 54.45Big Stone: Adjustment for Internalized Costs 199.41 90.74 58.86 57.65Big Stone: Adjustment for Existing Utility Plant Site 96.31 103.01 66.82 65.45Big Stone: Fluor Assumptions 98.97 105.85 68.67 67.26
Percentage Big Stone Above Mesaba After Adjustmentsbut BEFORE risk benefits, environmental, economic development and real options to switch fuel 4.76% 4.92% 5.41% 5.49%
Cost/MWH with Emissions
Summary of Corrected Mesaba versus Big Stone Analysis
1
Q What costs are not reflected in this analysis? 2
A The analysis still has very different risks to ratepayers in the Mesaba case 3
relative to the Big Stone II case. Therefore, one would expect all things being 4
equal, that the Mesaba PPA would have a higher cash cost, and even then it would 5
represent a better risk-adjusted cost. The reason the Mesaba PPA has lower cost 6
before considering risk, real option, environmental or economic development 7
benefits is because of the efficient manner in which the plant has obtained 8
financing. These efficiencies include guaranteed debt at a low cost, investment tax 9
credit and high debt financing. While the cost of capital is efficient it is still 10
driven by debt constraints. 11
VI. COMPARISON OF MESABA PLANT WITH NSP EXPANSION SITES 12
Q How have you evaluated the comparison that Dr. Amit made with the future 13
Sherco 4 and the proposed Comanche Peak coal plants? 14
A At the time of writing this testimony we have been unable to obtain the 15
underlying cost and operating assumptions the lie behind the cost per MWH 16
PPuubblliicc DDooccuummeenntt –– TTrraaddee SSeeccrreett DDaattaa HHaass BBeeeenn EExxcciisseedd
3569071.1
50
numbers for Comanche Peak and the Sherco 4 coal plants. Given the lack of 1
transparent data, I have researched information published by NSP in their least 2
cost planning documents. This analysis demonstrates that the comparisons Dr. 3
Amit makes with NSP numbers are not valid because: 4
- In the case of Comanche Peak, the annual cost per MWH numbers do not 5
come close to providing the company with its required rate of return when 6
the cost forecasts and assumptions provided to Dr. Amit are evaluated 7
against the published cost of Comanche Peak. Given such a fundamental 8
inconsistency with the NSP data (which is not due to any computational 9
errors by Dr. Amit) no weight at all can be given to the Comanche Peak 10
analysis. 11
- In the case of the Sherco 4 unit, the NSP numbers appear to be derived 12
from generic analysis taken from plant costs that are published by the EIA. 13
These numbers do not reflect the increased recent costs of plants, the costs 14
of building in Minnesota, risk allocation, and the other cost input 15
deficiencies discussed above for the Big Stone II plant. Correction of the 16
generic numbers to reflect risk allocation demonstrates that the Mesaba 17
project is a least cost resource. 18
Q How does Dr. Amit describe the NSP plants that he uses as a basis for 19
comparison with Mesaba? 20
A Dr. Amit describes the basis for comparing these two NSP coal plants with 21
the Mesaba plant as follows: 22
I have analyzed two additional alternatives. The first of the two 23 additional alternatives is an Xcel plant in Colorado that has been 24
PPuubblliicc DDooccuummeenntt –– TTrraaddee SSeeccrreett DDaattaa HHaass BBeeeenn EExxcciisseedd
3569071.1
51
approved and is beginning construction. The plant, Comanche Unit 1 3, is a 750 MW baseload supercritical coal plant. The proposed 2 service date for the plant is October 2009. The plant will be 3 constructed on a brown field which has two existing coal plants, 4 Comanche Units 1 and 2. The second additional alternative is a 5 750 MW supercritical coal plant that may be built in Becker, 6 Minnesota by Xcel. The plant, Sherco 4, would be built on a brown 7 field with existing coal plants. Xcel to date has made no public 8 announcement regarding a proposed Sherco Unit 4. (Amit 9 Testimony at 25). 10
11 The source of Dr. Amit’s information on the Sherco plant is from a 12
data request from NSP as demonstrated by the following statement in his 13
testimony: 14
In response to the Department's Information Request No. 105, Xcel 15 provided the estimated annual cost and annual produced energy, 16 assuming an 80 percent capacity factor. The information is 17 provided for the period 2015 through 2044. To compare the same 18 periods, I projected the annual prices for the period 2011 through 19 2014, by using an annual deflation factor of 1.09 percent. (Amit 20 Testimony at 28). 21
22 Q Is the estimated capital cost of Comanche Peak Unit 3 consistent with the 23
cost/MWH numbers provided by NSP? 24
A No. A 2004 NSP press release quotes the cost of Comanche Peak at 25
$1,800 per kW. This cost includes scrubbing equipment at the other Comanche 26
Peak units. I have entered this plant cost as well as the revenue per MWH from 27
Dr. Amit’s EA-6 in a financial model similar to that used in the Big Stone II 28
analysis described above. I used O&M cost, fuel cost and financial data from the 29
Big Stone analysis along with the 80% capacity factor assumption quoted above. 30
Unlike the Big Stone model, the benchmarking process did not come anywhere 31
near to reflecting costs to ratepayers that would provide a reasonable return to 32
investors. Instead, the analysis demonstrates that, if the prices quoted were valid, 33
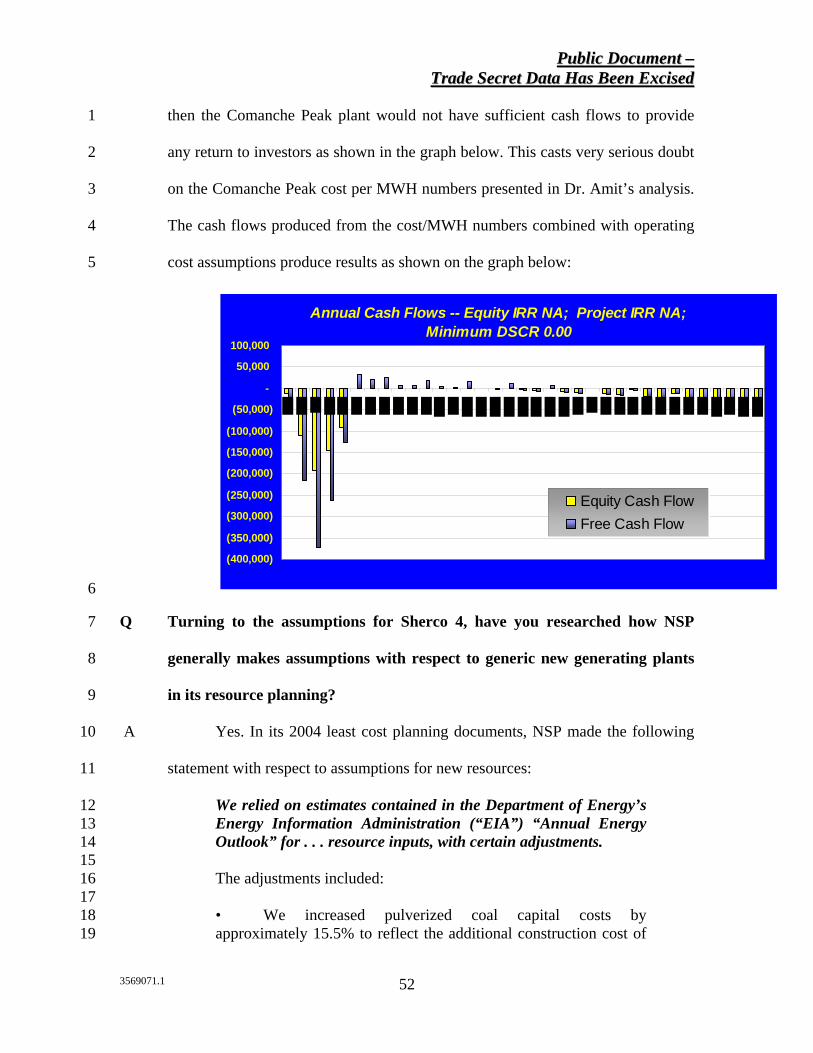
PPuubblliicc DDooccuummeenntt –– TTrraaddee SSeeccrreett DDaattaa HHaass BBeeeenn EExxcciisseedd
3569071.1
52
then the Comanche Peak plant would not have sufficient cash flows to provide 1
any return to investors as shown in the graph below. This casts very serious doubt 2
on the Comanche Peak cost per MWH numbers presented in Dr. Amit’s analysis. 3
The cash flows produced from the cost/MWH numbers combined with operating 4
cost assumptions produce results as shown on the graph below: 5
Annual Cash Flows -- Equity IRR NA; Project IRR NA; Minimum DSCR 0.00
(400,000)
(350,000)
(300,000)
(250,000)
(200,000)
(150,000)
(100,000)
(50,000)
-
50,000
100,000
Equity Cash FlowFree Cash Flow
6
Q Turning to the assumptions for Sherco 4, have you researched how NSP 7
generally makes assumptions with respect to generic new generating plants 8
in its resource planning? 9
A Yes. In its 2004 least cost planning documents, NSP made the following 10
statement with respect to assumptions for new resources: 11
We relied on estimates contained in the Department of Energy’s 12 Energy Information Administration (“EIA”) “Annual Energy 13 Outlook” for . . . resource inputs, with certain adjustments. 14 15 The adjustments included: 16 17 • We increased pulverized coal capital costs by 18 approximately 15.5% to reflect the additional construction cost of 19
PPuubblliicc DDooccuummeenntt –– TTrraaddee SSeeccrreett DDaattaa HHaass BBeeeenn EExxcciisseedd
3569071.1
53
emissions controls that are likely to be required to permit a new 1 coal facility in Minnesota. The EIA based its capital cost estimates 2 on a coal plant with a baghouse and SO2 scrubber . . . 3 4 • We increased the Pulverized Coal heat rate estimate by 5 approximately 12% to reflect additional information obtained from 6 other industry sources including EPRI TAG and the Company’s 7 recent bidding process. 8 9
In the Colorado 2004 least cost plan, Public Service Company (“PSCo”), and XEI 10
holding, made the following statements. 11
The EIA capital cost estimate for a 600 MW pulverized coal 12 facility was increased from $1,212/kw to $1,400/kw to reflect the 13 construction cost associated with a pulverized coal unit with 14 emission controls that the Company believes would be needed to 15 permit a new coal facility in Colorado. The EIA capital cost 16 estimates were based on a coal plant with a baghouse and SO2 17 scrubber. PSCo elected to use a $1,400/kw capital cost to represent 18 a new plant with a baghouse, SO2 scrubber, selective catalytic 19 reduction (“SCR”) for NOx, and activated carbon injection (or 20 other mercury control agent) for mercury control. This adjustment 21 advantaged wind and gas-fired technologies within the analysis. 22 23 Pulverized Coal Heat Rate 24 For purposes of the screening analysis, the EIA heat rate estimate 25 for a 600 MW pulverized coal facility was increased from 8,500 26 btu/kwh to 9,500 btu/kwh to reflect what the Company believes to 27 be a more realistic estimate. This adjustment advantaged wind and 28 gas-fired technologies within the analysis. 29 30 Use of Generic Resource Representations 31 The generation technology cost and performance representations 32 used in this analysis are not based on actual estimates to construct 33 such facilities in Colorado at specific locations. Instead they are 34 what are commonly referred to as “generic” estimates, meaning 35 that they represent expected costs and performance of major 36 equipment items involved with construction and operation of these 37 types of generating facilities. Actual detailed engineering cost and 38 performance estimates for a specific generating facility will 39 include a host of factors specific to the site under consideration 40 (e.g., permitting requirements, land, water, transmission, fuel, etc.) 41 that can add or reduce costs and performance from what is 42 estimated for the “generic” facilities. What is important in 43 comparing technologies within a screening analysis such as this is 44
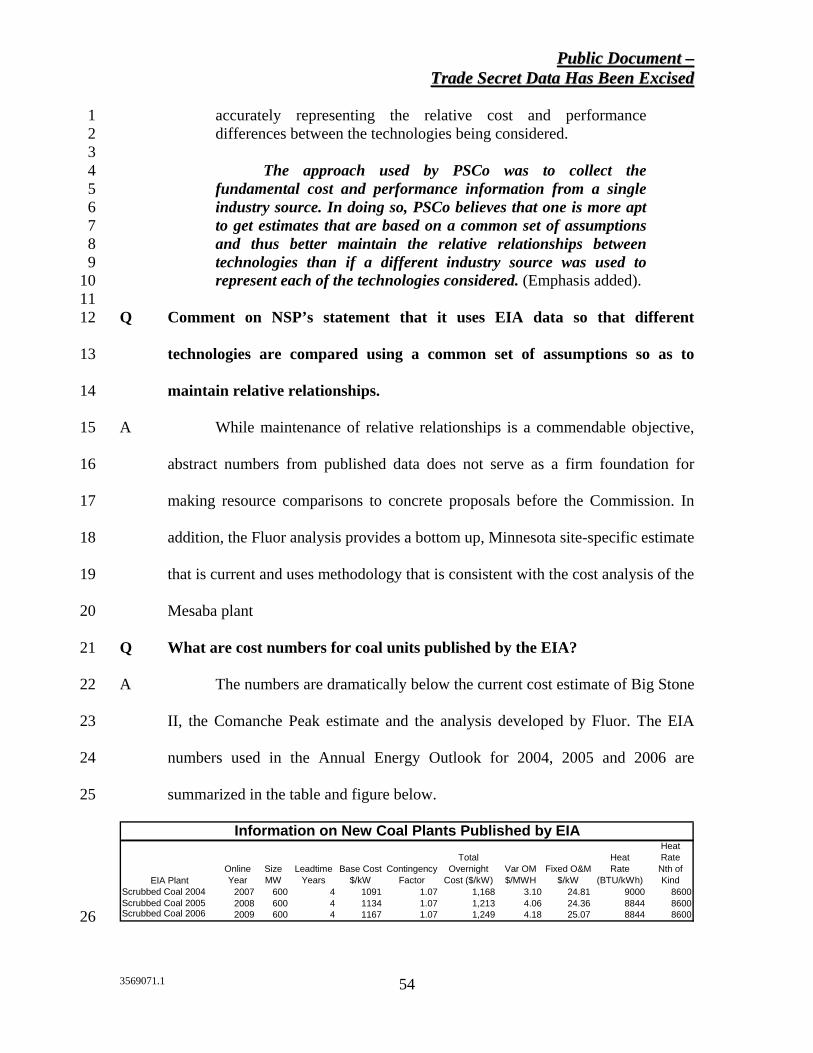
PPuubblliicc DDooccuummeenntt –– TTrraaddee SSeeccrreett DDaattaa HHaass BBeeeenn EExxcciisseedd
3569071.1
54
accurately representing the relative cost and performance 1 differences between the technologies being considered. 2 3 The approach used by PSCo was to collect the 4 fundamental cost and performance information from a single 5 industry source. In doing so, PSCo believes that one is more apt 6 to get estimates that are based on a common set of assumptions 7 and thus better maintain the relative relationships between 8 technologies than if a different industry source was used to 9 represent each of the technologies considered. (Emphasis added). 10
11 Q Comment on NSP’s statement that it uses EIA data so that different 12
technologies are compared using a common set of assumptions so as to 13
maintain relative relationships. 14
A While maintenance of relative relationships is a commendable objective, 15
abstract numbers from published data does not serve as a firm foundation for 16
making resource comparisons to concrete proposals before the Commission. In 17
addition, the Fluor analysis provides a bottom up, Minnesota site-specific estimate 18
that is current and uses methodology that is consistent with the cost analysis of the 19
Mesaba plant 20
Q What are cost numbers for coal units published by the EIA? 21
A The numbers are dramatically below the current cost estimate of Big Stone 22
II, the Comanche Peak estimate and the analysis developed by Fluor. The EIA 23
numbers used in the Annual Energy Outlook for 2004, 2005 and 2006 are 24
summarized in the table and figure below. 25
EIA PlantOnlineYear
SizeMW
LeadtimeYears
Base Cost$/kW
ContingencyFactor
Total Overnight
Cost ($/kW)Var OM$/MWH
Fixed O&M$/kW
HeatRate
(BTU/kWh)
HeatRate
Nth of Kind
Scrubbed Coal 2004 2007 600 4 1091 1.07 1,168 3.10 24.81 9000 8600Scrubbed Coal 2005 2008 600 4 1134 1.07 1,213 4.06 24.36 8844 8600Scrubbed Coal 2006 2009 600 4 1167 1.07 1,249 4.18 25.07 8844 8600
Information on New Coal Plants Published by EIA
26
PPuubblliicc DDooccuummeenntt –– TTrraaddee SSeeccrreett DDaattaa HHaass BBeeeenn EExxcciisseedd
3569071.1
55
[TRADE SECRET BEGINS 1
2
3
4
5
6
7
8
9
10
11
12
TRADE SECRET ENDS] 13
Overall due to the level of capital costs implied in the Sherco analysis and the 14
preliminary level of detail provided, I have deferred a detailed analysis of NSP’s 15
Sherco 4 option. 16
Q Does the transfer of risks from ratepayers to investors affect the value of 17
Mesaba versus a generic coal plant from a consumer perspective? 18
A It most certainly does. I have already described general issues associated 19
with construction cost risk, availability risk and O&M cost risk above. The project 20
finance model requires that all costs and risks be carefully identified, quantified, 21
and contractually assigned. In the case of Mesaba, this approach has resulted in 22
the lowest risk adjusted cost of power from the project. In teaching classes on 23
PPuubblliicc DDooccuummeenntt –– TTrraaddee SSeeccrreett DDaattaa HHaass BBeeeenn EExxcciisseedd
3569071.1
56
project finance, I use case studies that demonstrate how investors have paid dearly 1
when they have directly accepted those risks. In the classic project finance cases 2
of Eurotunnel and Eurodisney, actual costs grew by a factor of three times over 3
the original projection. 4
Q How are risks allocated between ratepayers and Excelsior investors in the 5
proposed PPA contract? 6
A Through setting various prices at fixed levels, including penalty provisions 7
and allowing the pass-through of other items, some risks are allocated to investors 8
in the Mesaba plant and other risks are retained by ratepayers. Some of the risks 9
that are allocated to investors rather than ratepayers include the following: 10
- Since the cost of the plant is fixed when EPC is signed, risks of 11
construction cost over-runs over the construction period are allocated to 12
investors. As is typical in such situations, the construction cost risk is 13
allocated to construction contractors through a fixed price date certain 14
turnkey contract. 15
- Since the amount of capacity that will be provided will be fixed at EPC 16
signing, technological risk that the capacity of the plant will be less than 17
the amount in the PPA is allocated to investors. 18
- Since the PPA defines a date at which the plant will begin to operate and 19
no payments are made by ratepayers until operations commence, the 20
principal risks of delays in construction and the associated carrying costs 21
are incurred by Mesaba investors. 22
PPuubblliicc DDooccuummeenntt –– TTrraaddee SSeeccrreett DDaattaa HHaass BBeeeenn EExxcciisseedd
3569071.1
57
- Since the PPA includes penalties for not meeting availability 1
requirements, investors incur availability risk and the ratepayers do not 2
pay for the plant during hours it is not available. 3
- Since the PPA includes a severe reduction in the capacity payment for 4
each hour the plant is not fully available on coal-derived syngas, investors 5
incur risks associated with the gasifier and associated facilities not 6
working as planned. 7
- Since the PPA fixes the value of the capacity payment in nominal terms, 8
risks of changes in the nominal cost of capital are incurred by investors. 9
- Since the PPA contract is with NSP rather than directly with ratepayers, 10
investors take the risk that NSP will not meet the contract provisions in the 11
case of bankruptcy. 12
VII. REAL OPTIONS THAT ACCRUE TO RATEPAYERS FROM THE 13
MESABA PLANT AND ARE NOT AVAILABLE FROM OTHER 14
ALTERNATIVES 15
Q What are real options in capital budgeting and investment analysis? 16
A Real options allow the manager of an asset to make different decisions in 17
managing the asset depending on market forces or the variation in states of the 18
world that are outside of its direct control. Classic examples of real options 19
include the option to delay construction of a plant, the option to retire a plant, the 20
option to expand a plant, the option to cancel a research program and the option to 21
dispatch a plant. 22
Q Are real options valuable? 23
PPuubblliicc DDooccuummeenntt –– TTrraaddee SSeeccrreett DDaattaa HHaass BBeeeenn EExxcciisseedd
3569071.1
58
A Yes. It is now well accepted in financial economics that real options can 1
be very valuable because they can limit the downside risk associated with market 2
conditions such as changes in the price of a product that cannot be foreseen with 3
certainty. For example, the option to expand a plant depends on whether market 4
conditions warrant an expansion. If market is depressed and expansion is not 5
justified, management does not have to expand the plant and the downside is 6
limited. On the other hand if market conditions suggest that a plant should be 7
expanded (because, for example, prices are high), the upside potential still exists. 8
This example demonstrates that the added value of a real option depends on the 9
volatility of future market conditions and the length of the lives of assets. If there 10
is no volatility, there is no downside risk to protect against. If, on the other hand, 11
the market is very volatile, real options allow the manager to take advantage of 12
the upside without being exposed to the downside. 13
Q Are there real options associated with the Mesaba project that do not exist 14
with alternative scrubbed coal plants? 15
A Yes. The Mesaba includes at least four real options that do not exist for 16
the SCPC plants that Dr. Amit used in his analysis of the value of the plant to 17
ratepayers. These real options include the option to use petroleum coke, the option 18
to take fuel from multiple different regions, the option to burn natural gas when 19
the gasifier is not available and most importantly, the option to sequester carbon. 20
The value of all of these real options accrues directly to ratepayers. 21
Q Describe the option to use petroleum coke instead of other coal. 22
PPuubblliicc DDooccuummeenntt –– TTrraaddee SSeeccrreett DDaattaa HHaass BBeeeenn EExxcciisseedd
3569071.1
59
A The Mesaba plant can either use up to 50% petroleum coke or 100% 1
powder river basin (“PRB”) coal. This means that if the difference between the 2
price of petroleum coke and PRB coal makes it beneficial to use more petroleum 3
coke, it can use more of that fuel. On the other hand, if the basis differential goes 4
the other way, the plant can use more PRB coal. Since the benefit of the fuel 5
flexibility shows up in the energy charge, the benefit of the option to use 6
petroleum coke accrues to ratepayers. Big Stone II, Comanche Peak 3 and Sherco 7
4 do not include a similar real option to use petroleum coke. 8
Q Describe the option to use alternative types of coal at Mesaba. 9
A Due to its proximity to alternative rail routes, the Mesaba plant has access 10
to coal that is mined in different regions of the country. This option limits the 11
exposure of ratepayers to regional spikes in the price of coal. An example of how 12
this option can protect ratepayers is the recent price spike in western PRB coal. 13
Prices spiked more for PRB coal than for eastern coal. Without the option to use 14
coal from alternative regions, a plant has no recourse but to accept the 15
consequence of the price spikes. However, with flexibility to use eastern or 16
western coal, the effect of price spikes in one region is limited. As with the case 17
of the option to use petroleum coke, this option accrues to ratepayers through the 18
energy charge in the PPA. 19
Q Describe the option to burn natural gas at Mesaba. 20
A Dr. Amit has pointed out that ratepayers are exposed to the risk of the 21
gasifiers not working correctly. While there is a risk that these problems can occur 22
in early years of the plant operation, the risk to ratepayers is mitigated by the 23
PPuubblliicc DDooccuummeenntt –– TTrraaddee SSeeccrreett DDaattaa HHaass BBeeeenn EExxcciisseedd
3569071.1
60
ability of the plant to operate on natural gas. This provides a built-in source of 1
replacement capacity at a fraction of the price of what it could cost on the open 2
market, which is a real option not offered by a conventional coal plant. 3
Q What is the option to sequester carbon dioxide? 4
A Without doubt, one of the most important issues facing the electricity 5
generating industry in coming years is the issue of global warming caused by 6
production of carbon dioxide. It is possible that in the future, there will be such 7
high costs attributed to production of carbon dioxide that it becomes beneficial to 8
sequester the carbon dioxide. If this occurs, the Mesaba plant can sequester 9
carbon dioxide on a far more efficient basis than alternative coal plants. This 10
means that the Mesaba plant hedges ratepayer risk that carbon dioxide costs will 11
be attributed in rates. 12
To illustrate the real option to sequester carbon, think about two future 13
states of the world. In one state of the world, no added carbon dioxide cost is 14
incurred by ratepayers. Here, the sequestration option has no value to ratepayers. 15
However in a second state of the world, carbon dioxide must be sequestered. In 16
this case, the value of Mesaba increases dramatically relative to alternative plants 17
that Dr. Amit uses in his analysis. 18
Q Are the values of real options included in typical PVRR analysis or in 19
resource planning analysis? 20
A No. Any discounted cash flow analysis is founded on the notion that the 21
distribution of cash flows is symmetrically distributed in an upside scenario and a 22
downside scenario. The real options mentioned above limit the ratepayer risk and 23
PPuubblliicc DDooccuummeenntt –– TTrraaddee SSeeccrreett DDaattaa HHaass BBeeeenn EExxcciisseedd
3569071.1
61
result in a distribution of Busbar costs that is skewed. With real options the 1
potential for costs to increase is moderated while the possibility for costs to go 2
down is not affected. When the scenarios are developed in resource plans using 3
PVRR, the value of this mitigated risk is typically ignored. 4
Q How could adjustments be made in Dr. Amit’s analysis to appropriately 5
measure the value of real options? 6
A One would first have to measure the statistical properties of market and 7
technological parameters including price spikes, volatility and the likelihood of 8
various events occurring. These events include the volatility and price spikes in 9
the basis differential between petroleum coke and PRB coal price, the volatility in 10
regional coal price difference, the probability of the natural gas capacity being of 11
value during outages of the coal portion of the plant and most importantly, the 12
probability distribution of carbon dioxide production costs being imposed on 13
ratepayers. Once these statistical properties are established, a variety of models 14
could be used to quantify the value to ratepayers. 15
Q Have you quantified how these real options affect the analysis made by Dr. 16
Amit of Mesaba versus other coal plants? 17
A No. Unfortunately due to time constraints I have not been able to complete 18
this analysis. However, it is clear to me that the options I discussed above do have 19
a lot of value to ratepayers. Further, similar real options are not available to 20
ratepayers who will pay for the Big Stone II plant nor for NSP ratepayers who 21
will pay for expansion plants at the Comanche Peak or the Sherco sites. These 22
PPuubblliicc DDooccuummeenntt –– TTrraaddee SSeeccrreett DDaattaa HHaass BBeeeenn EExxcciisseedd
3569071.1
62
factors should therefore be weighed by the Commission as offering additional 1
value to the Mesaba PPA. 2
VIII. RISK ISSUES IN THE PPA 3
Q While you have gone to some length in showing ratepayer risks are lower for 4
the Mesaba plant than alternative, does Dr. Amit not suggest that too many 5
risks are allocated to ratepayers and not enough are allocated to investors in 6
the Mesaba plant? 7
A Yes. For example, Dr. Amit would like investors in the Mesaba plant to accept 8
even more risk than is allocated through the PPA as proposed. For example, he suggests 9
that the Project should be responsible for the cost of all replacement power purchased if 10
the plant is delayed or cancelled. 11
Q Do you agree that this risk should borne by the Project? 12
A No. Requiring the Project to contractually commit to pay ratepayers for 13
the cost of the power NSP buys instead of the power to be supplied by the Project 14
is an unreasonable allocation of risk that would cost the ratepayers far more than 15
the benefit it would provide. In essence, the project would have to maintain a very 16
large reserve account for this purpose, which would increase substantially the 17
tariff it would need to charge to cover its costs. In the catastrophic scenario where 18
the plant does not ever come online, ratepayers are in a much better position 19
under a PPA than in a rate-based scenario because they pay nothing for the 20
Project, only for the replacement power procured from other sources. 21
Q Do you agree with Dr. Amit that provisions of the PPA contract relating to 22
termination upon the default of Excelsior imposes undue risks on 23
ratepayers? 24
PPuubblliicc DDooccuummeenntt –– TTrraaddee SSeeccrreett DDaattaa HHaass BBeeeenn EExxcciisseedd
3569071.1
63
A No. While Dr. Amit suggests that the default provisions impose risks on 1
ratepayers, in fact the provisions protect ratepayers. Dr. Amit testifies: 2
I have concerns because ratepayers are not reasonably protected. 3 The Department is concerned with the financial risks associated 4 with Seller's dissolution or liquidation. If such events occur in the 5 late construction period or in early years of production, NSP would 6 have to find replacement energy and capacity that could be very 7 costly due to the short replacement time available. The PPA 8 specifies no financial instruments such as a letter of credit, an 9 escrow account or any other similar instrument that could serve as 10 a financial warranty. Therefore, the Department concludes that the 11 PPA does not reasonably protect NSP's ratepayers from the 12 financial risk of the PPA. 13
14 Q Do you agree with this assessment? 15
A No. Again, in such scenarios, ratepayers are protected by the PPA to a 16
much greater extent than a rate-based unit. If the IPP plant is down, they are left 17
with exactly the same potential cost for replacement power, but the benefit that 18
exists is that the IPP plant does not get paid. Under the contract; with a PPA, 19
ratepayers do not pay for capacity that is not available to them. Contrast this with 20
the utility owned plant, where the ratepayer is paying for a plant that is not 21
performing, as well as the cost of replacement power. The fixes he proposes, in 22
terms of letters of credit and escrowed funds are never required from utility 23
owners and have the effect of driving up costs without commensurate benefits. 24
While Dr. Amit suggests that the default provisions impose risks on ratepayers, in 25
fact the provisions protect ratepayers. 26
IX. CONCLUSIONS 27
Q What are the overall conclusions you reach in this testimony? 28
PPuubblliicc DDooccuummeenntt –– TTrraaddee SSeeccrreett DDaattaa HHaass BBeeeenn EExxcciisseedd
3569071.1
64
A My overall conclusion is that once the allocated costs, environmental 1
benefits, recent increases in capital cost, options, first of kind costs, and risks are 2
put on an equal footing, my analysis demonstrates that the Mesaba plant and its 3
IGCC technology is currently a least cost resource for residents and businesses in 4
the State of Minnesota. 5
Q Does this conclude your prepared rebuttal testimony? 6
A Yes.7

3569071.1
1
EXHIBIT _____ (ECB-1)
3569071.1
1
• Edward Bodmer, Principal Consultant • Pace Global Energy Services, LLC
Industry Experience: 20+ years Qualifications and Experience: Mr. Bodmer provides financial and economic consulting services to a variety of clients, he teaches professional development courses in an assortment of modeling topics (project finance, credit analysis and M&A modeling) and he is an adjunct professor at Lewis University. His consulting activities include providing expert testimony on financial and economic issues before US regulatory agencies; developing complex M&A, project finance, corporate and simulation models, and advisory services to support merger and acquisition projects. In addition, Mr. Bodmer has been involved in formulating significant government policy related to electricity deregulation; he has evaluated energy purchasing decisions for many corporations; and, he has provided advice on corporate strategy. As part of the consulting activities, Mr. Bodmer has created a wide variety of models for energy companies, investment banks, commercial banks and government agencies. Recent assignments include M&A analysis of electricity generation and transmission. Mr. Bodmer has developed and taught more than 200 financial modeling seminars in the past six years. His courses have addressed mergers and acquisitions, project finance modeling, credit analysis modeling, general corporate modeling, Monte Carlo simulation and real options, energy modeling, electricity valuation modeling and modeling for debt re-structuring. Expert Testimony • On behalf of the City of Topeka before the Kansas Corporation Commission, 2001, Docket
No. 01-WSRE-436-RTS. Direct, rebuttal and cross-answering testimony on regional rate parity, treatment of a new combined cycle plant, and new combustion turbine plants of Western Resources Company.
• On behalf of the Minnesota Department of Public Service, 1996. Docket E.GOO2/PA-95-500. Direct and rebuttal testimony on the reasonableness of cost savings estimated in the proposed merger of Wisconsin Electric Power and Northern States Power Company.
• On Behalf of the City of Chicago before the Illinois Commerce Commission, 2001, Docket No. 01-0423. Direct and rebuttal testimony on the embedded and marginal cost study of Commonwealth Edison Company and the reasonableness of significant distribution expenditures made by the company.
• On Behalf of Detroit Edison Company, before the Michigan Public Service Commission, Case No. U-12369. Rebuttal testimony on the valuation of customer options to switch between regulated utility service and competitive service.
• On behalf of Industrial Customers before the Illinois Commerce Commission, Docket No. 00-0361. Direct and rebuttal testimony on the appropriate treatment of decommissioning cost after transfer of nuclear plants to an unregulated subsidiary of Commonwealth Edison Company.
• On behalf of the Staff of the Maine Public Utilities Commission, 2000. Docket No. 99-666. Bench Analysis on development of productivity factors using comparative industry data and
3569071.1
2
regression analysis and implementation of the alternative rate plan proposed by Central Maine Power Company.
• On behalf of competitive metering providers before the Illinois Commerce Commission, 2000. Docket No. 99-0117. Direct and rebuttal testimony on the appropriate pricing of credits for customers receiving competitive metering services from non-utility companies.
• On behalf of the City of Chicago before the Illinois Commerce Commission, 1999. Docket 99-0117. Direct and rebuttal testimony on the marginal cost of distribution service, the appropriate level of market price credits and rate design for government facilities.
• On behalf of Competitive Suppliers before the Illinois Commerce Commission, 1999. Docket No. 98-0680. Testimony on the economics of unbundling billing and metering services for utilities in Illinois and the benefits of uniform tariffs.
• On behalf of the Maine Public Utilities Commission, 1998. Docket 98-058. Bench analysis on the market power implications and the financial benefits to customers of the Divestiture Plans of Central Maine Power Company, Bangor Hydro Electric Company and Maine Public Service Company.
• On behalf of the Massachusetts Municipal Wholesale Electric Company, 1997. Deposition of forward pricing and valuation of nuclear plant entitlements held by MMWEC.
• On behalf of Indianapolis Power and Light Company before the Indiana Public Utilities Commission, Cause No. 39938. Direct and rebuttal testimony on the measurement of the relative productivity of utility companies using regression analysis and cross-sectional cost data for distribution, transmission and generation.
• On behalf of the San Diego Gas and Electric Company before the California Public Utilities Commission, 1995, Case A 93-12-029. Rebuttal testimony on the statistical analysis of rate comparisons to measure the relative efficiency of utility companies.
• On behalf of the City of Chicago before the Illinois Commerce Commission, 1994. Docket 94-0065. Direct and rebuttal testimony of marginal cost of service and the appropriate rate design on an intra-class basis for residential customers.
• On behalf of the City of Chicago before the Illinois Commerce Commission, 1993. Docket 92-0303. Direct and rebuttal testimony on the regional cost of service in the City of Chicago and the Suburban communities.
• On behalf of the Governor of Illinois, the Cook County States Attorney and the Illinois Attorney General before the Illinois Commerce Commission, 1988. Docket 87-0043. Direct and rebuttal testimony on the cost and benefits of a proposal by Commonwealth Edison Company to spin-off three nuclear plants to an subsidiary company.
• On behalf of the Connecticut Attorney General before the Connecticut Department of Utility Control, 1984. Testimony of the prudence of Northeast Utilities in delaying construction of a nuclear plant.
• On behalf of the Illinois Commerce Commission Staff before the Illinois Commerce Commission, Docket No 83-0309. Testimony on the appropriate treatment of deferred taxes after changes in the income tax rate.
• On behalf of the Illinois Commerce Commission Staff before the Illinois Commerce Commission, Docket No 81-0026. Testimony on the interim and permanent phase of a rate increase proposed by Commonwealth Edison company addressing financial viability, capital structure and phase-in issues.
3569071.1
3
• On behalf of the Illinois Commerce Commission Staff before the Illinois Commerce Commission, Docket No 81-0324. Testimony on the appropriate capital structure for Commonwealth Edison Company from a ratepayer perspective.
• On behalf of the Illinois Commerce Commission Staff before the Illinois Commerce Commission, Docket No 80-0044. Testimony on the cost of common equity capital using the discounted cash flow method for Union Electric Company.
• On behalf of the Illinois Commerce Commission Staff before the Illinois Commerce Commission, Docket No 80-0167. Testimony on the Application of a variable rate of return mode to apply to Construction Work in Progress for Illinois Power Company.
Employment History: 1990 - Present Taylor-DeJongh and Independent Consultant
1986-1990 Vice President, Industry Specialist/Electric and Gas Division, First National Bank of Chicago, USA
Education: MBA Econometrics, University of Chicago
BS Finance, University of Illinois, 1979 Countries of Experience: United States Languages: English (Native) Publications • Forward Pricing and Valuation in Capital Intensive Industries: A Case Study of Electricity
Generation. A 400 page manuscript in the process of completion. • Valuation of Electric Generating Plants. Bodmer, Edward, Phillip O’Connor – Edison
Electric Institute, December 1998 • Benefits of Distributed Generation in a De-Regulated Environment. Bodmer, Edward – July
1997 • Impacts of Western Area Power Administration’s Power Marketing Alternatives on Retail
Electricity Rates and Financial Viability. Bodmer, Edward, R. Fisher and R. C. Hemphill, January, 1994.
• Statistical Study of Costs and Rates in New Zealand, Bodmer, Edward, New Zealand Electricity Supply Association, 1992.
• Recommendations From University of Chicago Conference on Utility Regulation. Bodmer, Edward, George Tolley and Peter Griffes, Resources and Energy, 1992.
• Utility Rate Comparisons and Management Efficiency. Bodmer, Edward, and George Tolley. Public Utilities Fortnightly, 1990.
• Tax and Financial Implications of ERC Leasing by Electricity Utility Companies. Bodmer, Edward, and Roger Raufer, 1985.
• The Capital Investment Recovery Model, An Alternative To The AFUDC/CWIP In Rate Base Controversy. Bodmer, Edward and Robert Bussa. Midwest Finance Association, 1983.

3569071.1
4
• Some Consequences Of The Tax Act Of 1981. Bodmer, Edward, and Charles Stalon. Proceedings from the 13th annual conference of the Institute of Public Utilities, Williamsburg Virginia, !982.
• Alternatives to Case by Case Rate Base Regulation. Bodmer, Edward. Proceedings from the Second Biennial Regulatory Information Conference, 1982.