Embed Size (px)
Citation preview
Public Entity Risk Management Authority(PERMA)
ANNUAL BUDGETFY 2015-16
AMENDED(June 4, 2015)
PERMAFY 2015-16
Annual Budget
Table of Contents__________________________
Description of Budgeted Line Items . . . . . . . . . . . . . . . . . . . . . . . . . . . . . . . . . . . . . . . . . . . . . . . . . . . . . . . . . . . . . . . . . . 1
Budget Summary . . . . . . . . . . . . . . . . . . . . . . . . . . . . . . . . . . . . . . . . . . . . . . . . . . . . . . . . . . . . . . . . . . . . . . . . . . . . . . . 3
Administrative Expenditures
Personnel . . . . . . . . . . . . . . . . . . . . . . . . . . . . . . . . . . . . . . . . . . . . . . . . . . . . . . . . . . . . . . . . . . . . . . . . . . . . . . . . . 5
Office Expenses . . . . . . . . . . . . . . . . . . . . . . . . . . . . . . . . . . . . . . . . . . . . . . . . . . . . . . . . . . . . . . . . . . . . . . . . . . . . 6
Building Expenses . . . . . . . . . . . . . . . . . . . . . . . . . . . . . . . . . . . . . . . . . . . . . . . . . . . . . . . . . . . . . . . . . . . . . . . . . . 6
Conferences and Meetings . . . . . . . . . . . . . . . . . . . . . . . . . . . . . . . . . . . . . . . . . . . . . . . . . . . . . . . . . . . . . . . . . . . 6
Professional Services . . . . . . . . . . . . . . . . . . . . . . . . . . . . . . . . . . . . . . . . . . . . . . . . . . . . . . . . . . . . . . . . . . . . . . . 7
Capital Outlay . . . . . . . . . . . . . . . . . . . . . . . . . . . . . . . . . . . . . . . . . . . . . . . . . . . . . . . . . . . . . . . . . . . . . . . . . . . . . 7
Optional Services . . . . . . . . . . . . . . . . . . . . . . . . . . . . . . . . . . . . . . . . . . . . . . . . . . . . . . . . . . . . . . . . . . . . . . . . . . . 8
Program Expenditures
General Liability . . . . . . . . . . . . . . . . . . . . . . . . . . . . . . . . . . . . . . . . . . . . . . . . . . . . . . . . . . . . . . . . . . . . . . . . . . . . 9
Workers’ Compensation . . . . . . . . . . . . . . . . . . . . . . . . . . . . . . . . . . . . . . . . . . . . . . . . . . . . . . . . . . . . . . . . . . . . . . 9
Allocation of Expenditures by Member
General Liability . . . . . . . . . . . . . . . . . . . . . . . . . . . . . . . . . . . . . . . . . . . . . . . . . . . . . . . . . . . . . . . . . . . . . . . . . . . 10
Workers’ Compensation . . . . . . . . . . . . . . . . . . . . . . . . . . . . . . . . . . . . . . . . . . . . . . . . . . . . . . . . . . . . . . . . . . . . . 12
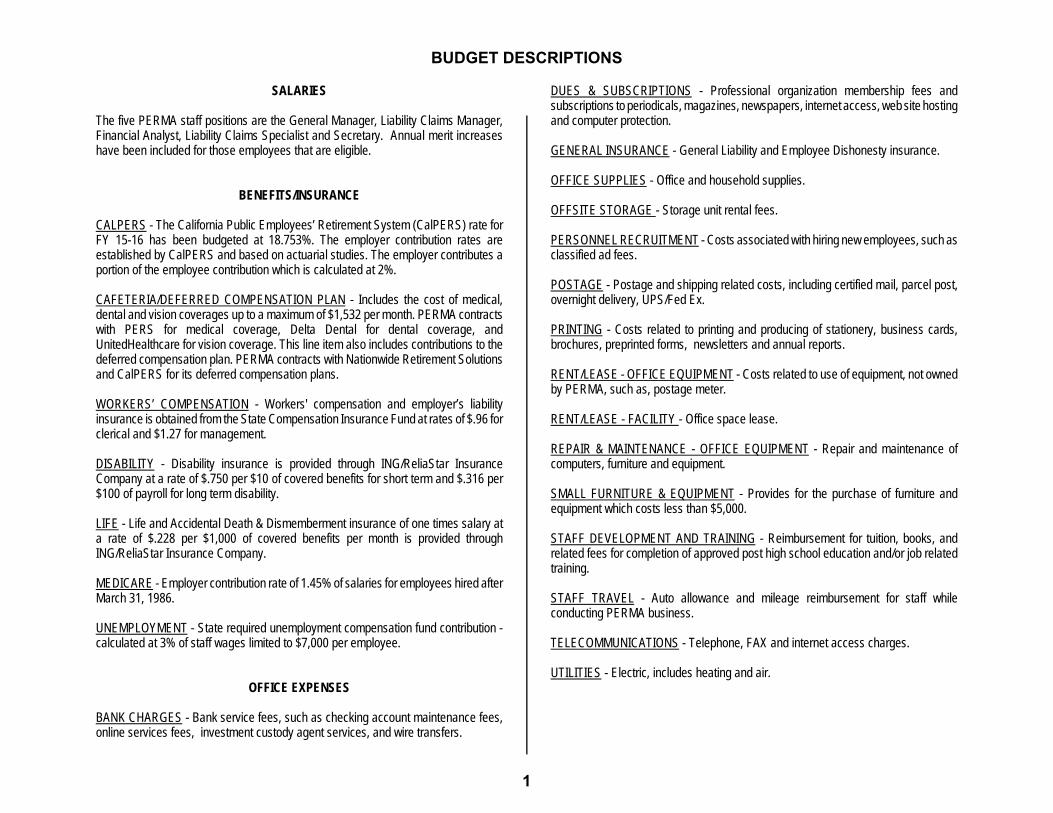
BUDGET DESCRIPTIONS
SALARIES
The five PERMA staff positions are the General Manager, Liability Claims Manager,Financial Analyst, Liability Claims Specialist and Secretary. Annual merit increaseshave been included for those employees that are eligible.
BENEFITS/INSURANCE
CALPERS - The California Public Employees’ Retirement System (CalPERS) rate forFY 15-16 has been budgeted at 18.753%. The employer contribution rates areestablished by CalPERS and based on actuarial studies. The employer contributes aportion of the employee contribution which is calculated at 2%.
CAFETERIA/DEFERRED COMPENSATION PLAN - Includes the cost of medical,dental and vision coverages up to a maximum of $1,532 per month. PERMA contractswith PERS for medical coverage, Delta Dental for dental coverage, andUnitedHealthcare for vision coverage. This line item also includes contributions to thedeferred compensation plan. PERMA contracts with Nationwide Retirement Solutionsand CalPERS for its deferred compensation plans.
WORKERS’ COMPENSATION - Workers' compensation and employer’s liabilityinsurance is obtained from the State Compensation Insurance Fund at rates of $.96 forclerical and $1.27 for management.
DISABILITY - Disability insurance is provided through ING/ReliaStar InsuranceCompany at a rate of $.750 per $10 of covered benefits for short term and $.316 per$100 of payroll for long term disability.
LIFE - Life and Accidental Death & Dismemberment insurance of one times salary ata rate of $.228 per $1,000 of covered benefits per month is provided throughING/ReliaStar Insurance Company.
MEDICARE - Employer contribution rate of 1.45% of salaries for employees hired afterMarch 31, 1986.
UNEMPLOYMENT - State required unemployment compensation fund contribution -calculated at 3% of staff wages limited to $7,000 per employee.
OFFICE EXPENSES
BANK CHARGES - Bank service fees, such as checking account maintenance fees,online services fees, investment custody agent services, and wire transfers.
DUES & SUBSCRIPTIONS - Professional organization membership fees andsubscriptions to periodicals, magazines, newspapers, internet access, web site hostingand computer protection.
GENERAL INSURANCE - General Liability and Employee Dishonesty insurance.
OFFICE SUPPLIES - Office and household supplies.
OFFSITE STORAGE - Storage unit rental fees.
PERSONNEL RECRUITMENT - Costs associated with hiring new employees, such asclassified ad fees.
POSTAGE - Postage and shipping related costs, including certified mail, parcel post,overnight delivery, UPS/Fed Ex.
PRINTING - Costs related to printing and producing of stationery, business cards,brochures, preprinted forms, newsletters and annual reports.
RENT/LEASE - OFFICE EQUIPMENT - Costs related to use of equipment, not ownedby PERMA, such as, postage meter.
RENT/LEASE - FACILITY - Office space lease.
REPAIR & MAINTENANCE - OFFICE EQUIPMENT - Repair and maintenance ofcomputers, furniture and equipment.
SMALL FURNITURE & EQUIPMENT - Provides for the purchase of furniture andequipment which costs less than $5,000.
STAFF DEVELOPMENT AND TRAINING - Reimbursement for tuition, books, andrelated fees for completion of approved post high school education and/or job relatedtraining.
STAFF TRAVEL - Auto allowance and mileage reimbursement for staff whileconducting PERMA business.
TELECOMMUNICATIONS - Telephone, FAX and internet access charges. UTILITIES - Electric, includes heating and air.
1
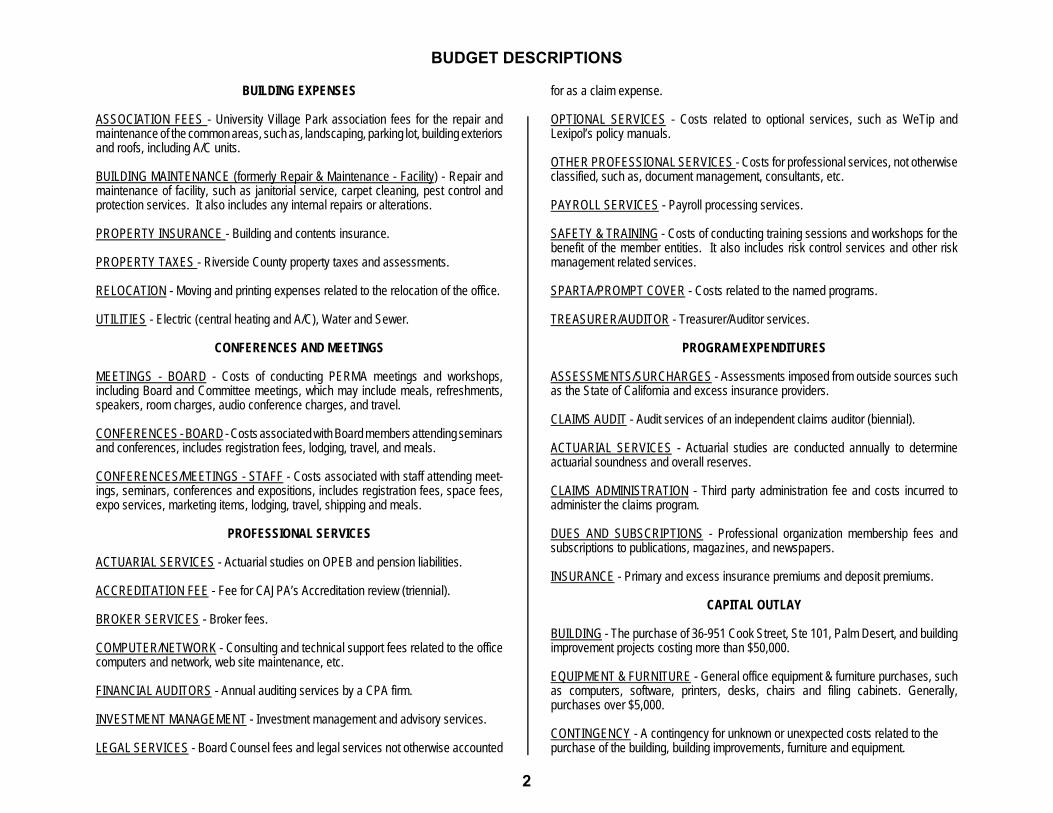
BUDGET DESCRIPTIONS
BUILDING EXPENSES
ASSOCIATION FEES - University Village Park association fees for the repair andmaintenance of the common areas, such as, landscaping, parking lot, building exteriorsand roofs, including A/C units.
BUILDING MAINTENANCE (formerly Repair & Maintenance - Facility) - Repair andmaintenance of facility, such as janitorial service, carpet cleaning, pest control andprotection services. It also includes any internal repairs or alterations.
PROPERTY INSURANCE - Building and contents insurance.
PROPERTY TAXES - Riverside County property taxes and assessments.
RELOCATION - Moving and printing expenses related to the relocation of the office.
UTILITIES - Electric (central heating and A/C), Water and Sewer.
CONFERENCES AND MEETINGS
MEETINGS - BOARD - Costs of conducting PERMA meetings and workshops,including Board and Committee meetings, which may include meals, refreshments,speakers, room charges, audio conference charges, and travel.
CONFERENCES - BOARD - Costs associated with Board members attending seminarsand conferences, includes registration fees, lodging, travel, and meals.
CONFERENCES/MEETINGS - STAFF - Costs associated with staff attending meet-ings, seminars, conferences and expositions, includes registration fees, space fees,expo services, marketing items, lodging, travel, shipping and meals.
PROFESSIONAL SERVICES
ACTUARIAL SERVICES - Actuarial studies on OPEB and pension liabilities.
ACCREDITATION FEE - Fee for CAJPA’s Accreditation review (triennial).
BROKER SERVICES - Broker fees.
COMPUTER/NETWORK - Consulting and technical support fees related to the officecomputers and network, web site maintenance, etc.
FINANCIAL AUDITORS - Annual auditing services by a CPA firm.
INVESTMENT MANAGEMENT - Investment management and advisory services.
LEGAL SERVICES - Board Counsel fees and legal services not otherwise accounted
for as a claim expense.
OPTIONAL SERVICES - Costs related to optional services, such as WeTip andLexipol’s policy manuals.
OTHER PROFESSIONAL SERVICES - Costs for professional services, not otherwiseclassified, such as, document management, consultants, etc.
PAYROLL SERVICES - Payroll processing services.
SAFETY & TRAINING - Costs of conducting training sessions and workshops for thebenefit of the member entities. It also includes risk control services and other riskmanagement related services.
SPARTA/PROMPT COVER - Costs related to the named programs.
TREASURER/AUDITOR - Treasurer/Auditor services.
PROGRAM EXPENDITURES
ASSESSMENTS/SURCHARGES - Assessments imposed from outside sources suchas the State of California and excess insurance providers.
CLAIMS AUDIT - Audit services of an independent claims auditor (biennial).
ACTUARIAL SERVICES - Actuarial studies are conducted annually to determineactuarial soundness and overall reserves.
CLAIMS ADMINISTRATION - Third party administration fee and costs incurred toadminister the claims program.
DUES AND SUBSCRIPTIONS - Professional organization membership fees andsubscriptions to publications, magazines, and newspapers.
INSURANCE - Primary and excess insurance premiums and deposit premiums.
CAPITAL OUTLAY
BUILDING - The purchase of 36-951 Cook Street, Ste 101, Palm Desert, and buildingimprovement projects costing more than $50,000.
EQUIPMENT & FURNITURE - General office equipment & furniture purchases, suchas computers, software, printers, desks, chairs and filing cabinets. Generally,purchases over $5,000.
CONTINGENCY - A contingency for unknown or unexpected costs related to thepurchase of the building, building improvements, furniture and equipment.
2
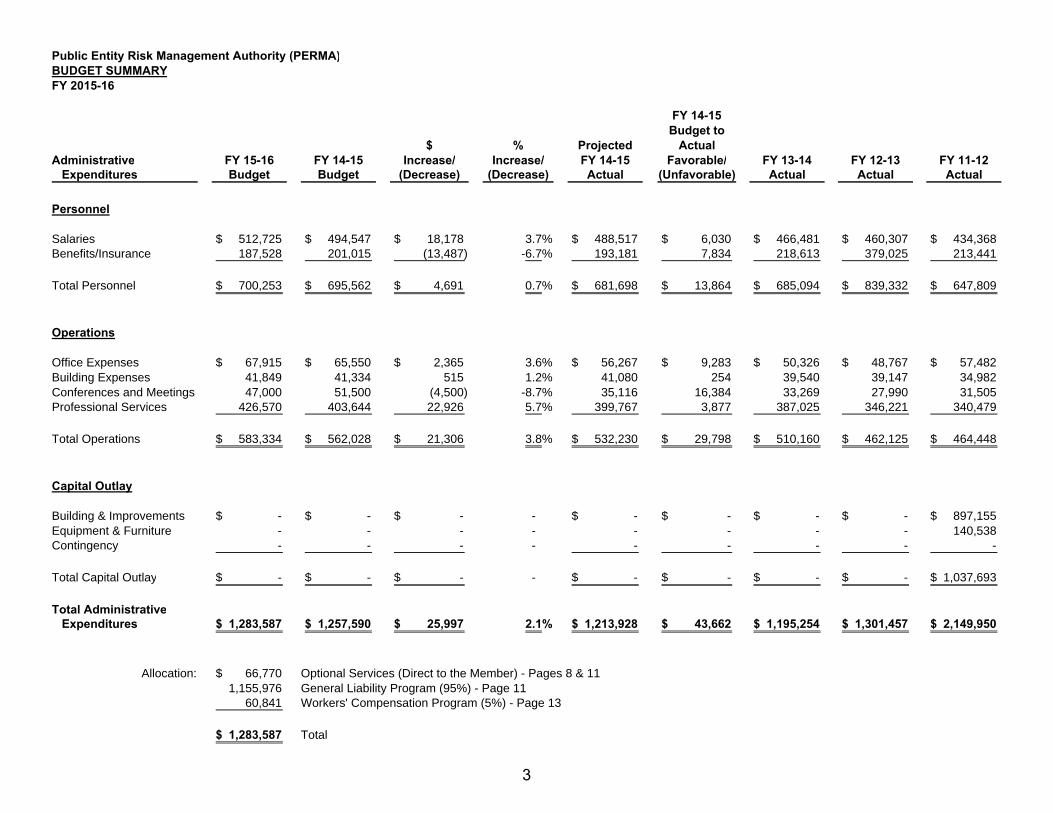
Public Entity Risk Management Authority (PERMA)BUDGET SUMMARYFY 2015-16
FY 14-15Budget to
$ % Projected ActualAdministrative FY 15-16 FY 14-15 Increase/ Increase/ FY 14-15 Favorable/ FY 13-14 FY 12-13 FY 11-12 Expenditures Budget Budget (Decrease) (Decrease) Actual (Unfavorable) Actual Actual Actual
Personnel
Salaries 512,725$ 494,547$ 18,178$ 3.7% 488,517$ 6,030$ 466,481$ 460,307$ 434,368$ Benefits/Insurance 187,528 201,015 (13,487) -6.7% 193,181 7,834 218,613 379,025 213,441
Total Personnel 700,253$ 695,562$ 4,691$ 0.7% 681,698$ 13,864$ 685,094$ 839,332$ 647,809$
Operations
Office Expenses 67,915$ 65,550$ 2,365$ 3.6% 56,267$ 9,283$ 50,326$ 48,767$ 57,482$ Building Expenses 41,849 41,334 515 1.2% 41,080 254 39,540 39,147 34,982 Conferences and Meetings 47,000 51,500 (4,500) -8.7% 35,116 16,384 33,269 27,990 31,505 Professional Services 426,570 403,644 22,926 5.7% 399,767 3,877 387,025 346,221 340,479
Total Operations 583,334$ 562,028$ 21,306$ 3.8% 532,230$ 29,798$ 510,160$ 462,125$ 464,448$
Capital Outlay
Building & Improvements -$ -$ -$ - -$ -$ -$ -$ 897,155$ Equipment & Furniture - - - - - - - - 140,538 Contingency - - - - - - - - -
Total Capital Outlay -$ -$ -$ - -$ -$ -$ -$ 1,037,693$
Total Administrative Expenditures 1,283,587$ 1,257,590$ 25,997$ 2.1% 1,213,928$ 43,662$ 1,195,254$ 1,301,457$ 2,149,950$
Allocation: 66,770$ Optional Services (Direct to the Member) - Pages 8 & 111,155,976 General Liability Program (95%) - Page 11
60,841 Workers' Compensation Program (5%) - Page 13
1,283,587$ Total
3
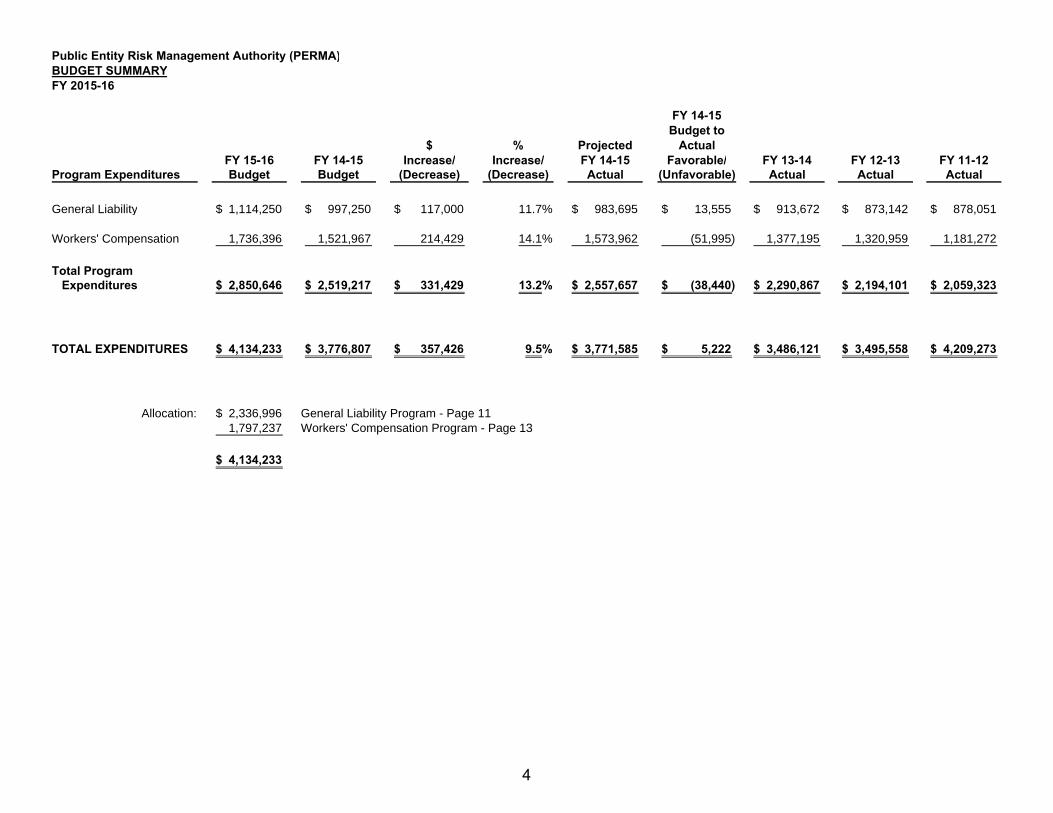
Public Entity Risk Management Authority (PERMA)BUDGET SUMMARYFY 2015-16
FY 14-15Budget to
$ % Projected ActualFY 15-16 FY 14-15 Increase/ Increase/ FY 14-15 Favorable/ FY 13-14 FY 12-13 FY 11-12
Program Expenditures Budget Budget (Decrease) (Decrease) Actual (Unfavorable) Actual Actual Actual
General Liability 1,114,250$ 997,250$ 117,000$ 11.7% 983,695$ 13,555$ 913,672$ 873,142$ 878,051$
Workers' Compensation 1,736,396 1,521,967 214,429 14.1% 1,573,962 (51,995) 1,377,195 1,320,959 1,181,272
Total Program Expenditures 2,850,646$ 2,519,217$ 331,429$ 13.2% 2,557,657$ (38,440)$ 2,290,867$ 2,194,101$ 2,059,323$
TOTAL EXPENDITURES 4,134,233$ 3,776,807$ 357,426$ 9.5% 3,771,585$ 5,222$ 3,486,121$ 3,495,558$ 4,209,273$
Allocation: 2,336,996$ General Liability Program - Page 111,797,237 Workers' Compensation Program - Page 13
4,134,233$
4
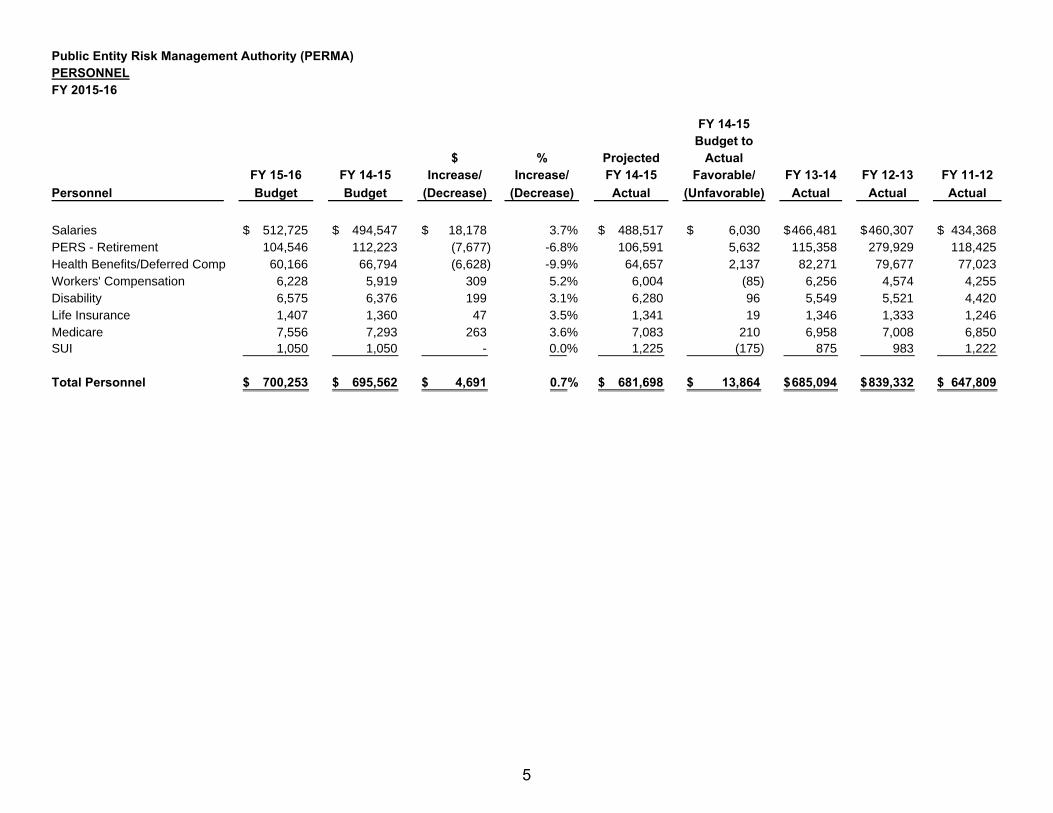
Public Entity Risk Management Authority (PERMA)PERSONNELFY 2015-16
FY 14-15Budget to
$ % Projected ActualFY 15-16 FY 14-15 Increase/ Increase/ FY 14-15 Favorable/ FY 13-14 FY 12-13 FY 11-12
Personnel Budget Budget (Decrease) (Decrease) Actual (Unfavorable) Actual Actual Actual
Salaries 512,725$ 494,547$ 18,178$ 3.7% 488,517$ 6,030$ 466,481$ 460,307$ 434,368$ PERS - Retirement 104,546 112,223 (7,677) -6.8% 106,591 5,632 115,358 279,929 118,425 Health Benefits/Deferred Comp 60,166 66,794 (6,628) -9.9% 64,657 2,137 82,271 79,677 77,023 Workers' Compensation 6,228 5,919 309 5.2% 6,004 (85) 6,256 4,574 4,255 Disability 6,575 6,376 199 3.1% 6,280 96 5,549 5,521 4,420 Life Insurance 1,407 1,360 47 3.5% 1,341 19 1,346 1,333 1,246 Medicare 7,556 7,293 263 3.6% 7,083 210 6,958 7,008 6,850 SUI 1,050 1,050 - 0.0% 1,225 (175) 875 983 1,222
Total Personnel 700,253$ 695,562$ 4,691$ 0.7% 681,698$ 13,864$ 685,094$ 839,332$ 647,809$
5
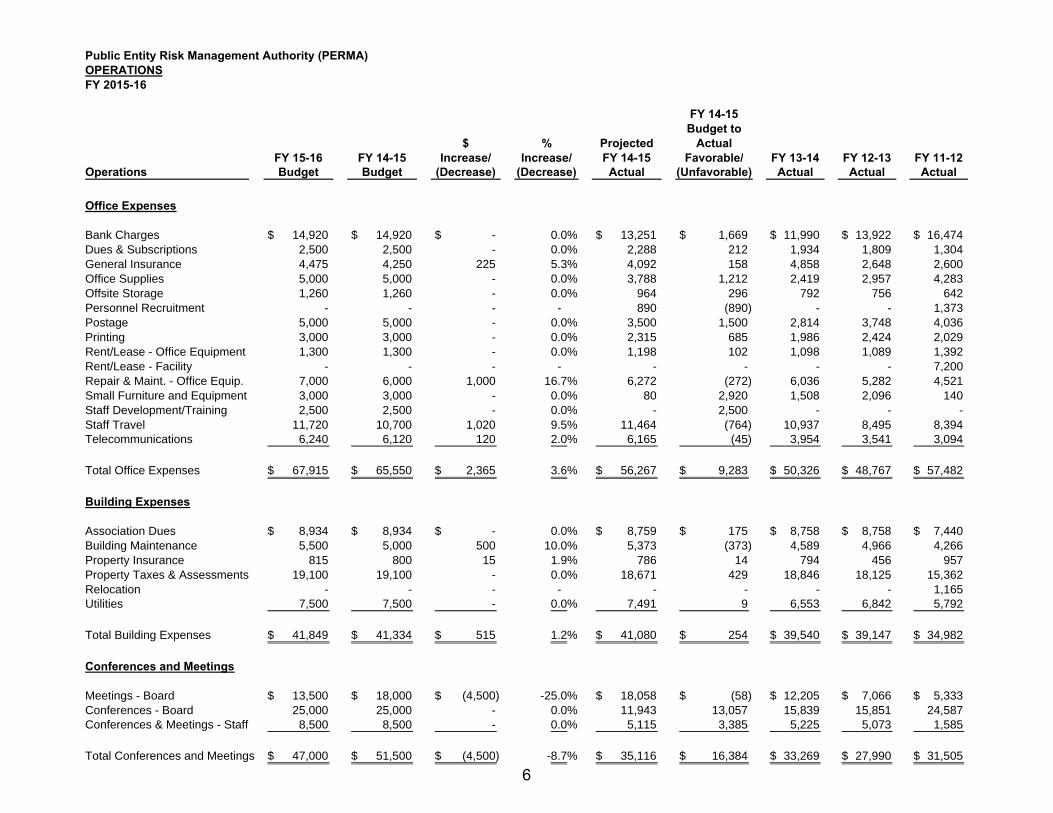
Public Entity Risk Management Authority (PERMA)OPERATIONSFY 2015-16
FY 14-15Budget to
$ % Projected ActualFY 15-16 FY 14-15 Increase/ Increase/ FY 14-15 Favorable/ FY 13-14 FY 12-13 FY 11-12
Operations Budget Budget (Decrease) (Decrease) Actual (Unfavorable) Actual Actual Actual
Office Expenses
Bank Charges 14,920$ 14,920$ -$ 0.0% 13,251$ 1,669$ 11,990$ 13,922$ 16,474$ Dues & Subscriptions 2,500 2,500 - 0.0% 2,288 212 1,934 1,809 1,304 General Insurance 4,475 4,250 225 5.3% 4,092 158 4,858 2,648 2,600 Office Supplies 5,000 5,000 - 0.0% 3,788 1,212 2,419 2,957 4,283 Offsite Storage 1,260 1,260 - 0.0% 964 296 792 756 642 Personnel Recruitment - - - - 890 (890) - - 1,373 Postage 5,000 5,000 - 0.0% 3,500 1,500 2,814 3,748 4,036 Printing 3,000 3,000 - 0.0% 2,315 685 1,986 2,424 2,029 Rent/Lease - Office Equipment 1,300 1,300 - 0.0% 1,198 102 1,098 1,089 1,392 Rent/Lease - Facility - - - - - - - - 7,200 Repair & Maint. - Office Equip. 7,000 6,000 1,000 16.7% 6,272 (272) 6,036 5,282 4,521 Small Furniture and Equipment 3,000 3,000 - 0.0% 80 2,920 1,508 2,096 140 Staff Development/Training 2,500 2,500 - 0.0% - 2,500 - - - Staff Travel 11,720 10,700 1,020 9.5% 11,464 (764) 10,937 8,495 8,394 Telecommunications 6,240 6,120 120 2.0% 6,165 (45) 3,954 3,541 3,094
Total Office Expenses 67,915$ 65,550$ 2,365$ 3.6% 56,267$ 9,283$ 50,326$ 48,767$ 57,482$
Building Expenses
Association Dues 8,934$ 8,934$ -$ 0.0% 8,759$ 175$ 8,758$ 8,758$ 7,440$ Building Maintenance 5,500 5,000 500 10.0% 5,373 (373) 4,589 4,966 4,266 Property Insurance 815 800 15 1.9% 786 14 794 456 957 Property Taxes & Assessments 19,100 19,100 - 0.0% 18,671 429 18,846 18,125 15,362 Relocation - - - - - - - - 1,165 Utilities 7,500 7,500 - 0.0% 7,491 9 6,553 6,842 5,792
Total Building Expenses 41,849$ 41,334$ 515$ 1.2% 41,080$ 254$ 39,540$ 39,147$ 34,982$
Conferences and Meetings
Meetings - Board 13,500$ 18,000$ (4,500)$ -25.0% 18,058$ (58)$ 12,205$ 7,066$ 5,333$ Conferences - Board 25,000 25,000 - 0.0% 11,943 13,057 15,839 15,851 24,587 Conferences & Meetings - Staff 8,500 8,500 - 0.0% 5,115 3,385 5,225 5,073 1,585
Total Conferences and Meetings 47,000$ 51,500$ (4,500)$ -8.7% 35,116$ 16,384$ 33,269$ 27,990$ 31,505$
6
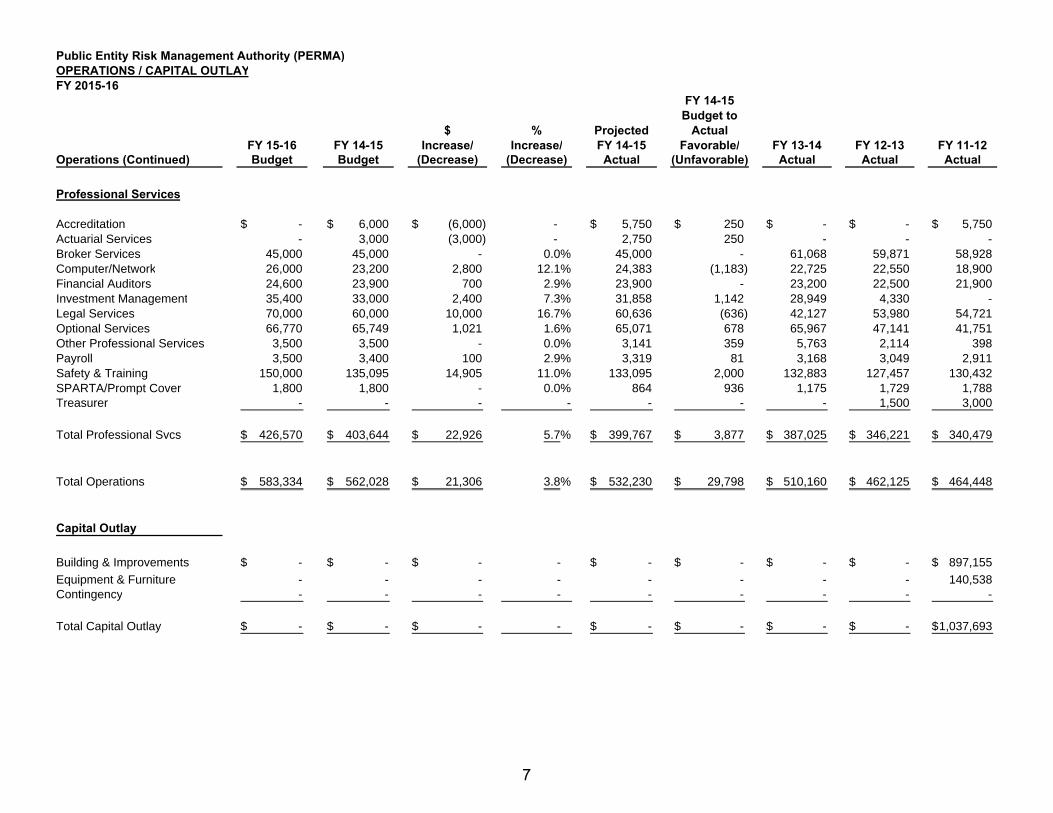
Public Entity Risk Management Authority (PERMA)OPERATIONS / CAPITAL OUTLAYFY 2015-16
FY 14-15Budget to
$ % Projected ActualFY 15-16 FY 14-15 Increase/ Increase/ FY 14-15 Favorable/ FY 13-14 FY 12-13 FY 11-12
Operations (Continued) Budget Budget (Decrease) (Decrease) Actual (Unfavorable) Actual Actual Actual
Professional Services
Accreditation -$ 6,000$ (6,000)$ - 5,750$ 250$ -$ -$ 5,750$ Actuarial Services - 3,000 (3,000) - 2,750 250 - - - Broker Services 45,000 45,000 - 0.0% 45,000 - 61,068 59,871 58,928 Computer/Network 26,000 23,200 2,800 12.1% 24,383 (1,183) 22,725 22,550 18,900 Financial Auditors 24,600 23,900 700 2.9% 23,900 - 23,200 22,500 21,900 Investment Management 35,400 33,000 2,400 7.3% 31,858 1,142 28,949 4,330 - Legal Services 70,000 60,000 10,000 16.7% 60,636 (636) 42,127 53,980 54,721 Optional Services 66,770 65,749 1,021 1.6% 65,071 678 65,967 47,141 41,751 Other Professional Services 3,500 3,500 - 0.0% 3,141 359 5,763 2,114 398 Payroll 3,500 3,400 100 2.9% 3,319 81 3,168 3,049 2,911 Safety & Training 150,000 135,095 14,905 11.0% 133,095 2,000 132,883 127,457 130,432 SPARTA/Prompt Cover 1,800 1,800 - 0.0% 864 936 1,175 1,729 1,788 Treasurer - - - - - - - 1,500 3,000
Total Professional Svcs 426,570$ 403,644$ 22,926$ 5.7% 399,767$ 3,877$ 387,025$ 346,221$ 340,479$
Total Operations 583,334$ 562,028$ 21,306$ 3.8% 532,230$ 29,798$ 510,160$ 462,125$ 464,448$
Capital Outlay
Building & Improvements -$ -$ -$ - -$ -$ -$ -$ 897,155$
Equipment & Furniture - - - - - - - - 140,538 Contingency - - - - - - - - -
Total Capital Outlay -$ -$ -$ - -$ -$ -$ -$ 1,037,693$
7
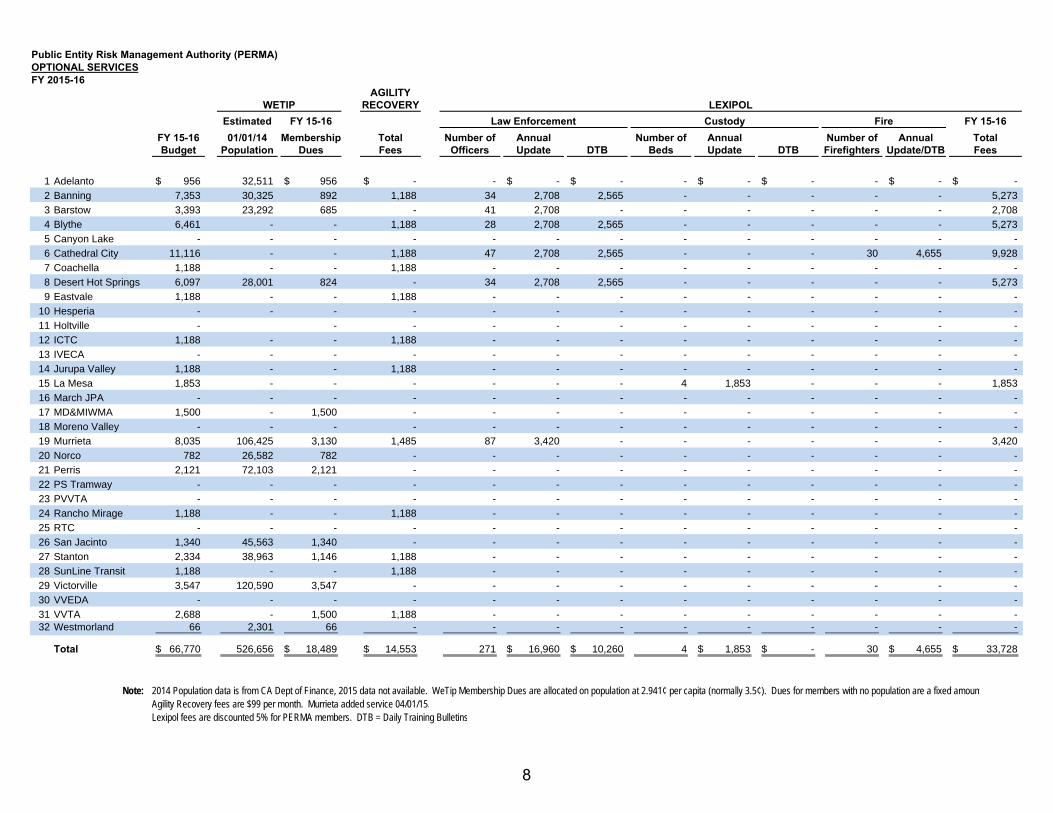
Public Entity Risk Management Authority (PERMA)OPTIONAL SERVICESFY 2015-16
AGILITYRECOVERY LEXIPOL
Estimated FY 15-16 Law Enforcement Custody Fire FY 15-16FY 15-16 01/01/14 Membership Total Number of Annual Number of Annual Number of Annual TotalBudget Population Dues Fees Officers Update DTB Beds Update DTB Firefighters Update/DTB Fees
1 Adelanto 956$ 32,511 956$ -$ - -$ -$ - -$ -$ - -$ -$
2 Banning 7,353 30,325 892 1,188 34 2,708 2,565 - - - - - 5,273
3 Barstow 3,393 23,292 685 - 41 2,708 - - - - - - 2,708
4 Blythe 6,461 - - 1,188 28 2,708 2,565 - - - - - 5,273
5 Canyon Lake - - - - - - - - - - - - -
6 Cathedral City 11,116 - - 1,188 47 2,708 2,565 - - - 30 4,655 9,928
7 Coachella 1,188 - - 1,188 - - - - - - - - -
8 Desert Hot Springs 6,097 28,001 824 - 34 2,708 2,565 - - - - - 5,273
9 Eastvale 1,188 - - 1,188 - - - - - - - - -
10 Hesperia - - - - - - - - - - - - -
11 Holtville - - - - - - - - - - - -
12 ICTC 1,188 - - 1,188 - - - - - - - - -
13 IVECA - - - - - - - - - - - - -
14 Jurupa Valley 1,188 - - 1,188 - - - - - - - - -
15 La Mesa 1,853 - - - - - - 4 1,853 - - - 1,853
16 March JPA - - - - - - - - - - - - -
17 MD&MIWMA 1,500 - 1,500 - - - - - - - - - -
18 Moreno Valley - - - - - - - - - - - - -
19 Murrieta 8,035 106,425 3,130 1,485 87 3,420 - - - - - - 3,420
20 Norco 782 26,582 782 - - - - - - - - - -
21 Perris 2,121 72,103 2,121 - - - - - - - - - -
22 PS Tramway - - - - - - - - - - - - -
23 PVVTA - - - - - - - - - - - - -
24 Rancho Mirage 1,188 - - 1,188 - - - - - - - - -
25 RTC - - - - - - - - - - - - -
26 San Jacinto 1,340 45,563 1,340 - - - - - - - - - -
27 Stanton 2,334 38,963 1,146 1,188 - - - - - - - - -
28 SunLine Transit 1,188 - - 1,188 - - - - - - - - -
29 Victorville 3,547 120,590 3,547 - - - - - - - - - -
30 VVEDA - - - - - - - - - - - - -
31 VVTA 2,688 - 1,500 1,188 - - - - - - - - - 32 Westmorland 66 2,301 66 - - - - - - - - - -
Total 66,770$ 526,656 18,489$ 14,553$ 271 16,960$ 10,260$ 4 1,853$ -$ 30 4,655$ 33,728$
Note: 2014 Population data is from CA Dept of Finance, 2015 data not available. WeTip Membership Dues are allocated on population at 2.941¢ per capita (normally 3.5¢). Dues for members with no population are a fixed amountAgility Recovery fees are $99 per month. Murrieta added service 04/01/15.Lexipol fees are discounted 5% for PERMA members. DTB = Daily Training Bulletins
WETIP
8
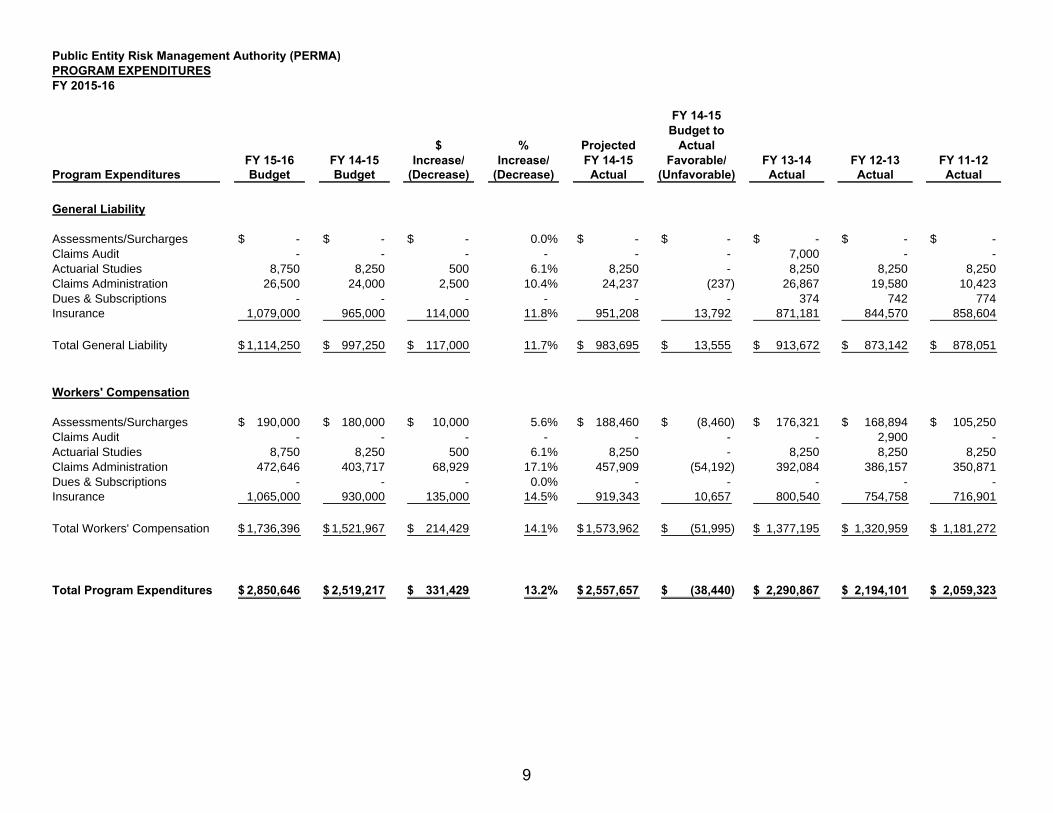
Public Entity Risk Management Authority (PERMA)PROGRAM EXPENDITURESFY 2015-16
FY 14-15Budget to
$ % Projected ActualFY 15-16 FY 14-15 Increase/ Increase/ FY 14-15 Favorable/ FY 13-14 FY 12-13 FY 11-12
Program Expenditures Budget Budget (Decrease) (Decrease) Actual (Unfavorable) Actual Actual Actual
General Liability
Assessments/Surcharges -$ -$ -$ 0.0% -$ -$ -$ -$ -$ Claims Audit - - - - - - 7,000 - - Actuarial Studies 8,750 8,250 500 6.1% 8,250 - 8,250 8,250 8,250 Claims Administration 26,500 24,000 2,500 10.4% 24,237 (237) 26,867 19,580 10,423 Dues & Subscriptions - - - - - - 374 742 774 Insurance 1,079,000 965,000 114,000 11.8% 951,208 13,792 871,181 844,570 858,604
Total General Liability 1,114,250$ 997,250$ 117,000$ 11.7% 983,695$ 13,555$ 913,672$ 873,142$ 878,051$
Workers' Compensation
Assessments/Surcharges 190,000$ 180,000$ 10,000$ 5.6% 188,460$ (8,460)$ 176,321$ 168,894$ 105,250$ Claims Audit - - - - - - - 2,900 - Actuarial Studies 8,750 8,250 500 6.1% 8,250 - 8,250 8,250 8,250 Claims Administration 472,646 403,717 68,929 17.1% 457,909 (54,192) 392,084 386,157 350,871 Dues & Subscriptions - - - 0.0% - - - - - Insurance 1,065,000 930,000 135,000 14.5% 919,343 10,657 800,540 754,758 716,901
Total Workers' Compensation 1,736,396$ 1,521,967$ 214,429$ 14.1% 1,573,962$ (51,995)$ 1,377,195$ 1,320,959$ 1,181,272$
Total Program Expenditures 2,850,646$ 2,519,217$ 331,429$ 13.2% 2,557,657$ (38,440)$ 2,290,867$ 2,194,101$ 2,059,323$
9
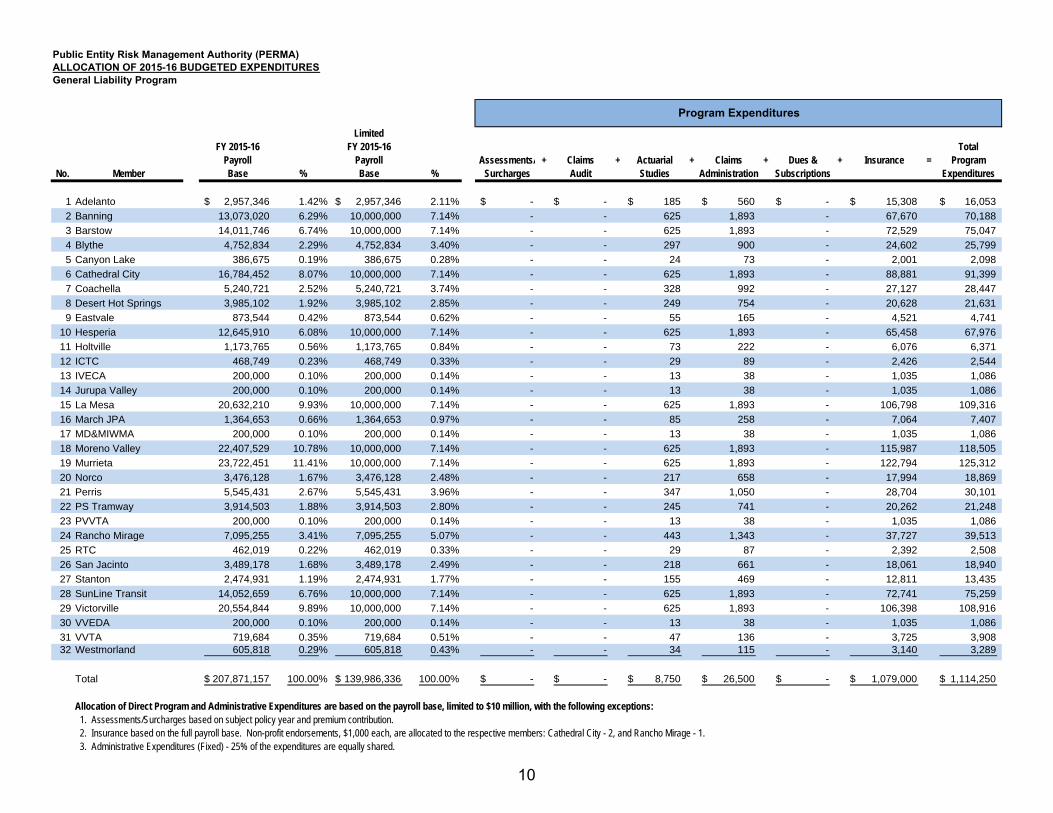
Public Entity Risk Management Authority (PERMA)ALLOCATION OF 2015-16 BUDGETED EXPENDITURESGeneral Liability Program
LimitedFY 2015-16 FY 2015-16 Total
Payroll Payroll Assessments/ + Claims + Actuarial + Claims + Dues & + Insurance = ProgramNo. Member Base % Base % Surcharges Audit Studies Administration Subscriptions Expenditures
1 Adelanto 2,957,346$ 1.42% 2,957,346$ 2.11% -$ -$ 185$ 560$ -$ 15,308$ 16,053$
2 Banning 13,073,020 6.29% 10,000,000 7.14% - - 625 1,893 - 67,670 70,188
3 Barstow 14,011,746 6.74% 10,000,000 7.14% - - 625 1,893 - 72,529 75,047
4 Blythe 4,752,834 2.29% 4,752,834 3.40% - - 297 900 - 24,602 25,799
5 Canyon Lake 386,675 0.19% 386,675 0.28% - - 24 73 - 2,001 2,098
6 Cathedral City 16,784,452 8.07% 10,000,000 7.14% - - 625 1,893 - 88,881 91,399
7 Coachella 5,240,721 2.52% 5,240,721 3.74% - - 328 992 - 27,127 28,447
8 Desert Hot Springs 3,985,102 1.92% 3,985,102 2.85% - - 249 754 - 20,628 21,631
9 Eastvale 873,544 0.42% 873,544 0.62% - - 55 165 - 4,521 4,741
10 Hesperia 12,645,910 6.08% 10,000,000 7.14% - - 625 1,893 - 65,458 67,976
11 Holtville 1,173,765 0.56% 1,173,765 0.84% - - 73 222 - 6,076 6,371
12 ICTC 468,749 0.23% 468,749 0.33% - - 29 89 - 2,426 2,544
13 IVECA 200,000 0.10% 200,000 0.14% - - 13 38 - 1,035 1,086
14 Jurupa Valley 200,000 0.10% 200,000 0.14% - - 13 38 - 1,035 1,086
15 La Mesa 20,632,210 9.93% 10,000,000 7.14% - - 625 1,893 - 106,798 109,316
16 March JPA 1,364,653 0.66% 1,364,653 0.97% - - 85 258 - 7,064 7,407
17 MD&MIWMA 200,000 0.10% 200,000 0.14% - - 13 38 - 1,035 1,086
18 Moreno Valley 22,407,529 10.78% 10,000,000 7.14% - - 625 1,893 - 115,987 118,505
19 Murrieta 23,722,451 11.41% 10,000,000 7.14% - - 625 1,893 - 122,794 125,312
20 Norco 3,476,128 1.67% 3,476,128 2.48% - - 217 658 - 17,994 18,869
21 Perris 5,545,431 2.67% 5,545,431 3.96% - - 347 1,050 - 28,704 30,101
22 PS Tramway 3,914,503 1.88% 3,914,503 2.80% - - 245 741 - 20,262 21,248
23 PVVTA 200,000 0.10% 200,000 0.14% - - 13 38 - 1,035 1,086
24 Rancho Mirage 7,095,255 3.41% 7,095,255 5.07% - - 443 1,343 - 37,727 39,513
25 RTC 462,019 0.22% 462,019 0.33% - - 29 87 - 2,392 2,508
26 San Jacinto 3,489,178 1.68% 3,489,178 2.49% - - 218 661 - 18,061 18,940
27 Stanton 2,474,931 1.19% 2,474,931 1.77% - - 155 469 - 12,811 13,435
28 SunLine Transit 14,052,659 6.76% 10,000,000 7.14% - - 625 1,893 - 72,741 75,259
29 Victorville 20,554,844 9.89% 10,000,000 7.14% - - 625 1,893 - 106,398 108,916
30 VVEDA 200,000 0.10% 200,000 0.14% - - 13 38 - 1,035 1,086
31 VVTA 719,684 0.35% 719,684 0.51% - - 47 136 - 3,725 3,908 32 Westmorland 605,818 0.29% 605,818 0.43% - - 34 115 - 3,140 3,289
Total 207,871,157$ 100.00% 139,986,336$ 100.00% -$ -$ 8,750$ 26,500$ -$ 1,079,000$ 1,114,250$
Allocation of Direct Program and Administrative Expenditures are based on the payroll base, limited to $10 million, with the following exceptions: 1. Assessments/Surcharges based on subject policy year and premium contribution. 2. Insurance based on the full payroll base. Non-profit endorsements, $1,000 each, are allocated to the respective members: Cathedral City - 2, and Rancho Mirage - 1. 3. Administrative Expenditures (Fixed) - 25% of the expenditures are equally shared.
Program Expenditures
10
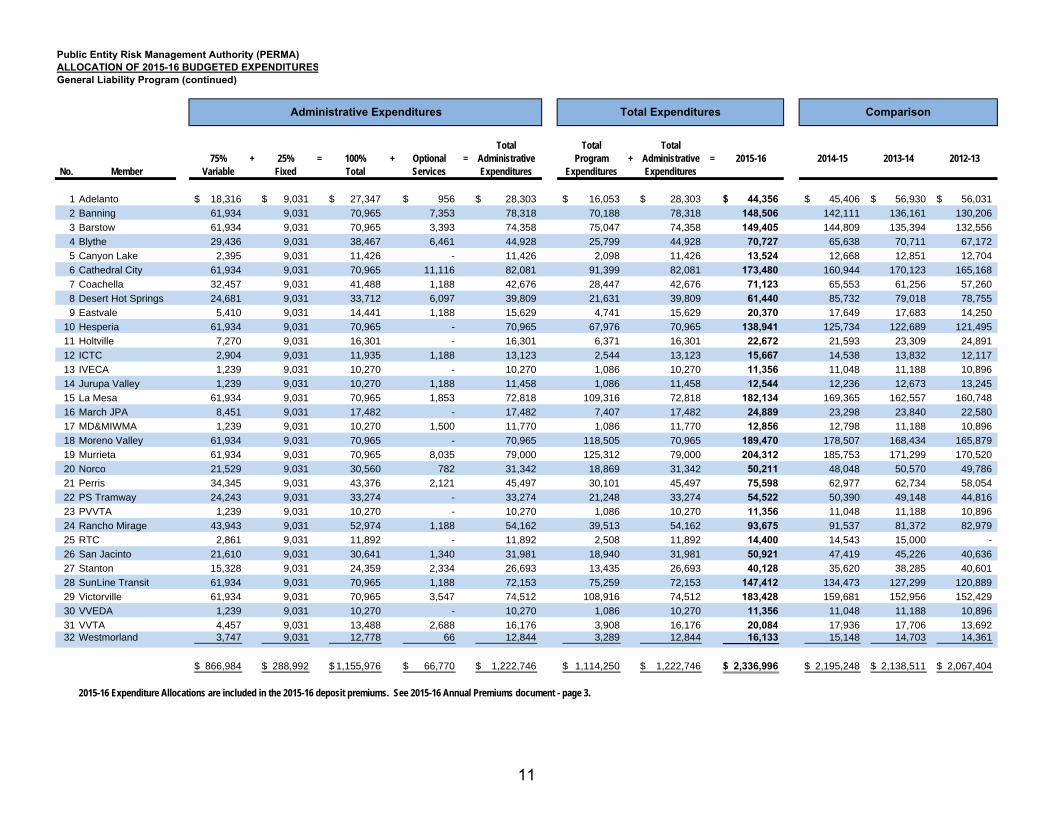
Public Entity Risk Management Authority (PERMA)ALLOCATION OF 2015-16 BUDGETED EXPENDITURESGeneral Liability Program (continued)
Total Total Total75% + 25% = 100% + Optional = Administrative Program + Administrative = 2015-16 2014-15 2013-14 2012-13
No. Member Variable Fixed Total Services Expenditures Expenditures Expenditures
1 Adelanto 18,316$ 9,031$ 27,347$ 956$ 28,303$ 16,053$ 28,303$ 44,356$ 45,406$ 56,930$ 56,031$
2 Banning 61,934 9,031 70,965 7,353 78,318 70,188 78,318 148,506 142,111 136,161 130,206
3 Barstow 61,934 9,031 70,965 3,393 74,358 75,047 74,358 149,405 144,809 135,394 132,556
4 Blythe 29,436 9,031 38,467 6,461 44,928 25,799 44,928 70,727 65,638 70,711 67,172
5 Canyon Lake 2,395 9,031 11,426 - 11,426 2,098 11,426 13,524 12,668 12,851 12,704
6 Cathedral City 61,934 9,031 70,965 11,116 82,081 91,399 82,081 173,480 160,944 170,123 165,168
7 Coachella 32,457 9,031 41,488 1,188 42,676 28,447 42,676 71,123 65,553 61,256 57,260
8 Desert Hot Springs 24,681 9,031 33,712 6,097 39,809 21,631 39,809 61,440 85,732 79,018 78,755
9 Eastvale 5,410 9,031 14,441 1,188 15,629 4,741 15,629 20,370 17,649 17,683 14,250
10 Hesperia 61,934 9,031 70,965 - 70,965 67,976 70,965 138,941 125,734 122,689 121,495
11 Holtville 7,270 9,031 16,301 - 16,301 6,371 16,301 22,672 21,593 23,309 24,891
12 ICTC 2,904 9,031 11,935 1,188 13,123 2,544 13,123 15,667 14,538 13,832 12,117
13 IVECA 1,239 9,031 10,270 - 10,270 1,086 10,270 11,356 11,048 11,188 10,896
14 Jurupa Valley 1,239 9,031 10,270 1,188 11,458 1,086 11,458 12,544 12,236 12,673 13,245
15 La Mesa 61,934 9,031 70,965 1,853 72,818 109,316 72,818 182,134 169,365 162,557 160,748
16 March JPA 8,451 9,031 17,482 - 17,482 7,407 17,482 24,889 23,298 23,840 22,580
17 MD&MIWMA 1,239 9,031 10,270 1,500 11,770 1,086 11,770 12,856 12,798 11,188 10,896
18 Moreno Valley 61,934 9,031 70,965 - 70,965 118,505 70,965 189,470 178,507 168,434 165,879
19 Murrieta 61,934 9,031 70,965 8,035 79,000 125,312 79,000 204,312 185,753 171,299 170,520
20 Norco 21,529 9,031 30,560 782 31,342 18,869 31,342 50,211 48,048 50,570 49,786
21 Perris 34,345 9,031 43,376 2,121 45,497 30,101 45,497 75,598 62,977 62,734 58,054
22 PS Tramway 24,243 9,031 33,274 - 33,274 21,248 33,274 54,522 50,390 49,148 44,816
23 PVVTA 1,239 9,031 10,270 - 10,270 1,086 10,270 11,356 11,048 11,188 10,896
24 Rancho Mirage 43,943 9,031 52,974 1,188 54,162 39,513 54,162 93,675 91,537 81,372 82,979
25 RTC 2,861 9,031 11,892 - 11,892 2,508 11,892 14,400 14,543 15,000 -
26 San Jacinto 21,610 9,031 30,641 1,340 31,981 18,940 31,981 50,921 47,419 45,226 40,636
27 Stanton 15,328 9,031 24,359 2,334 26,693 13,435 26,693 40,128 35,620 38,285 40,601
28 SunLine Transit 61,934 9,031 70,965 1,188 72,153 75,259 72,153 147,412 134,473 127,299 120,889
29 Victorville 61,934 9,031 70,965 3,547 74,512 108,916 74,512 183,428 159,681 152,956 152,429
30 VVEDA 1,239 9,031 10,270 - 10,270 1,086 10,270 11,356 11,048 11,188 10,896
31 VVTA 4,457 9,031 13,488 2,688 16,176 3,908 16,176 20,084 17,936 17,706 13,692 32 Westmorland 3,747 9,031 12,778 66 12,844 3,289 12,844 16,133 15,148 14,703 14,361
866,984$ 288,992$ 1,155,976$ 66,770$ 1,222,746$ 1,114,250$ 1,222,746$ 2,336,996$ 2,195,248$ 2,138,511$ 2,067,404$
2015-16 Expenditure Allocations are included in the 2015-16 deposit premiums. See 2015-16 Annual Premiums document - page 3.
ComparisonTotal ExpendituresAdministrative Expenditures
11
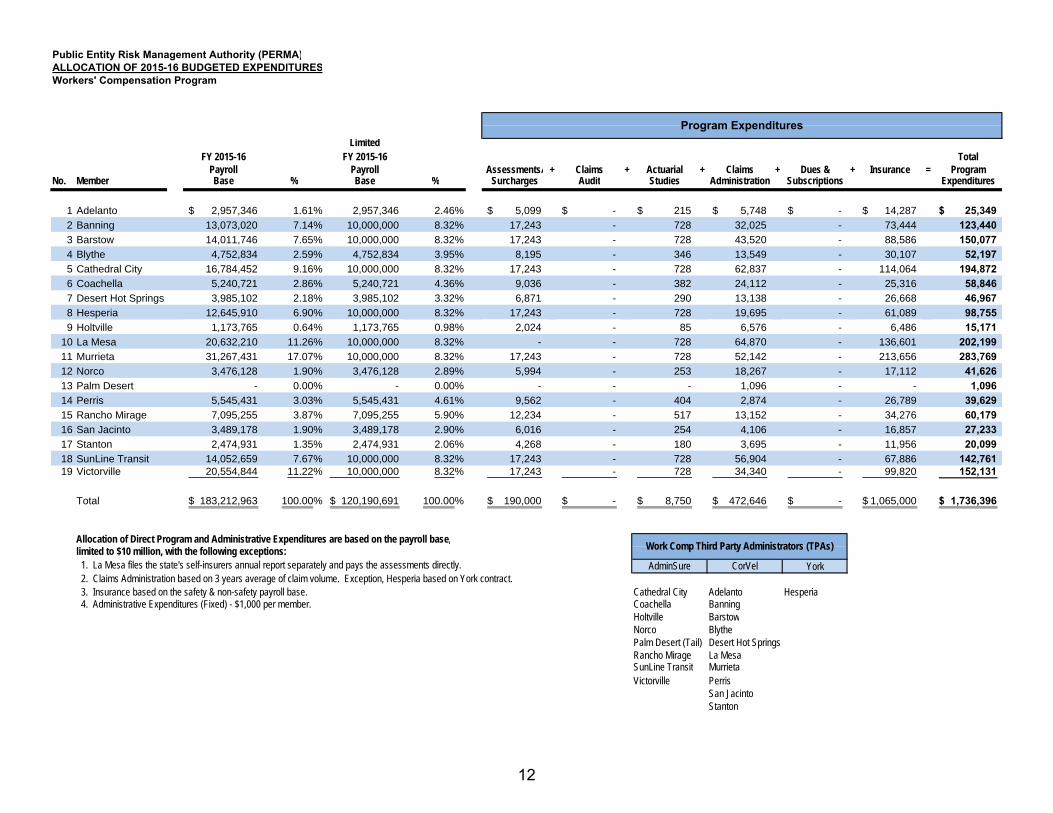
Public Entity Risk Management Authority (PERMA)ALLOCATION OF 2015-16 BUDGETED EXPENDITURESWorkers' Compensation Program
LimitedFY 2015-16 FY 2015-16 Total
Payroll Payroll Assessments/ + Claims + Actuarial + Claims + Dues & + Insurance = ProgramNo. Member Base % Base % Surcharges Audit Studies Administration Subscriptions Expenditures
1 Adelanto 2,957,346$ 1.61% 2,957,346 2.46% 5,099$ -$ 215$ 5,748$ -$ 14,287$ 25,349$ 2 Banning 13,073,020 7.14% 10,000,000 8.32% 17,243 - 728 32,025 - 73,444 123,440 3 Barstow 14,011,746 7.65% 10,000,000 8.32% 17,243 - 728 43,520 - 88,586 150,077 4 Blythe 4,752,834 2.59% 4,752,834 3.95% 8,195 - 346 13,549 - 30,107 52,197 5 Cathedral City 16,784,452 9.16% 10,000,000 8.32% 17,243 - 728 62,837 - 114,064 194,872 6 Coachella 5,240,721 2.86% 5,240,721 4.36% 9,036 - 382 24,112 - 25,316 58,846 7 Desert Hot Springs 3,985,102 2.18% 3,985,102 3.32% 6,871 - 290 13,138 - 26,668 46,967 8 Hesperia 12,645,910 6.90% 10,000,000 8.32% 17,243 - 728 19,695 - 61,089 98,755 9 Holtville 1,173,765 0.64% 1,173,765 0.98% 2,024 - 85 6,576 - 6,486 15,171
10 La Mesa 20,632,210 11.26% 10,000,000 8.32% - - 728 64,870 - 136,601 202,199 11 Murrieta 31,267,431 17.07% 10,000,000 8.32% 17,243 - 728 52,142 - 213,656 283,769 12 Norco 3,476,128 1.90% 3,476,128 2.89% 5,994 - 253 18,267 - 17,112 41,626 13 Palm Desert - 0.00% - 0.00% - - - 1,096 - - 1,096 14 Perris 5,545,431 3.03% 5,545,431 4.61% 9,562 - 404 2,874 - 26,789 39,629 15 Rancho Mirage 7,095,255 3.87% 7,095,255 5.90% 12,234 - 517 13,152 - 34,276 60,179 16 San Jacinto 3,489,178 1.90% 3,489,178 2.90% 6,016 - 254 4,106 - 16,857 27,233 17 Stanton 2,474,931 1.35% 2,474,931 2.06% 4,268 - 180 3,695 - 11,956 20,099 18 SunLine Transit 14,052,659 7.67% 10,000,000 8.32% 17,243 - 728 56,904 - 67,886 142,761 19 Victorville 20,554,844 11.22% 10,000,000 8.32% 17,243 - 728 34,340 - 99,820 152,131
Total 183,212,963$ 100.00% 120,190,691$ 100.00% 190,000$ -$ 8,750$ 472,646$ -$ 1,065,000$ 1,736,396$
Allocation of Direct Program and Administrative Expenditures are based on the payroll base,limited to $10 million, with the following exceptions: 1. La Mesa files the state's self-insurers annual report separately and pays the assessments directly. York 2. Claims Administration based on 3 years average of claim volume. Exception, Hesperia based on York contract. 3. Insurance based on the safety & non-safety payroll base. Cathedral City Adelanto Hesperia 4. Administrative Expenditures (Fixed) - $1,000 per member. Coachella Banning
Holtville BarstowNorco BlythePalm Desert (Tail) Desert Hot SpringsRancho Mirage La MesaSunLine Transit MurrietaVictorville Perris
San JacintoStanton
CorVelAdminSure
Program Expenditures
Work Comp Third Party Administrators (TPAs)
12
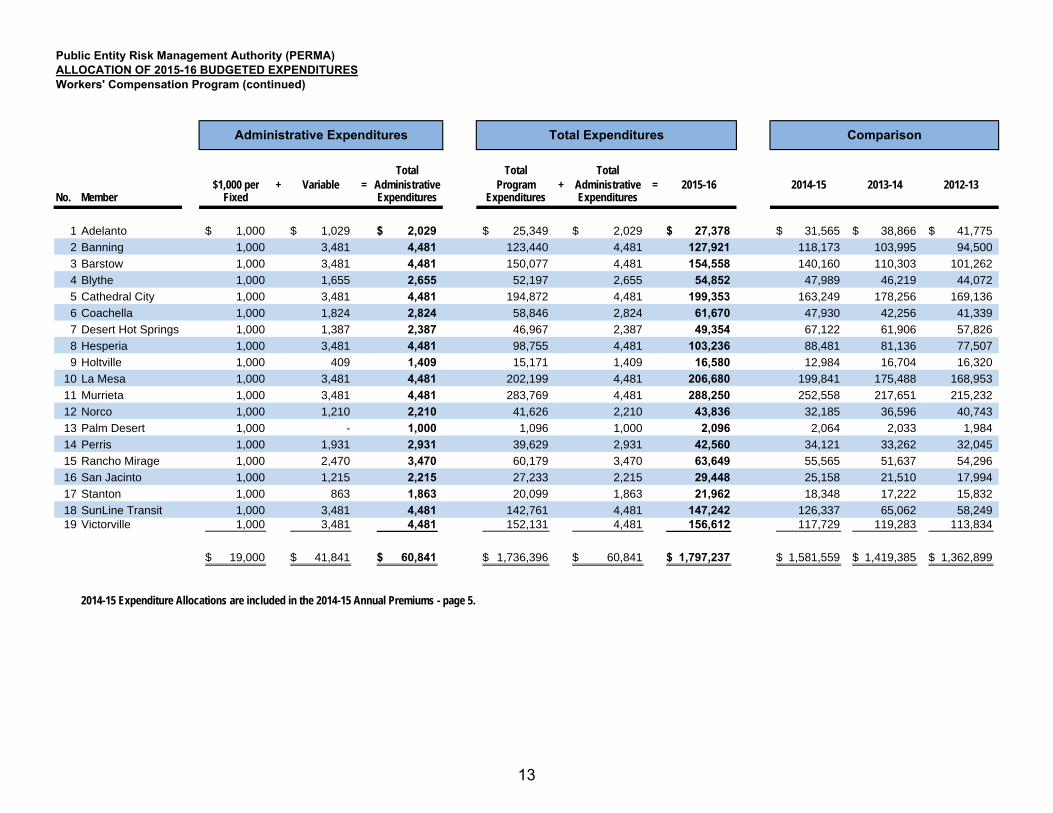
Public Entity Risk Management Authority (PERMA)ALLOCATION OF 2015-16 BUDGETED EXPENDITURESWorkers' Compensation Program (continued)
Total Total Total$1,000 per + Variable = Administrative Program + Administrative = 2015-16 2014-15 2013-14 2012-13
No. Member Fixed Expenditures Expenditures Expenditures
1 Adelanto 1,000$ 1,029$ 2,029$ 25,349$ 2,029$ 27,378$ 31,565$ 38,866$ 41,775$
2 Banning 1,000 3,481 4,481 123,440 4,481 127,921 118,173 103,995 94,500
3 Barstow 1,000 3,481 4,481 150,077 4,481 154,558 140,160 110,303 101,262
4 Blythe 1,000 1,655 2,655 52,197 2,655 54,852 47,989 46,219 44,072
5 Cathedral City 1,000 3,481 4,481 194,872 4,481 199,353 163,249 178,256 169,136
6 Coachella 1,000 1,824 2,824 58,846 2,824 61,670 47,930 42,256 41,339
7 Desert Hot Springs 1,000 1,387 2,387 46,967 2,387 49,354 67,122 61,906 57,826
8 Hesperia 1,000 3,481 4,481 98,755 4,481 103,236 88,481 81,136 77,507
9 Holtville 1,000 409 1,409 15,171 1,409 16,580 12,984 16,704 16,320
10 La Mesa 1,000 3,481 4,481 202,199 4,481 206,680 199,841 175,488 168,953
11 Murrieta 1,000 3,481 4,481 283,769 4,481 288,250 252,558 217,651 215,232
12 Norco 1,000 1,210 2,210 41,626 2,210 43,836 32,185 36,596 40,743
13 Palm Desert 1,000 - 1,000 1,096 1,000 2,096 2,064 2,033 1,984
14 Perris 1,000 1,931 2,931 39,629 2,931 42,560 34,121 33,262 32,045
15 Rancho Mirage 1,000 2,470 3,470 60,179 3,470 63,649 55,565 51,637 54,296
16 San Jacinto 1,000 1,215 2,215 27,233 2,215 29,448 25,158 21,510 17,994
17 Stanton 1,000 863 1,863 20,099 1,863 21,962 18,348 17,222 15,832
18 SunLine Transit 1,000 3,481 4,481 142,761 4,481 147,242 126,337 65,062 58,249 19 Victorville 1,000 3,481 4,481 152,131 4,481 156,612 117,729 119,283 113,834
19,000$ 41,841$ 60,841$ 1,736,396$ 60,841$ 1,797,237$ 1,581,559$ 1,419,385$ 1,362,899$
2014-15 Expenditure Allocations are included in the 2014-15 Annual Premiums - page 5.
ComparisonTotal ExpendituresAdministrative Expenditures
13

(This page intentionally left blank to facilitate double-sided printing)