Embed Size (px)
Citation preview
PUBLIC OPINION and POLITICAL
ACTION
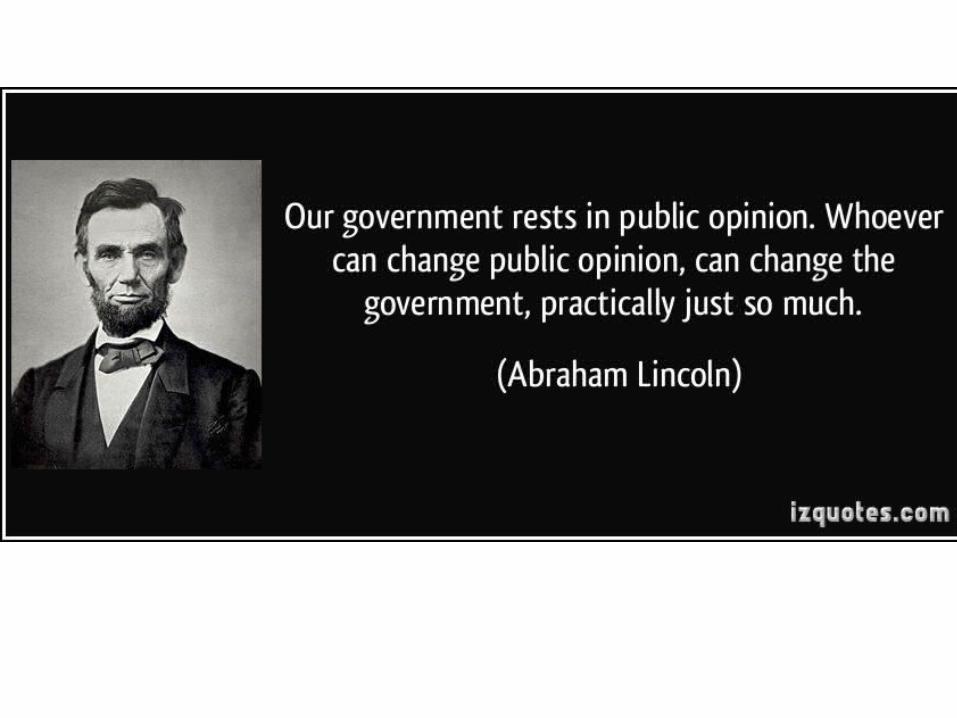
PUBLIC OPINION
• The distribution of the population’s beliefs about politics and political issues
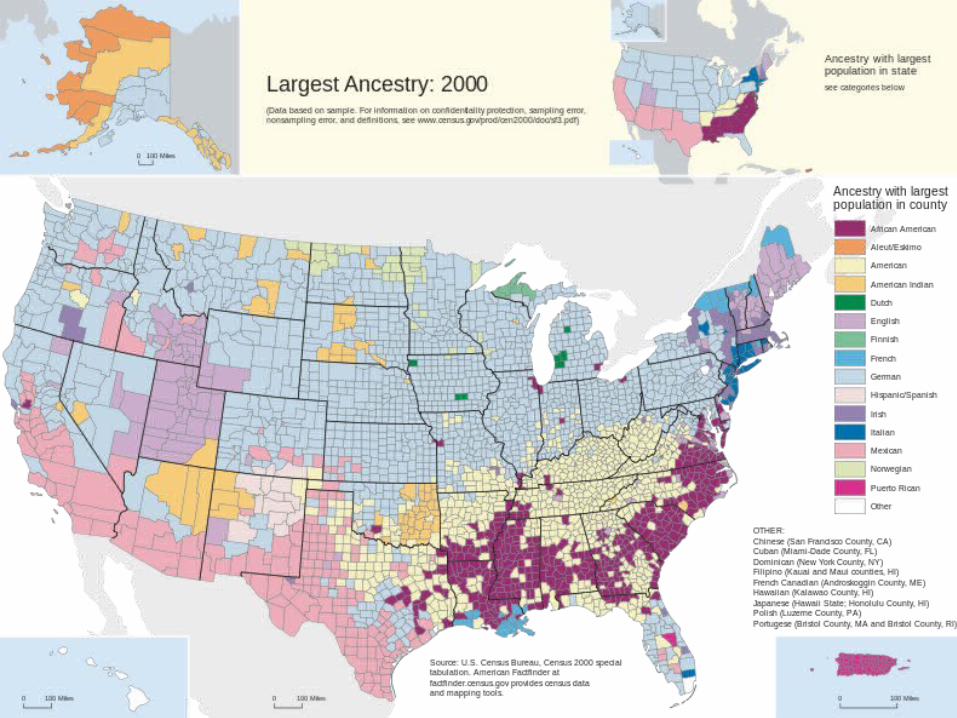
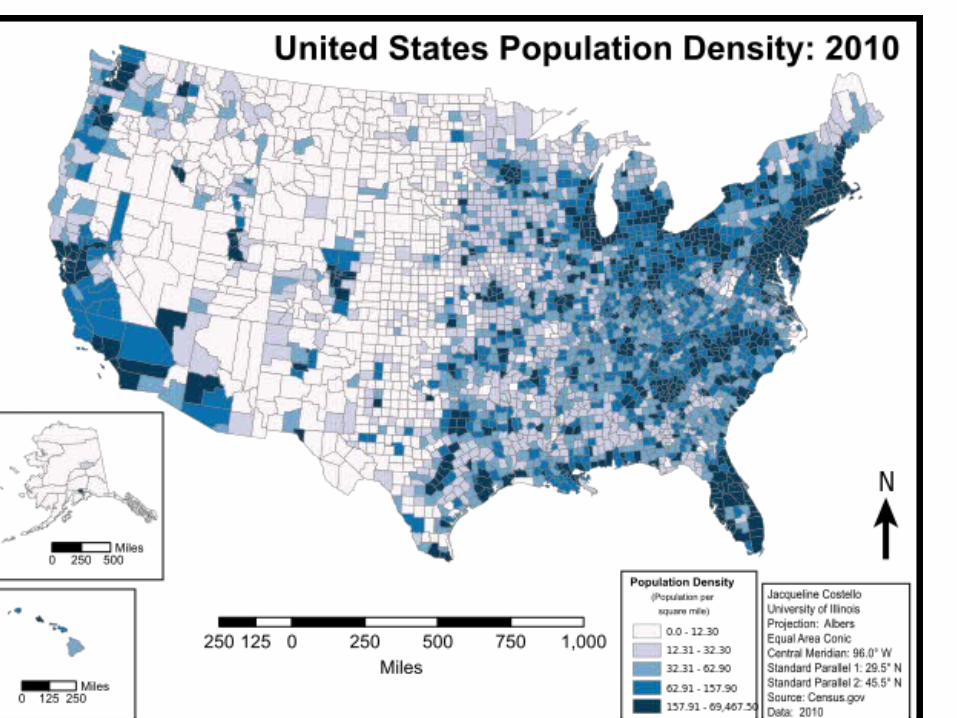
DEMOGRAPHY
• The study of human populations and population changes
• Census as primary tool
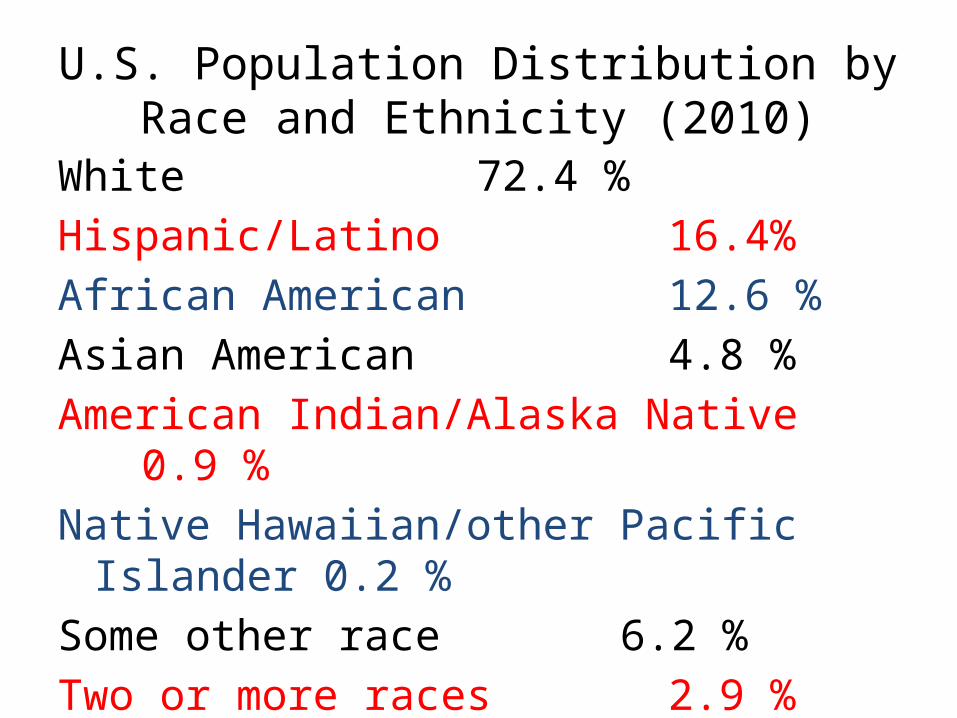
U.S. Population Distribution by Race and Ethnicity (2010)
White 72.4 % Hispanic/Latino 16.4%African American 12.6 % Asian American 4.8 % American Indian/Alaska Native 0.9 % Native Hawaiian/other Pacific Islander 0.2 % Some other race 6.2 % Two or more races 2.9 %
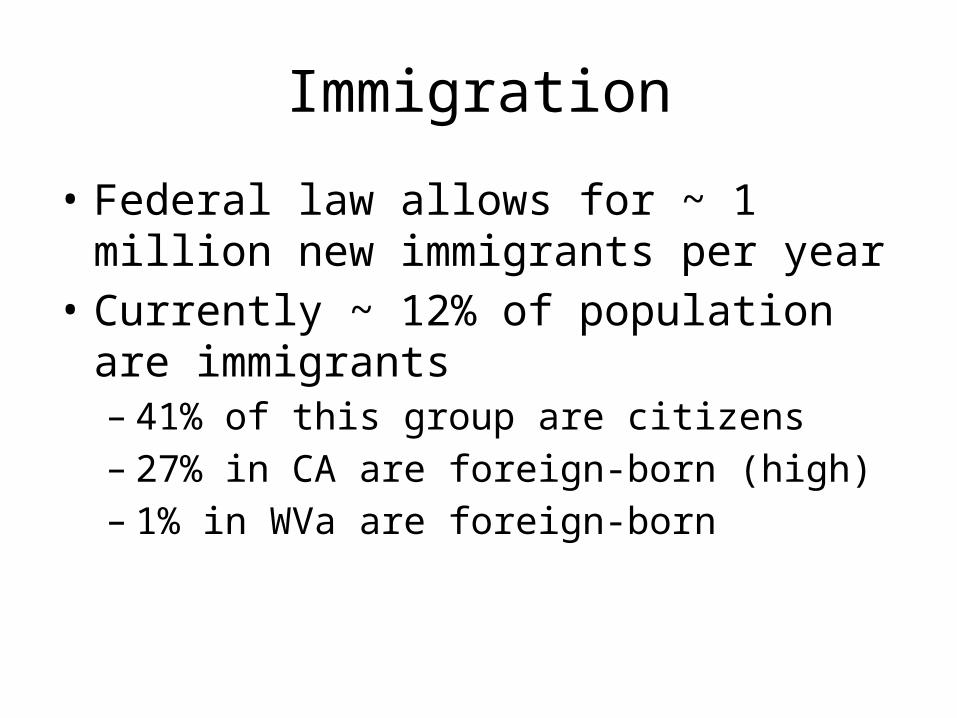
Immigration
• Federal law allows for ~ 1 million new immigrants per year
• Currently ~ 12% of population are immigrants– 41% of this group are citizens– 27% in CA are foreign-born (high)– 1% in WVa are foreign-born

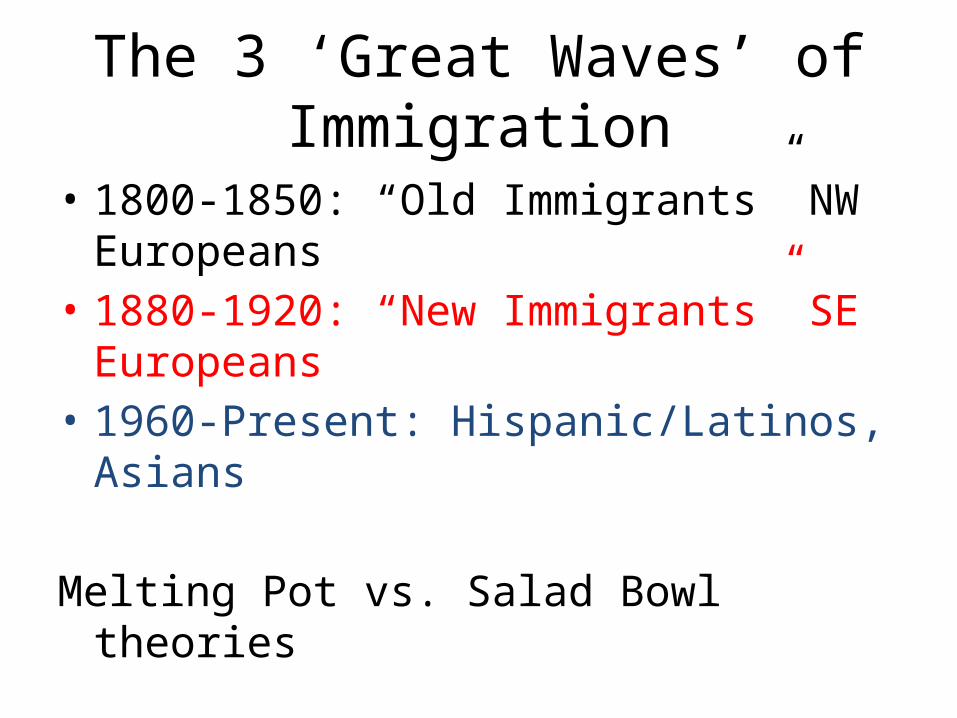
The 3 ‘Great Waves’ of Immigration
• 1800-1850: “Old Immigrants” NW Europeans• 1880-1920: “New Immigrants” SE Europeans• 1960-Present: Hispanic/Latinos, Asians
Melting Pot vs. Salad Bowl theories

Minority Majority
• 2008: Non-Hispanic white Americans = 66%
Political Culture
• An overall set of values widely shared throughout a society
• e.g. Equality
Other Demographic Changes
• Geographic population shift > political changes– Reapportionment
• “Graying of America”
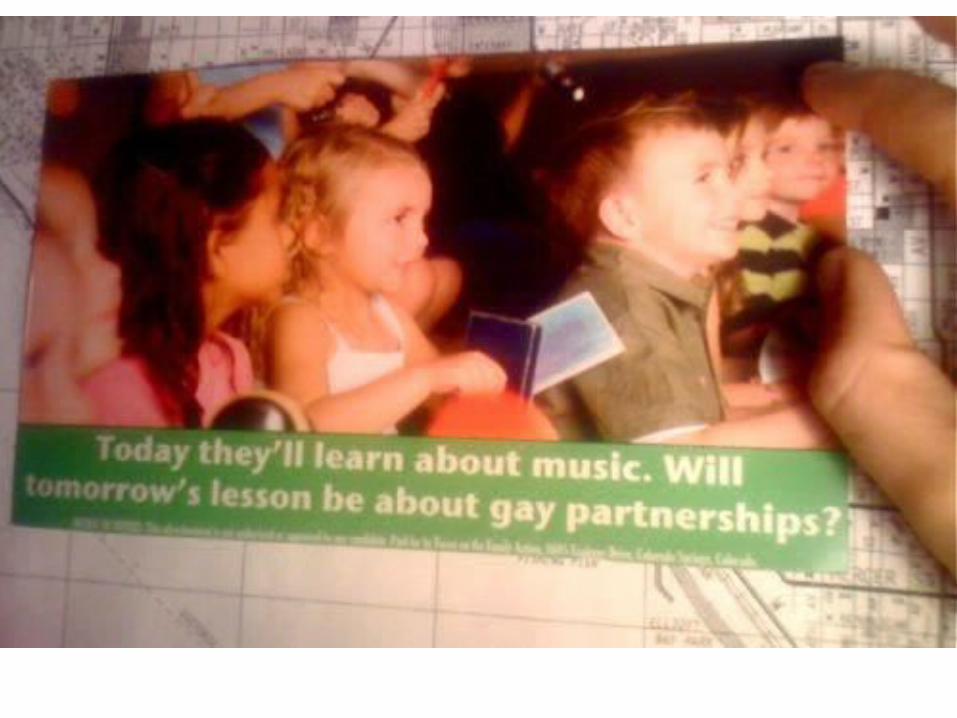
Political Socialization
• Process through which an individual acquires their particular political orientations (knowledge, feelings, and evaluations)– Family– Mass Media– School
Measuring Public Opinion
• Public Opinion Polling first developed by George Gallup
• Sample: relatively small proportion to represent the whole– 1,000 to 1,500 can accurately represent the whole– Random Sampling key: everyone should have
equal probability of being chosen; sample should be roughly equal to demography

Poll Legitimacy
• Level of confidence = Sampling Error• Typical SE = +/- 3%– This means that 95% of the time the results are
within 3% of what the entire population thinks/feels.

Sampling Techniques
• Random-Digit dialing: to reach listed, unlisted• ~2% of population doesn’t have phones• People less willing to participate over the
phone• 2010: 1 in 4 households had cell phones only• [federal law prohibits use of automated dialers
for cell numbers – so these must be done ‘by hand’]

Exit Polls
• Voting places selected at random• Workers ask every 10th person how they voted• Used to project electoral winners
Criticism of Polls
• Sample size• Sample constituency• Wording of questions
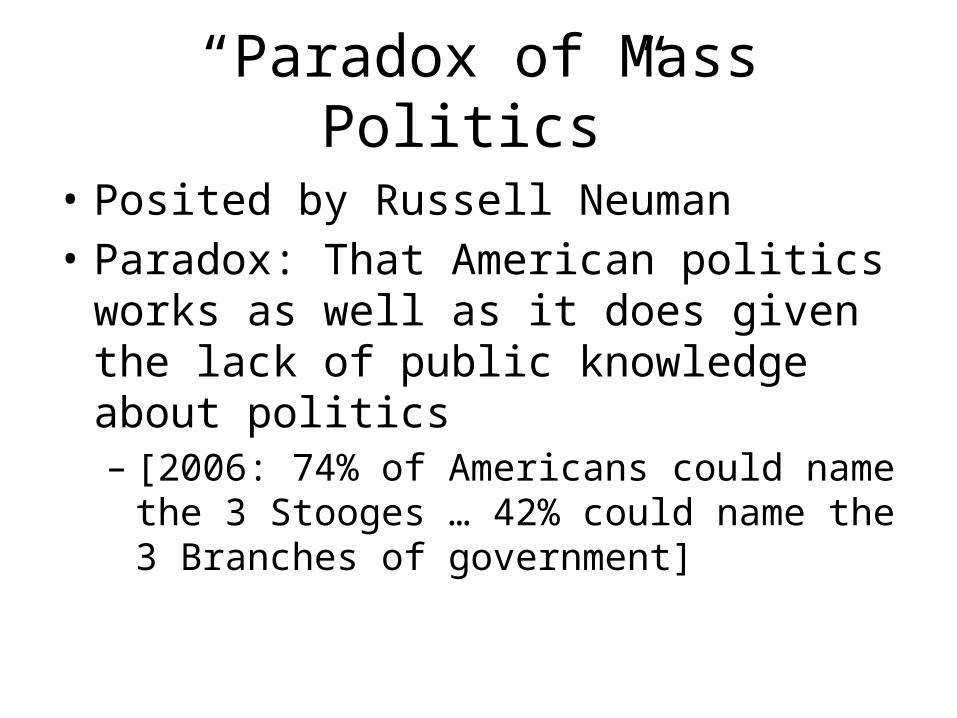
“Paradox of Mass Politics”
• Posited by Russell Neuman• Paradox: That American politics works as well
as it does given the lack of public knowledge about politics– [2006: 74% of Americans could name the 3
Stooges … 42% could name the 3 Branches of government]
Decline in Trust in Government
• Beginning in the late 1960s, the public’s trust in government has fallen
• Vietnam, Watergate, Economic crisis of 1970s, Iran hostage crisis, Hurricane Katrina
• Greatest impact of this loss of trust is upon social welfare programs …
“People need to trust the government when they pay the costs but do not receive the benefits, which is exactly what antipoverty and race-targeted programs require of most
Americans”
•Mark Hetherington
• Declining trust in government has led to increasing belief that government solutions to social problems are wasteful and impractical, thereby draining public support for them– E.g. Health Care Reform
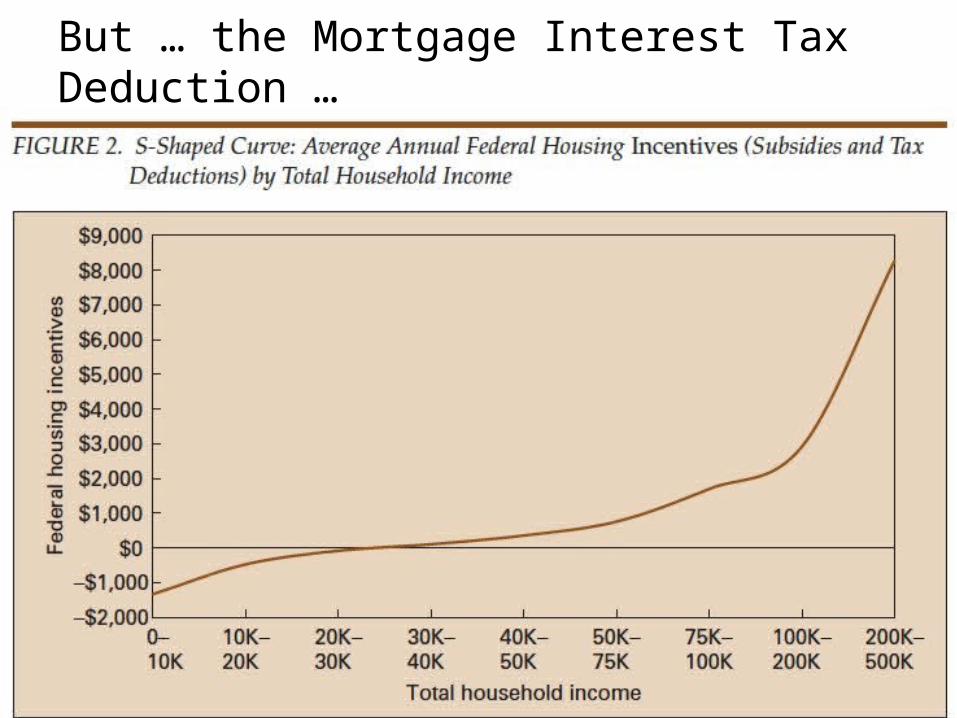
But … the Mortgage Interest Tax Deduction …
Or …
• 83 percent of stocks are owned by one percent of the population.
• Sales taxes, which disproportionately hit low-income families, are in force across the nation. Taxes on financial transactions, which would disproportionately affect the rich, barely exist.
• This tax would raise $14.4 billion a year, enough to handle New York’s fiscal deficit, with $4.4 billion leftover.
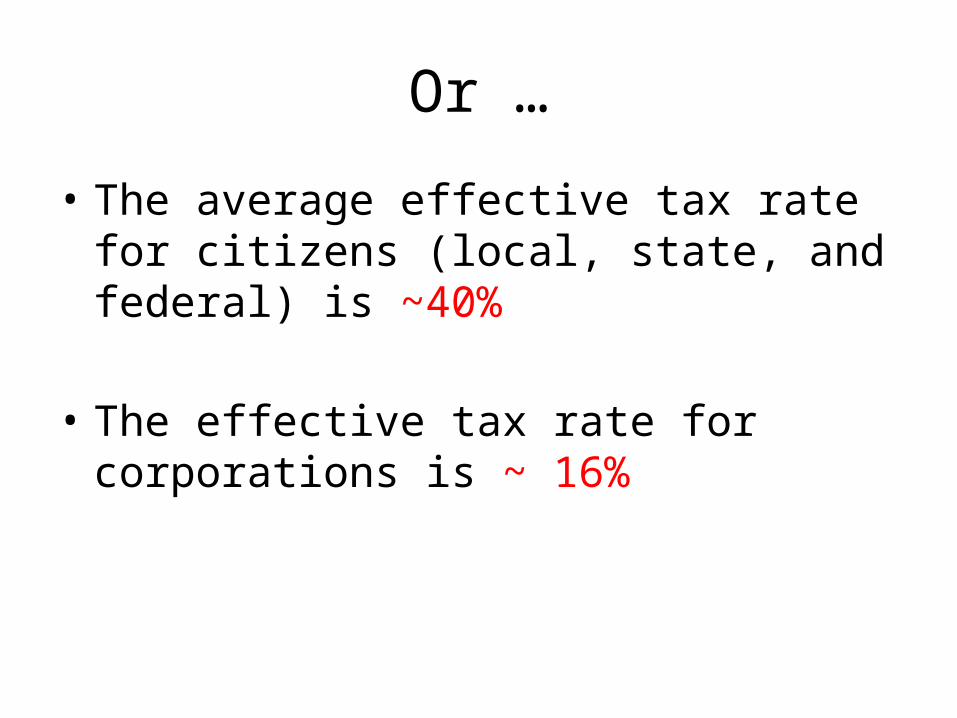
Or …
• The average effective tax rate for citizens (local, state, and federal) is ~40%
• The effective tax rate for corporations is ~ 16%
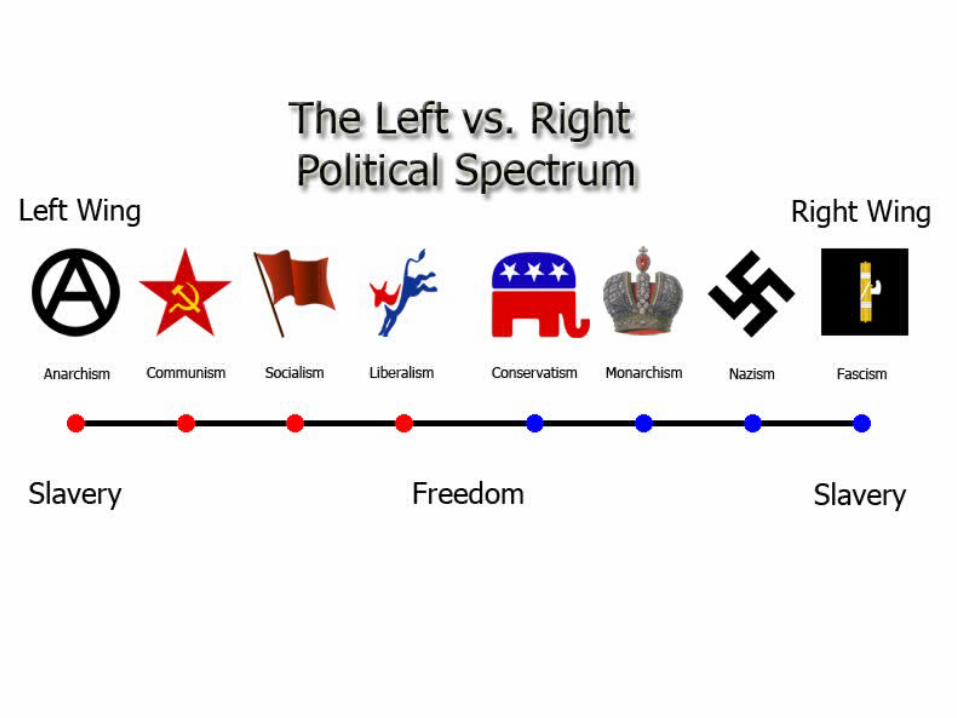
Political Ideology
• A coherent set of beliefs about politics, public policy, and public purpose … which helps give meaning to political events
Liberals vs. Conservatives
As A General Rule, How Do they Feel About …
• Change?• Role of Government?• Equality?• Economics?• Social Policy?
Political Participation
• Conventional:– Voting– Working to persuade others– Running for office/working in campaigns
• Unconventional:– Protest– Civil Disobedience– Violence