Embed Size (px)
Citation preview
Protocol for Quantitative Determination of Residual Solvents in Cannabis Concentrates
Prepared by: Amanda Rigdon, May 23rd, 2016
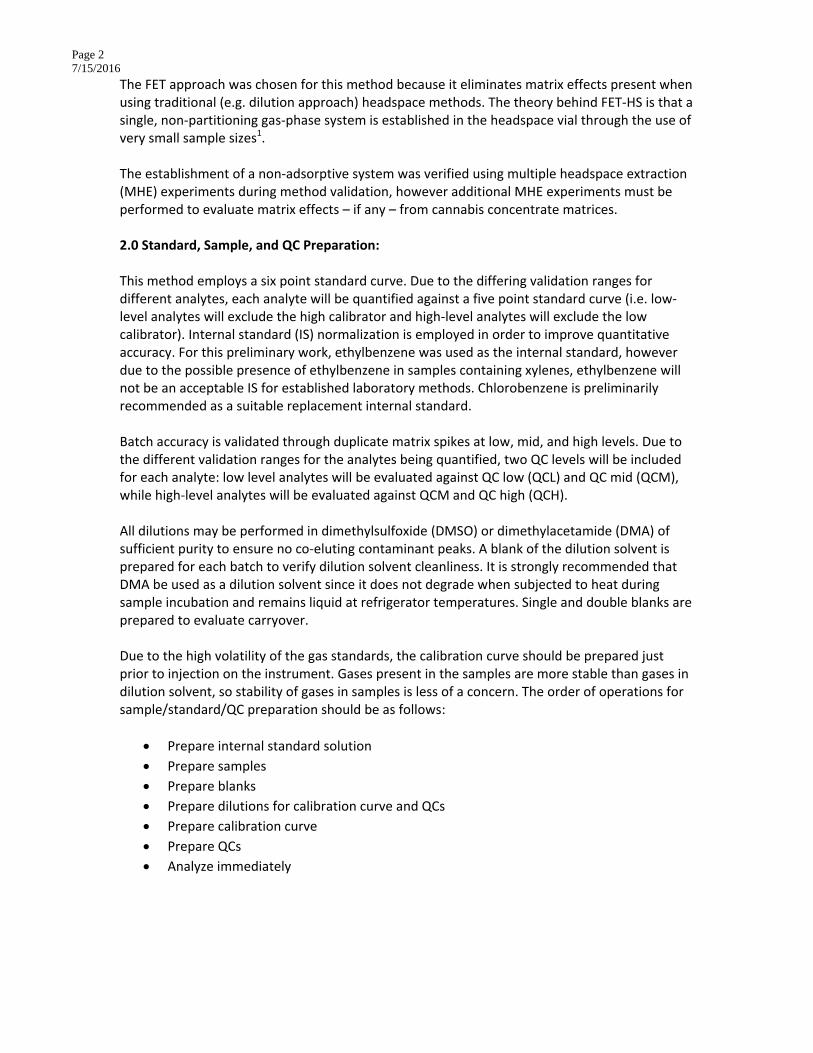
1.0 Method background: This method employs full evaporation technique‐headspace analysis (FET‐HS) combined with GC‐MS to determine levels of residual solvents in cannabis concentrates. This method has undergone a partial validation, including precision/accuracy, lower limit of detection (LLOD)/ lower limit of quantification (LLOQ), repeatability, limited stability, and matrix effects. Inter‐day/batch and ruggedness/robustness validation was not performed. Although a partial validation was performed on this method, this partial validation shall in no way affect the need for in‐house validation when implementing this method. This method was validated for the following levels of the following residual solvents:
Differing ranges were chosen for different analytes based on the dynamic range of the MS analyzer as well as expected/acceptable levels of each solvent. Solvents with higher toxicological significance are quantified in a lower concentration range and vice‐versa. The USP Class 1 and 2 residual solvents included in this list have been validated for quantification at or below the PDE for these solvents (assuming a 2g/day dose) as listed in the current version of USP <467> (USP 38 NF 33). FID detection may be employed for residual solvents analysis, however this method has not been validated using FID detection.
Compound LLOQ ULOQ
Propane 12.5 175
Isobutane 16.25 227.5
Butane 17.5 245
Methanol 25 500
Pentane 25 500
Ethanol 25 500
Acetone 25 500
Isopropanol 25 500
Hexane 25 500
Chloroform 0.5 250
Benzene 0.5 250
Heptane 25 500
Toluene 0.5 250
m/p‐xylene (sum of isomers) 0.5 250
o‐xylene 0.5 250
Page 2 7/15/2016
The FET approach was chosen for this method because it eliminates matrix effects present when using traditional (e.g. dilution approach) headspace methods. The theory behind FET‐HS is that a single, non‐partitioning gas‐phase system is established in the headspace vial through the use of very small sample sizes1. The establishment of a non‐adsorptive system was verified using multiple headspace extraction (MHE) experiments during method validation, however additional MHE experiments must be performed to evaluate matrix effects – if any – from cannabis concentrate matrices. 2.0 Standard, Sample, and QC Preparation: This method employs a six point standard curve. Due to the differing validation ranges for different analytes, each analyte will be quantified against a five point standard curve (i.e. low‐level analytes will exclude the high calibrator and high‐level analytes will exclude the low calibrator). Internal standard (IS) normalization is employed in order to improve quantitative accuracy. For this preliminary work, ethylbenzene was used as the internal standard, however due to the possible presence of ethylbenzene in samples containing xylenes, ethylbenzene will not be an acceptable IS for established laboratory methods. Chlorobenzene is preliminarily recommended as a suitable replacement internal standard. Batch accuracy is validated through duplicate matrix spikes at low, mid, and high levels. Due to the different validation ranges for the analytes being quantified, two QC levels will be included for each analyte: low level analytes will be evaluated against QC low (QCL) and QC mid (QCM), while high‐level analytes will be evaluated against QCM and QC high (QCH). All dilutions may be performed in dimethylsulfoxide (DMSO) or dimethylacetamide (DMA) of sufficient purity to ensure no co‐eluting contaminant peaks. A blank of the dilution solvent is prepared for each batch to verify dilution solvent cleanliness. It is strongly recommended that DMA be used as a dilution solvent since it does not degrade when subjected to heat during sample incubation and remains liquid at refrigerator temperatures. Single and double blanks are prepared to evaluate carryover. Due to the high volatility of the gas standards, the calibration curve should be prepared just prior to injection on the instrument. Gases present in the samples are more stable than gases in dilution solvent, so stability of gases in samples is less of a concern. The order of operations for sample/standard/QC preparation should be as follows:
Prepare internal standard solution
Prepare samples
Prepare blanks
Prepare dilutions for calibration curve and QCs
Prepare calibration curve
Prepare QCs
Analyze immediately
Page 3 7/15/2016
2.1 Internal Standard Preparation*: The stock solution for the internal standard is ethylbenzene at 1840µg/mL in DMSO (Restek cat# 36296). Prior to preparing the internal standard, allow the stock standard to thaw at room temperature. Gentle (< 40°C) warming may be employed to thaw internal standard stock solution.
‐ Deliver 920µL of dilution solvent to an autosampler vial.
‐ Deliver 80µL of the stock solution to the autosampler vial, then cap and shake to
mix.
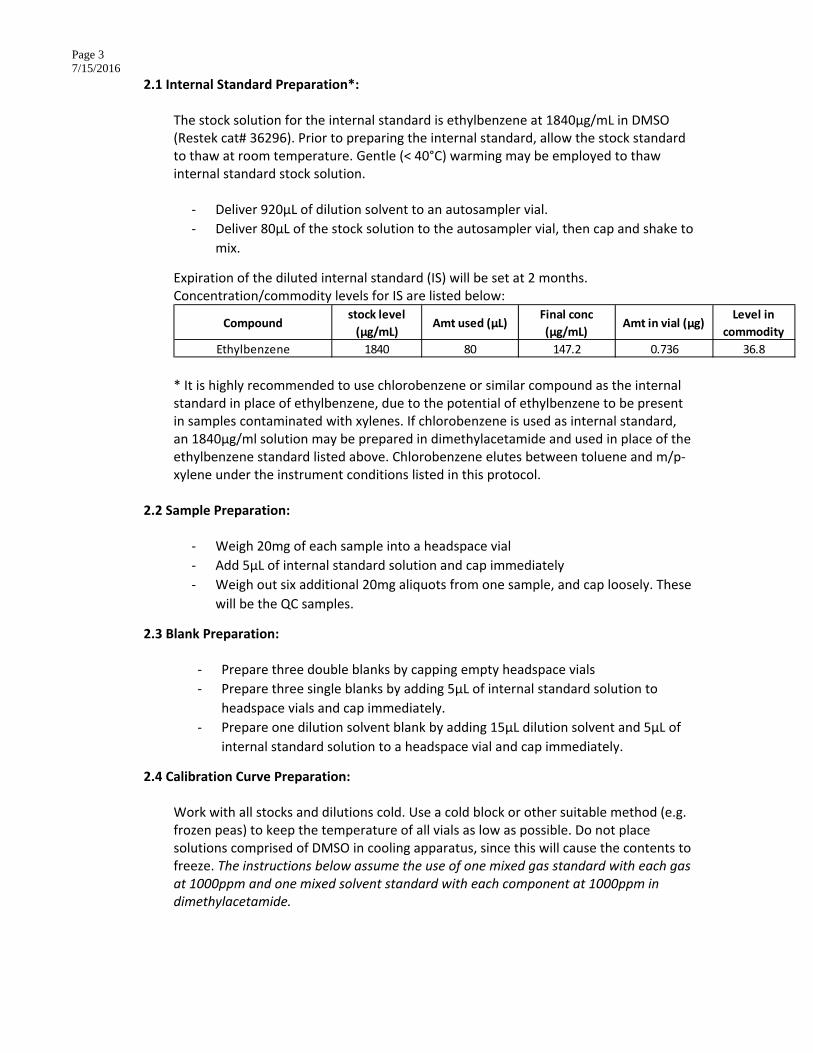
Expiration of the diluted internal standard (IS) will be set at 2 months. Concentration/commodity levels for IS are listed below:
* It is highly recommended to use chlorobenzene or similar compound as the internal standard in place of ethylbenzene, due to the potential of ethylbenzene to be present in samples contaminated with xylenes. If chlorobenzene is used as internal standard, an 1840µg/ml solution may be prepared in dimethylacetamide and used in place of the ethylbenzene standard listed above. Chlorobenzene elutes between toluene and m/p‐xylene under the instrument conditions listed in this protocol.
2.2 Sample Preparation:
‐ Weigh 20mg of each sample into a headspace vial
‐ Add 5µL of internal standard solution and cap immediately
‐ Weigh out six additional 20mg aliquots from one sample, and cap loosely. These
will be the QC samples.
2.3 Blank Preparation:
‐ Prepare three double blanks by capping empty headspace vials
‐ Prepare three single blanks by adding 5µL of internal standard solution to
headspace vials and cap immediately.
‐ Prepare one dilution solvent blank by adding 15µL dilution solvent and 5µL of
internal standard solution to a headspace vial and cap immediately.
2.4 Calibration Curve Preparation:
Work with all stocks and dilutions cold. Use a cold block or other suitable method (e.g. frozen peas) to keep the temperature of all vials as low as possible. Do not place solutions comprised of DMSO in cooling apparatus, since this will cause the contents to freeze. The instructions below assume the use of one mixed gas standard with each gas at 1000ppm and one mixed solvent standard with each component at 1000ppm in dimethylacetamide.
Compoundstock level
(µg/mL)Amt used (µL)
Final conc
(µg/mL)Amt in vial (µg)
Level in
commodity
Ethylbenzene 1840 80 147.2 0.736 36.8
Page 4 7/15/2016
‐ Stock solutions: It is highly recommended to use a separate gas stock standard
containing gases (e.g. propane ‐ butane) only, since the gases are highly
unstable. To ensure quantitative accuracy, gas stock solutions should be
considered single‐use only. Immediately after opening stock ampules, transfer
contents to empty autosampler vials using a Pasteur pipet and cap. Do not
mix stock standards.
‐ Dilution 1: Add 800µL of dilution solvent (preferably DMA) to an autosampler
vial. Add 100 µL of each stock solution. Cap and shake to mix.
‐ Dilution 2: Add 950µL of dilution solvent (preferably DMA) to an autosampler
vial. Add 50µL of Dilution 1. Cap and shake to mix.
‐ Diluton 3: Add 800µL of dilution solvent to an autosampler vial. Add 200µL of
Dilution 2.
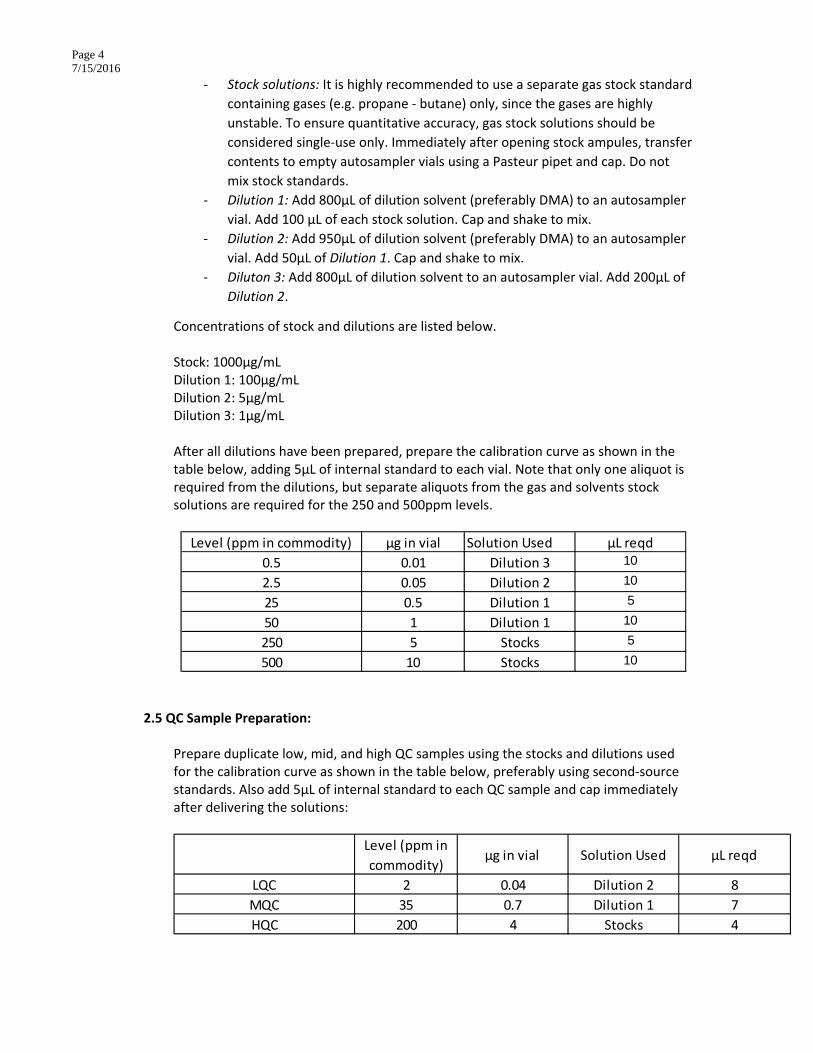
Concentrations of stock and dilutions are listed below. Stock: 1000µg/mL Dilution 1: 100µg/mL Dilution 2: 5µg/mL Dilution 3: 1µg/mL After all dilutions have been prepared, prepare the calibration curve as shown in the table below, adding 5µL of internal standard to each vial. Note that only one aliquot is required from the dilutions, but separate aliquots from the gas and solvents stock solutions are required for the 250 and 500ppm levels.
2.5 QC Sample Preparation:
Prepare duplicate low, mid, and high QC samples using the stocks and dilutions used for the calibration curve as shown in the table below, preferably using second‐source standards. Also add 5µL of internal standard to each QC sample and cap immediately after delivering the solutions:
Level (ppm in commodity) µg in vial Solution Used µL reqd
0.5 0.01 Dilution 3 10
2.5 0.05 Dilution 2 10
25 0.5 Dilution 1 5
50 1 Dilution 1 10
250 5 Stocks 5
500 10 Stocks 10
Level (ppm in
commodity)µg in vial Solution Used µL reqd
LQC 2 0.04 Dilution 2 8
MQC 35 0.7 Dilution 1 7
HQC 200 4 Stocks 4
Page 5 7/15/2016
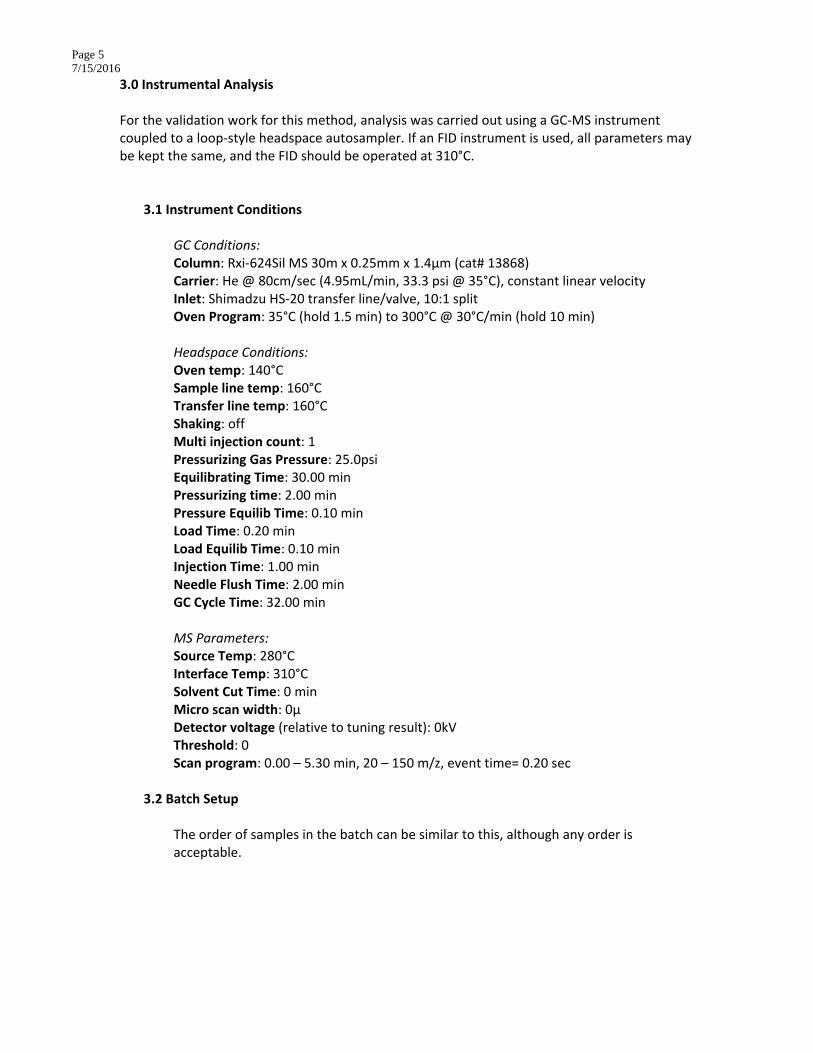
3.0 Instrumental Analysis For the validation work for this method, analysis was carried out using a GC‐MS instrument coupled to a loop‐style headspace autosampler. If an FID instrument is used, all parameters may be kept the same, and the FID should be operated at 310°C.
3.1 Instrument Conditions GC Conditions: Column: Rxi‐624Sil MS 30m x 0.25mm x 1.4µm (cat# 13868) Carrier: He @ 80cm/sec (4.95mL/min, 33.3 psi @ 35°C), constant linear velocity Inlet: Shimadzu HS‐20 transfer line/valve, 10:1 split Oven Program: 35°C (hold 1.5 min) to 300°C @ 30°C/min (hold 10 min) Headspace Conditions: Oven temp: 140°C Sample line temp: 160°C Transfer line temp: 160°C Shaking: off Multi injection count: 1 Pressurizing Gas Pressure: 25.0psi Equilibrating Time: 30.00 min Pressurizing time: 2.00 min Pressure Equilib Time: 0.10 min Load Time: 0.20 min Load Equilib Time: 0.10 min Injection Time: 1.00 min Needle Flush Time: 2.00 min GC Cycle Time: 32.00 min MS Parameters: Source Temp: 280°C Interface Temp: 310°C Solvent Cut Time: 0 min Micro scan width: 0µ Detector voltage (relative to tuning result): 0kV Threshold: 0 Scan program: 0.00 – 5.30 min, 20 – 150 m/z, event time= 0.20 sec
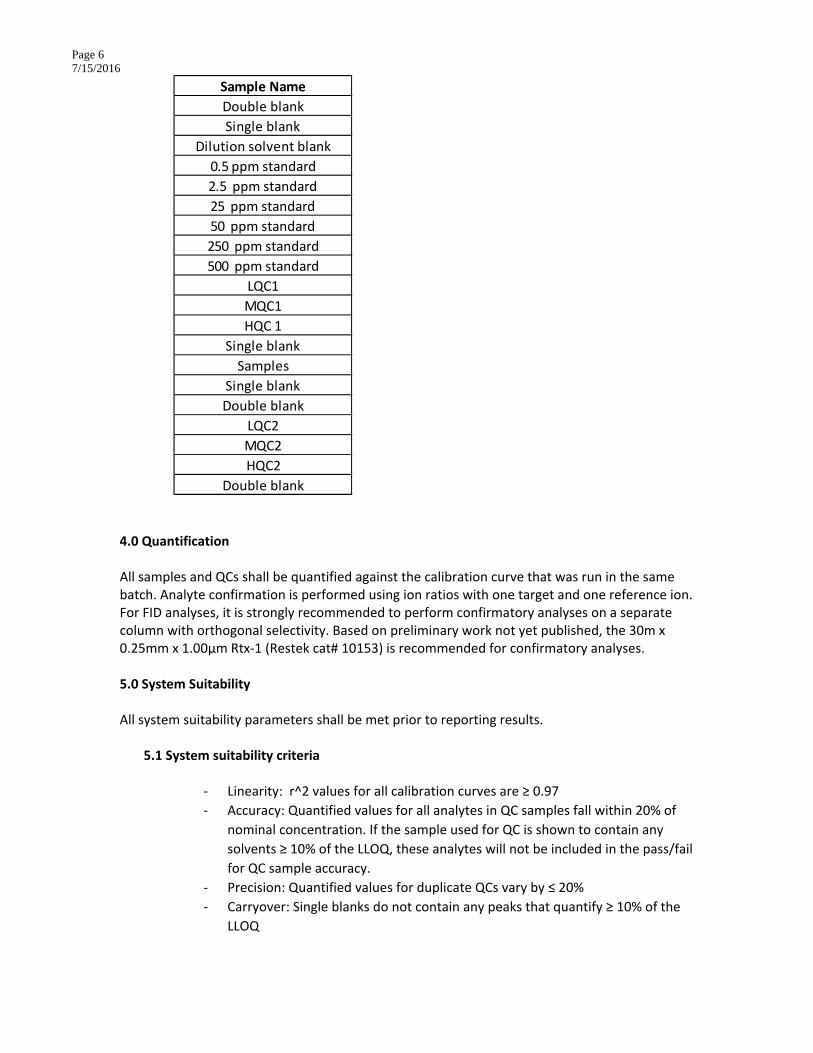
3.2 Batch Setup
The order of samples in the batch can be similar to this, although any order is acceptable.
Page 6 7/15/2016
4.0 Quantification All samples and QCs shall be quantified against the calibration curve that was run in the same batch. Analyte confirmation is performed using ion ratios with one target and one reference ion. For FID analyses, it is strongly recommended to perform confirmatory analyses on a separate column with orthogonal selectivity. Based on preliminary work not yet published, the 30m x 0.25mm x 1.00µm Rtx‐1 (Restek cat# 10153) is recommended for confirmatory analyses.
5.0 System Suitability All system suitability parameters shall be met prior to reporting results.
5.1 System suitability criteria
‐ Linearity: r^2 values for all calibration curves are ≥ 0.97
‐ Accuracy: Quantified values for all analytes in QC samples fall within 20% of
nominal concentration. If the sample used for QC is shown to contain any
solvents ≥ 10% of the LLOQ, these analytes will not be included in the pass/fail
for QC sample accuracy.
‐ Precision: Quantified values for duplicate QCs vary by ≤ 20%
‐ Carryover: Single blanks do not contain any peaks that quantify ≥ 10% of the
LLOQ
Sample Name
Double blank
Single blank
Dilution solvent blank
0.5 ppm standard
2.5 ppm standard
25 ppm standard
50 ppm standard
250 ppm standard
500 ppm standard
LQC1
MQC1
HQC 1
Single blank
Samples
Single blank
Double blank
LQC2
MQC2
HQC2
Double blank
Page 7 7/15/2016
‐ Dilution solvent cleanliness: Dilution solvent does not contain any peaks that
quantify ≥ 10% of the LLOQ
‐ All analyte ion ratios must fall within ±30 % of reference ratios from
calibrators. Due to the lack of usable fragments for many analytes, only one
qualifier ion was used during validation.
6.0 Report Samples ‐ Report only values that fall within the calibration curve. If an analyte
quantifies above/below the calibration curve, it will be reported as either
above (> ULOQ) or below (< LLOQ) the limit of quantification.
‐ If any other solvent is identified with a spectral similarity of > 90%, it may be
reported qualitatively for informational purposes only.
References:
1. Kolb, B; Ettre, L. Static Headspace‐Gas Chromatography: Theory and Practice, 2nd ed.;
John Wiley & Sons, Inc: Hoboken, NJ, 2006; p. 221 – 237.
For demonstration only. All parameters are suggestions.